Study on the influence of the viscosity reducer solution on percolation capacity of thin oil in ultra-low permeability reservoir
-
Chen Baoyu

 ,
Ma Wenguo
,
Wang Yueqi
,
Ma Wenguo
,
Wang Yueqi

Abstract
It is a new field to improve oil recovery by reducing the viscosity of thin oil in low permeability reservoir, which has a breakthrough significance for the development of low permeability oilfield. But, the oil increase effect of viscosity reducer (VR) solution on thin oil lacks the experimental data and theory support. The viscosity of ground degassed crude oil from the thin oil reservoir is 26.4 mPa s at 72°C. The feasibility of the application of VR solution in thin oil reservoir was analyzed through the experiment and test of viscosity reducing ability, percolation capacity, and displacement effect of VR solution. The oil–water ratio is 5:5, the VR concentration (C
VR) of oil–water dispersion (OWD) solution is 0.1%, and the viscosity reduction rate of VR solution reaches 92.4%. The maximum instantaneous injection pressure (P
max) of the VR solution injected with the C
VR of 0.1% is the lowest, which is 6.60 MPa, the P
max decreases by 0.83 MPa than the P
max in the basic water flooding experiment, the injection pressure in stable stage (P
min) decreases by 0.80 MPa. When the bound water saturation
Nomenclature
- VR
-
viscosity reducer
- OWD
-
oil–water dispersion solution
- SB
-
simulated brine
- TOW
-
treated oilfield wastewater
- C VR
-
VR concentration of solution, %
- K g
-
gas permeability, ×10−3 μm2
- K w
-
water permeability, ×10−3 μm2
- PV
-
pore volume multiple
- Φ
-
porosity, %
- s oi
-
originality oil saturation bound water saturation, %
- s wi
-
bound water saturation, %
- s or
-
remaining oil saturation, %
- P max
-
maximum instantaneous injection pressure, MPa
- P min
-
injection pressure in stable stage, MPa
-
-
water content, %
- E R,Water flooding
-
recovery rate of water flooding stage, %
- E R,final
-
final recovery rate, %
- ∆E R
-
increment of the final recovery rate than the recovery rate of water flooding stage, %
1 Introduction
The development of low-permeability oil and gas resources has become the main part of oil and gas resources production, these kinds of resources, about 8.0% of the world and 46.0% of China, are stored in low-permeability oil and gas reservoirs [1]. At the same time, among the new oil and gas resources, low-permeability reservoirs account for 60.0–70.0%, the oil and gas development of low-permeability resources has a great significance to the world energy security [2]. Low permeability reservoir has poor physical properties and complex pore structure. Zhang et al. indicated that the dual-phase flow of oil/water in the low permeability reservoir is non-Darcy flow. The seepage resistance is large during water flooding development, resulting in slow pressure conduction [3,4].
There are many factors that affect oil–water flow ability, including oil–water relative permeability, fluid viscosity, wettability, capillary force, and so on. Based on the experimental and computational observations, Fulcher Jr indicated that the oil relative permeability is a function of the interfacial tension and the viscosity variables individually rather than a function of the capillary number. The brine relative permeability behaved as a function of the capillary number [5]. Nevmerzhitskiy, using integral equation method, studied a one-dimensional isothermal problem of single-phase non-Darcy flow in plane radial flow with constant bottom hole pressure. The analytical solution of the relationship between the threshold pressure gradient and flow rate is established in low permeability reservoir [6]. However, the definite relationship between reservoir parameters of low permeability reservoir and the threshold pressure gradient has not been established, and different low permeability reservoirs need to be tested separately to determine the threshold pressure gradient. Zhao et al. assumed that under the condition of single permeability and water content in the seepage process, the pseudo-starting pressure gradient of each phase of the two-phase low-speed non-Darcy seepage was equal, and established a method for evaluating the oil–water flow ability of the low permeability reservoir including the starting pressure. At the same time, based on the data of oil–water two-phase capillary pressure curve converted from the mercury removal curve of ultra-low permeability rock sample, the capillary pressure in the water content range studied in the flow ability is generally less than 0.1 MPa, which is far lower than the displacement pressure difference in the ultra-low permeability displacement experiment. Therefore, the model used to study ultra-low permeability core displacement can ignore the capillary pressure [7].
The development of low permeability reservoir is limited by the upper limit of injection pressure and the threshold pressure gradient. Fracturing technology can increase the seepage area of low permeability reservoir, increase the suction capacity of low permeability reservoir, and reduce the injection pressure [8]. Reducing the viscosity of injected fluid and reducing the resistance of fluid flow in the reservoir can reduce the pressure gradient of low permeability reservoir and ensure the effective injection and flow of fluid. In low permeability reservoirs, CO2 injection can effectively improve the displacement effect under constant injection pressure. However, due to the influence of structural factors, the effect of CO2 injection in real reservoirs will be reduced compared with that in laboratory simulation experiments [9]. Few researchers studied the effect of surfactant velocity on displacement effect for ultra-low permeability reservoirs of heavy oil with high viscosity, and concluded that in order to achieve a better effect of reducing pressure and increasing injection, it is necessary to appropriately reduce injection velocity [10,11,12]. Reducing the viscosity of crude oil can reduce the seepage resistance and is an effective method to enhance oil recovery. Torabi’s experimental results showed that both water and oil relative permeabilities increase when temperature increases, and the relative permeabilities of both oil and water increase with decrease in oil viscosity [13]. Wang et al. used aquathermolysis technology to achieve in situ upgrading and viscosity reduction of heavy oil under reservoir conditions, enhance the percolation capacity of heavy oil in the reservoir, and improve the development effect of heavy oil reservoirs [14]. On the basis of physical simulation experiment and steam-assisted gravity drainage (SAGD), heavy oil thermal recovery technology, Songyan et al. implemented diethyl ether assisted SAGD technology, which made up for the problem of large steam chamber heat loss, ensured the effective reduction in crude oil viscosity, obtained higher spread efficiency in development, and further improved recovery efficiency [15]. In 2008, Bryan et al. carried out alkaline surfactant flooding for heavy oil with high viscosity. By conducting nuclear magnetic resonance detection on the core of the displacement experiment, they studied the influence of pressure change during emulsion injection and the improvement of oil displacement efficiency [16]. In 2011, Alagic et al. studied the effect of low salinity injection system on oil displacement efficiency, and proved that low salinity is conducive to improving the oil displacement effect of surfactant system [17]. Feng et al. evaluated a biological nano-oil displacement system, it can improve the sweep coefficient and oil displacement efficiency by the viscosity reduction in offshore medium and low-permeability reservoirs [18]. At present, there are no relevant reports about the development results of common crude oil in ultra-low permeability reservoir.
In this study, the temperature stability, the salt stability and the ability of viscosity reducer (VR) solutions to reduce viscosity were studied. The percolation capacity of the oil–water dispersion (OWD) solution after injection of VR was studied. The method of injecting (VR) to reduce the viscosity of thin oil can change the percolation capacity of the fluid, which is of great significance to enhance oil recovery in ultra-low permeability reservoirs.
2 Testing of experimental fluid properties
2.1 Experimental instruments
The experimental instruments used are Brook Field DV-II + Pro type rotary viscometer, the viscosity data of all figures and tables are the average of three test results, the temperature fluctuation range during the test was 0.5°C; thermostat; pressure piston vessel; pressure sensor; ISCO piston pump (model 260D, flow error less than 2.5 × 10⁻⁴ mL/min, pressure error less than ±0.5%); vacuum pump; and electronic balance.
2.2 Testing of basic properties of experimental fluids
There are two kinds of water used in the experiment. The simulated brine (TSB) is configured with a salinity of 6054.99 mg/L according to the mineral composition of the formation water, the ionic composition is shown in Table 1. The viscosity of simulated brine is 0.30 mPa s, the quality content of each mineral component in the simulated brine is shown in Table 2. The simulated brine is used for saturated cores and salt resistance experiment of VR solution. Another type of water is the treated oilfield wastewater (TOW) used for percolation capacity experiments and VR solution configuration, the viscosity of TOW is 0.35 mPa s at 72°C (reservoir temperature). The viscosity–temperature relationship between the two kinds of water is shown in Figure 1.
Formation water ionic components data
| Anion (mg/L) | Cation (mg/L) | Total salinity (mg/L) | pH | Water type | |||||
|---|---|---|---|---|---|---|---|---|---|
|
|
|
Cl− |
|
K+ + Na+ | Mg2+ | Ca2+ | 6054.99 | 6.5 | CaCl2 |
| 183.06 | 0 | 3367.75 | 204.13 | 215.43 | 21.27 | 2063.35 | |||
Mineral mass content per liter of formation water
| Content (mg/L) | ||||||
|---|---|---|---|---|---|---|
| MgSO4 | Na2SO4 | CaCl2 | NaHCO3 | KCl | NaCl | Total salinity (mg/L) |
| 106.4 | 176.1 | 5525.8 | 252.1 | 5.1 | 20.0 | 6085.5 |
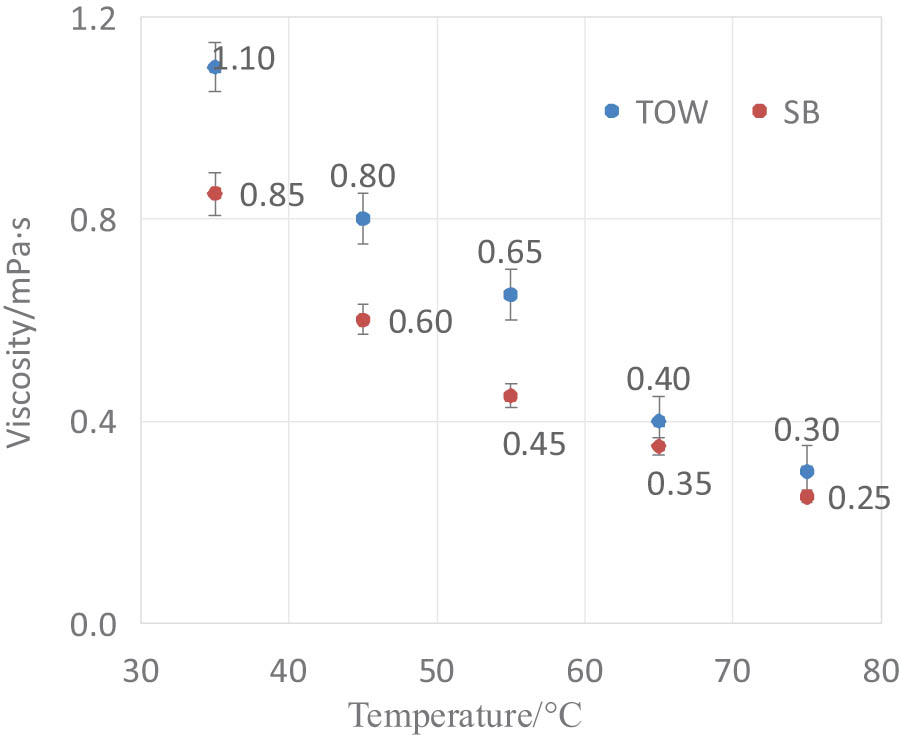
Viscosity–temperature relationship curve of TOW and TSB.
The viscosity of degassed crude oil provided by Daqing oilfield was tested by using Brook Field DV-II+Pro rotary viscometer in the laboratory at a temperature range of 50.0–75.0°C, the viscosity at different temperatures is shown in Figure 2. At 72°C (reservoir temperature), the viscosity of ground degassed crude oil is 26.4 mPa s. A simulated oil with a viscosity of 18.0 mPa s configured for kerosene and degassed crude oil was used for laboratory experiments.

Viscosity–temperature relationship curve of degassed crude oil.
2.3 Testing of viscosity–temperature relationship of the VR solutions
The VR is provided by Daqing Oilfield, the VR solutions are configured using the TOW, and the VR concentration of solution (C VR) is 0.3%. The viscosity of VR solution was detected at five temperature points of 35, 45, 55, 65, and 75°C. The test results are shown in Figure 3, indicating that the viscosity of the five VR solutions decreased with the increase in temperature, and the No. 5 solution decreased the most.

Viscosity–temperature relationship curve of the VR solutions (C VR = 0.3%).
2.4 Time stability test of the VR solutions
The TOW and VR were used to configure the VR solutions for the test experiments, and the C VR is 0.3%. The VR solutions were placed at 72.0°C environment, at 0, 1, 3, 7, 30, and 60 days. The viscosity value of the VR solutions were tested with time stability, the results are shown in Figure 4, the viscosity of the VR solutions are stable at the formation temperature.

Viscosity stability experiment results of VR solution under 72°C.
2.5 Salt resistance test of VR solutions
Using the TOW to configure the VR solutions for the test experiments, the C VR is 0.3 %. The testing solutions are mixed by the VR solutions and the TSB according to the volume ratio of 1:1 for the salt resistance test of the VR solution. Under the formation temperature of 72.0°C, the viscosity of the testing solutions are tested on days 0, 1, 3, and 7. The results are shown in Figure 5. There is no change in the viscosities of the five VR solutions, and the salt resistance the VR solution is good.

The viscosity of the VR solutions in formation brine environment at 72.0°C.
3 Detection of viscosity reducing ability
3.1 Experiments of viscosity reducing ability of different VR solutions
At 72°C, at a dispersion rate of 9,000 rpm, the OWD solution with different VRs was configured according to the oil–water ratio of 1:1 using the crude oil of well Chao111-Yang65. The viscosity of ground degassed crude oil is 26.4 mPa s. The VR concentration of OWD solution (C VR) is 0.15%, and the viscosity of the OWD solution was measured. The viscosity reduction rate (f) experiment results are shown in Table 3 and Figure 6.
Viscosity reduction rate and viscosity of OWD solution with different VRs
| VR no. | Oil–water ratio | C VR (%) | Viscosity (mPa s) | f (%) |
|---|---|---|---|---|
| 1 | 1:1 | 0.15 | 7.1 | 73.1 |
| 2 | 4.1 | 84.5 | ||
| 3 | 10.5 | 60.3 | ||
| 4 | 12.4 | 53.0 | ||
| 5 | 9.8 | 62.9 |

Viscosity reduction rate of OWD solution with different VRs.
The calculation formula of viscosity reduction rate is
where
The reducer ability experiment results of different VR solutions show that the viscosity reduction effect of No. 2 VR is the best one, and the viscosity reduction rate is 84.5%.
3.2 Effect of No. 2 VR concentration on viscosity reduction rate
At 72°C, the OWD solution with the oil–water ratio of 5:5, 7:3, 8:2, and 9:1 was configured using TOW and No. 2 VR solution. The viscosity of ground degassed crude oil is 26.4 mPa s. Under the same oil–water ratio condition, the C VR of OWD solution was changed to 0.05, 0.1, 0.15, 0.2, 0.25, and 0.5%, and the viscosity reduction rate was determined. The viscosity reduction rate experiment results are show in Table 4 and Figure 7.
Viscosity of OWD solution with different C VR
| C VR (%) | Oil–water ratio | |||||||
|---|---|---|---|---|---|---|---|---|
| 5:5 | 7:3 | 8:2 | 9:1 | |||||
| Viscosity (mPa·s) | f (%) | Viscosity (mPa·s) | f (%) | Viscosity (mPa·s) | f (%) | Viscosity (mPa·s) | f (%) | |
| 0 | 35.2 | −75.7 | 35.6 | −34.9 | 37.8 | −43.2 | 36.3 | −37.5 |
| 0.05 | 3.7 | 86.0 | 32.7 | −23.9 | 37.2 | −40.9 | 31.8 | −20.5 |
| 0.10 | 2.0 | 92.4 | 30.4 | −15.2 | 37.4 | −41.7 | 29.4 | −11.4 |
| 0.15 | 4.1 | 84.5 | 29.7 | −12.5 | 37.6 | −42.4 | 30.7 | −16.3 |
| 0.20 | 4.5 | 83.0 | 27.9 | −5.7 | 36.9 | −39.8 | 32.1 | −21.6 |
| 0.25 | 4.4 | 83.3 | 29.3 | −11.0 | 37.6 | −42.4 | 33.6 | −27.3 |
| 0.50 | 8.2 | 68.9 | 35.6 | −34.9 | 37.8 | −43.2 | 36.3 | −37.5 |

The Viscosity reduction ratio of OWD solution with different C VR.
Table 3 and Figure 11 show the experiment results of the influence of the C VR of No. 2 VR on the viscosity reduction rate in different OWD solutions. Among them, the viscosity reduction rate of OWD solution (the oil–water ratio is 5:5, and the C VR is 0.1%) is the highest, which is 92.42%.
3.3 Effect of oil–water ratio on viscosity reduction rate of No. 2 VR
At 72°C, the OWD solution with different oil–water ratios were configured using TOW and No. 2 VR solution, the C VR of OWD solution is 0.1%. The viscosity reduction rate experiment results are shown in Table 5 and Figure 8.
Viscosity of OWD solution with different oil–water ratios
| Oil–water ratio | Viscosity (mPa s) | f (%) |
|---|---|---|
| 9:1 | 31.8 | −20.5 |
| 8:2 | 37.2 | −40.9 |
| 7:3 | 32.7 | −23.9 |
| 6:4 | 14.7 | 44.3 |
| 5:5 | 2.0 | 92.4 |

The viscosity reduction rate of No. 2 VR with different oil–water ratios.
The results of viscosity reduction of the OWD solution with different oil–water ratios show that there is no viscosity reduction when the oil–water ratio is 9:1 to 7:3. When the oil–water ratio decreases from 6:4 to 5:5, the viscosity reduction effect of the OWD solution becomes better with the decrease in the oil–water ratio. Test results show that the more thin oil the viscosity reduction agent contacts, the better the viscosity reduction effect.
4 Natural core percolation capacity experiments
4.1 Experimental procedures and principles
The VR solutions configured using the TOW and the simulated oil (its viscosity is 18.0 mPa s) configured with kerosene and ground degassed crude oil were used for the flow experiments. Measure the length, diameter and dry weight of the natural core to prepare for the calculation of core porosity; vacuum pumping saturated formation water with 12.0 h, the core mass after saturated water is weighed, and the core mass increment after saturation is the saturated water amount, and the core porosity is calculated. Under the confining pressure of 4.0 MPa, the simulated formation water was injected at the rate of 0.3, 0.5, and 0.7 mL/min, and the pressure at the injection end was recorded, and the permeability of the core water was calculated. Under the condition of confining pressure 4.0 MPa (monitoring the pressure at the injection end at any time, keeping the confining pressure higher than the injection pressure 2.0 MPa), the simulated oil viscosity was 18 mPa s, and the constant displacement speed of 0.05 mL/min was used to saturate the oil until no water was produced at all, the injection pressure data were recorded and the oil saturation was calculated. At a temperature of 72°C, experimental research was carried out on the influence of VR solution injection on the fluid percolation capacity in the reservoir, and the injection pressure of water flooding was recorded during the basic water flooding experiment. In the comparison flow experiment, 0.1PV of VR solution was injected before water flooding and then water flooding was carried out. The injection pressure of each stage was detected until the pressure was stable and the experiment was stopped. In the injection capacity comparison experiment, the C VR of OWD solution in each scheme is 0.05, 0.08, 0.10, 0.20, and 0.50%, respectively. According to the criteria for judging whether the terminal effect has an impact in “Test method for Two-phase relative permeability in rock” (GB/T28912-2012) [19], regarding the condition of oil–water two-phase seepage, the injection speed of both the VR solution and the water solution was 0.05 mL/min, the influence of the terminal effect can be ignored.
4.2 Natural core parameters
The natural core of extremely low permeability layer in Yang 1 oil formation was selected to carry out the flow experiment for studying the influences of the VR solutions on the percolation capacity. The natural core parameters are shown in Table 6.
Percolation capacity experiment scheme natural core parameters
| Core number | Length (cm) | Diameter (cm) | K g (×10−3 μm2) | K w (×10−3 μm2) | PV (cm3) | Φ (%) |
|---|---|---|---|---|---|---|
| 949-4 | 6.51 | 2.53 | 2.95 | 0.54 | 4.82 | 14.8 |
| 109-10 | 6.41 | 2.53 | 2.90 | 0.55 | 4.81 | 15.0 |
4.3 Percolation capacity experiment results and discussion
Two natural cores from Yang 1 reservoir, numbered 949-4 and 109-10, respectively, were selected to carry out an injection change ability evaluation experiment. Core parameters are shown in Table 6. Core 949-4 is used to carry out flow experiment of basic water flooding (the concentration of VR solution is 0%). After the experiment, the fluid in the core is cleaned, the porosity and permeability of the core are checked after drying, and then the influence of VR solutions on fluid percolation capacity is carried out. Core 949-4 was used to carry out percolation capacity experiments with VR solution concentrations of 0.0, 0.8, and 2.0%. Core 109-10 was used to carry out percolation capacity experiments with viscosity reducing agent concentrations of 0.5, 1.0, and 5.0%. The results of percolation capacity experiments with different C VR using natural core from Yang 1 reservoir are shown in Table 7 and Figure 9.
Experimental data of water flooding injection capacity of Yang 1 natural core
| C VR (%) | Φ (%) | K w (×10−3 μm2) | S oi (%) | S or (%) | P max (MPa) | ∆P max (MPa) | P min (MPa) | ∆P min (MPa) |
|---|---|---|---|---|---|---|---|---|
| 0 | 14.7 | 0.54 | 58.1 | 39.0 | 7.43 | 0.00 | 4.90 | 0.00 |
| 0.05 | 14.9 | 0.55 | 58.5 | 37.6 | 7.18 | 0.25 | 4.68 | 0.22 |
| 0.08 | 15.0 | 0.53 | 57.5 | 33.9 | 6.85 | 0.58 | 4.26 | 0.64 |
| 0.10 | 15.1 | 0.56 | 58.5 | 31.4 | 6.60 | 0.83 | 4.10 | 0.8 |
| 0.20 | 15.0 | 0.53 | 59.3 | 33.7 | 6.72 | 0.71 | 4.24 | 0.66 |
| 0.50 | 14.9 | 0.58 | 59.2 | 34.1 | 6.74 | 0.69 | 4.25 | 0.65 |

The P max and P min of Yang 1 of natural core by injection VR solution with different C VR.
The injection capacity of basic water flooding (C VR is 0.0%) experimental result shows that the maximum instantaneous injection pressure (P max) reaches the highest value of 7.43 MPa in the process of water flooding. The injection pressure in stable stage (P min) is 4.90 MPa in the later stage of injection. The P max of water flooding after the VR solution injected is lower than the P max of basic water flooding experiment. The P max of the VR solution injected with the C VR of 0.10% is the lowest, which is 6.60 MPa, the P max decreases by 0.83 MPa than the P max in the basic water flooding experiment, the iP min decreases by 0.80 MPa, the fluid percolation capacity in reservoir becomes stronger after the injection of VR solution.
In the percolation capacity experiment of Yang1 natural core, after the injection of VR, with the increase in VR concentration in the injection system, the instantaneous maximum pressure of subsequent fluid seepage and the pressure in the final stability stage both showed a trend of decreasing first and then stabilizing, indicating that the fluid percolation capacity in the core pores was enhanced under the action of VR.
5 Influence of VR solution on oil displacement experiments in different water saturation
(
s
w
)
5.1 Experimental procedures and principles
In order to study the influence of VR solution on the oil displacement effect, the oil displacement experiments were carried out by injecting VR solution under different core water saturation
The four experimental schemes are as follows: Scheme 1: Artificial core 1 was used to carry out conventional water flooding, and the experiment was ended when the water content
The
where
5.2 Artificial core parameters
Four square artificial cores with a length of 80 cm and an end face length of 4.5 cm were selected to carry out the oil displacement experiment. The core parameters and experimental scheme are shown in Table 8.
Experiment scheme and natural core parameters
| Scheme | Core number | Width × height × length (cm) | K g (×10−3 μm2) | K w (×10−3 μm2) | Pore volume (cm3) | Φ (%) | Experimental scheme |
|---|---|---|---|---|---|---|---|
| 1 | 16B-1 | 4.5 × 4.5 × 80 | 9.00 | 3.74 | 220.32 | 13.6 | Water flooding |
| 2 | 21B-3 | 4.5 × 4.5 × 80 | 12.10 | 4.00 | 237.82 | 14.7 | Water flooding, f w = 0.0% + 0.2PV VR + water flooding |
| 3 | 16A-3 | 4.5 × 4.5 × 80 | 8.90 | 3.76 | 225.18 | 13.9 | Water flooding, f w = 50.0% + 0.2PV VR + water flooding |
| 4 | 15A-3 | 4.5 × 4.5 × 80 | 9.20 | 3.62 | 231.98 | 14.3 | Water flooding, f w = 90.0% + 0.2PV VR + water flooding |
5.3 Influence of
s
w
on VR solutions oil displacement experiment results and discussion
The experimental results of different

Experimental characteristic curve.
The experimental results show that with the same amount of VR solution, the earlier the injection time of VR solution, the higher the E
R,final. The best injection timing is when the
It can be seen from Table 9 and Figure 10 that the maximum injection pressure of basic water flooding is 11.42 MPa in Scheme 1. In Scheme 2, the VR solution is directly injected before water flooding. During the flooding process, the maximum injection pressure of the core is the smallest, which is 9.74 MPa. In Schemes 3 and 4, when the
Influence of
| Scheme | Core number | s wi (%) | f w (%) | S w(fw) (%) | s or (%) | P max (MPa) | E R,Water flooding (%) | E R,final (%) | ∆E R (%) |
|---|---|---|---|---|---|---|---|---|---|
| 1 | 16B-1 | 40.7 | 0.0 | 40.7 | 43.5 | 11.4 | 26.5 | 26.5 | 0 |
| 2 | 21B-3 | 41.1 | 0.0 | 41.1 | 33.9 | 9.7 | — | 42.5 | 16.0 |
| 3 | 16A-3 | 41.6 | 50.0 | 54.6 | 35.8 | 10.9 | 14.7 | 38.7 | 12.1 |
| 4 | 15A-3 | 39.4 | 90.0 | 59.8 | 38.6 | 11.3 | 24.7 | 36.2 | 9.7 |

Curves of recovery degree of different schemes.
The
According to formula (2), the

Relationship between water content and core water saturation.
In scheme 1, the
In Scheme 2, the
In Schemes 3 and 4, VR solution is injected when the
The research surface shows that the lower the
6 Conclusion
The method of the VR solution used in the thin oil can change the percolation capacity of fluid in Ultra-low Permeability Reservoir and enhance oil recovery of thin oil in the low permeability reservoir.
With the increase in oil–water ratio, the ability of VR solutions to reduce viscosity decreases. With the increase in VR concentration (C VR) in the solution, the viscosity reducing effect becomes better first, and then becomes worse. The C VR with the best viscosity reducing effect is 0.10%, and the viscosity reduction rate reaches 92.4%.
With the increase in C VR in solution, the decreases of maximum instantaneous injection pressure (P max) and injection pressure in stable stage (P min) first increased and then decreased, while the C VR was 0.10%, they were reduced to 0.83 MPa and 0.80 MPa, respectively, and the oil–water fluid flow capacity was enhanced after injection of VR solution.
The injection of VR solution increased the oil recovery rate (E
R,final), and the injection of VR solution before water flooding had the best oil increase effect, reaching 42.5%. In the process of water flooding, the oil increase effect of injecting VR solution will gradually deteriorate with the increase in water cut
Acknowledgments
The authors extend their appreciation to Key Laboratory for Enhanced Oil & Gas Recovery of the Ministry of Education, Northeast Petroleum University.
-
Funding information: Authors state no funding involved.
-
Author contributions: Conceptualization, original draft writing, reviewing, and editing: Chen Baoyu, Zhang Jicheng, and Ma Wenguo. Formal analysis, funding acquisition, reviewing, experiments, tests, and editing: Chen Baoyu, Ma Wenguo, Wang Yueqi, Liu Xuan, and Pan Tianchen. Resources, data validation, data curation, and supervision: Chen Baoyu, Zhang Jicheng, and Liu Xuan.
-
Conflict of interest: The authors declare no potential conflicts of interest concerning the research, authorship, and/or publication of this article.
-
Ethical approval: The conducted research is not related to either human or animal use.
-
Data availability statement: Data will be available upon request from the corresponding author.
References
[1] Hu W, Wei Y, Bao J. Development of the theory and technology for low permeability reservoirs in China. Pet Explor Dev. 2018;45(4):685–97.10.1016/S1876-3804(18)30072-7Search in Google Scholar
[2] Jia C, Wang Z, Jiang L, Meng Y. Achievements and future potential for oil & gas exploration and development in China: Deep-formation, deep-water and unconventional reservoirs—Interview with JIA Chengzao, Academician of the CAS, geologist in petroleum geology and structure. World Pet Ind. 2023;30(3):1–8.Search in Google Scholar
[3] Zhang W. Technology of water injection development in ultra-low permeability reservoir. IOP Conf Ser: Earth Environ Sci. 2020;558(2):022001.10.1088/1755-1315/558/2/022001Search in Google Scholar
[4] Liu JJ, Liu XG, Hu YR. Study on nonlinear seepage of rock of low permeability. Chin J Rock Mech Eng. 2003;4:556–61.Search in Google Scholar
[5] Fulcher RA, Jr, Ertekin T, Stahl CD. Effect of capillary number and its constituents on two-phase relative permeability curves. J Pet Technol. 1985;37:249–60.10.2118/12170-PASearch in Google Scholar
[6] Nevmerzhitskiy Y. Development of production decline curves for non-Darcy oil flow in low-permeability reservoirs. J Pet Sci Eng. 2022;218:111039.10.1016/j.petrol.2022.111039Search in Google Scholar
[7] Zhao G, Dong D, Xiao L. Calculation of two-phase relative permeability curves based on a low-velocity non-Darcy flow model. Pet Geol Recov Effic. 2022;29(2):69–76.Search in Google Scholar
[8] Shakib TJ, Akhgarian E, Ghaderi A. The effect of hydraulic fracture characteristics on production rate in thermal EOR methods. Fuel. 2015;141:226–35.10.1016/j.fuel.2014.10.063Search in Google Scholar
[9] Zhou X, Yuan Q, Zhang Y, Wang H, Zeng F, Zhang L. Performance evaluation of CO2 flooding process in tight oil reservoir via experimental and numerical simulation studies. Fuel. 2019;236:730–46.10.1016/j.fuel.2018.09.035Search in Google Scholar
[10] Wang N. Study on the mechanism of surfactant depressurization and injection enhancement in ultra-low permeability reservoir. East China: China University of Petroleum; 2018.Search in Google Scholar
[11] Liu C, Wang Y, Yu H. The laboratory study on surfactant flooding system for low permeable reservoir. Chem Eng Oil Gas. 2011;40(5):486–9.Search in Google Scholar
[12] Zhang J, Jiang T, Fan J, Yan Z. Optimization of W5 fault block surface-active polymer flooding scheme. Pet Sci Technol. 2020;38(5):472–7.10.1080/10916466.2020.1767131Search in Google Scholar
[13] Torabi F, Mosavat N, Zarivnyy O. Predicting heavy oil/water relative permeability using modified Corey-based correlations. Fuel. 2016;163:196–204.10.1016/j.fuel.2015.09.035Search in Google Scholar
[14] Wang JW, Tang XD, Li JJ, Guo EP, Guan WL, Jiang YW. Quartz sand proppant loaded with Ni and Mo for in-situ aquathermolysis of heavy oil. Fuel. 2021;306:121653.10.1016/j.fuel.2021.121653Search in Google Scholar
[15] Li SY, Peng DL, Feng SB, Wang ZJ, Zhang KQ. Dimethyl ether-steam assisted gravity drainage: Physical 2D heavy oil simulation. Fuel. 2023;342:127821.10.1016/j.fuel.2023.127821Search in Google Scholar
[16] Bryan J, An M, Kantzas A. Investigation into the processes responsible for heavy oil recovery by alkali-surfactant flooding. SPE 113993. 2008.10.2118/113993-MSSearch in Google Scholar
[17] Alagic E, Spildo K, Skauge A, Solbakken J. Effect of crude oil ageing on low salinity and low salinity surfactant flooding. J Pet Sci Eng. 2011;78(2):220–7.10.1016/j.petrol.2011.06.021Search in Google Scholar
[18] Feng Q, Zhou J, Li S, Chen X, Sun Y, Zhang X, et al. Research on characterization technology and field test of biological nano-oil displacement in offshore medium- and low-permeability reservoirs. ACS Omega. 2022;7(44):40132–44.10.1021/acsomega.2c04960Search in Google Scholar PubMed PubMed Central
[19] GB/T28912-2012. Test method for Two-phase relative permeability in rock. National Standardization Administration of China; November 5th, 2011. http://c.gb688.cn/bzgk/gb/showGb?type=online&hcno=42F52A36DD6B7F7E1FA873A0048FD0BD.Search in Google Scholar
© 2025 the author(s), published by De Gruyter
This work is licensed under the Creative Commons Attribution 4.0 International License.
Articles in the same Issue
- Research Articles
- Phytochemical investigation and evaluation of antioxidant and antidiabetic activities in aqueous extracts of Cedrus atlantica
- Influence of B4C addition on the tribological properties of bronze matrix brake pad materials
- Discovery of the bacterial HslV protease activators as lead molecules with novel mode of action
- Characterization of volatile flavor compounds of cigar with different aging conditions by headspace–gas chromatography–ion mobility spectrometry
- Effective remediation of organic pollutant using Musa acuminata peel extract-assisted iron oxide nanoparticles
- Analysis and health risk assessment of toxic elements in traditional herbal tea infusions
- Cadmium exposure in marine crabs from Jiaxing City, China: Insights into health risk assessment
- Green-synthesized silver nanoparticles of Cinnamomum zeylanicum and their biological activities
- Tetraclinis articulata (Vahl) Mast., Mentha pulegium L., and Thymus zygis L. essential oils: Chemical composition, antioxidant and antifungal properties against postharvest fungal diseases of apple, and in vitro, in vivo, and in silico investigation
- Exploration of plant alkaloids as potential inhibitors of HIV–CD4 binding: Insight into comprehensive in silico approaches
- Recovery of phenylethyl alcohol from aqueous solution by batch adsorption
- Electrochemical approach for monitoring the catalytic action of immobilized catalase
- Green synthesis of ZIF-8 for selective adsorption of dyes in water purification
- Optimization of the conditions for the preparation of povidone iodine using the response surface methodology
- A case study on the influence of soil amendment on ginger oil’s physicochemical properties, mineral contents, microbial load, and HPLC determination of its vitamin level
- Removal of antiviral favipiravir from wastewater using biochar produced from hazelnut shells
- Effect of biochar and soil amendment on bacterial community composition in the root soil and fruit of tomato under greenhouse conditions
- Bioremediation of malachite green dye using Sargassum wightii seaweed and its biological and physicochemical characterization
- Evaluation of natural compounds as folate biosynthesis inhibitors in Mycobacterium leprae using docking, ADMET analysis, and molecular dynamics simulation
- Novel insecticidal properties of bioactive zoochemicals extracted from sea urchin Salmacis virgulata
- Elevational gradients shape total phenolic content and bioactive potential of sweet marjoram (Origanum majorana L.): A comparative study across altitudinal zones
- Study on the CO2 absorption performance of deep eutectic solvents formed by superbase DBN and weak acid diethylene glycol
- Preparation and wastewater treatment performance of zeolite-modified ecological concrete
- Multifunctional chitosan nanoparticles: Zn2+ adsorption, antimicrobial activity, and promotion of aquatic health
- Comparative analysis of nutritional composition and bioactive properties of Chlorella vulgaris and Arthrospira platensis: Implications for functional foods and dietary supplements
- Growth kinetics and mechanical characterization of boride layers formed on Ti6Al4V
- Enhancement of water absorption properties of potassium polyacrylate-based hydrogels in CaCl2-rich soils using potassium di- and tri-carboxylate salts
- Electrochemical and microbiological effects of dumpsite leachates on soil and air quality
- Modeling benzene physicochemical properties using Zagreb upsilon indices
- Characterization and ecological risk assessment of toxic metals in mangrove sediments near Langen Village in Tieshan Bay of Beibu Gulf, China
- Protective effect of Helicteres isora, an efficient candidate on hepatorenal toxicity and management of diabetes in animal models
- Valorization of Juglans regia L. (Walnut) green husk from Jordan: Analysis of fatty acids, phenolics, antioxidant, and cytotoxic activities
- Molecular docking and dynamics simulations of bioactive terpenes from Catharanthus roseus essential oil targeting breast cancer
- Selection of a dam site by using AHP and VIKOR: The Sakarya Basin
- Characterization and modeling of kidney bean shell biochar as adsorbent for caffeine removal from aquatic environments
- The effects of short-term and long-term 2100 MHz radiofrequency radiation on adult rat auditory brainstem response
- Biochemical insights into the anthelmintic and anti-inflammatory potential of sea cucumber extract: In vitro and in silico approaches
- Resveratrol-derived MDM2 inhibitors: Synthesis, characterization, and biological evaluation against MDM2 and HCT-116 cells
- Phytochemical constituents, in vitro antibacterial activity, and computational studies of Sudanese Musa acuminate Colla fruit peel hydro-ethanol extract
- Chemical composition of essential oils reviewed from the height of Cajuput (Melaleuca leucadendron) plantations in Buru Island and Seram Island, Maluku, Indonesia
- Phytochemical analysis and antioxidant activity of Azadirachta indica A. Juss from the Republic of Chad: in vitro and in silico studies
- Stability studies of titanium–carboxylate complexes: A multi-method computational approach
- Efficient adsorption performance of an alginate-based dental material for uranium(vi) removal
- Synthesis and characterization of the Co(ii), Ni(ii), and Cu(ii) complexes with a 1,2,4-triazine derivative ligand
- Evaluation of the impact of music on antioxidant mechanisms and survival in salt-stressed goldfish
- Optimization and validation of UPLC method for dapagliflozin and candesartan cilexetil in an on-demand formulation: Analytical quality by design approach
- Biomass-based cellulose hydroxyapatite nanocomposites for the efficient sequestration of dyes: Kinetics, response surface methodology optimization, and reusability
- Multifunctional nitrogen and boron co-doped carbon dots: A fluorescent probe for Hg2+ and biothiol detection with bioimaging and antifungal applications
- Separation of sulphonamides on a C12-diol mixed-mode HPLC column and investigation of their retention mechanism
- Characterization and antioxidant activity of pectin from lemon peels
- Fast PFAS determination in honey by direct probe electrospray ionization tandem mass spectrometry: A health risk assessment insight
- Correlation study between GC–MS analysis of cigarette aroma compounds and sensory evaluation
- Synthesis, biological evaluation, and molecular docking studies of substituted chromone-2-carboxamide derivatives as anti-breast cancer agents
- The influence of feed space velocity and pressure on the cold flow properties of diesel fuel
- Acid etching behavior and mechanism in acid solution of iron components in basalt fibers
- Protective effect of green synthesized nanoceria on retinal oxidative stress and inflammation in streptozotocin-induced diabetic rat
- Evaluation of the antianxiety activity of green zinc nanoparticles mediated by Boswellia thurifera in albino mice by following the plus maze and light and dark exploration tests
- Yeast as an efficient and eco-friendly bifunctional porogen for biomass-derived nitrogen-doped carbon catalysts in the oxygen reduction reaction
- Novel descriptors for the prediction of molecular properties
- Synthesis and characterization of surfactants derived from phenolphthalein: In vivo and in silico studies of their antihyperlipidemic effect
- Turmeric oil-fortified nutraceutical-SNEDDS: An approach to boost therapeutic effectiveness of dapagliflozin during treatment of diabetic patients
- Analysis and study on volatile flavor compounds of three Yunnan cultivated cigars based on headspace-gas chromatography-ion mobility spectrometry
- Near-infrared IR780 dye-loaded poloxamer 407 micelles: Preparation and in vitro assessment of anticancer activity
- Study on the influence of the viscosity reducer solution on percolation capacity of thin oil in ultra-low permeability reservoir
- Detection method of Aristolochic acid I based on magnetic carrier Fe3O4 and gold nanoclusters
- Juglone’s apoptotic impact against eimeriosis-induced infection: a bioinformatics, in-silico, and in vivo approach
- Potential anticancer agents from genus Aerva based on tubulin targets: an in-silico integration of quantitative structure activity relationship (QSAR), molecular docking, simulation, drug-likeness, and density functional theory (DFT) analysis
- Hepatoprotective and PXR-modulating effects of Erodium guttatum extract in propiconazole-induced toxicity
- Studies on chemical composition of medicinal plants collected in natural locations in Ecuador
- A study of different pre-treatment methods for cigarettes and their aroma differences
- Cytotoxicity and molecular mechanisms of quercetin, gallic acid, and pinocembrin in Caco-2 cells: insights from cell viability assays, network pharmacology, and molecular docking
- Choline-based deep eutectic solvents for green extraction of oil from sour cherry seeds
- Green-synthesis of chromium (III) nanoparticles using garden fern and evaluation of its antibacterial and anticholinesterase activities
- Innovative functional mayonnaise formulations with watermelon seeds oil: evaluation of quality parameters and storage stability
- Molecular insights and biological evaluation of compounds isolated from Ferula oopoda against diabetes, advanced glycation end products and inflammation in diabetics
- Removal of cytotoxic tamoxifen from aqueous solutions using a geopolymer-based nepheline–cordierite adsorbent
- Unravelling the therapeutic effect of naturally occurring Bauhinia flavonoids against breast cancer: an integrated computational approach
- Characterization of organic arsenic residues in livestock and poultry meat and offal and consumption risks
- Synthesis and characterization of zinc sulfide nanoparticles and their genotoxic and cytotoxic effects on acute myeloid leukemia cells
- Activity of Coriandrum sativum methanolic leaf extracts against Eimeria papillata: a combined in vitro and in silico approach
- Special Issue on Advancing Sustainable Chemistry for a Greener Future
- One-pot fabrication of highly porous morphology of ferric oxide-ferric oxychloride/poly-O-chloroaniline nanocomposite seeded on poly-1H pyrrole: Photocathode for green hydrogen generation from natural and artificial seawater
- High-efficiency photocathode for green hydrogen generation from sanitation water using bismuthyl chloride/poly-o-chlorobenzeneamine nanocomposite
- Innovative synthesis of cobalt-based catalysts using ionic liquids and deep eutectic solvents: A minireview on electrocatalytic water splitting
- Special Issue on Phytochemicals, Biological and Toxicological Analysis of Plants
- Comparative analysis of fruit quality parameters and volatile compounds in commercially grown citrus cultivars
- Total phenolic, flavonoid, flavonol, and tannin contents as well as antioxidant and antiparasitic activities of aqueous methanol extract of Alhagi graecorum plant used in traditional medicine: Collected in Riyadh, Saudi Arabia
- Study on the pharmacological effects and active compounds of Apocynum venetum L.
- Chemical profile of Senna italica and Senna velutina seed and their pharmacological properties
- Essential oils from Brazilian plants: A literature analysis of anti-inflammatory and antimalarial properties and in silico validation
- Toxicological effects of green tea catechin extract on rat liver: Delineating safe and harmful doses
- Unlocking the potential of Trigonella foenum-graecum L. plant leaf extracts against diabetes-associated hypertension: A proof of concept by in silico studies