
Automatic detection and segmentation of adenomatous colorectal polyps during colonoscopy using Mask R-CNN
-
Jie Meng
 and
Kun Yang
and
Kun Yang

Abstract
Colorectal cancer (CRC) is one of the main alimentary tract system malignancies affecting people worldwide. Adenomatous polyps are precursors of CRC, and therefore, preventing the development of these lesions may also prevent subsequent malignancy. However, the adenoma detection rate (ADR), a measure of the ability of a colonoscopist to identify and remove precancerous colorectal polyps, varies significantly among endoscopists. Here, we attempt to use a convolutional neural network (CNN) to generate a unique computer-aided diagnosis (CAD) system by exploring in detail the multiple-scale performance of deep neural networks. We applied this system to 3,375 hand-labeled images from the screening colonoscopies of 1,197 patients; of whom, 3,045 were assigned to the training dataset and 330 to the testing dataset. The images were diagnosed simply as either an adenomatous or non-adenomatous polyp. When applied to the testing dataset, our CNN-CAD system achieved a mean average precision of 89.5%. We conclude that the proposed framework could increase the ADR and decrease the incidence of interval CRCs, although further validation through large multicenter trials is required.
1 Introduction
Colorectal cancer (CRC), also known as colon or bowel cancer, ranks at top 2 and 3 of the most commonly diagnosed cancers and high mortality cancers worldwide, respectively, including an estimated 1.8 million cases with 881,000 deaths reported in 2018 [1]. Previous clinical observational studies revealed multiple stages of CRC development [2] and found that most malignancies originated as adenomatous polyps [3,4]. Therefore, CRC prevention efforts have been directed at the early detection and subsequent removal of adenomatous polyps [5,6,7].
Various screening techniques are available for CRC detection. Of these, colonoscopy has become the most widely used [8] and is recommended as the test of choice in the American College of Gastroenterology CRC Screening Guidelines [9]. The primary indicator of colonoscopy quality is the colonoscopist’s adenoma detection rate (ADR), which reflects the ability to identify adenomas. The risk of post-colonoscopy CRC is correlated negatively with an endoscopist’s ADR, as demonstrated in a large Kaiser Permanente study wherein the risk of interval CRC decreased by 3–6% with every 1% increase in ADR [10]. The ADR is affected by both colonoscopist- and procedure-dependent factors, including the training level, cecal intubation rate, withdrawal time and bowel preparation quality [11]. Unfortunately, the actual use of ADR varies widely among colonoscopists who perform the screening procedures, with reported rates varying from 7 to 53% [12].
Computer-aided diagnosis (CAD) is a computer-based technology developed to reduce and streamline the workloads of clinicians and has been applied to breast cancer [13,14], brain tumors [15,16] and pulmonary nodules [17,18]. Moreover, artificial intelligence technology could potentially enable the automated detection of polyps during colonoscopy. Karkanis et al. [19] first proposed a CAD model for the detection of adenomatous polyps based on color and texture analyses. Subsequent studies further evaluated the usefulness of shape [20,21], spatio-temporal [22] and edge features [23]. However, these algorithms were based mainly on traditional machine learning techniques, which rely heavily on image preprocessing and subsequent feature extraction by human programmers.
Deep learning is a data-driven machine learning method and has markedly advanced the computer vision to the state-of-the-art. Compared with traditional machine learning strategies, the advantage of deep learning involves the capacity to learn features automatically from large training sets without informing the computer about unique features. Consequently, multiple frameworks that adopt deep convolutional neural networks (CNNs) have been used in polyp detection applications. For example, Li et al. [24] described the use of a deep learning model for polyp detection, although their system only achieved a less than ideal accuracy (86%) and sensitivity (73%). Byrne et al. [25] applied deep learning to the real-time recognition of neoplastic polyps from a colonoscopy video and achieved an accuracy of 83%. Zhang et al. [26] proposed a strategy for the transfer learning of CNN features from a non-medical to a medical domain and trained a standard support vector machine (SVM) classifier to perform polyp detection and classification. Using fully connected convolution networks, Brandao et al. [27] detected polyps in a publicly available colonoscopy dataset and achieved an intersection over union (IoU) of 47.78%. Although the above-listed algorithms can detect adenomatous colorectal polyps, they are hindered by the following major shortcomings. First, the performances were overfitting because the proposed methods were tuned to obtain the best possible accurate detection results for the corresponding publicly available datasets. Second, the sample sizes were small and did not enable the use of separate training and testing sets of essential labeled medical images. Third, these studies paid little attention to the accurate and objective diagnosis of adenoma which, as we mentioned above, is more important for CRC prevention.
In this study, we apply an improved algorithm based on deep neural networks to achieve the segmentation of specific adenomatous polyps on RGB images obtained via conventional white-light endoscopy. Our model can automatically extract multiple-scale features from lots of colonoscopy images, as well as construct hierarchical residual-like connections within one single residual block to improve the multiple-scale representation ability at a more granular level. The major contributions of this work are as follows: (1) our CAD-CNN system can extract automatically the colonoscopy image features, rather than extracting manually with extensive preprocessing; (2) we improved the Mask R-CNN [28] (particularly the backbone structure) by constructing hierarchical residual-like connections within one single residual block to improve the multiple-scale representation ability at a more granular level; (3) the proposed system is able to detect and segment adenomatous polyps from colonoscopy images and address the polyp detection task with a variable scale.
Using our model, we pretrained Mask R-CNN on a COCO dataset and appropriately fine-tuned the algorithm using manually labeled images from the videos of actual endoscopic colonoscopies performed at a single center. We then assessed the usefulness of our method on an adenoma dataset that was split into a training and a testing set. We demonstrated that our method achieved a better result than other state-of-the-art detection methods, with a mean average precision (mAP) of 89.5%.
2 Materials and method
2.1 Dataset
For our analysis, we collected a total of 50,230 colonoscopy images from the reported 1,197 patients who underwent colonoscopy examinations at the Affiliated Hospital of Hebei University, China, between June 2016 and March 2019. All colonoscopy reports described the detection of at least one adenomatous polyp that was confirmed by histology. All colonoscopy images containing adenomatous polyps were correctly labeled by colonoscopists. The set of 50,230 colonoscopy images contained 2,128 (4.24%) images of unique polyps of all sizes and morphologies and 48,120 (95.76%) images without polyps. We selected 3,375 hand-labeled images from the datasets and divided them into two sets. (1) The training set comprised 3,045 images, including 1,900 with polyps (62.43%) and 1,145 without polyps (37.57%). These images were used to optimize the network parameters. (2) The testing set comprised 330 images, including 228 with polyps (69.09%) and 102 without polyps (30.91%). This set was used to estimate the actual learning ability of the network and determine the potential overfitting of the model on the training data.
2.2 Training architecture and framework
There have been significant advances in extensive computer vision tasks with state-of-the-art performance followed by various deep-learning methods based on CNNs (ConvNets) [29]. While it has been shown that depth increase would lead to performance improvement, the state-of-the-art deep learning models beyond 50 layers could not take advantage of this increase due to the vanishing gradient problem [30,31,32]. Therein, the models underwent performance degradation beyond a moderate number of layers. Subsequently, residual architecture (ResNet) [32] introduces short connections to neural networks, and thereby it was proposed to solve the vanishing gradient problem while obtaining much deeper network structures.
Multiple-scale feature methods have been widely applied not only in conventional feature design but also in deep learning. To obtain multiple-scale representations, feature extractors with a wide range of receptive fields are used. CNNs instinctively learn and get coarse-to-fine multiple-scale features with a series of convolutional operators. Because of such an inherent multiple-scale feature extraction ability, CNNs can effectively solve extensive computer vision tasks. Due to the short connections to neural networks, ResNet has a large number of equivalent feature scales during the feature extraction procedure. To verify the reliability of the architecture of our choice, we performed a contrast experiment with some excellent deep learning algorithms, such as Mask R-CNN, Unet, DeepLabV3 and FPN. The experimental comparison results are shown in Table 1.
Test results and comparison with other deep-learning architectures
| Deep-learning architectures | Backbone | mAP50% | mAP70% | mAP75% |
|---|---|---|---|---|
| Mask R-CNN | ResNet-50 | 86.89 | 78.44 | 76.85 |
| ResNet-101 | 87.98 | 77.30 | 72.18 | |
| Res2Net-50 | 88.30 | 79.80 | 78.10 | |
| Res2Net-101 | 89.50 | 78.40 | 73.50 | |
| VGG16 | 87.50 | 83.40 | 82.00 | |
| SE-ResNet50 | 87.90 | 81.30 | 79.60 | |
| U-Net | ResNet-50 | 70.40 | 67.70 | 66.00 |
| ResNet-101 | 76.50 | 66.30 | 64.90 | |
| Res2Net-50 | 71.60 | 68.85 | 67.12 | |
| Res2Net-101 | 77.72 | 67.36 | 65.94 | |
| VGG16 | 70.50 | 67.20 | 66.10 | |
| SE-ResNet50 | 72.90 | 71.30 | 70.20 | |
| DeepLabV3 | ResNet-50 | 68.20 | 65.90 | 64.50 |
| ResNet-101 | 67.80 | 65.10 | 63.60 | |
| Res2Net-50 | 69.43 | 67.09 | 65.66 | |
| Res2Net-101 | 69.70 | 66.08 | 64.55 | |
| VGG16 | 68.90 | 65.67 | 64.60 | |
| SE-ResNet50 | 69.30 | 65.60 | 63.90 | |
| FPN | ResNet-50 | 65.70 | 64.10 | 62.70 |
| ResNet-101 | 70.30 | 66.80 | 65.10 | |
| Res2Net-50 | 66.82 | 65.19 | 63.77 | |
| Res2Net-101 | 71.35 | 67.80 | 66.08 | |
| VGG16 | 66.50 | 61.80 | 59.30 | |
| SE-ResNet50 | 66.10 | 61.30 | 59.10 |
2.3 Functional architecture of our algorithm
A CNN is a type of feedforward neural network wherein an artificial neuron can respond to the surrounding units and process large-scale images. The CNN is a multi-layer perceptron that contains a convolution layer and a pooling layer and is inspired by the process of biological investigation. The operational methods and functions of each category and level in a CNN are distinct. The CNN has become a representative deep learning algorithm and a state-of-the-art method used for image segmentation protocols, including object recognition, object detection, semantic segmentation and instance segmentation.
In our study, we constructed an automatic polyp detection system based on Mask R-CNN, a superior performing general framework in the field of instance segmentation. Mask R-CNN is able to realize object detection in an image and segmentation mask generation toward each event simultaneously. This framework extends the Faster R-CNN, which consists of two modules: a deep, fully convolutional network that generates region proposals and a Fast R-CNN detector that uses these proposed regions. The coordination of the whole system is only for object detection. Unlike Faster R-CNN, Mask R-CNN includes a branch used to predict the mask of an object in parallel with the existing branch for object recognition with a bounding-box. This framework can be trained easily, and it runs at a speed of 5 fps, thus increasing the overhead of Faster R-CNN only slightly.
Figure 1 illustrates the functional architecture of Mask R-CNN in our algorithm. Note that we have applied a two-stage Mask R-CNN procedure, respectively, shown in the left and right dashed boxes. The first stage aims to propose candidate bounding boxes of objects, and the second one aims to predict the class and box offset as well as a binary mask for each region of interest (RoI).
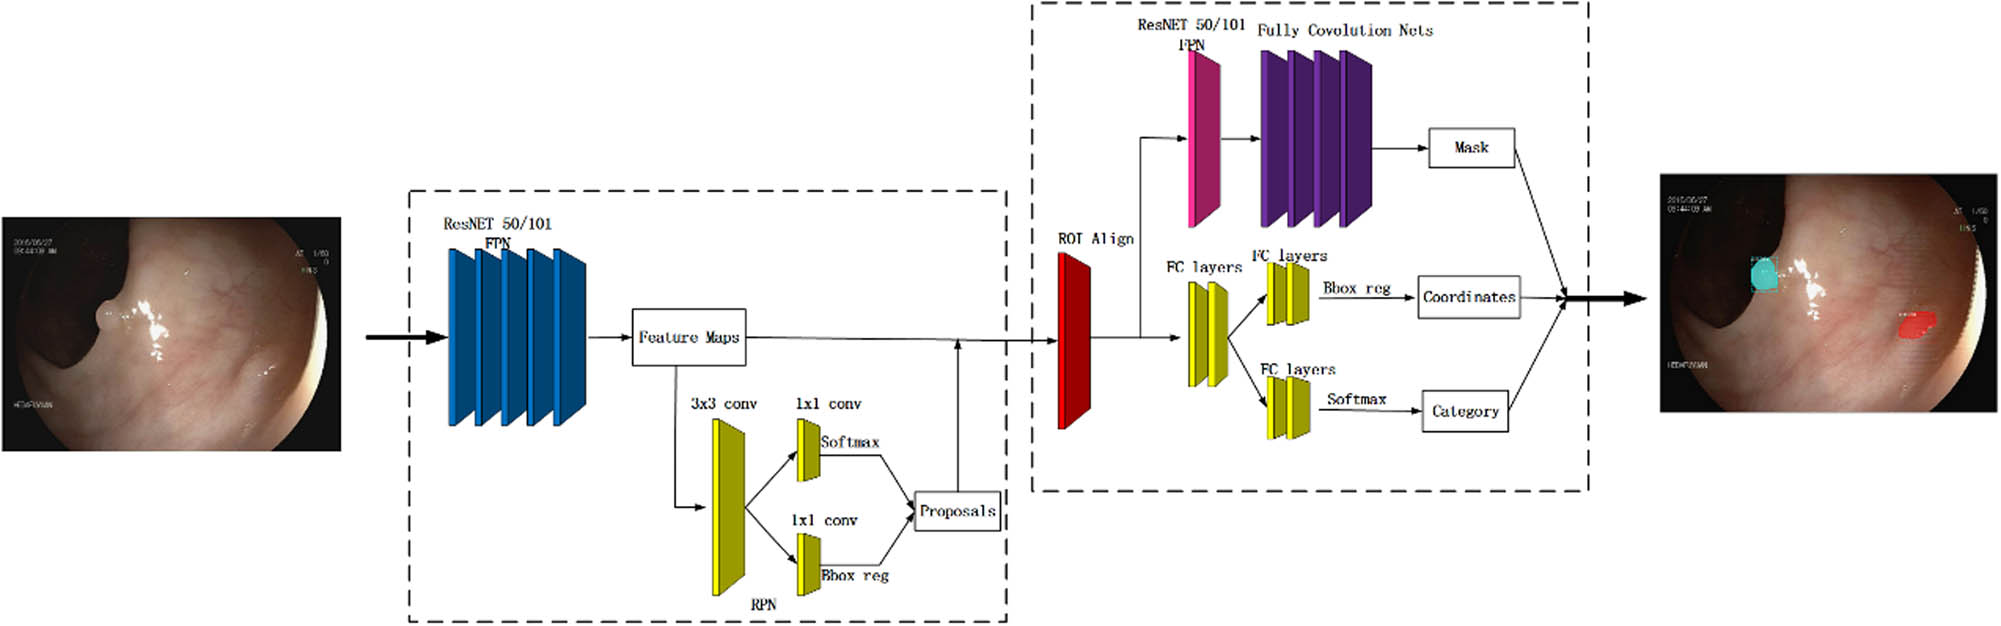
The functional architecture of Mask R-CNN.
2.4 Improved bottleneck structure
The first stage of our algorithm based on Mask R-CNN mainly includes extracting features and proposing candidate object regions. Extraction of features over an entire image is obtained by the backbone CNNs, which extract feature maps from the input images with convolution. So, designing a more efficient network architecture is important to improve the performance of CNNs. Advances in the convolutional backbone architecture are able to enhance the ability of multiple-scale representation.
As a basic building block, the bottleneck blocks extract features from the colonoscopy images and update the weights in training. The bottleneck block employed in the main-network is demonstrated in Figure 2a. And there are many CNN architectures such as ResNet [32], ResNeXt [33] and DLA [34] that use the bottleneck structure. The block includes three convolution kernels: the first 1 × 1 convolution kernel is used to decrease the input channels in order to decrease the amount of calculations required, the 3 × 3 convolution kernel is employed to extract features for the network and then the final 1 × 1 kernel increases the channels. For our approach, we have adopted Res2Net [35], which is a modified version of ResNet as the bottleneck block. As shown in Figure 2b, instead of extracting features using a group of 3 × 3 filters as in the bottleneck block, the Res2Net uses some smaller filter groups to replace the 3 × 3 filters of n channels, and then a hierarchical residual-like style will connect the different filter groups. Note that n = s × w without loss of generality.

(a) The bottleneck block and (b) the Res2Net module.
Note that Ki( ) represents a 3 × 3 convolutional operator. Specifically, the Res2Net module first divides the input feature maps into s groups such as x1, x2,…,xs. Then x1 directs the output to y1, which is not involved in convolution operation to reduce calculation. But for the groups x2,…,xs, features will be extracted using K(i2 ≤ i ≤ s). When extracting features, a few things to note are the previous group’s output features (yi,2 ≤ i ≤ s), the next group of filters (i + 1) and input features xi + 1 (2 ≤ i ≤ s). It will take some time to realize this process. Thus, yi is given by the following equation:
Finally, all groups’ feature maps are connected and sent to another group of 1 × 1 filters. In the process, the input features are transformed to output features, and because the combination effects result in many equivalent feature scales, the equivalent receptive field increases whenever it passes a 3 × 3 filter.
2.5 Region proposal network
After obtaining the feature map of the input image from Res2net, the candidate object bounding boxes need to be proposed further. A Region Proposal Network (RPN) is first proposed in the faster region-based convolution neural network (Faster R-CNN). This algorithm proposed a network to generate the RoI, which indicates the region with fractures.
Figure 3 demonstrates the procedure of the RPN. A feature map with a size of W × H, where W and H are the width and height of the feature map, is selected as the input of the region candidate network. Whereafter, by using a 3 × 3 sliding window on the feature map, an output feature map of 256 channels is generated. The size of the output feature map is identical with the input feature map, which is 256 × (W × H). It can be approximately assumed that the output feature map has W × H feature vectors, each of which has 256 dimensions. Then each feature vector is fully connected twice, one gets two scores (foreground and background) and the other gets four coordinates (x, y, w and h; the four coordinates represent the coordinate offset from the original image). After that, 1 × 1 convolution is performed twice for the entire feature map. We then get feature maps with the sizes of 2 × W × H and 4 × W × H, respectively. That is to say, there are W × H results, and each result contains two scores and four coordinates and maps into the original image. Every spatial pixel in the feature map corresponds to k boxes in the original map, so there are W × H × k boxes in the original map. We set the top left corner or the center of the box as an anchor. The process of region selection is actually to determine whether these boxes are objects and their offsets. By creating anchors on every spatial pixel in the feature map with three scales and three aspect ratios (0.5, 1 and 2), the network will generate W × H × 9 anchors. These anchors are fed to calculate the IoU with the ground-truths and assigned as a positive sample if the IoU is over its thresholds and negative otherwise.
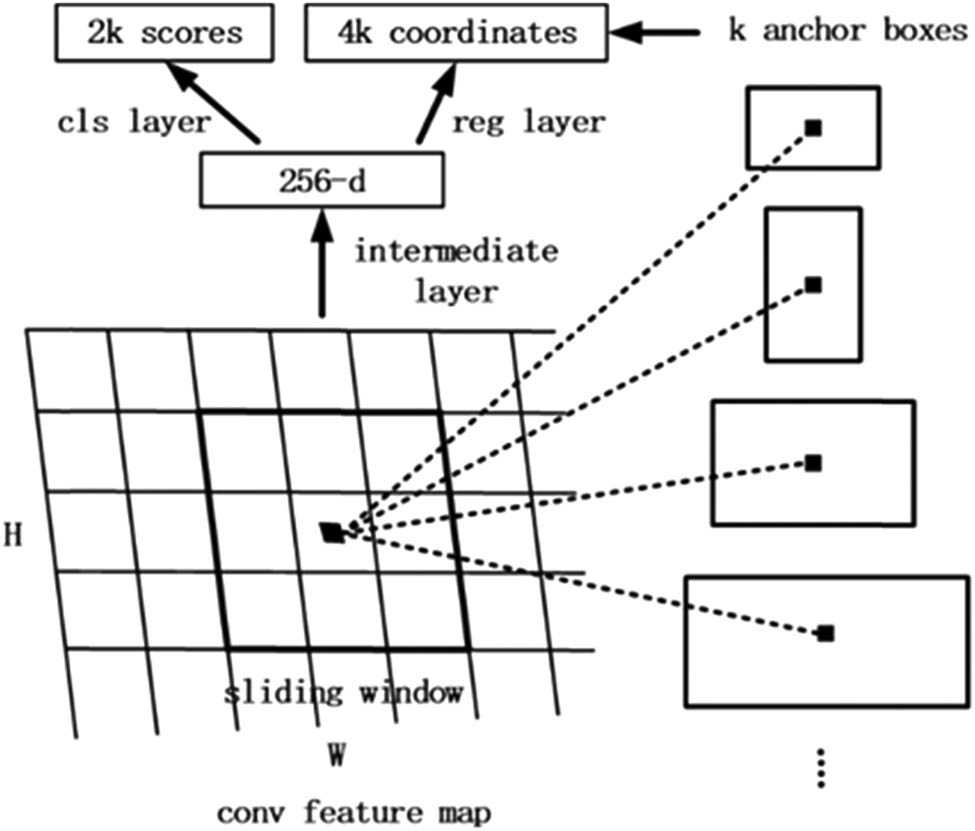
Schematic of the RPN.
2.6 RoIAlign
In the second stage, the Mask R-CNN was used to propose a RoIAlign that would remove the harsh quantization of RoIPooling by properly aligning the extracted features. This proposed change was simple because the RoIAlign layer does not quantitate the RoI boundaries or bins. The Mask R-CNN approach uses bilinear interpolation to compute the exact values of input features at four regularly sampled locations in each RoI bin. The input features can then be calculated using equations (2), (3) and (4):
The bilinear interpolation procedures are shown in Figure 4a. The dashed grid in Figure 4b represents a feature map. In this example, the solid lines represent an RoI with 2 × 2 bins, and the dots represent the four sampling points in each bin. RoIAlign computes the value of each sampling point via bilinear interpolation from the nearby grid points on the feature map. None of the coordinates involved in the RoI, its bins or the sampling points are subjected to quantization.

Schematic of the RoIAlign layer. (a) Bilinear interpolation and (b) the overall structure of RoIAlign.
Mask R-CNN also outputs a binary mask for each RoI that parallels the predicted class and box offset. This feature differs from those of most recent systems, wherein classification depends on mask predictions. Rather, Mask R-CNN is similar to Fast R-CNN and thus applies the bounding-box classification and regression in parallel through a process that largely simplified the multi-stage pipeline of the original R-CNN.
3 Results and discussion
In the training process, we defined a multi-task loss as follows:
The classification loss
Our deep-learning classification model with an initial learning rate of 0.001 and 0.9 learning momentum was trained using 30 epochs on the augmented training set. The values of the loss function of the training sets when training a Res2Net model with 101 layers are shown in Figure 5a. The changes in the different curves demonstrate that with increased training, the loss value decreases; moreover, the rate of this decrease becomes smaller and gradually converges to a fixed value. This phenomenon demonstrates that our Mask R-CNN-based model is a good predictor of polyps.

Training loss and the mAP during the epoch. (a) Training loss per iteration for a 101 layer Res2Net model on training sets. (b) Curves of the mAP during validation with the testing of training epoch.
The results of testing are shown in two representative colonoscopy polyp images in Figure 6. In order to make sure of the accuracy of the results, we developed a unified labeling standard with the direction of the attending gastroenterologist (Figure 6a and b). Figure 6c and d presents the results of Mask R-CNN detection. Notably, in addition to detecting and providing the probability of a polyp, Mask R-CNN could also determine the location and shape of a polyp.

Representative images from the testing set. (a and b) The ground-truth. (c and d) The results of Mask R-CNN detection.
To further verify the performance of our polyp detection system, we generated the mAP as an evaluation metric using the following equation:
where P and R, respectively, denote precision and recall, as calculated in equations (7) and (8):
Note that the various Ns denote the numbers of true negatives, true positives, false negatives and false positives, as indicated by the subscripts.
The coincidence of the prediction frame and the real target can be clearly seen through IoU, which can directly reflect the performance of the training model. We then estimate the performance of our algorithm using three distinct IoU thresholds, 0.5, 0.7 and 0.75. As shown in Figure 5b, our method achieved mAP50, mAP70 and mAP75 of 89.5%, 78.4% and 73.5%, respectively, when applied to the testing set.
In test procedures, AP50, AP70 and AP75 in COCO style have been adopted to evaluate the results. We compared some of the state-of-the-art methods with our network on the same adenomatous polyp dataset, and Table 1 presents the results of different methods, including Mask R-CNN, U-Net, DeepLabV3 and FPN with different variations of backbone, such as ResNet, Res2Net, VGG and SE-ResNet. The boldface entries in the third and fourth rows of Table 1 show the two most accurate models using Mask R-CNN with the backbones of Res2Net-50 and Res2Net-101, respectively. It can be seen that the improved framework with the backbone of Res2Net and 101 layers is relatively higher in the average precision and reaches 89.5% AP50, which outperforms other methods. The superior performance of the Res2Net deep-neural network architecture with 101 layers was confirmed by our ablation test results in our classification work.
4 Conclusion
In this work, we proposed and explored an automated CNN-based CAD system based on state-of-the-art, deep-neural network architecture for CRC diagnosis. This system was used to identify adenomatous colorectal polyps as reflected in colonoscopy images. We evaluated our system with 330 images for the trial detection of colorectal adenoma as outlined by the US multi-society task force guidelines for CRC risk assessment and surveillance. The performance of the proposed method, when applied to the testing data set, was evaluated using the mAP at multiple IoU values which yielded good results. The results show that deep learning methods are available in CAD systems for the detection and diagnosis of colorectal polyps. Our experiments have received the approval of colonoscopists at the Affiliated Hospital of Hebei University. Despite the good results, larger multicenter trials are needed further to validate the ability of our proposed framework, to increase the ADR and reduce the incidence of interval CRC. Given the current complementary nature of a good classification algorithm and high-quality data, we aim to verify the system further by exploring a better backbone structure and collect a larger set of higher-quality colorectal polyp data in the future.
Acknowledgments
This work was funded by the Foundation of Hebei University (DXK201914), the Natural Science Foundation of Hebei Province (H2019201378) and the President fund of Hebei University (XZJJ201914).
Conflict of interest: Prof. Kun Yang, who is the co-author of this article, is the current Guest Editor of Open Life Sciences. This fact did not affect the peer-review process.
Data availability statement: The datasets generated during and/or analyzed during the current study are available from the corresponding author on reasonable request.
References
[1] Bray F, Ferlay J, Soerjomataram I, Siegel RL, Torre LA, Jemal A. Global cancer statistics 2018: GLOBOCAN estimates of incidence and mortality worldwide for 36 cancers in 185 countries. CA Cancer J Clinic 2018; 68(6):394–424.10.3322/caac.21492Search in Google Scholar PubMed
[2] Potter JD. Colorectal cancer: molecules and populations. J Natl Cancer Inst. 1999;91(11):916–32.10.1093/jnci/91.11.916Search in Google Scholar PubMed
[3] Winawer SJ, Zauber AG, Ho MN, O’brien MJ, Gottlieb LS, Sternberg SS, et al. Prevention of colorectal cancer by colonoscopic polypectomy. N Engl J Med. 1993;329(27):1977–81.10.1056/NEJM199312303292701Search in Google Scholar PubMed
[4] Løberg M, Kalager M, Holme Ø, Hoff G, Adami HO, Bretthauer M. Long-term colorectal-cancer mortality after adenoma removal. N Engl J Med. 2014;371(9):799–807.10.1056/NEJMoa1315870Search in Google Scholar PubMed
[5] Zauber AG, Winawer SJ, O’Brien MJ, Lansdorp-Vogelaar I, van Ballegooijen M, Hankey BF, et al. Colonoscopic polypectomy and long-term prevention of colorectal cancer deaths. Obstet Gynecol Sur. 2012;67(8):687–96.Search in Google Scholar
[6] Levine JS, Ahnen DJ. Adenomatous polyps of the colon. N Engl J Med. 2006;355(24):2551–7.10.1056/NEJMcp063038Search in Google Scholar PubMed
[7] Brenner H, Chang-Claude J, Seiler CM, Rickert A, Hoffmeister M. Protection from colorectal cancer after colonoscopy: a population-based, case–control study. Ann Intern Med. 2011;154(1):22–30.10.7326/0003-4819-154-1-201101040-00004Search in Google Scholar PubMed
[8] Pignone M, Saha S, Hoerger T, Mandelblatt J. Cost-effectiveness analyses of colorectal cancer screening: a systematic review for the US Preventive Services Task Force. Ann Intern Med. 2002;137(2):96–104.10.7326/0003-4819-137-2-200207160-00007Search in Google Scholar PubMed
[9] Lieberman DA, Rex DK, Winawer SJ, Giardiello FM, Johnson DA, Levin TR. Guidelines for colonoscopy surveillance after screening and polypectomy: a consensus update by the US Multi-Society Task Force on Colorectal Cancer. Gastroenterology. 2012;143(3):844–57.10.1053/j.gastro.2012.06.001Search in Google Scholar PubMed
[10] Rex DK, Johnson DA, Anderson JC, Schoenfeld PS, Burke CA, Inadomi JM. American College of Gastroenterology guidelines for colorectal cancer screening 2008. Am J Gastroenterol. 2009;104(3):739–50.10.1038/ajg.2009.104Search in Google Scholar PubMed
[11] Corley DA, Jensen CD, Marks AR, Zhao WK, Lee JK, Doubeni CA, et al. Adenoma detection rate and risk of colorectal cancer and death. N Engl J Med. 2014;370(14):1298–306.10.1056/NEJMoa1309086Search in Google Scholar PubMed PubMed Central
[12] Anderson JC, Butterly LF. Colonoscopy: quality indicators. Clin Transl Gastroenterol. 2015;6:e77.10.1038/ctg.2015.5Search in Google Scholar PubMed PubMed Central
[13] Chougrad H, Zouaki H, Alheyane O. Deep convolutional neural networks for breast cancer screening. Comput Methods Prog Biomed. 2018;157:19–30.10.1016/j.cmpb.2018.01.011Search in Google Scholar PubMed
[14] Sun W, Tseng TLB, Zhang J, Qian W. Enhancing deep convolutional neural network scheme for breast cancer diagnosis with unlabeled data. Comput Med Imaging Graph. 2017;57:4–9.10.1016/j.compmedimag.2016.07.004Search in Google Scholar PubMed
[15] Havaei M, Davy A, Warde-Farley D, Biard A, Courville A, Bengio Y, et al. Brain tumor segmentation with deep neural networks. Med Image Anal. 2017;35:18–31.10.1016/j.media.2016.05.004Search in Google Scholar PubMed
[16] Işın A, Direkoğlu C, Şah M. Review of MRI-based brain tumor image segmentation using deep learning methods. Proc Comput Sci. 2016;102:317–24.10.1016/j.procs.2016.09.407Search in Google Scholar
[17] Xie H, Yang D, Sun N, Chen Z, Zhang Y. Automated pulmonary nodule detection in CT images using deep convolutional neural networks. Pattern Recogn. 2019;85:109–19.10.1016/j.patcog.2018.07.031Search in Google Scholar
[18] Huang X, Sun W, Tseng TLB, Li C, Qian W. Fast and fully-automated detection and segmentation of pulmonary nodules in thoracic CT scans using deep convolutional neural networks. Comput Med Imaging Graph. 2019;74:25–36.10.1016/j.compmedimag.2019.02.003Search in Google Scholar PubMed
[19] Karkanis SA, Iakovidis DK, Maroulis DE, Karras DA, Tzivras M. Computer-aided tumor detection in endoscopic video using color wavelet features. IEEE Trans Inf Technol Biomed. 2003;7(3):141–52.10.1109/TITB.2003.813794Search in Google Scholar
[20] Hwang S, Oh J, Tavanapong W, Wong J, De Groen PC. Polyp detection in colonoscopy video using elliptical shape feature. 2007 IEEE International Conference on Image Processing. Piscataway, NJ: IEEE; 2007. p. 465–8.10.1109/ICIP.2007.4379193Search in Google Scholar
[21] Tajbakhsh N, Gurudu SR, Liang J. Automated polyp detection in colonoscopy videos using shape and context information. IEEE Trans Med Imaging. 2015;35(2):630–44.10.1109/TMI.2015.2487997Search in Google Scholar PubMed
[22] Bernal J, Sánchez FJ, Fernández-Esparrach G, Gil D, Rodríguez C, Vilariño F. WM-DOVA maps for accurate polyp highlighting in colonoscopy: validation vs. saliency maps from physicians. Comput Med Imaging Graph. 2015;43:99–111.10.1016/j.compmedimag.2015.02.007Search in Google Scholar PubMed
[23] Wang Y, Tavanapong W, Wong J, Oh JH, De Groen PC. Polyp-alert: near real-time feedback during colonoscopy. Comput Methods Prog Biomed. 2015;120(3):164–79.10.1016/j.cmpb.2015.04.002Search in Google Scholar PubMed
[24] Li T, Cohen J, Craig M, Tsourides K, Mahmud N, Berzin TM. Mo1979 The next endoscopic frontier: a novel computer vision program accurately identifies colonoscopic colorectal adenomas. Gastrointest Endosc. 2016;83(5):AB482.10.1016/j.gie.2016.03.671Search in Google Scholar
[25] Byrne MF, Chapados N, Soudan F, Oertel C, Pérez MLL, Kelly R, et al. Su1614 artificial intelligence (AI) in endoscopy – deep learning for optical biopsy of colorectal polyps in real-time on unaltered endoscopic videos. Gastrointest Endosc. 2017;85(5):AB364–5.10.1016/j.gie.2017.03.843Search in Google Scholar
[26] Zhang R, Zheng Y, Mak TWC, Yu R, Wong SH, Lau JY, et al. Automatic detection and classification of colorectal polyps by transferring low-level CNN features from nonmedical domain. IEEE J Biomed Health Inform. 2016;21(1):41–7.10.1109/JBHI.2016.2635662Search in Google Scholar PubMed
[27] Brandao P, Zisimopoulos O, Mazomenos E, Ciuti G, Bernal J, Visentini-Scarzanella M, et al. Towards a computed-aided diagnosis system in colonoscopy: automatic polyp segmentation using convolution neural networks. J Med Robot Res. 2018;3(2):1840002.10.1142/S2424905X18400020Search in Google Scholar
[28] He K, Gkioxari G, Dollár P, Girshick R., Mask R-CNN. Proceedings of the IEEE international conference on computer vision. Piscataway, NJ: IEEE; 2017. p. 2961–9.10.1109/ICCV.2017.322Search in Google Scholar
[29] LeCun Y, Boser B, Denker JS, Henderson D, Howard RE, Hubbard W, et al. Handwritten digit recognition with a back-propagation network. Adv Neural Inf Process Syst. 1997;2(2):396–404.Search in Google Scholar
[30] Szegedy C, Liu W, Jia Y, Sermanet P, Reed S, Anguelov D, Erhan D, et al. Going deeper with convolutions. Proceedings of the IEEE conference on computer vision and pattern recognition. 2015. p. 1–9.10.1109/CVPR.2015.7298594Search in Google Scholar
[31] Simonyan K, Vedaldi A, Zisserman A. Deep Inside Convolutional Networks: Visualising Image Classification Models and Saliency Maps. Computer ence 2013.Search in Google Scholar
[32] He K, Zhang X, Ren S, Sun J. Deep residual learning for image recognition. Proceedings of the IEEE conference on computer vision and pattern recognition. Piscataway, NJ: IEEE; 2016. p. 770–8.10.1109/CVPR.2016.90Search in Google Scholar
[33] Xie S, Girshick R, Dollár P, Tu Z, He K. Aggregated residual transformations for deep neural networks. Proceedings of the IEEE conference on computer vision and pattern recognition. Piscataway, NJ: IEEE; 2017. p. 1492–500.10.1109/CVPR.2017.634Search in Google Scholar
[34] Yu F, Wang D, Shelhamer E, Darrell T. Deep layer aggregation. Proceedings of the IEEE conference on computer vision and pattern recognition. Piscataway, NJ: IEEE; 2018. p. 2403–12.10.1109/CVPR.2018.00255Search in Google Scholar
[35] Gao S, Cheng MM, Zhao K, Zhang XY, Yang MH, Torr PH. Res2net: a new multi-scale backbone architecture. IEEE Trans on Pattern Analysis and Machine Intelligence, 2019. arXiv:1904.01169.10.1109/TPAMI.2019.2938758Search in Google Scholar PubMed
© 2020 Jie Meng et al., published by De Gruyter
This work is licensed under the Creative Commons Attribution 4.0 International License.
Articles in the same Issue
- Plant Sciences
- Dependence of the heterosis effect on genetic distance, determined using various molecular markers
- Plant Growth Promoting Rhizobacteria (PGPR) Regulated Phyto and Microbial Beneficial Protein Interactions
- Role of strigolactones: Signalling and crosstalk with other phytohormones
- An efficient protocol for regenerating shoots from paper mulberry (Broussonetia papyrifera) leaf explants
- Functional divergence and adaptive selection of KNOX gene family in plants
- In silico identification of Capsicum type III polyketide synthase genes and expression patterns in Capsicum annuum
- In vitro induction and characterisation of tetraploid drumstick tree (Moringa oleifera Lam.)
- CRISPR/Cas9 or prime editing? – It depends on…
- Study on the optimal antagonistic effect of a bacterial complex against Monilinia fructicola in peach
- Natural variation in stress response induced by low CO2 in Arabidopsis thaliana
- The complete mitogenome sequence of the coral lily (Lilium pumilum) and the Lanzhou lily (Lilium davidii) in China
- Ecology and Environmental Sciences
- Use of phosphatase and dehydrogenase activities in the assessment of calcium peroxide and citric acid effects in soil contaminated with petrol
- Analysis of ethanol dehydration using membrane separation processes
- Activity of Vip3Aa1 against Periplaneta americana
- Thermostable cellulase biosynthesis from Paenibacillus alvei and its utilization in lactic acid production by simultaneous saccharification and fermentation
- Spatiotemporal dynamics of terrestrial invertebrate assemblages in the riparian zone of the Wewe river, Ashanti region, Ghana
- Antifungal activity of selected volatile essential oils against Penicillium sp.
- Toxic effect of three imidazole ionic liquids on two terrestrial plants
- Biosurfactant production by a Bacillus megaterium strain
- Distribution and density of Lutraria rhynchaena Jonas, 1844 relate to sediment while reproduction shows multiple peaks per year in Cat Ba-Ha Long Bay, Vietnam
- Biomedical Sciences
- Treatment of Epilepsy Associated with Common Chromosomal Developmental Diseases
- A Mouse Model for Studying Stem Cell Effects on Regeneration of Hair Follicle Outer Root Sheaths
- Morphine modulates hippocampal neurogenesis and contextual memory extinction via miR-34c/Notch1 pathway in male ICR mice
- Composition, Anticholinesterase and Antipedicular Activities of Satureja capitata L. Volatile Oil
- Weight loss may be unrelated to dietary intake in the imiquimod-induced plaque psoriasis mice model
- Construction of recombinant lentiviral vector containing human stem cell leukemia gene and its expression in interstitial cells of cajal
- Knockdown of lncRNA KCNQ1OT1 inhibits glioma progression by regulating miR-338-3p/RRM2
- Protective effect of asiaticoside on radiation-induced proliferation inhibition and DNA damage of fibroblasts and mice death
- Prevalence of dyslipidemia in Tibetan monks from Gansu Province, Northwest China
- Sevoflurane inhibits proliferation, invasion, but enhances apoptosis of lung cancer cells by Wnt/β-catenin signaling via regulating lncRNA PCAT6/ miR-326 axis
- MiR-542-3p suppresses neuroblastoma cell proliferation and invasion by downregulation of KDM1A and ZNF346
- Calcium Phosphate Cement Causes Nucleus Pulposus Cell Degeneration Through the ERK Signaling Pathway
- Human Dental Pulp Stem Cells Exhibit Osteogenic Differentiation Potential
- MiR-489-3p inhibits cell proliferation, migration, and invasion, and induces apoptosis, by targeting the BDNF-mediated PI3K/AKT pathway in glioblastoma
- Long non-coding RNA TUG1 knockdown hinders the tumorigenesis of multiple myeloma by regulating the microRNA-34a-5p/NOTCH1 signaling pathway
- Large Brunner’s gland adenoma of the duodenum for almost 10 years
- Neurotrophin-3 accelerates reendothelialization through inducing EPC mobilization and homing
- Hepatoprotective effects of chamazulene against alcohol-induced liver damage by alleviation of oxidative stress in rat models
- FXYD6 overexpression in HBV-related hepatocellular carcinoma with cirrhosis
- Risk factors for elevated serum colorectal cancer markers in patients with type 2 diabetes mellitus
- Effect of hepatic sympathetic nerve removal on energy metabolism in an animal model of cognitive impairment and its relationship to Glut2 expression
- Progress in research on the role of fibrinogen in lung cancer
- Advanced glycation end product levels were correlated with inflammation and carotid atherosclerosis in type 2 diabetes patients
- MiR-223-3p regulates cell viability, migration, invasion, and apoptosis of non-small cell lung cancer cells by targeting RHOB
- Knockdown of DDX46 inhibits trophoblast cell proliferation and migration through the PI3K/Akt/mTOR signaling pathway in preeclampsia
- Buformin suppresses osteosarcoma via targeting AMPK signaling pathway
- Effect of FibroScan test in antiviral therapy for HBV-infected patients with ALT <2 upper limit of normal
- LncRNA SNHG15 regulates osteosarcoma progression in vitro and in vivo via sponging miR-346 and regulating TRAF4 expression
- LINC00202 promotes retinoblastoma progression by regulating cell proliferation, apoptosis, and aerobic glycolysis through miR-204-5p/HMGCR axis
- Coexisting flavonoids and administration route effect on pharmacokinetics of Puerarin in MCAO rats
- GeneXpert Technology for the diagnosis of HIV-associated tuberculosis: Is scale-up worth it?
- Circ_001569 regulates FLOT2 expression to promote the proliferation, migration, invasion and EMT of osteosarcoma cells through sponging miR-185-5p
- Lnc-PICSAR contributes to cisplatin resistance by miR-485-5p/REV3L axis in cutaneous squamous cell carcinoma
- BRCA1 subcellular localization regulated by PI3K signaling pathway in triple-negative breast cancer MDA-MB-231 cells and hormone-sensitive T47D cells
- MYL6B drives the capabilities of proliferation, invasion, and migration in rectal adenocarcinoma through the EMT process
- Inhibition of lncRNA LINC00461/miR-216a/aquaporin 4 pathway suppresses cell proliferation, migration, invasion, and chemoresistance in glioma
- Upregulation of miR-150-5p alleviates LPS-induced inflammatory response and apoptosis of RAW264.7 macrophages by targeting Notch1
- Long non-coding RNA LINC00704 promotes cell proliferation, migration, and invasion in papillary thyroid carcinoma via miR-204-5p/HMGB1 axis
- Neuroanatomy of melanocortin-4 receptor pathway in the mouse brain
- Lipopolysaccharides promote pulmonary fibrosis in silicosis through the aggravation of apoptosis and inflammation in alveolar macrophages
- Influences of advanced glycosylation end products on the inner blood–retinal barrier in a co-culture cell model in vitro
- MiR-4328 inhibits proliferation, metastasis and induces apoptosis in keloid fibroblasts by targeting BCL2 expression
- Aberrant expression of microRNA-132-3p and microRNA-146a-5p in Parkinson’s disease patients
- Long non-coding RNA SNHG3 accelerates progression in glioma by modulating miR-384/HDGF axis
- Long non-coding RNA NEAT1 mediates MPTP/MPP+-induced apoptosis via regulating the miR-124/KLF4 axis in Parkinson’s disease
- PCR-detectable Candida DNA exists a short period in the blood of systemic candidiasis murine model
- CircHIPK3/miR-381-3p axis modulates proliferation, migration, and glycolysis of lung cancer cells by regulating the AKT/mTOR signaling pathway
- Reversine and herbal Xiang–Sha–Liu–Jun–Zi decoction ameliorate thioacetamide-induced hepatic injury by regulating the RelA/NF-κB/caspase signaling pathway
- Therapeutic effects of coronary granulocyte colony-stimulating factor on rats with chronic ischemic heart disease
- The effects of yam gruel on lowering fasted blood glucose in T2DM rats
- Circ_0084043 promotes cell proliferation and glycolysis but blocks cell apoptosis in melanoma via circ_0084043-miR-31-KLF3 axis
- CircSAMD4A contributes to cell doxorubicin resistance in osteosarcoma by regulating the miR-218-5p/KLF8 axis
- Relationship of FTO gene variations with NAFLD risk in Chinese men
- The prognostic and predictive value of platelet parameters in diabetic and nondiabetic patients with sudden sensorineural hearing loss
- LncRNA SNHG15 contributes to doxorubicin resistance of osteosarcoma cells through targeting the miR-381-3p/GFRA1 axis
- miR-339-3p regulated acute pancreatitis induced by caerulein through targeting TNF receptor-associated factor 3 in AR42J cells
- LncRNA RP1-85F18.6 affects osteoblast cells by regulating the cell cycle
- MiR-203-3p inhibits the oxidative stress, inflammatory responses and apoptosis of mice podocytes induced by high glucose through regulating Sema3A expression
- MiR-30c-5p/ROCK2 axis regulates cell proliferation, apoptosis and EMT via the PI3K/AKT signaling pathway in HG-induced HK-2 cells
- CTRP9 protects against MIA-induced inflammation and knee cartilage damage by deactivating the MAPK/NF-κB pathway in rats with osteoarthritis
- Relationship between hemodynamic parameters and portal venous pressure in cirrhosis patients with portal hypertension
- Long noncoding RNA FTX ameliorates hydrogen peroxide-induced cardiomyocyte injury by regulating the miR-150/KLF13 axis
- Ropivacaine inhibits proliferation, migration, and invasion while inducing apoptosis of glioma cells by regulating the SNHG16/miR-424-5p axis
- CD11b is involved in coxsackievirus B3-induced viral myocarditis in mice by inducing Th17 cells
- Decitabine shows anti-acute myeloid leukemia potential via regulating the miR-212-5p/CCNT2 axis
- Testosterone aggravates cerebral vascular injury by reducing plasma HDL levels
- Bioengineering and Biotechnology
- PL/Vancomycin/Nano-hydroxyapatite Sustained-release Material to Treat Infectious Bone Defect
- The thickness of surface grafting layer on bio-materials directly mediates the immuno-reacitivity of macrophages in vitro
- Silver nanoparticles: synthesis, characterisation and biomedical applications
- Food Science
- Bread making potential of Triticum aestivum and Triticum spelta species
- Modeling the effect of heat treatment on fatty acid composition in home-made olive oil preparations
- Effect of addition of dried potato pulp on selected quality characteristics of shortcrust pastry cookies
- Preparation of konjac oligoglucomannans with different molecular weights and their in vitro and in vivo antioxidant activities
- Animal Sciences
- Changes in the fecal microbiome of the Yangtze finless porpoise during a short-term therapeutic treatment
- Agriculture
- Influence of inoculation with Lactobacillus on fermentation, production of 1,2-propanediol and 1-propanol as well as Maize silage aerobic stability
- Application of extrusion-cooking technology in hatchery waste management
- In-field screening for host plant resistance to Delia radicum and Brevicoryne brassicae within selected rapeseed cultivars and new interspecific hybrids
- Studying of the promotion mechanism of Bacillus subtilis QM3 on wheat seed germination based on β-amylase
- Rapid visual detection of FecB gene expression in sheep
- Effects of Bacillus megaterium on growth performance, serum biochemical parameters, antioxidant capacity, and immune function in suckling calves
- Effects of center pivot sprinkler fertigation on the yield of continuously cropped soybean
- Special Issue On New Approach To Obtain Bioactive Compounds And New Metabolites From Agro-Industrial By-Products
- Technological and antioxidant properties of proteins obtained from waste potato juice
- The aspects of microbial biomass use in the utilization of selected waste from the agro-food industry
- Special Issue on Computing and Artificial Techniques for Life Science Applications - Part I
- Automatic detection and segmentation of adenomatous colorectal polyps during colonoscopy using Mask R-CNN
- The impedance analysis of small intestine fusion by pulse source
- Errata
- Erratum to “Diagnostic performance of serum CK-MB, TNF-α and hs-CRP in children with viral myocarditis”
- Erratum to “MYL6B drives the capabilities of proliferation, invasion, and migration in rectal adenocarcinoma through the EMT process”
- Erratum to “Thermostable cellulase biosynthesis from Paenibacillus alvei and its utilization in lactic acid production by simultaneous saccharification and fermentation”