Non-destructive evaluation of soluble solid content in fruits with various skin thicknesses using visible–shortwave near-infrared spectroscopy
-
Evia Zunita D. Pratiwi


Abstract
Visible–shortwave near-infrared spectroscopy has been used for internal quality measurement, but the optical penetration to the thickness of fruit skin becomes a challenge. This research aimed to develop partial least square regression model for the soluble solid content (SSC) measurement of fruits having various skin thicknesses, namely dragon fruit, tomato, guava, sapodilla, and banana. The spectra of each fruit were taken in a reflectance mode over a wavelength range of 400–1,000 nm. The best models obtained from banana and sapodilla yielded determination coefficient of prediction (R 2 p) of 0.88 and 0.90 and root mean square error of prediction (RMSEP) 0.39 and 0.38°Brix, respectively. The banana and sapodilla SSC prediction models should be able to be used carefully in a variety of applications. Tomato and guava had moderately thinner skin but had the lower R 2 p of 0.64 and 0.76 and the RMSEP of 0.17 and 0.26°Brix, respectively. The poorest model was yielded by dragon fruit, which had the thickest skin with the R 2 p of 0.59 and the RMSEP of 0.40°Brix. The model for guava, although having low R 2 p, can still be utilized as a screening criterion and in some other ‘approximate’ applications. However, the SSC prediction model for tomatoes and dragon fruit is not recommended to use and requires additional research. In addition to the effect of skin thickness, other fruit morphological influences the result of this study. Internal structure and seed number influence the reflection optical geometry, which also affects the SSC prediction model.
1 Introduction
Fruits have various quality parameters, such as texture, flavor, and other external and internal parameters, but are susceptible to damage or deterioration. One of the important quality parameters is soluble solid content (SSC). SSC uses °Brix as a unit representing dry substance concentration of solutions. In sugar industries, °Brix is the percentage by weight of sucrose in a sugar solution [1]. In case for fruits and vegetables °Brix does not necessarily refer to sugar since not the only sugar components contributing to SSC, but in fruit juices °Brix usually refers only to the sugar content [2]. However, SSC (as °Brix) is commonly used to indicate sweetness in fruits, which influences consumer willingness to pay. Humans can perform sensory evaluation of quality parameters, such as aroma and appearance of fruit skin or color, but their objectivity is low. Therefore, in the storage or distribution of fruit to consumers, changes in SSC must be precisely characterized throughout each production chain to guarantee consumer satisfaction.
SSC evaluation can be done by sensory evaluation, hydrometer, high-pressure liquid chromatography, gas chromatography, colorimetric methods, or electronic tongue [2]. SSC can also be easily measured with a digital refractometer, but it requires crushing of the samples especially for solid samples. Therefore, the method is not practical for analyzing a significant number of samples. On the other hand, a technique that uses infrared (IR) spectroscopy is proven to determine SSC quickly and nondestructively. Instruments with the principle of IR spectroscopy are the Fourier transform infrared, near-infrared (NIR), or visible–shortwave near-infrared (Vis–SWNIR) spectrometer. Spectroscopic methods are also easy to use in the control process [3].
Several studies have reported the use of IR spectroscopy for SSC measurement in lemon and orange [4], banana [5], pineapple [6], or pear [7]. In the IR region, molecules of C–H–O in fruits are recorded as the amount of energy absorbed, reflected, or transmitted [6]. Spectral reflectance also conveys information about the fruit’s external characteristics, such as shape, size, integrity, external defects, surface color, and translucency [8]. The chemical composition and surface characteristics of the tissue will be revealed by the spectral response of fruit objects exposed to electromagnetic radiation [9].
Vis–SWNIR is an IR spectroscopy instrument that is ideal for fast on-line applications in small industries because it does not require expensive high-capacity supporting components. This instrument combines spectral measurements in the visible (Vis) light (350–700 nm) range and the NIR (700–2,500 nm) range. The two distinct wavelengths are used to estimate the chemical components of fruits, pigments in epidermal cells, and external tissue color [10]. The Vis–SWNIR spectroscopy has weak absorption to water molecules; thus, it is appropriate for determining low-concentration constituents, such as pH [11,12] or acidity [4]. Its short wavelength at 400–1,000 nm causes the Vis–SWNIR spectroscopy to have high energy and can penetrate deeper in fruits [13]. Research on IR spectroscopy regarding light penetration and its use for thick-skinned fruit have been conducted. Lammertyn et al. in ref. [14] reported the wavelength effect on the light penetration of NIR radiation in apple; while Phuangsombut et al. [15] reported the successful use of NIR spectroscopy to determine dry matter in thick-skinned fruit. Factors that influence fruit optical characteristics (e.g., cell size, cell packing arrangements, skin thickness, chemical matrix) include cultivar, growing conditions, and stage of ripening [16].
The spectrum of the fruit skin will play a role in determining the fruit’s intact quality. Fruit skin will act as an optical barrier to spectroscopy light penetration. According to Arendse et al. [17], it is easier to observe the internal composition of fruit with thin skin than thick skin. Reported by Lammertyn et al. [14], light penetration in “Jonagold” apples is at 4 mm in the range of 700–900 nm and then decreases to 3 mm at 900–1,900 nm. The NIR wavelengths are represented by these two regions. Vis wavelength with a higher energy level than NIR allows for greater light penetration. According to ref. [18], which predicted the internal quality of three species of fruit, the model’s accuracy changes at the NIR wavelength. However, the previous studies used only one cultivar or without comparing the results on different types of fruit with different fruit skin thicknesses at the Vis–SWNIR wavelength. Fruit has a complex physical and chemical content; the studies of the influence of various skin thicknesses on SSC developed using Vis–SWNIR spectroscopy are few.
For predicting concentrations, several methods can be used for analyzing spectroscopy data, such as partial least square regression (PLSR), principal component regression (PCR), multiple linear regression, or support vector machine. A study in determining SSC and pH of banana using Vis–NIR spectroscopy showed that PLSR performed better compared to PCR [5]; therefore, in this study, PLSR was used to predict the SSC of fruits. The fruit samples used were selected based on their thin and thick skin, i.e., dragon fruit, tomato, sapodilla, guava, and banana. The objective of this study was to determine the SSC of fruits having various skin thicknesses using the Vis–SWNIR spectroscopy. Preprocessing for the data transformation step is performed prior to creating the PLS model. Pre-processing is carried out for the purpose of optimizing the spectra from possible noise that occurs from the environment or when collecting spectral data, or other problems that can cause difficulties in spectral analysis. Various spectra pre-processing was applied to produce the best PLSR model to determine the SSC of fruit samples.
2 Materials and methods
2.1 Sample and spectra measurement
Dragon fruit (Hylocereus polyrhizus), tomato (Solanum lycopersicum cultivar Servo F1), sapodilla (Manilkara zapota), guava (Psidium guajava L.), and banana (Musa Acuminata B.) were used as fruit samples. Each cultivar has 100 intact samples that were purchased from local markets in Yogyakarta Indonesia. After samples were transported to the laboratory, the reflectance spectral data of each fruit were collected by a Vis–SWNIR spectrometer (Flame-T-VIS-NIR Ocean Optics, Dunedin, FL, USA; 350–1,000 nm with a resolution of 0.22 nm) equipped with a tungsten halogen lamp (360–2,400 nm, HL-2000-HP-FHSA Ocean Optics, nominal bulb power 20 W, typical output power 8.4 mW) and a reflectance probe (QR400-7 VIS-NIR Ocean Optics). Spectra acquisition was set as shown in Figure 1. Spectra capture settings are carried out before the spectra acquisition process using the OceanView 1.6.7 with a scan to the average of 100, the integration time of 100 ms, and the boxcar width of 1. Spectra acquisitions were done inside a black box to minimize environmental interference.

Spectra acquisition set up using Vis–SWNIR spectroscopy.
2.2 Chemical and physical analysis
2.2.1 SSC and skin water content analysis
The reference value of SSC in each fruit was measured by using a destructive method. This step was immediately conducted after collecting spectra data. For SSC measurement, the flesh fruit was cut then crushed using a blender (Philips Pro Blend 4 2IN1 HR-2102). Finally, a digital SSC refractometer (PAL-α, Atago, USA) was used to obtain SSC in °Brix with SEL ±0.2°Brix, which was measured in triplicate and averaged. The water content of the skin was used to determine the average water content of the fruit skin in each observed fruit using the gravimetric method. The fruit peel samples were then placed in the cup three times and dried at 105°C until a stable weight was obtained. The water content was calculated on a wet basis, and the results represent a percentage of the water content of the fruit skin.
2.2.2 Diameter and skin thickness of fruit measurement
Fruit dimensions, namely diameter to express fruit size and skin thickness, were measured. Skin thickness was measured with digital calipers (Krisbow QRC5 150 mm/6″). The measurement scale was measured in millimeters (mm). Skin thickness and diameter were measured in the fruit’s equator region, which was also where the spectra were taken three times and averaged.
2.3 Data analysis and PLSR model development
The individual-cultivar studies were established to quantitatively determine the SSC in fruit. The whole spectra of Vis–NIR spectrometer covers a wavelength range of 350–1,100 nm. However, due to its heavy noise, the initial spectra at the Vis region were cut to which the remaining spectra in the region of 400–1,000 nm were used to build the PLSR model. Three spectra of fruits obtained from different surface positions in the equator area were used for analysis without being averaged. The total spectra of each sample fruit were 300 each sample fruit
All reflectance spectra data were then analyzed using the Unscrambler® X software (CAMO, Oslo, Norway). Data were randomly divided into two-thirds of the data serving as the calibration set and one-third data serving as the prediction set. Several pre-processing techniques were applied to the spectra, such as the Savitzky–Golay second derivative (SGD2), Savitzky–Golay smoothing (SGS), area normalization (AN), standard normal variate (SNV), and multiple scatter correction (MSC). SGD and SGS are used to remove vertical offsets and linearly sloping baselines [19]. Normalization pre-processing implies allocating the same weight to all absorbencies. MSC and SNV are related due to light scattering and particle size [20]. The optimal spectra transformations that indicated the best pre-processing spectra were chosen based on the highest values of coefficient of determination (R 2) and the lowest of root mean square of error (RMSE) of PLSR models.
3 Results and discussion
3.1 SSC analysis
Table 1 shows the statistical data of SSC for all fruit samples. A range of SSC fruits used in this research were 7.90–13.30, 3.40–5.90, 18.86–31.23, 9.43–25.93, and 5.35–9.85°Brix for dragon fruit, tomato, banana, sapodilla, and guava, respectively. SSC of tomato and guava was in a narrow interval, compared to dragon fruit, banana, and sapodilla. High contents of SSC were recorded for banana and sapodilla, while low contents were recorded for dragon fruit, tomato, and guava. The highest standard deviation (SD) was observed for banana and sapodilla then followed by dragon fruit and guava, while tomato had the lowest SD. A low SD implies a small variation in SSC content. Although might generate a high RMSE, a large SD is required to obtain a good regression model [21].
Statistical analysis of SSC (in °Brix) of fruit samples
| Sample | N | Mean | SD | Min | Max | Range |
|---|---|---|---|---|---|---|
| Dragon fruit | 100 | 10.75 | 1.16 | 7.90 | 13.30 | 5.40 |
| Tomato | 100 | 4.27 | 0.41 | 3.40 | 5.90 | 2.50 |
| Banana | 100 | 27.10 | 2.36 | 18.86 | 31.23 | 12.37 |
| Sapodilla | 100 | 19.56 | 2.43 | 9.43 | 25.93 | 16.50 |
| Guava | 100 | 7.09 | 0.90 | 5.35 | 9.85 | 4.50 |
N – number of samples; SD – standard deviation; Min – minimum; Max – maximum.
3.2 Spectra profiles
Figure 2 is reflectance spectra of dragon fruit, tomato, banana, guava, and sapodilla along the Vis and shortwave near-infrared (SWNIR) region at the wavelength of 450–970 nm derived from original spectra (Figure 2a) and SGD2 spectra (Figure 2b). The figure shows considerably different profiles for each fruit. From both figures, peaks or valleys of spectra were noticeable at the Vis region of 450–700 nm as a response to the presence of pigments [22], differences in reflectance spectra in the Vis region can be attributed to pigment differences in each fruit. While at the SWNIR region of 700–970 nm, the spectra were relatively flat. By applying the SGD2 method, the peaks around 960–980 nm (Figure 2b) were Vis due to the absorption of water and carbohydrate [23] and around 910–930 nm due to CH and CH2 stretching [24].
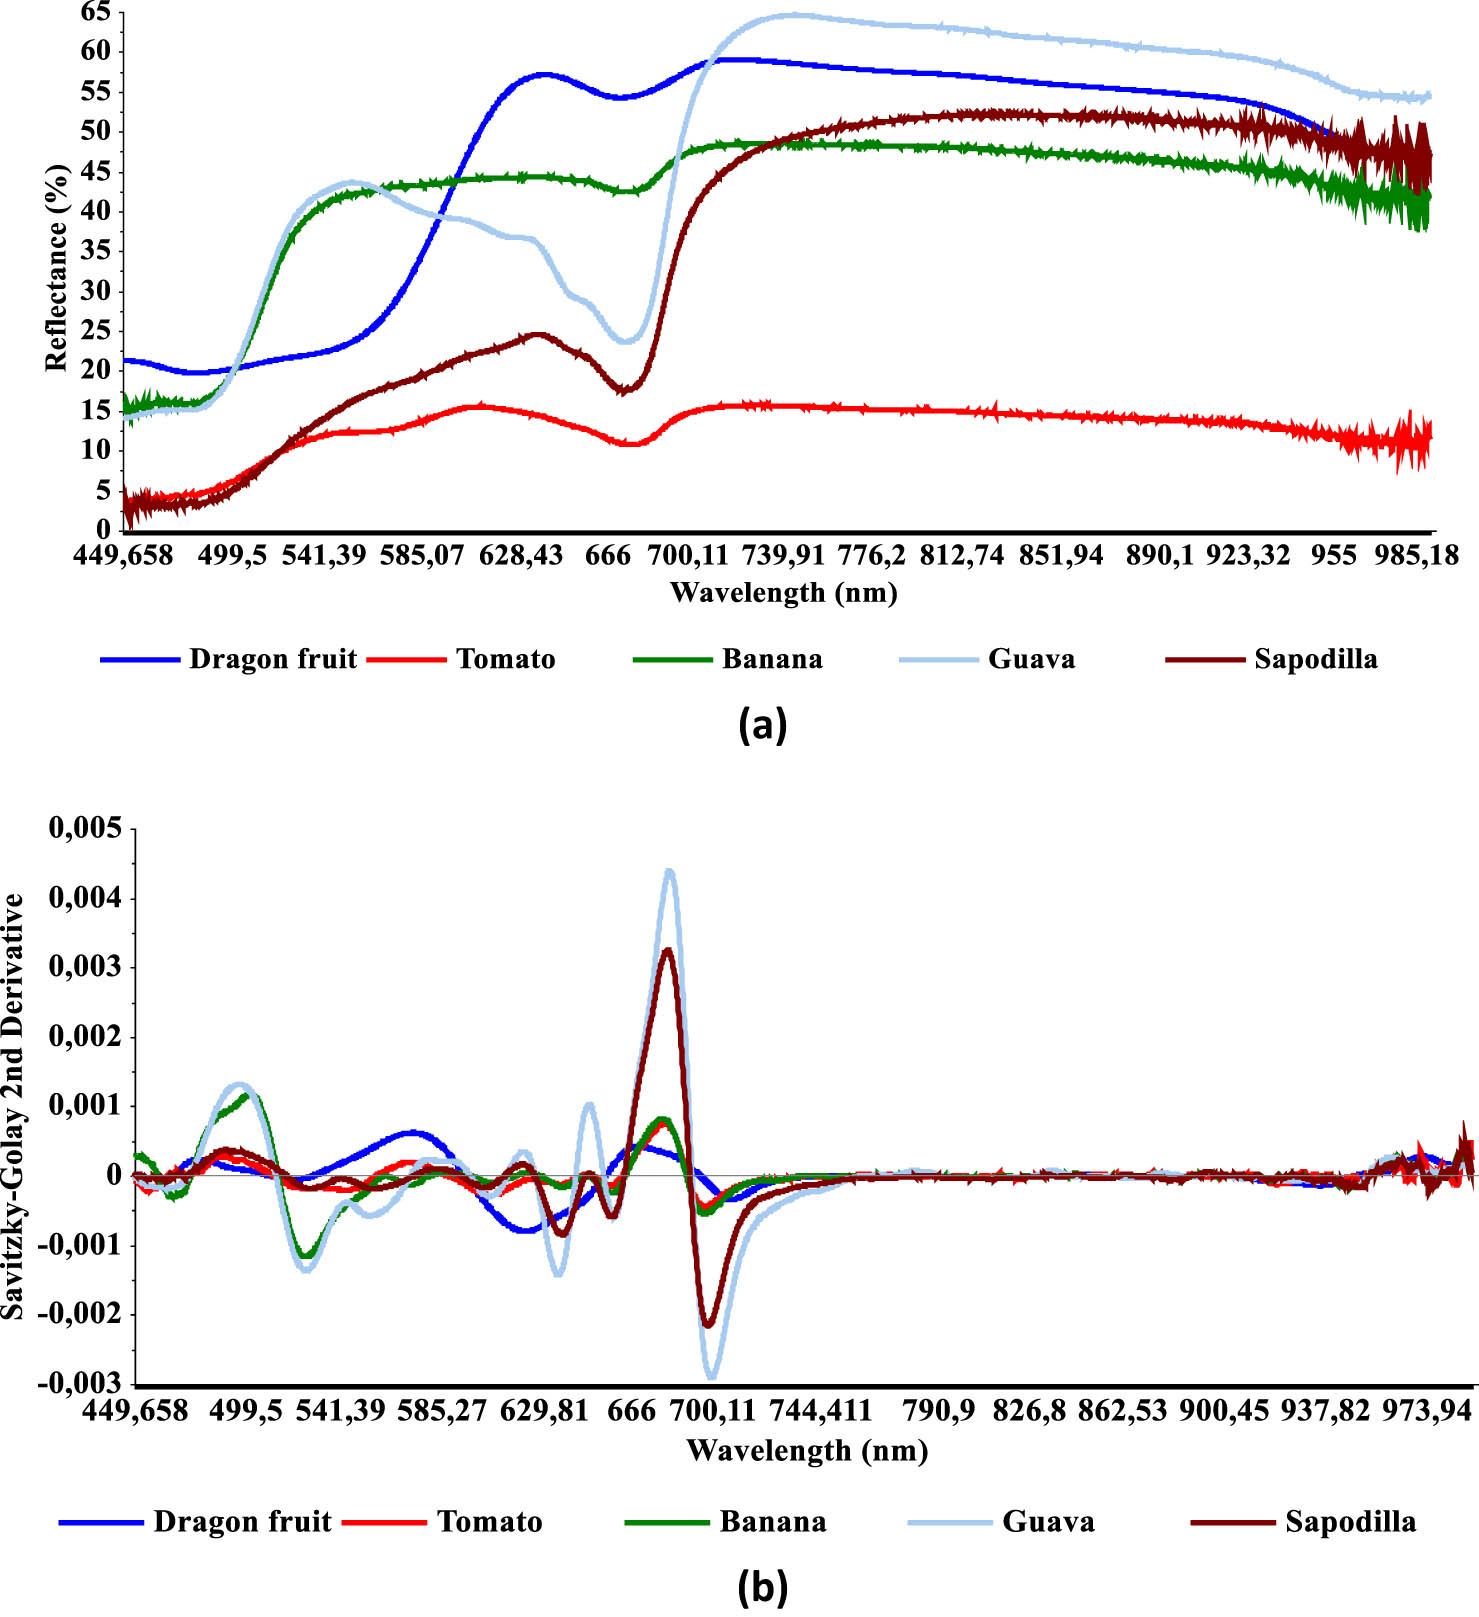
Reflectance spectra of dragon fruit, tomato, banana, guava, and sapodilla developed using (a) original spectra and (b) SGD2 spectra.
The fruit’s skin and flesh condition are related to colorimetric measurements and pigment content. Colors in fruits are created by a mixture of pigments, including the green chlorophylls, red orange, yellow carotenoids, and red, blue, and violet anthocyanins, as well as other pigments [25]. Chlorophylls, carotenoids, and anthocyanins are the most common pigments found in fruits, which influence the coloration of the whole Vis reflectance spectra of the fruit at 400–700 nm. From Figure 2a, several peaks and valleys can be observed. Region 450–500 nm refers to the reflectance of carotenoid pigment which exhibits yellow, orange, and bright red colors. However, at slightly overlapped wavelength, chlorophylls a and b are also present at 400–500 nm [24]. In general, lower light intensity reflected by tomato and sapodilla, which may be caused by higher absorption of carotenoid, compared to banana, guava, and dragon fruit. At 500–600 nm, fruit reflects intensity, which is due to its anthocyanin pigment. Anthocyanins are responsible for red, purple, and blue colors of fruits [25]. Higher reflectance at the anthocyanin region was detected for banana and guava, while lower reflectance was detected for dragon fruit, tomato, and sapodilla. Reflectance values observed at the wavelength of 680 nm are associated with chlorophyll in which dragon fruit and banana reflect higher intensity compared to guava, tomato, and sapodilla. High reflectance at 680 nm means low absorbance of chlorophyll at 680 nm. Dragon fruit having red color reflects the highest light intensity at 680 nm compared to other fruits (Figure 2a), which can be assumed that dragon fruit contains the lowest chlorophyll content.
Chlorophyll is the primary pigment in photosynthesis while carotenoids and anthocyanins are categorized as accessory pigments taking a role in secondary metabolites [26]. Chlorophyll is found in chloroplast, which adsorbs light to drive the photosynthesis process into which the chlorophyll converts CO2 and H2O into simple sugars with the help of sunlight. In addition, anthocyanins are derived from non-sugar components (aglycone or anthocyanidins), which are bound with sugar fraction [27]. Those pigments appear in the Vis wavelength; therefore, the absorption of pigments recorded by Vis–NIR spectroscopy can be used to determine SSC in fruits.
The reflectance level between fruits in the Vis and the SWNIR region differs based on the spectral appearance in Figure 2. The thickness of the fruit skin in Table 2 is 4.10 mm for dragon fruit and 3.26 mm for banana. Meanwhile, tomatoes, sapodilla, and guavas are thin-skinned fruit (0.16–0.29 mm). At Vis wavelengths of 600–700 nm, the reflectance from the lowest is tomatoes, sapodilla, guava, banana, and dragon fruit. The order of low to high reflectance is determined by the thickness of the fruit skin. However, at the SWNIR wavelength, guava has the highest reflectance, even though the skin is thin. Despite the fact that the dragon fruit skin is thicker, the reflectance spectrum is under guava. The guava’s thin skin should allow light to penetrate into the flesh of the fruit.
Morphological characteristics of fruits used in this study
| Parameters | Dragon fruit | Banana | Sapodilla | Guava | Tomato |
|---|---|---|---|---|---|
| Diameter (mm) | 88.19 | 32.07 | 53.33 | 59.45 | 51.65 |
| Skin thickness (mm) | 4.10 | 3.26 | 0.29 | 0.26 | 0.16 |
| Water content of skin (w/b%) | 92.17 | 85.59 | 79.28 | 80.54 | 91.82 |
The absorbance in the NIR region is 10–100 times lower than the fundamental absorption band in the IR electromagnetic spectrum regions [28]. That is what may cause the reflectance of dragon fruit to be high. In addition, the SWNIR area is mostly affected by water absorption features [29]. According to Table 2, the fruit skins with the highest water content are dragon fruit, tomato, guava, banana, and sapodilla. On the other hand, dragon fruit and guava have higher reflectance spectra than banana and sapodilla. Wavelength drift may be due to changes in the optical path [30]. Furthermore, [22] in the reflection optical geometry, the detector can receive the illuminated part of the fruit in the form of specular and diffuse reflectance. The shiny surface of the fruit causes specular reflectance, while the rough surface of the object causes diffuse reflectance [3].
3.3 PLSR analysis
Calibration and prediction datasets used for developing PLSR predicting SSC of dragon fruit, tomato, banana, sapodilla, and guava are shown in Table 3. The table shows that the mean values of SSC from the highest are banana, sapodilla, dragon fruit, guava, and tomato were 27.37, 19.86, 10.78, 7.25, and 4.25°Brix, respectively, for calibration datasets. Moreover, for prediction datasets, the mean values of SSC from the highest are banana, sapodilla, dragon fruit, guava, and tomato were 27.33, 19.59, 10.63, 7.14, and 4.27°Brix, respectively. The values of SD from the highest to the lowest are sapodilla, banana, dragon fruit, guava, and tomato with the SD of 2.20, 2.11, 1.16, 0.92, and 0.39°Brix, respectively, for calibration datasets. Meanwhile, for prediction datasets, SD from the highest to the lowest is sapodilla, banana, dragon fruit, guava, and tomato with the SD of 2.20, 2.15, 1.22, 0.88, and 0.35°Brix, respectively. In general, selection data for developing calibration and prediction model are appropriate since prediction datasets are within the range of calibration datasets.
To evaluate PLSR performance in this research, it is important to compare the sample characteristics as shown in Table 3 with other research reports. SSC of banana samples in this research was narrower compared to the study by ref. [5] that used banana in the SSC of 5.5–28.4°Brix and the SD of 5.48°Brix which resulted in the coefficient of determination of calibration (R 2 C) of more than 0.90. SSC of tomatoes was smaller compared to samples used by ref. [31], which were in the SSC of 3.5–7.1°Brix and the SD of 0.64°Brix, resulting in the correlation coefficient for calibration (R C) of 0.85 and the root mean square error of prediction of 0.33°Brix. Samples of sapodilla in this research were within the sample range of previous research conducted by ref. [32] that used samples with the TSS of 11.7–32.20°Brix and the SD of 2.21°Brix, which yielded the R 2 C of 0.82. Guava samples analyzed in this study had wider values compared to ref. [33] that measured TSS in guava using samples with the TSS of 7.82–8.80°Brix, which resulted in the R 2 C of 0.85. Dragon fruits in this study were in a narrower range compared to samples used by ref. [34] with the TSS of 9.20–17.60°Brix, which yielded the coefficient correlation (r) of 0.93 and the standard error of prediction of 0.66°Brix.
Table 4 shows the PLSR performance of calibration and cross-validation models developed using original and pre-processed spectra. The best calibration SSC model for each fruit based on the highest R 2 C and the lowest root mean square error of calibration (RMSEC) was obtained from SGS spectra for dragon fruit with the R 2 C and RMSEC of 0.70 and 0.52°Brix using six latent variables (LVs) and tomato with the R 2 C and RMSEC of 0.80 and 0.15°Brix using seven LVs. Moreover, calibration models were developed based on SGD2 using seven LVs, which resulted in the R 2 C of 0.88, 0.92, and 0.77, the RMSEC of 0.36, 0.36, and 0.34°Brix, for banana, sapodilla, and guava, respectively.
Calibration and prediction datasets used for predicting SSC (in °Brix) using PLSR
| Sample | N | Mean | SD | Min | Max | Range | |
|---|---|---|---|---|---|---|---|
| Calibration | Dragon fruit | 67 | 10.63 | 1.22 | 7.90 | 13.30 | 5.40 |
| Tomato | 67 | 4.25 | 0.39 | 3.40 | 5.07 | 1.67 | |
| Banana | 60 | 27.37 | 2.11 | 18.87 | 31.23 | 12.36 | |
| Sapodilla | 60 | 19.86 | 2.20 | 15.63 | 25.93 | 10.30 | |
| Guava | 60 | 7.25 | 0.92 | 5.35 | 9.85 | 4.50 | |
| Prediction | Dragon fruit | 33 | 10.78 | 1.16 | 8.43 | 13.20 | 4.77 |
| Tomato | 33 | 4.27 | 0.35 | 3.60 | 5.07 | 1.47 | |
| Banana | 40 | 27.33 | 2.15 | 19.17 | 31.20 | 12.03 | |
| Sapodilla | 40 | 19.59 | 2.30 | 14.47 | 24.50 | 10.03 | |
| Guava | 40 | 7.14 | 0.88 | 5.50 | 9.00 | 3.50 |
N – number of samples; SD – standard deviation; Min – minimum; Max – maximum.
The reflectance in fruit samples is dominated by specular reflectance [3] and influenced by fruit skin characteristics [35]. Based on Table 4, low R 2 C belonged to dragon fruit and guava, which guava has the thinner skin, and higher R 2 C belonged to banana, sapodilla, and tomato, which banana has thinner skin. Fruit skin influences the amount of light, which enters the fruit [36]. Subedi and Walsh [37] reported the thickness of the banana skin affected the dry matter model. Likewise for the determination of dry matter in avocado, by using various Vis–NIR instruments, Subedi and Walsh [16] reported the better R 2 for PLSR in skin-removed compared to intact fruits. Arendse et al. [38] reviewed several studies of SSC fruits with thick rinds, which were measured using Vis–SWNIR (300–1,100 nm) and IR (up to 2,400 nm) regions. Some of results were satisfactory by using the Vis–SWNIR region such as watermelon, melon, passion fruit, and pomegranate. This is due to the higher energy at Vis, which allows deeper light penetration. The NIR wavelength is 700–900 nm, and the maximum light penetration is 4 mm. At higher wavelengths, 900–1,900 nm, the maximum light penetration is only about 2–3 mm [14]. Moreover, Guthrie et al. [39,40] obtained unsatisfactory results for predicting SSC in pineapple and melon using NIR spectroscopy. Furthermore, not just does the peel thickness obstruct NIRS capability, yet also the non-uniformity of internal fruit pulp as well as macrostructures including hard black seeds [3]. Dragon fruit and guava were observed to have large amounts of small grains in the pulp, resulting in the low performance of the calibration model. In short, all the best-selected calibration models have R 2 C between 0.70 and 0.92, which is applicable for screening even for quality assurance [41].
PLSR calibration and cross-validation model performance for predicting SSC (°Brix)
| Fruit | ORI | SNV | AN | MSC | SGS | SGD2 | |
|---|---|---|---|---|---|---|---|
| Dragon fruit | R 2 C | 0.63 | 0.49 | 0.55 | 0.49 | 0.70 | 0.59 |
| RMSEC | 0.57 | 0.73 | 0.45 | 0.64 | 0.52 | 0.47 | |
| R 2 CV | 0.57 | 0.43 | 0.48 | 0.42 | 0.65 | 0.53 | |
| RMSECV | 0.62 | 0.78 | 0.49 | 0.69 | 0.57 | 0.51 | |
| LV | 6 | 7 | 5 | 5 | 6 | 4 | |
| Tomato | R 2 C | 0.74 | 0.77 | 0.58 | 0.59 | 0.80 | 0.5 |
| RMSEC | 0.12 | 0.13 | 0.17 | 0.18 | 0.15 | 0.14 | |
| R 2 CV | 0.55 | 0.62 | 0.46 | 0.5 | 0.62 | 0.41 | |
| RMSECV | 0.15 | 0.17 | 0.18 | 0.29 | 0.21 | 0.15 | |
| LV | 5 | 5 | 4 | 4 | 7 | 2 | |
| Banana | R 2 C | 0.78 | 0.82 | 0.83 | 0.8 | 0.79 | 0.88 |
| RMSEC | 0.6 | 0.56 | 0.51 | 0.64 | 0.63 | 0.36 | |
| R 2 CV | 0.71 | 0.73 | 0.76 | 0.71 | 0.74 | 0.82 | |
| RMSECV | 0.69 | 0.69 | 0.63 | 0.77 | 0.71 | 0.46 | |
| LV | 7 | 7 | 7 | 7 | 7 | 7 | |
| Sapodilla | R 2 C | 0.74 | 0.88 | 0.84 | 0.87 | 0.78 | 0.92 |
| RMSEC | 0.62 | 0.47 | 0.65 | 0.54 | 0.59 | 0.36 | |
| R 2 CV | 0.65 | 0.81 | 0.77 | 0.8 | 0.72 | 0.87 | |
| RMSECV | 0.73 | 0.62 | 0.78 | 0.68 | 0.67 | 0.46 | |
| LV | 7 | 7 | 7 | 7 | 7 | 7 | |
| Guava | R 2 C | 0.67 | 0.66 | 0.61 | 0.65 | 0.57 | 0.77 |
| RMSEC | 0.42 | 0.45 | 0.47 | 0.44 | 0.5 | 0.34 | |
| R 2 CV | 0.63 | 0.6 | 0.57 | 0.58 | 0.52 | 0.69 | |
| RMSECV | 0.45 | 0.48 | 0.5 | 0.49 | 0.53 | 0.39 | |
| LV | 6 | 4 | 7 | 6 | 6 | 7 |
ORI – original spectra, SNV – standard normal variate, MSC – multiple scatter correction, AN – area normalized, SGS – Savitzky–Golay smoothing, SGD2 – Savitzky–Golay second derivative.
Apart from skin thickness, concentrations of targeted analyte also affect the performance of the PLSR calibration model. Sapodilla and banana have higher SSC compared to dragon fruit, guava, and tomato. According to Table 4, sapodilla and banana have higher R 2 C and lower RMSEC compared to dragon fruit, guava, and tomato. Sim and Kimura [42] found that prediction of moisture in transformer oil and lubricating oil was poorer in the low moisture concentration samples compared to the high ones. A similar finding was reported by ref. [37] in which bananas containing higher SSC had higher R 2 compared to the lower ones. There is a high correlation between SSC concentration and firmness, so that firmness decreases as the concentration of sugars and/or by-products increases, causing cell wall disassembly and degradation, which induces increased absorption above 900 nm [43].
Prediction of the SSC content is also affected by the light absorption of fruit skin and internal fruit structure. Skin or peel of fruit is critical in determining internal fruit quality since the IR light is scattered or absorbed by peel before it reaches the pulp [44]. Chlorophyll and other color pigments in fruits are mostly present in the peel [45]. Chlorophylls, which are the majority pigments present in some fruits, are inversely related to SSC during ripening [24] and, thus, can be used to predict SSC. Wang et al. [45] reported that the PLS model yielded a higher correlation (r) for navel orange intact fruits compared to the peeled fruits. The inclusion of the Vis region in reflectance mode produced better results compared to the only SWNIR used in the PLSR model. Although the SSC of peel of navel orange was higher compared to its pulp, Wang et al. [46] confirmed that the spectra of peels contained valuable information about SSC of pulp. However, in contrast, Wang et al. [47] achieved better results for banana pulp compared to intact banana by considering the mesocarp TSS content, which was highly correlated (R 2 > 0.85) with Hunter a and a/b skin color. Based on Table 4, fruits that contain higher chlorophyll (perceived from the peel color) such as tomato, banana, sapodilla, and guava, show higher R 2 and lower RMSE compared to red dragon fruit. If the surface layer of the sample is the same as the inner layer of the fruit flesh, the content of the fruit skin can be used to provide information about dry matter, dyes, sugars, and other constituents [8].
Not only peel, but also internal food structure affects the light reflectance of fruit. Optical absorption and scattering properties are induced by structural properties and chemical changes of the product [18,43]. Tomato is heterogeneous internal structure fruit with watery and seeds. Although it has a thin skin, it is different from sapodilla, which is included in the homogeneous pulp thin skin with similar anatomical features such as the homogeneous pericarp in apricot. Based on the results of the reflectance spectra, the internal structure of tomato, which contains high water, has lower reflectance intensity than sapodilla at C–H and O–H absorption wavelengths. Although guava also has a heterogeneous internal structure, the pericarp structure layer has a harder texture than the pulp region, which also contains a lot of seeds, resulting in a high reflectance spectra [47]. The experimental results show that the SSC model’s prediction accuracy and the accuracy of SSC online sorting of peach are higher than that of the navel orange. Therefore, it confirms that under the same detection device, when the light passes through the two kinds of fruits, the peach reflects more light. The soft flesh leads to a lower opacity and greater light penetration [43]. The navel orange is a citrus fruit with no or small grains inside, which does not affect the optical path [47]. As in bananas with a thick skin but small seeds in the flesh compared to guava and sapodilla, at a wavelength of 700–1,000 nm, there is lower reflectance than guava, sapodilla, and dragon fruit, but when compared to tomatoes, the reflectance of bananas is much higher. However, dragon fruit allows thick skin to act as a barrier and prevents to predict the composition of internal pulp [18]; the model results (Figure 3) show the dominant color pigment information at Vis than SWNIR wavelengths.
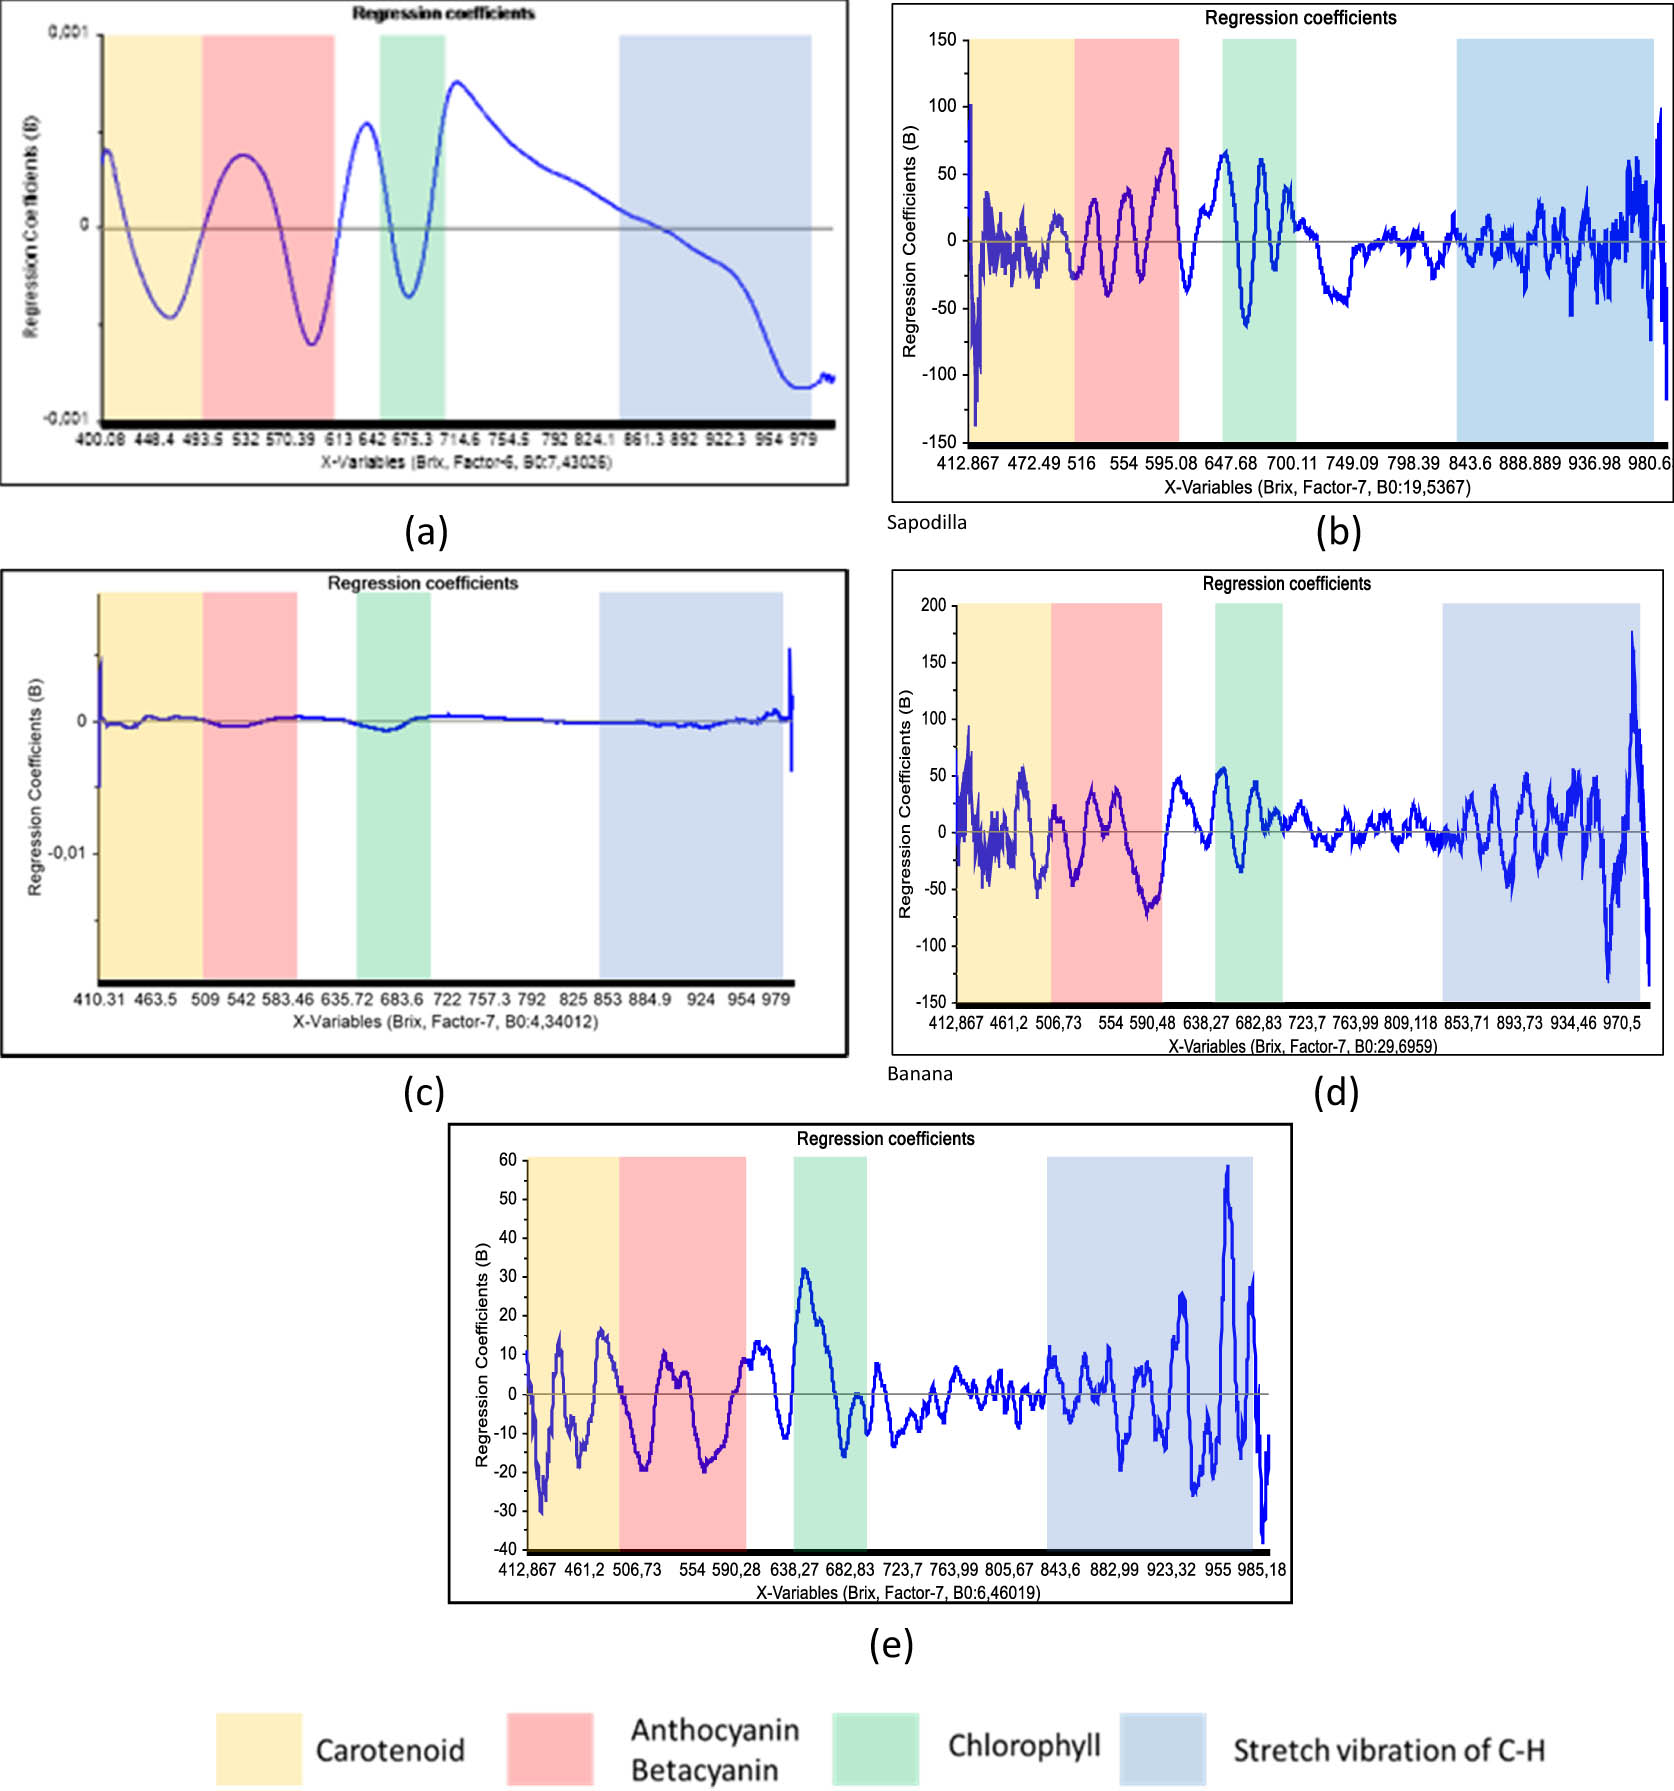
Regression coefficient from the best PLSR model for (a) dragon fruit, (b) sapodilla, (c) tomato, (d) banana, and (e) guava.
The sensitive wavelengths reflecting the spectral characteristics for SSC were obtained based on the regression coefficients (B), in each fruit calibration model shown in Figure 3 shows the peaks appear between 400–700 nm in Vis area and between 840 and 980 nm in SWNIR. The peak at 980 nm seems to be due to water stretching vibrations. Water binds to solutes, such as sugar groups, such that SSC information is still present on SWNIR [48]. The highest positive and negative peaks, which are associated to H2O and carbon-hydrogen functional group in SWNIR wavelength, appeared at 969, 979, 985, and 990 nm in sapodilla, 992 and 994 nm in tomato, 960, 979, and 989 nm in banana, 979 nm in dragon fruit, and 938, 962, 979, and 986 nm in guava. All samples showed the same peak at 979 nm, except for tomato. According to the previous research, regions that included the sugar information are located below the wavelength of 1,000 nm, specifically 810–820, 868, 880–890, 910–940, and 980–995 nm [49]. The best result of the sapodilla, banana, and guava calibration models that were preprocessed by SGD2 seems to be more pronounced in the SWNIR area, which is the overlay of the 3rd overtones of C–H stretch and the 2nd and 3rd overtones of O–H [50]. Tomatoes and dragon fruit were built by SGS. Tomatoes are one of the fruits that contain high water content, so the absorption is very easily influenced by water (O–H bonds) in the SWNIR region [31]. The coefficient of regression of the tomato model is quite low due to the dominance of water absorption, which causes noise. The dragon fruit is fairly obvious in the Vis wavelength range but not in the SWNIR region. The preprocessing procedure is used to raise the spectra, but there is over-smoothing and polishing of spectral data, which results in the loss of valuable information [51].
The performance of the final predicted model was built by following the calibration model result. First, the highest coefficient correlation of calibration (R 2 C) and the lowest RMSEC. Prediction model shown in Figure 4, the PLS models from sapodilla and banana, showed satisfactory performance, providing better prediction results than others. According to the prediction model performance standards [41], the coefficient correlation of prediction (R 2 p) in the banana and sapodilla samples, namely 0.885 and 0.905, should be used with caution in various applications. The guava with the R 2 p score of 0.769 can still be utilized as a screening criterion and in some other “approximate” applications [41]. Tomatoes and dragon fruit R 2 p 0.646 and 0.596, respectively, are not recommended to be used and require additional research [41]. The predictive model for tomatoes was equally poor. Despite having the lowest RMSE, fruits with thinner skin and the lowest SD in the observed data (0.33%), led to a decrease in the model [37]. Variability in the chemical composition of the samples observed has the potential to provide a robust and reliable predictive model for several biomass species [52]. It is difficult to achieve an acceptable fruit quality prediction model for SSC assessment of rough and thick-skinned fruits such as dragon fruit compared to smooth and thin-skinned fruits using the reflectance mode due to the effects of light scattering and higher skin thickness [53]. Dragon fruit has the lowest prediction model for SSC with the highest RMSE value and at the same time has a high skin thickness.
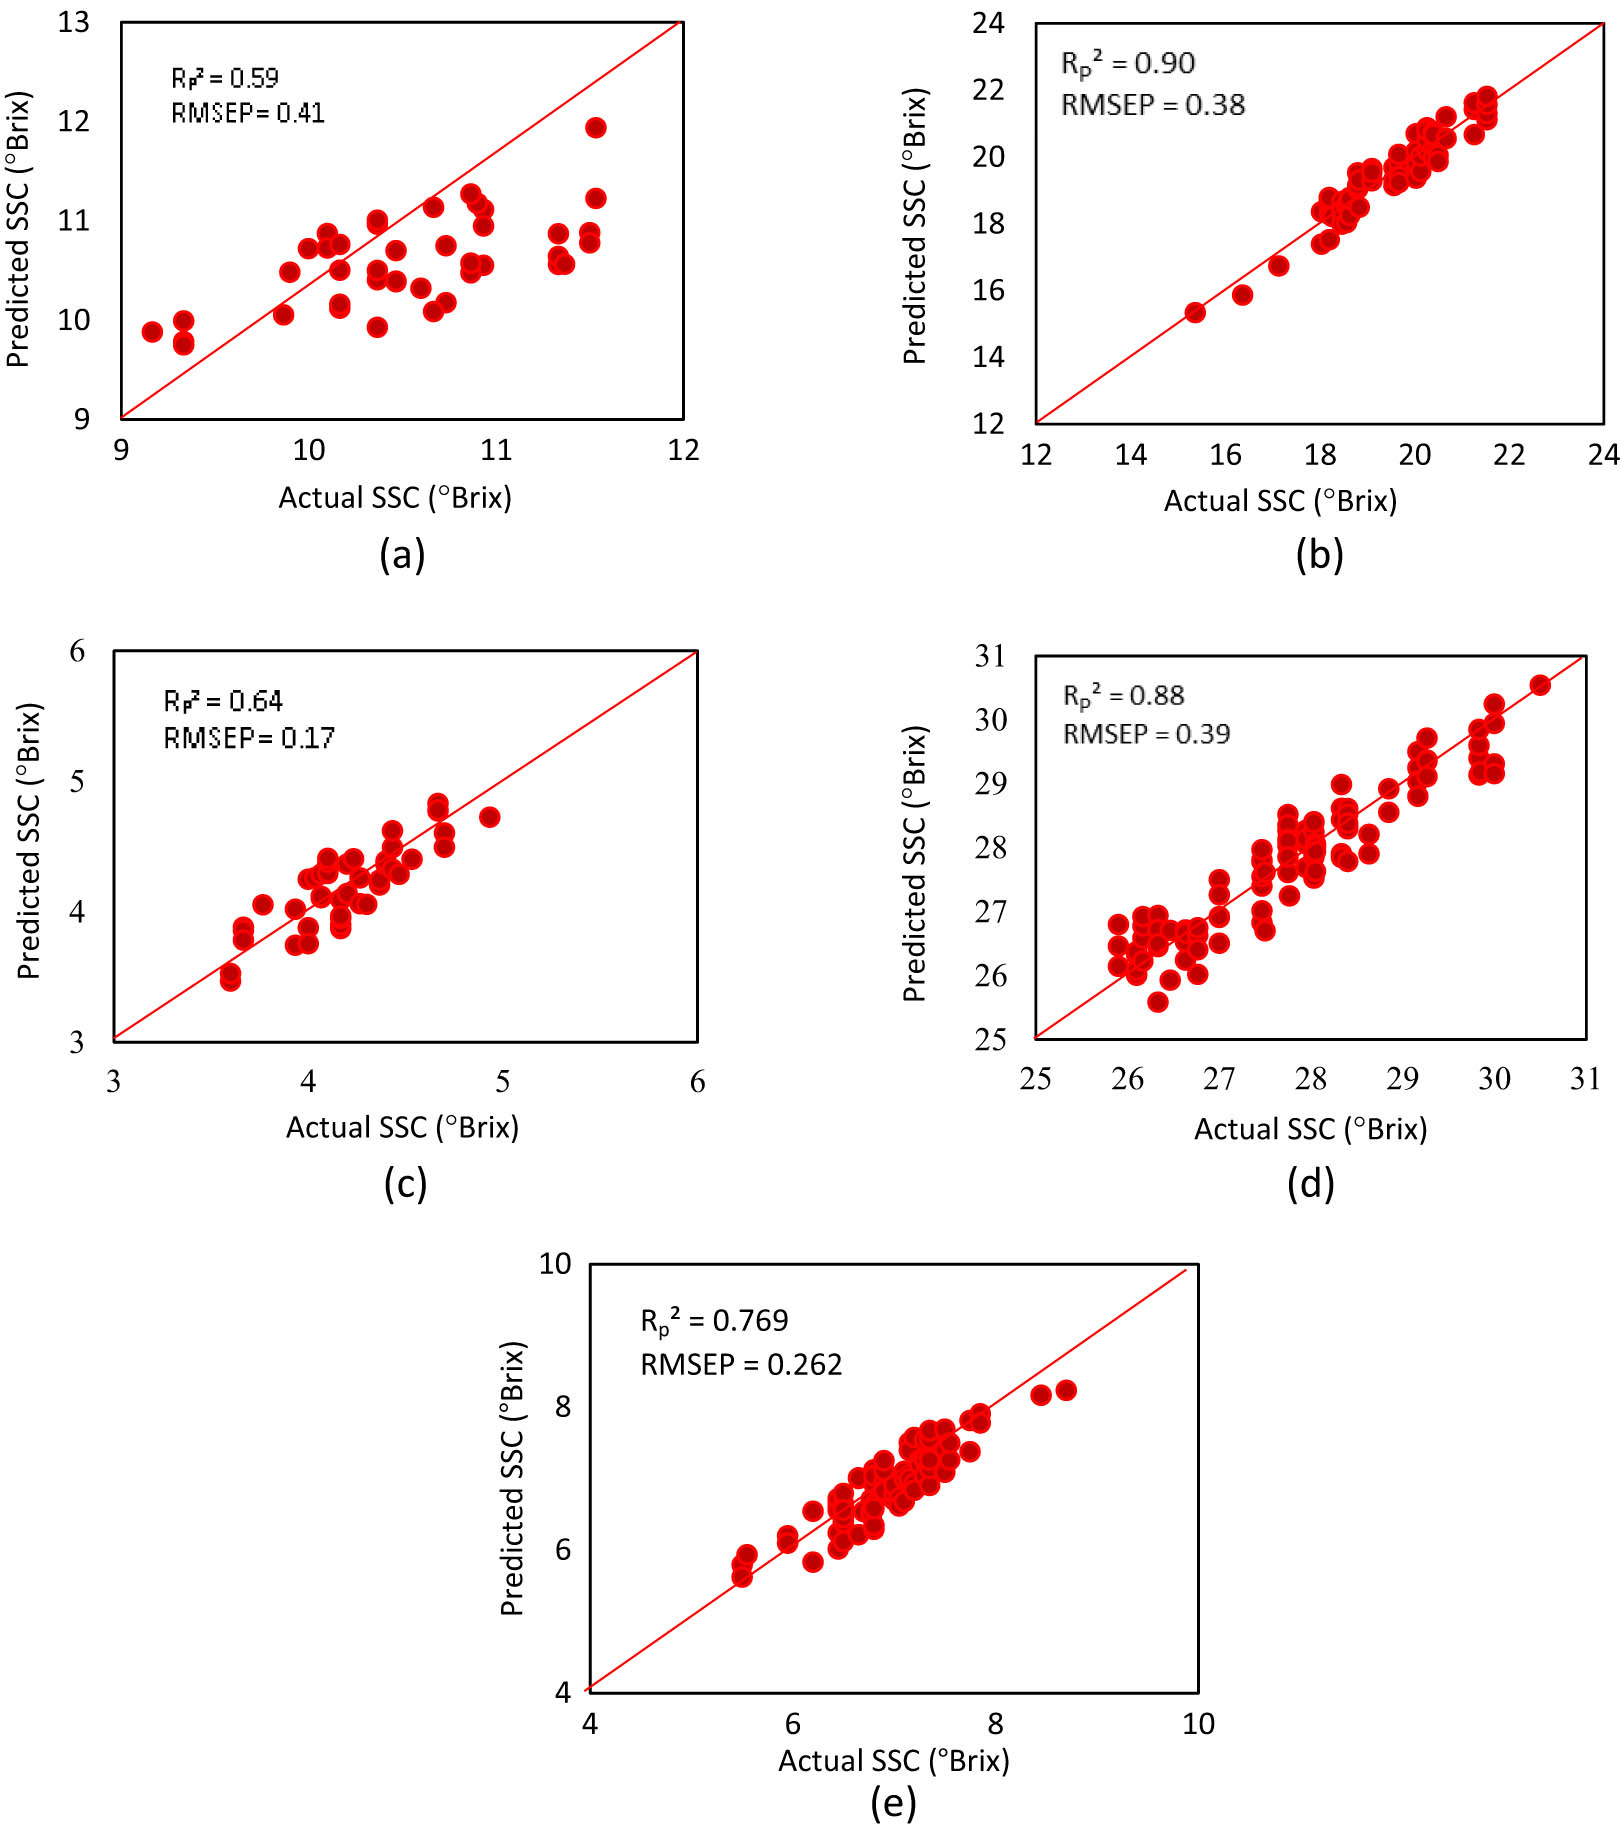
Scatter plots between actual SSC versus Vis–NIR-predicted SSC values of validation sets: (a) dragon fruit, (b) sapodilla, (c) tomato, (d) banana, and (e) guava.
4 Conclusions
The coefficient correlation of prediction (R 2 p) in the banana and sapodilla samples should be used with caution in various applications. The guava with R 2 p score can still be utilized as a screening criterion and in some other “approximate” applications. However, the SSC prediction model for tomatoes and dragon fruit is not recommended to use and requires additional research. Pre-processing of fruit spectra produced the best calibration model in this study. Compared to using the calibration model on the original spectra, the preprocessing technique was very helpful in improving the prediction model in this study.
The effect of skin thicknesses and fruit type on the assessment of SSC quality parameters has been investigated in this article. In addition to skin thickness, SSC prediction model for different fruit types is influenced by SSC concentration, optical reflectance geometry, and fruit internal structure. To this end, dragon fruit has been modeled and produces the lowest correlation coefficient in the calibration and prediction models. The errors in the estimates tend to increase with the increasing thickness of fruit in this study. Although bananas have thicker skins than guava, sapodilla, and tomatoes, the structure of banana flesh with small seeds and banana skin provides information that is related to the internal composition of the fruit and can be used in SSC model building. Even though the fruit skin acts as a barrier to light reaching the flesh in thick-skinned fruit, the content of fruit skins that have linearity to the chemical composition of the fruit flesh can help predictive models. Tomato with heterogeneous internal structure, thin skin, and high moisture content with a low standard derivative of SSC has a low predictive model because it is influenced by water absorption. It is possible to use the nondestructive technique to measure the internal quality of the fruit by taking into account the thickness of the skin and the light-penetrating ability of Vis–NIR spectroscopy.
Acknowledgments
Data used in this article are parts of Evia Zunita Dwi Pratiwi’s Graduate (Master) thesis report from the Department of Agricultural and Biosystems Engineering, Faculty of Agricultural Technology, Universitas Gadjah Mada. Great appreciation is delivered to Universitas Gadjah Mada for financial support under Hibah Rekognisi Tugas Akhir No: 2920/UN1/DITLIT/Dit-Lit/PT.01.05/2022.
-
Funding information: The study was funded by sources of Universitas Gadjah Mada, grant number: 2920/UN1/DITLIT/Dit-Lit/PT.01.05/2022.
-
Conflict of interest: The authors state no conflict of interest.
-
Data availability statement: The datasets generated during and/or analyzed during the current study are available from the corresponding author on reasonable request.
References
[1] Dongare ML, Buchade PB, Awatade MN, Shaligram AD. Mathematical modeling and simulation of refractive index based Brix measurement system. Optik (Stuttg). 2014;125(3):946–9.10.1016/j.ijleo.2013.09.002Suche in Google Scholar
[2] Magwaza LS, Opara UL. Analytical methods for determination of sugars and sweetness of horticultural products – A review. Sci Hortic. 2015;5(2):179–92.10.1016/j.scienta.2015.01.001Suche in Google Scholar
[3] Nicolaï BM, Beullens K, Bobelyn E, Peirs A, Saeys W, Theron KI, et al. Nondestructive measurement of fruit and vegetable quality by means of NIR spectroscopy: A review. Postharvest Biol Technol. 2007;46(2):99–118.10.1016/j.postharvbio.2007.06.024Suche in Google Scholar
[4] Masithoh RE, Haff R, Kawano S. Determination of soluble solids content and titratable acidity of intact fruit and juice of satsuma Mandarin using a hand-held near infrared instrument in transmittance mode. J Infrared Spectrosc. 2016;24(1):83–8.10.1255/jnirs.1196Suche in Google Scholar
[5] Masithoh RE, Pahlawan MFR, Wati RK. Non-destructive determination of SSC and pH of banana using a modular Vis/NIR spectroscopy: comparison of Partial Least Square (PLS) and Principle Component Regression (PCR). In IOP Conference Series: Earth and Environmental Science. IcoSA 2020: Proceeding of the 3rd International Conference on Sustainable Agriculture, 2020 Oct 13–14, Yogyakarta, Indonesia, Bristol: IOP Publishing Ltd; 2021.10.1088/1755-1315/752/1/012047Suche in Google Scholar
[6] Chia KS, Rahim HA, Rahim RA. Prediction of soluble solids content of pineapple via non-invasive low cost visible and shortwave near infrared spectroscopy and artificial neural network. Biosyst Eng. 2012;113(2):158–65.10.1016/j.biosystemseng.2012.07.003Suche in Google Scholar
[7] Travers S, Bertelsen MG, Petersen KK, Kucheryavskiy SV. Predicting pear (cv. Clara Frijs) dry matter and soluble solids content with near infrared spectroscopy. LWT-Food Sci Technol. 2014;59(2 Pt 1):1107–13.10.1016/j.lwt.2014.04.048Suche in Google Scholar
[8] Krivoshiev GP, Chalucova RP, Moukarev MI. A possibility for elimination of the interference from the peel in nondestructive determination of the internal quality of fruit and vegetables by Vis/NIR spectroscopy. LWT-Food Sci Technol. 2000;33(5):344–53.10.1006/fstl.2000.0669Suche in Google Scholar
[9] Kasampalis DS, Tsouvaltzis P, Ntouros K, Gertsis A, Gitas I, Siomos AS. The use of digital imaging, chlorophyll fluorescence and Vis/NIR spectroscopy in assessing the ripening stage and freshness status of bell pepper fruit. Comput Electron Agric. 2021;187:1–11.10.1016/j.compag.2021.106265Suche in Google Scholar
[10] Hsieh C, Lee Y. Applied visible/near-infrared spectroscopy on detecting the sugar content and hardness of pearl guava. Appl Eng Agriculture. 2005;21(6):1039–46.10.13031/2013.20020Suche in Google Scholar
[11] Wati RK, Pahlawan MFR, Masithoh RE. Development of calibration model for pH content of intact tomatoes using a low-cost Vis/NIR spectroscopy. In IOP Conference Series. Proceeding of The International Conference on Smart and Innovative Agriculture, 2020 Nov 4–5. Yogyakarta, Indonesia, Bristol: IOP Publishing Ltd; 2021.10.1088/1755-1315/686/1/012049Suche in Google Scholar
[12] Priambodo DC, Saputro D, Pahlawan MFR, Masithoh RE. Determination of Acid Level (pH) and moisture content of cacao beans at various fermentation level using visible near-infrared (Vis-NIR) spectroscopy. In IOP Conference Series: Earth and Environment. IcoSA 2021: Proceeding of the 4th International Conference on Sustainable Agriculture; 2021 Aug 25–26. Yogyakarta, Indonesia, Bristol: IOP Publishing Ltd; 2022.Suche in Google Scholar
[13] Carlini P, Massantini R, Mencarelli F, Carlini P, Massantini R, Mencarelli F. Vis-NIR measurement of soluble solids in cherry and apricot by PLS regression and wavelength selection. J Agric Food Chem. 2000;48(11):5236–42.10.1021/jf000408fSuche in Google Scholar PubMed
[14] Lammertyn J, Peirs A, De Baerdemaeker J, Nicolaı B. Light penetration properties of NIR radiation in fruit with respect to non-destructive quality assessment. Postharvest Biol Technol. 2000;18(2):121–32.10.1016/S0925-5214(99)00071-XSuche in Google Scholar
[15] Phuangsombut K, Phuangsombut A, Talabnark A, Terdwongworakul A. Empirical reduction of rind effect on rind and flesh absorbance for evaluation of durian maturity using near infrared spectroscopy. Postharvest Biol Technol. 2018;142:55–9.10.1016/j.postharvbio.2018.04.004Suche in Google Scholar
[16] Subedi PP, Walsh KB. Assessment of avocado fruit dry matter content using portable near infrared spectroscopy: Method and instrumentation optimisation. Postharvest Biol Technol. 2020;161:1–10.10.1016/j.postharvbio.2019.111078Suche in Google Scholar
[17] Arendse E, Fawole OA, Magwaza LS, Opara UL. Non-destructive prediction of internal and external quality attributes of fruit with thick rind: A review. J Food Eng. 2018;217:11–23.10.1016/j.jfoodeng.2017.08.009Suche in Google Scholar
[18] de Oliveira GA, Bureau S, Renard CMGC, Pereira-Netto AB, de Castilhos F. Comparison of NIRS approach for prediction of internal quality traits in three fruit species. Food Chem. 2014;143:223–30.10.1016/j.foodchem.2013.07.122Suche in Google Scholar PubMed
[19] Jiao Y, Li Z, Chen X, Fei S. Preprocessing methods for near-infrared spectrum calibration. J Chemom. 2020;34(11):1–19.10.1002/cem.3306Suche in Google Scholar
[20] Zeaiter M, Roger JM, Bellon-Maurel V. Robustness of models developed by multivariate calibration. Part II: The influence of pre-processing methods. TrAC-Trends Anal Chem. 2005;24(5):437–45.10.1016/j.trac.2004.11.023Suche in Google Scholar
[21] Kuang B, Mouazen AM. Calibration of visible and near infrared spectroscopy for soil analysis at the field scale on three European farms. Eur J Soil Sci. 2011;62(4):629–36.10.1111/j.1365-2389.2011.01358.xSuche in Google Scholar
[22] Walsh KB, Blasco J, Zude-Sasse M, Sun X. Visible-NIR ‘point’ spectroscopy in postharvest fruit and vegetable assessment: The science behind three decades of commercial use. Postharvest Biol Technol. 2020;168:1–17.10.1016/j.postharvbio.2020.111246Suche in Google Scholar
[23] Cayuela JA. Vis/NIR soluble solids prediction in intact oranges ( Citrus sinensis L.) cv. Valencia Late by reflectance. Postharvest Biol Technol. 2008;47(1):75–80.10.1016/j.postharvbio.2007.06.005Suche in Google Scholar
[24] Afonso AM, Antunes MD, Cruz S, Cavaco AM, Guerra R. Non-destructive follow-up of ‘Jintao’ kiwifruit ripening through VIS-NIR spectroscopy – individual vs average calibration model’s predictions. Postharvest Biol Technol. 2022;188:1–11.10.1016/j.postharvbio.2022.111895Suche in Google Scholar
[25] Choo WS. Fruit pigment changes during ripening. In Melton L, Shahidi F, Varelis P, editors. Encyclopedia of Food Chemistry. Oxford: Academic Press; 2019.10.1016/B978-0-08-100596-5.21656-9Suche in Google Scholar
[26] Khoo HE, Azlan A, Tang ST, Lim SM. Anthocyanidins and anthocyanins: Colored pigments as food, pharmaceutical ingredients, and the potential health benefits. Food Nutr Res. 2017;61(1):1–21.10.1080/16546628.2017.1361779Suche in Google Scholar PubMed PubMed Central
[27] Saha S, Singh J, Paul A, Sarkar R, Khan Z, Banerjee K. Anthocyanin profiling using UV-Vis spectroscopy and liquid chromatography mass spectrometry. J AOAC Int. 2019;103:1–17.10.5740/jaoacint.19-0201Suche in Google Scholar PubMed
[28] Magwaza LS, Opara UL, Nieuwoudt H, Cronje PJR, Saeys W, Nicolaï B. NIR spectroscopy applications for internal and external quality analysis of citrus fruit-A review. Food Bioprocess Technol. 2012;5:425–44.10.1007/s11947-011-0697-1Suche in Google Scholar
[29] Golic MI, Alsh KW, Lawson P. Short-wavelength near-infrared spectra of sucrose, glucose, and fructose with respect to sugar concentration and temperature. Appl Spectrosc. 2003;57(2):139–45.10.1366/000370203321535033Suche in Google Scholar PubMed
[30] Zude M, Pflanz M, Kaprielian C, Aivazian BL. NIRS as a tool for precision horticulture in the citrus industry. Biosyst Eng. 2008;99(3):455–9.10.1016/j.biosystemseng.2007.10.016Suche in Google Scholar
[31] Huang Y, Lu R, Chen K. Assessment of tomato soluble solids content and pH by spatially-resolved and conventional Vis/NIR spectroscopy. J Food Eng. 2018;236:19–28.10.1016/j.jfoodeng.2018.05.008Suche in Google Scholar
[32] Kusumiyati, Mubarok S, Sutari W, Farida, Hamdani JS, et al. Non-destructive method for predicting sapodilla fruit quality using near infrared spectroscopy. In IOP Conf Ser Earth Environ Sci Proceeding of The 3rd Sustainable Agriculture And Food Security (3rdICSAFS): Innovation And Technology; 2018 Aug 29–30. Bandung, Indonesia. Bristol: IOP Publishing Ltd; 2019.10.1088/1755-1315/334/1/012045Suche in Google Scholar
[33] Kusumiyati, Hadiwijaya Y, Putri IE, Mubarok S, Hamdani JS. Rapid and non-destructive prediction of total soluble solids of guava fruits at various storage periods using handheld near-infrared instrument. In IOP Conf Ser Earth Environ Sci Proceeding of The 2nd International Conference on Sustainable Agriculture; 2019 Jul 30–31. Yogyakarta, Indonesia. Bristol: IOP Publishing Ltd; 2020.10.1088/1755-1315/458/1/012022Suche in Google Scholar
[34] Budiastra IW, Dzikri MRS. Effect of chemometrics to accuracy of NIR spectroscopy in predicting total soluble solid and hardness of dragon fruit. In IOP Conf Ser Earth Environ Sci. AESAP 2021: Proceefding of The 4th International Conference on Agricultural Engineering for Sustainable Agriculture Production; 2021 Nov 11.; Online. Bristol: IOP Publishing Ltd; 2022.10.1088/1755-1315/1038/1/012042Suche in Google Scholar
[35] Manickavasagan A, Ganeshmoorthy K, Claereboudt MR, Al-Yahyai R, Khriji L. Non-destructive measurement of total soluble solid (TSS) content of dates using near infrared (NIR) imaging. Emir J Food Agric. 2014;26(11):970–6.10.9755/ejfa.v26i11.18102Suche in Google Scholar
[36] Vaudelle F, L’Huillier JP. Influence of the size and skin thickness of apple varieties on the retrieval of internal optical properties using Vis/NIR spectroscopy: A Monte Carlo-based study. Comput Electron Agric. 2015;116:137–49.10.1016/j.compag.2015.06.009Suche in Google Scholar
[37] Subedi PP, Walsh KB. Assessment of sugar and starch in intact banana and mango fruit by SWNIR spectroscopy. Postharvest Biol Technol. 2011;62(3):238–45.10.1016/j.postharvbio.2011.06.014Suche in Google Scholar
[38] Arendse E, Fawole OA, Magwaza LS, Opara UL. Non-destructive prediction of internal and external quality attributes of fruit with thick rind: A review. J Food Eng. 2018;217:11–23.10.1016/j.jfoodeng.2017.08.009Suche in Google Scholar
[39] Guthrie J, Walsh K. Non-invasive assessment of pineapple and mango fruit quality using near infrared spectroscopy. Aust J Exp Agric. 1997;37:253–63.10.1071/EA96026Suche in Google Scholar
[40] Guthrie JA, Liebenberg CJ, Walsh KB. NIR model development and robustness in prediction of melon fruit total soluble solids. Aust J Agric Res. 2006;57(4):1–8.10.1071/AR05123Suche in Google Scholar
[41] Williams PC. Implementation of near-infrared technology. In: Williams PC, Noris K, editors. Near-infrared technology in the agricultural and food industries. 2nd edn. Minnesota: The American Association of Cereal Chemist, Inc; 2001.Suche in Google Scholar
[42] Sim SS, Kimura ALJ. Partial least squares (PLS) integrated fourier transform infrared (FTIR) approach for prediction of moisture in transformer oil and lubricating oil. J Spectrosc. 2019;2019:1–10.10.1155/2019/5916506Suche in Google Scholar
[43] Cavaco AM, Pinto P, Antunes MD, da Silva JM, Guerra R. “Rocha” pear firmness predicted by a Vis/NIR segmented model. Postharvest Biol Technol. 2009;51(3):311–9.10.1016/j.postharvbio.2008.08.013Suche in Google Scholar
[44] Silva L, Cavaco AM, Antunes MD, Guerra R. Effect of orange peel in whole oranges’ spectra. Actas Portuguesas de Horticultura. 2016;28(2):352–9.Suche in Google Scholar
[45] Wang A, Hu D, Xie L. Comparison of detection modes in terms of the necessity of visible region (VIS) and influence of the peel on soluble solids content (SSC) determination of navel orange using VIS-SWNIR spectroscopy. J Food Eng. 2014;126:126–32.10.1016/j.jfoodeng.2013.11.011Suche in Google Scholar
[46] Wang A, Wang C, Xie L. Influence of the peel on predicting soluble solids content of navel oranges using visible and near-infrared spectroscopy. Trans ASABE. 2016;59(1):31–7.10.13031/trans.59.11152Suche in Google Scholar
[47] Wang G, Liu Y, Li X, Zhang Y, Wang J, Jiang X. Differences in optical properties of fruit tissues between stone fruits and citrus fruits. Infrared Phys Technol. 2021;112:1–10.10.1016/j.infrared.2020.103599Suche in Google Scholar
[48] Liu R, Qi S, Lu J, Han D. Measurement of soluble solids content of three fruit species using universal near infrared spectroscopy models. J Infrared Spectrosc. 2015;23(5):301–9.10.1255/jnirs.1156Suche in Google Scholar
[49] Choi JH, Chen PA, Lee BHN, Yim SH, Kim MS, Bae YS, et al. Portable, non-destructive tester integrating VIS/NIR reflectance spectroscopy for the detection of sugar content in Asian pears. Sci Hortic. 2017;220:147–53.10.1016/j.scienta.2017.03.050Suche in Google Scholar
[50] Shao Y, He Y. Nondestructive measurement of the internal quality of bayberry juice using Vis/NIR spectroscopy. J Food Eng. 2007;79(3):1015–9.10.1016/j.jfoodeng.2006.04.006Suche in Google Scholar
[51] Qiao XX, Wang C, Feng MC, Yang W, de, Ding GW, Sun H, et al. Hyperspectral estimation of soil organic matter based on different spectral preprocessing techniques. Spectrosc Lett. 2017;50(3):156–63.10.1080/00387010.2017.1297958Suche in Google Scholar
[52] Rambo MKD, Ferreira MMC, Amorim EP. Multi-product calibration models using NIR spectroscopy. Chemom Intell Lab Syst. 2016;151:108–14.10.1016/j.chemolab.2015.12.013Suche in Google Scholar
[53] Jamshidi B, Minaei S, Mohajerani E, Ghassemian H. Reflectance Vis/NIR spectroscopy for nondestructive taste characterization of Valencia oranges. Comput Electron Agric. 2012;85:64–9.10.1016/j.compag.2012.03.008Suche in Google Scholar
© 2023 the author(s), published by De Gruyter
This work is licensed under the Creative Commons Attribution 4.0 International License.
Artikel in diesem Heft
- Regular Articles
- The impact of COVID-19 pandemic on business risks and potato commercial model
- Effects of potato (Solanum tuberosum L.)–Mucuna pruriens intercropping pattern on the agronomic performances of potato and the soil physicochemical properties of the western highlands of Cameroon
- Machine learning-based prediction of total phenolic and flavonoid in horticultural products
- Revamping agricultural sector and its implications on output and employment generation: Evidence from Nigeria
- Does product certification matter? A review of mechanism to influence customer loyalty in the poultry feed industry
- Farmer regeneration and knowledge co-creation in the sustainability of coconut agribusiness in Gorontalo, Indonesia
- Lablab purpureus: Analysis of landraces cultivation and distribution, farming systems, and some climatic trends in production areas in Tanzania
- The effects of carrot (Daucus carota L.) waste juice on the performances of native chicken in North Sulawesi, Indonesia
- Properties of potassium dihydrogen phosphate and its effects on plants and soil
- Factors influencing the role and performance of independent agricultural extension workers in supporting agricultural extension
- The fate of probiotic species applied in intensive grow-out ponds in rearing water and intestinal tracts of white shrimp, Litopenaeus vannamei
- Yield stability and agronomic performances of provitamin A maize (Zea mays L.) genotypes in South-East of DR Congo
- Diallel analysis of length and shape of rice using Hayman and Griffing method
- Physicochemical and microbiological characteristics of various stem bark extracts of Hopea beccariana Burck potential as natural preservatives of coconut sap
- Correlation between descriptive and group type traits in the system of cow’s linear classification of Ukrainian Brown dairy breed
- Meta-analysis of the influence of the substitution of maize with cassava on performance indices of broiler chickens
- Bacteriocin-like inhibitory substance (BLIS) produced by Enterococcus faecium MA115 and its potential use as a seafood biopreservative
- Meta-analysis of the benefits of dietary Saccharomyces cerevisiae intervention on milk yield and component characteristics in lactating small ruminants
- Growth promotion potential of Bacillus spp. isolates on two tomato (Solanum lycopersicum L.) varieties in the West region of Cameroon
- Prioritizing IoT adoption strategies in millennial farming: An analytical network process approach
- Soil fertility and pomelo yield influenced by soil conservation practices
- Soil macrofauna under laying hens’ grazed fields in two different agroecosystems in Portugal
- Factors affecting household carbohydrate food consumption in Central Java: Before and during the COVID-19 pandemic
- Properties of paper coated with Prunus serotina (Ehrh.) extract formulation
- Fertiliser cost prediction in European Union farms: Machine-learning approaches through artificial neural networks
- Molecular and phenotypic markers for pyramiding multiple traits in rice
- Natural product nanofibers derived from Trichoderma hamatum K01 to control citrus anthracnose caused by Colletotrichum gloeosporioides
- Role of actors in promoting sustainable peatland management in Kubu Raya Regency, West Kalimantan, Indonesia
- Small-scale coffee farmers’ perception of climate-adapted attributes in participatory coffee breeding: A case study of Gayo Highland, Aceh, Indonesia
- Optimization of extraction using surface response methodology and quantification of cannabinoids in female inflorescences of marijuana (Cannabis sativa L.) at three altitudinal floors of Peru
- Production factors, technical, and economic efficiency of soybean (Glycine max L. Merr.) farming in Indonesia
- Economic performance of smallholder soya bean production in Kwara State, Nigeria
- Indonesian rice farmers’ perceptions of different sources of information and their effect on farmer capability
- Feed preference, body condition scoring, and growth performance of Dohne Merino ram fed varying levels of fossil shell flour
- Assessing the determinant factors of risk strategy adoption to mitigate various risks: An experience from smallholder rubber farmers in West Kalimantan Province, Indonesia
- Analysis of trade potential and factors influencing chili export in Indonesia
- Grade-C kenaf fiber (poor quality) as an alternative material for textile crafts
- Technical efficiency changes of rice farming in the favorable irrigated areas of Indonesia
- Palm oil cluster resilience to enhance indigenous welfare by innovative ability to address land conflicts: Evidence of disaster hierarchy
- Factors determining cassava farmers’ accessibility to loan sources: Evidence from Lampung, Indonesia
- Tailoring business models for small-medium food enterprises in Eastern Africa can drive the commercialization and utilization of vitamin A rich orange-fleshed sweet potato puree
- Revitalizing sub-optimal drylands: Exploring the role of biofertilizers
- Effects of salt stress on growth of Quercus ilex L. seedlings
- Design and fabrication of a fish feed mixing cum pelleting machine for small-medium scale aquaculture industry
- Indicators of swamp buffalo business sustainability using partial least squares structural equation modelling
- Effect of arbuscular mycorrhizal fungi on early growth, root colonization, and chlorophyll content of North Maluku nutmeg cultivars
- How intergenerational farmers negotiate their identity in the era of Agriculture 4.0: A multiple-case study in Indonesia
- Responses of broiler chickens to incremental levels of water deprivation: Growth performance, carcass characteristics, and relative organ weights
- The improvement of horticultural villages sustainability in Central Java Province, Indonesia
- Effect of short-term grazing exclusion on herbage species composition, dry matter productivity, and chemical composition of subtropical grasslands
- Analysis of beef market integration between consumer and producer regions in Indonesia
- Analysing the sustainability of swamp buffalo (Bubalus bubalis carabauesis) farming as a protein source and germplasm
- Toxicity of Calophyllum soulattri, Piper aduncum, Sesamum indicum and their potential mixture for control Spodoptera frugiperda
- Consumption profile of organic fruits and vegetables by a Portuguese consumer’s sample
- Phenotypic characterisation of indigenous chicken in the central zone of Tanzania
- Diversity and structure of bacterial communities in saline and non-saline rice fields in Cilacap Regency, Indonesia
- Isolation and screening of lactic acid bacteria producing anti-Edwardsiella from the gastrointestinal tract of wild catfish (Clarias gariepinus) for probiotic candidates
- Effects of land use and slope position on selected soil physicochemical properties in Tekorsh Sub-Watershed, East Gojjam Zone, Ethiopia
- Design of smart farming communication and web interface using MQTT and Node.js
- Assessment of bread wheat (Triticum aestivum L.) seed quality accessed through different seed sources in northwest Ethiopia
- Estimation of water consumption and productivity for wheat using remote sensing and SEBAL model: A case study from central clay plain Ecosystem in Sudan
- Agronomic performance, seed chemical composition, and bioactive components of selected Indonesian soybean genotypes (Glycine max [L.] Merr.)
- The role of halal requirements, health-environmental factors, and domestic interest in food miles of apple fruit
- Subsidized fertilizer management in the rice production centers of South Sulawesi, Indonesia: Bridging the gap between policy and practice
- Factors affecting consumers’ loyalty and purchase decisions on honey products: An emerging market perspective
- Inclusive rice seed business: Performance and sustainability
- Design guidelines for sustainable utilization of agricultural appropriate technology: Enhancing human factors and user experience
- Effect of integrate water shortage and soil conditioners on water productivity, growth, and yield of Red Globe grapevines grown in sandy soil
- Synergic effect of Arbuscular mycorrhizal fungi and potassium fertilizer improves biomass-related characteristics of cocoa seedlings to enhance their drought resilience and field survival
- Control measure of sweet potato weevil (Cylas formicarius Fab.) (Coleoptera: Curculionidae) in endemic land of entisol type using mulch and entomopathogenic fungus Beauveria bassiana
- In vitro and in silico study for plant growth promotion potential of indigenous Ochrobactrum ciceri and Bacillus australimaris
- Effects of repeated replanting on yield, dry matter, starch, and protein content in different potato (Solanum tuberosum L.) genotypes
- Review Articles
- Nutritional and chemical composition of black velvet tamarind (Dialium guineense Willd) and its influence on animal production: A review
- Black pepper (Piper nigrum Lam) as a natural feed additive and source of beneficial nutrients and phytochemicals in chicken nutrition
- The long-crowing chickens in Indonesia: A review
- A transformative poultry feed system: The impact of insects as an alternative and transformative poultry-based diet in sub-Saharan Africa
- Short Communication
- Profiling of carbonyl compounds in fresh cabbage with chemometric analysis for the development of freshness assessment method
- Special Issue of The 4th International Conference on Food Science and Engineering (ICFSE) 2022 - Part I
- Non-destructive evaluation of soluble solid content in fruits with various skin thicknesses using visible–shortwave near-infrared spectroscopy
- Special Issue on FCEM - International Web Conference on Food Choice & Eating Motivation - Part I
- Traditional agri-food products and sustainability – A fruitful relationship for the development of rural areas in Portugal
- Consumers’ attitudes toward refrigerated ready-to-eat meat and dairy foods
- Breakfast habits and knowledge: Study involving participants from Brazil and Portugal
- Food determinants and motivation factors impact on consumer behavior in Lebanon
- Comparison of three wine routes’ realities in Central Portugal
- Special Issue on Agriculture, Climate Change, Information Technology, Food and Animal (ACIFAS 2020)
- Environmentally friendly bioameliorant to increase soil fertility and rice (Oryza sativa) production
- Enhancing the ability of rice to adapt and grow under saline stress using selected halotolerant rhizobacterial nitrogen fixer