Agronomic performance, seed chemical composition, and bioactive components of selected Indonesian soybean genotypes (Glycine max [L.] Merr.)
-
Heru Kuswantoro
 ,
Eriyanto Yusnawan
,
Eriyanto Yusnawan

Abstract
The use of improved soybean varieties is crucial when it comes to the progress of soybean cultivation in Indonesia. This study presents the agronomic performance, seed chemical composition, and bioactive components of 12 soybean genotypes grown in Malang, Indonesia. Parameters included the agronomic characteristics, ash, protein, fat, total flavonoid content (TFC), total phenolic content (TPC), genistein and daidzein contents as well as antioxidant activity. The study found that Dena 1, Dering 1, and Deja 1 had the highest seed yield (2.76–2.84 t/ha), while Dega 1 had the largest seed size (24.69 g/100 seeds). The black-seeded genotype of Detam 1 had the highest protein content (39.79% dw), while GH 63 had the largest amount of total daidzein and genistein. Detam 4 (a black-seeded genotype) exhibited the highest values of TFC, TPC, and antioxidant activity. The agronomic characteristics and TPC significantly correlated, suggesting that both traits are applicable as criteria for soybean breeding selection. Detam 4 and GH 63 are likely promising to be used as gene sources for improving the nutritional and health benefits of soybean genotypes. GH 63 and GH 73 also have the potential for further release as new high-yielding varieties with early maturity and large seed size. Overall, the study provides valuable information on the agronomic superiority and nutritional aspects of improved soybean varieties in Indonesia.
1 Introduction
Soybean is a rich protein source and plays an important role in the Indonesian diet with the majority as tempe and tofu that constitute about 83.7% of the total soybean available for consumption, while the rest is used as an ingredient for soy sauce, soy milk, sprouts, and flour [1]. The consumption level of soybean in 2019 was reported about 6.43 kg/capita/year, resulting in a large amount of national demand for soybean c.a. 3.09 million tons per year. However, about 2.67 million ton (86.4%) of such demand is being imported [2]. Therefore, intensive efforts have been conducted to increase the national soybean production, particularly through the introduction of high-yielding improved varieties and adapted to different agro-ecological conditions in order to expand the planting area to all Indonesian regions. In fact, soybean yield increases may appear modest compared to the significant yield increases seen in cereals, which mainly store starch. Soybean seeds primarily store protein (38–42%) and oil (18–22%) with more intricate pathways than those in cereals [3], suggesting more efforts are needed for increased production of soybean.
A number of soybean-improved varieties have been released for the last 20 years with high yielding (>2 t/ha) and particular agro-ecological characteristics, such as adapted to low land, water logging, acid soil, tidal land, shading (intercropping), and drought as well as specific characteristics, such as resistant to major pests and pod shattering [4]. However, in addition to such agronomic characteristics, information on the nutritional aspects as well as the quality of foods prepared from improved varieties has not been sufficiently available. Large yellow-seeded is likely favored for tempe preparation as it would give good-looking and high-volume development of the seeds during fermentation. Meanwhile, tofu and soy milk need soybeans with high protein content (>40%) for the ingredient rather than the seed sizes as it linearly affects the yield recovery [5]. However, small-seeded soybeans are less desired nowadays; thus, most of the newly released varieties belong to medium- and large-seeded soybeans that are around 10‒14 g/100˗seed and >14 g/100-seed, respectively [4]. Soybean with black seed color and a high amount of protein is especially suitable for soy sauce preparation [5]. Therefore, next to seed size criteria, protein content is also an important trait regarding the quality and nutritional aspects of the products.
Soybean seeds contain numerous bioactive components that are beneficial for human health, with phenolic compounds such as flavonoids and tannins being the most abundant. Phenolic compounds, including flavonoids, play numerous molecular and biochemical roles in plants, such as non-enzymatic antioxidants (free radical scavenging), signaling, mediating auxin transport, and plant defense [6]. Soybean seeds also contain several isoflavones, with genistin, daidzin, and glycitin glycones being the predominant components while genistein, daidzein, and glycitein are present in smaller amounts [7]. The isoflavone contents may vary from 745 µg to 5253.98 µg/g [8] and 835.9 µg to 2130.2 µg/g [9]. Isoflavones belong to phytoestrogens that have biological activity as estrogen and antioxidant capacities that preserve cells from aging related to oxidative damage, avoid osteoporosis, coronary heart disease, cancer, and health problems related to menopause, improve fat metabolism, and enhance cognitive function [10,11]. Similarly, flavonoid and phenolic compounds also exhibit antioxidant activity [12]. A substantial amount of total flavonoid and total phenolic was measured in 63 Indonesian soybean genotypes, ranging 0.22–5.30 mg CE/g and 3.48–14.72 mg GAE/g, respectively [13], while a lower total phenolic (1.15–1.77 mg GAE/g) was noted in 24 soybean genotypes originated from nine countries [14].
Soybean variety, cultivation, growing environments (climate, latitude, and longitude), maturity, processing, and storage are greatly attributed to the agronomic characteristics of the crop, physicochemical properties of the seeds as well as the bioactive components [14,15,16,17]. This would consequently contribute to the crop yield, nutritional, health benefits, and quality of the soybean products. Soybean having superior characteristics of agronomic performance, nutritional values and bioactive components is a distinct advantage. However, information regarding such superiority in Indonesian soybeans is yet limited. Therefore, this study aimed to evaluate both the agronomical and nutritional aspects of selected Indonesian soybean genotypes grown in the same location. This finding would be valuable as well in assessing the relation between the traits of yield component responses and seed chemical components for further breeding selection purposes.
2 Materials and methods
2.1 Plant materials
The research materials consisted of 12 soybean genotypes (10 improved varieties and two promising lines) as presented in Figure 1, while the variety description is listed in Table 1. They were grown in an irrigated lowland belonging to Iletri Jambegede Research Station in Malang, East Java, Indonesia (8°10′30″S, 112°33′32.4″E, altitude 335 m). The planting time was the 14th of July 2020 and harvested in the middle of October 2020 following the local crop rotation pattern of soybeans in the irrigated lowland (paddy–paddy–soybean). The recorded weather conditions (monthly temperature, rainfall, and relative humidity) are presented in Figure 2. Before planting, the land was cleaned of the weeds and previous crop residues. The soil was taken at planting before the fertilizers were applied and analyzed in the Iletri Laboratory of Soil.
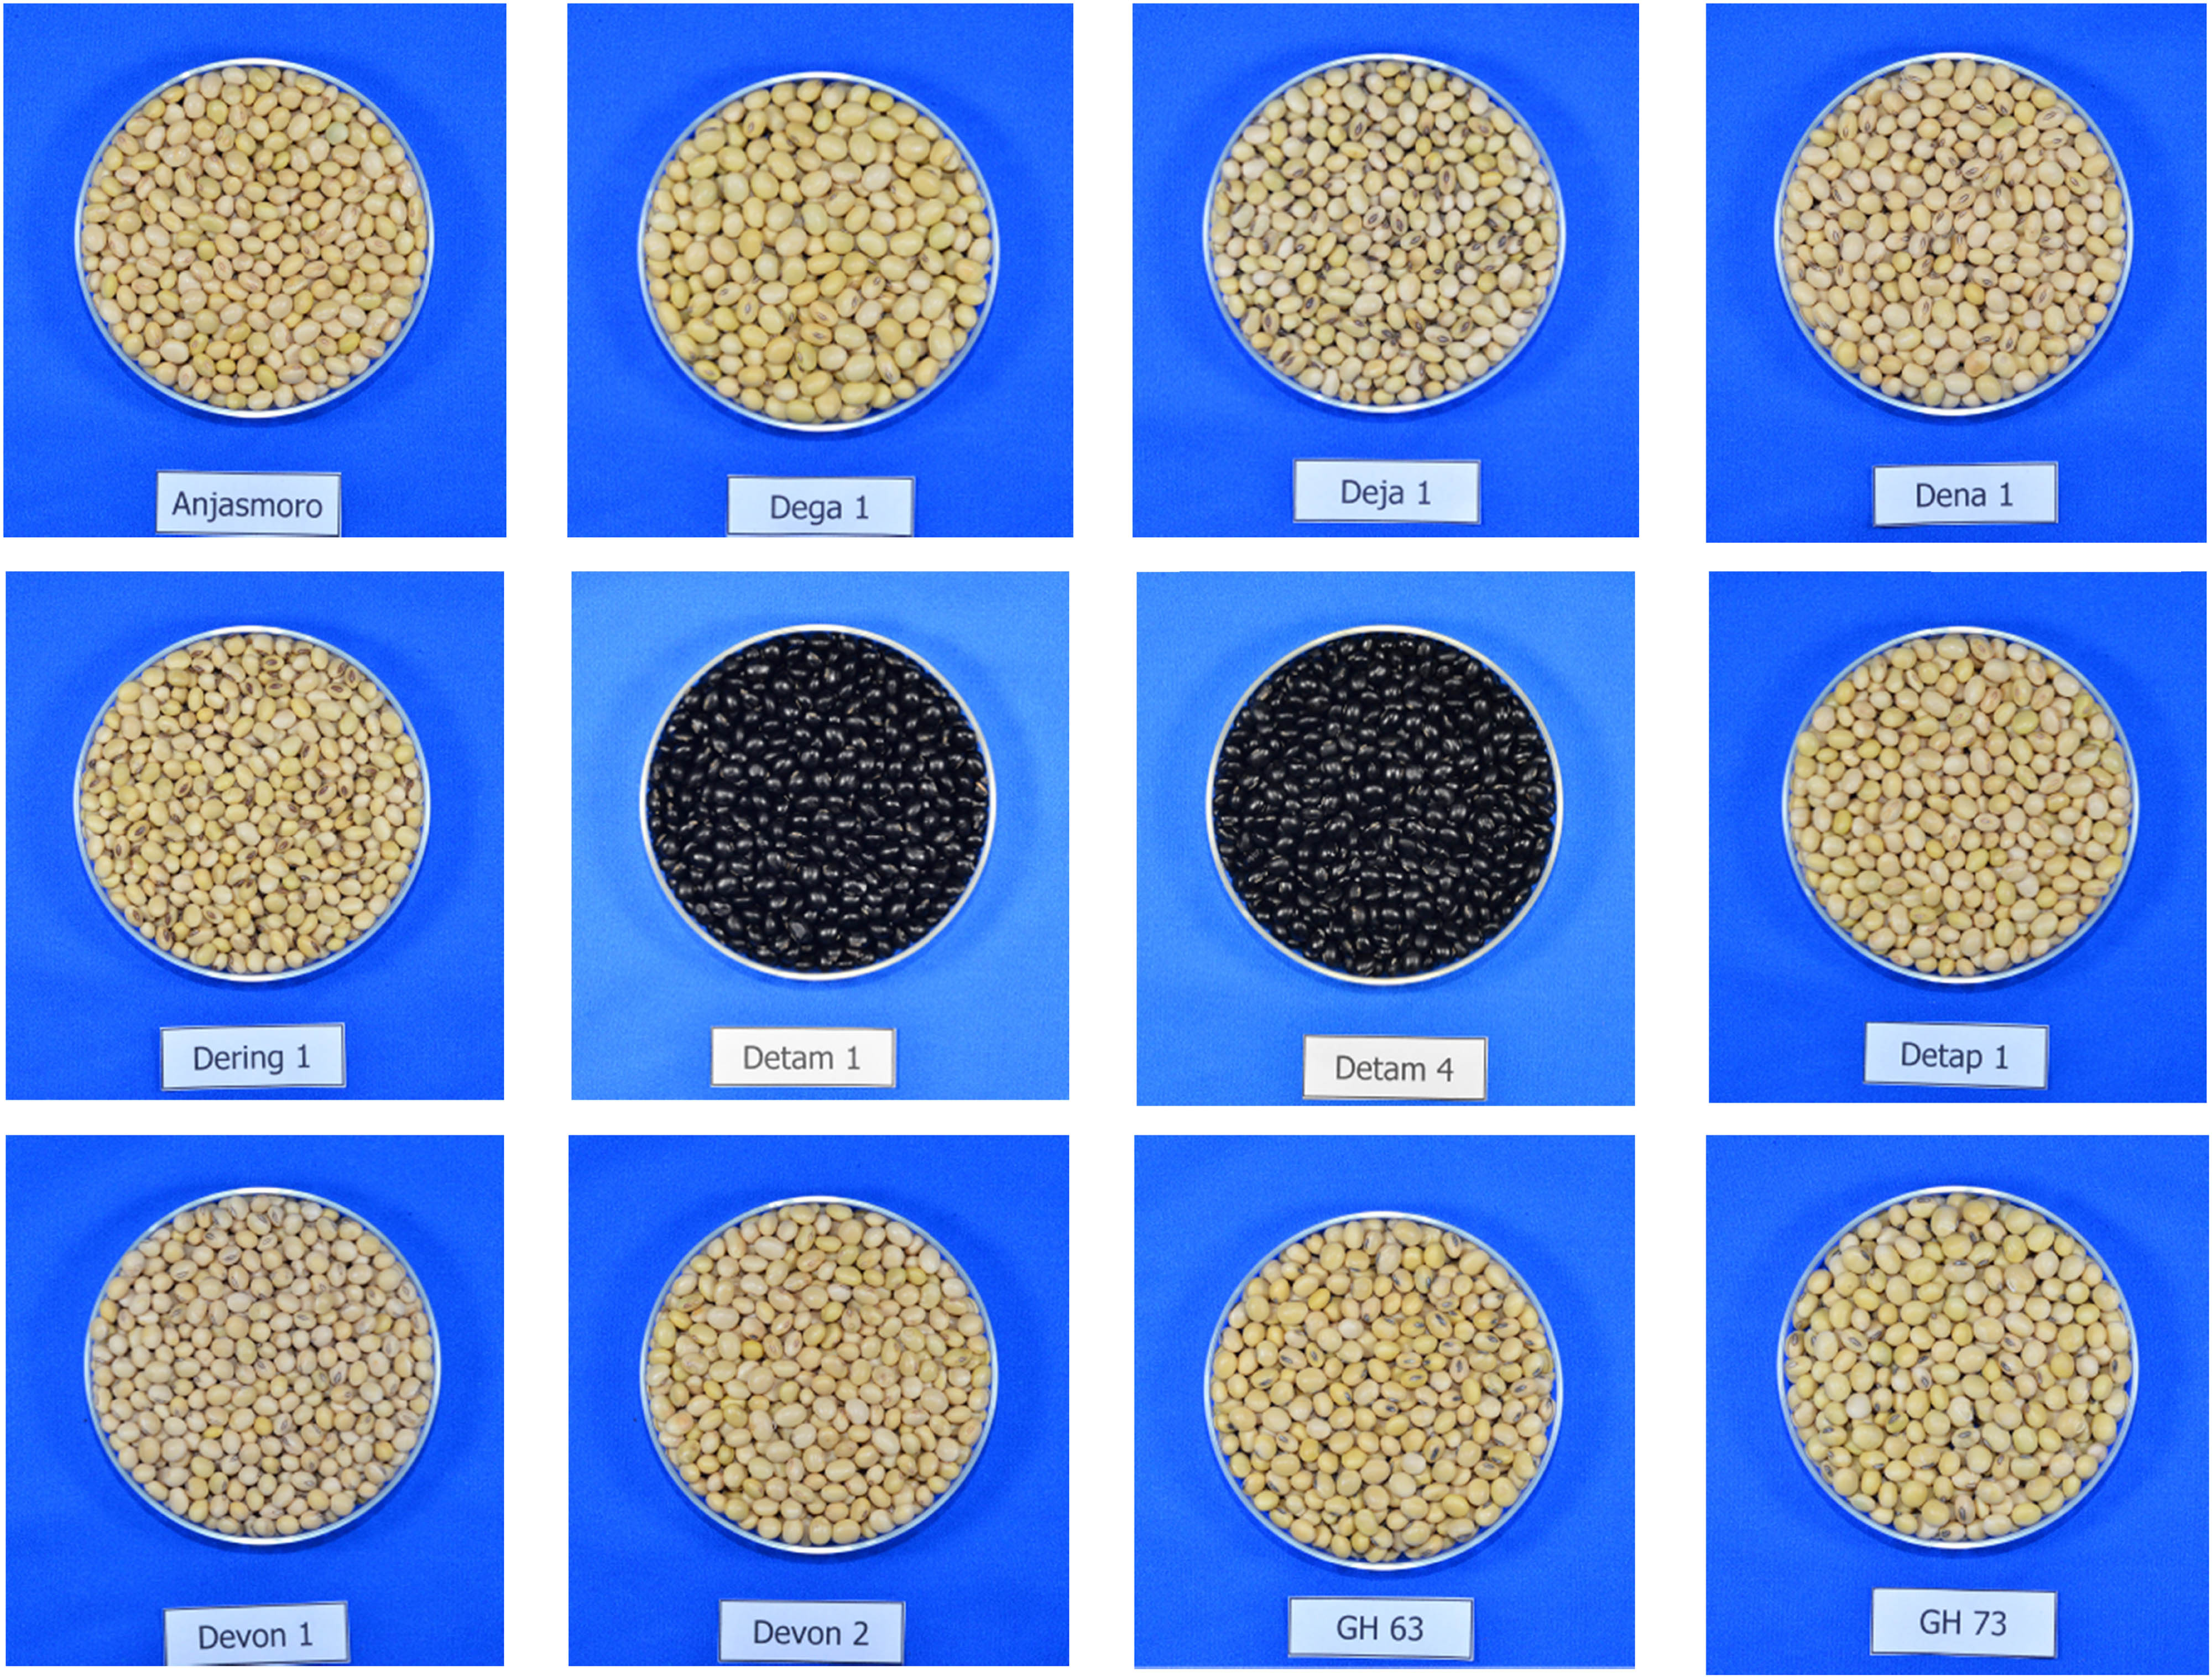
Soybean seeds derived from 12 genotypes.
Breeding status, physical, and specific characteristics of 12 soybean genotypes
| Genotype | Status | Seed coat color | Days to flowering type | Specific characteristic | Year of release |
|---|---|---|---|---|---|
| Anjasmoro | Variety | Yellow | Moderate | Large-seeded | 2001 |
| Dega 1 | Variety | Yellow | Early | Large-seeded, tolerant to lowland | 2016 |
| Deja 1 | Variety | Yellow | Moderate | Tolerant to waterlogging | 2017 |
| Dena 1 | Variety | Yellow | Moderate | Tolerant to shade | 2014 |
| Dering 1 | Variety | Yellow | Moderate | Tolerant to drought | 2012 |
| Detam 1 | Variety | Black | Moderate | Large-seeded | 2008 |
| Detam 4 | Variety | Black | Moderate | Early maturity | 2013 |
| Detap 1 | Variety | Yellow | Moderate | Resistant to pod-shattering | 2017 |
| Devon 1 | Variety | Yellow | Moderate | High isoflavones | 2015 |
| Devon 2 | Variety | Yellow | Moderate | Large-seeded, high isoflavones | 2017 |
| GH 63 | Promising line | Yellow | Early | Large-seeded, tolerant to tidal land | — |
| GH 73 | Promising line | Yellow | Early | Large-seeded, tolerant to tidal land | — |
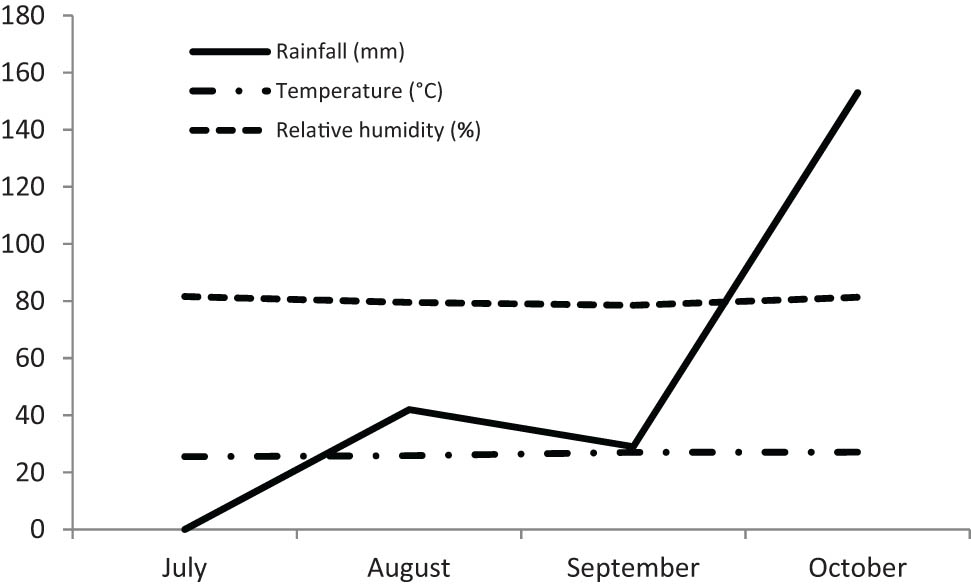
The weather conditions during the period of soybean cultivation (2020).
The soil tillage was optimally performed, followed by direct planting of the seeds. Each genotype was grown in a plot of 13.5 m2 (4.5 m × 3 m) with a distance of 40 cm between rows and 15 cm in rows, and two seeds per hill, suggesting about 450 plants were available for each genotype and each plot/replicate. The drainage canals were made before planting and herbicides were applied. The application of fertilizer included 15.75 kg of N, 36 kg of P2O5, and 33.75 kg of K2O per ha as well as 5 t/ha of manure and 1 t/ha of organic fertilizer that were performed once at the time of planting. Harvesting was done when the genotype reached the physiological maturity stage, which was evident by the presence of yellow or brown pods and fallen leaves. Postharvest handling included drying the soybean trunks, threshing, drying the seeds for 2‒3 days, cleaning, and sortation. The seeds were then weighed for yield data collection. About 100 g of stock sample was randomly taken from the seed lot of each genotype and each replicate and divided into working and archive samples. The working sample was finely milled and used for the analysis of chemical composition in the Iletri Laboratory of Food Chemistry and Technology in Malang, Indonesia, and bioactive components in the Iletri Central Laboratory.
2.2 Experimental design
A randomized block design was used with a single factor/treatment (genotype) and three replicates. A similar field replicate was also used during the analysis in the laboratory. Data collected were statistically calculated using an Analysis of Variance (ANOVA) and the differences between soybean genotypes were analyzed using an LSD test at a significant level of <0.05.
2.3 Evaluated parameters
Parameters covered the seed yield and yield performances, such as days to flowering, days to maturity (DTM), plant height, number of branches, number of productive nodes, number of filled and unfilled pods, 100-seed weight, and seed yield. Days to flowering, DTM, and seed yield were observed for all plants of each genotype in each plot/replicate, while other agronomic characteristics were collected from 10 random plants. The seed chemical composition included the parameters of ash content (gravimetry method using a muffle furnace) and fat content (direct Soxhlet extraction method) following Badan Standarisasi Nasional [18]. About 1–2 g of sample was used for fat analysis. The sample was put into a dry thimble and subsequently attached to the holder in the Soxhlet extraction unit. The known weight of the extraction tube was filled with 25 mL of solvent (petroleum benzene) and coupled with the thimble holder; then, it was boiled or extracted for 15 min followed by rinsing for 30–45 min and distillation of the solvent for 15 min. Finally, the extraction tube was removed from the Soxhlet unit, dried in the oven at 105°C for about 30 min, transferred to a desiccator, and weighed. The fat content (%) was calculated using the differences in initial and final weights of the extraction tube.
Protein content was analyzed using a micro-Kjeldhal method referred to as AOAC [19]: About 15–20 mg of sample was added with 2.0 mL of H2SO4 and 200 mg K2SO4 (Kjeldhal tablet) and let be digested starting with the temperature of 200°C until it raised about 450°C, and the solution was finally clear or colorless and the fuming ended. A blank sample consisting of 2.0 mL of water was also undertaken digestion along with the sample. About 15 mL of 40% NaOH was added to both sample and blank, and subsequently steam distilled. Ammonia that was liberated from the distillation unit was collected in the Erlenmeyer containing solution of 4% boric acid, and the nitrogen contents were determined by titration with 20 mN HCl after blank correction. Protein content (%) was calculated using a conversion factor of 5.75 for soybeans.
Determination of bioactive components and antioxidant activity were performed as follows:
2.3.1 Total flavonoid content (TFC)
Estimation of the total flavonoid was carried out following the previous study [20]. Briefly, 0.5 g of soybean seed sample was extracted in 5 mL of 50% acetone, and the extraction was done twice. The extract was added with distilled water (1:5 v/v), followed by the addition of 150 µL of 5% NaNO2 solution, 300 µL of aluminum chloride, 1,000 µL of 1 M sodium hydroxide, and subsequently adjusted to the final volume of 5,000 µL with distilled water. A spectrophotometer (Genesys 10 s, USA) was employed to measure the absorbance against the blank at a wavelength of 510 nm. The concentration was recorded as catechin equivalents per gram of sample (mg CE/g), which were calculated using catechin calibration curve.
2.3.2 Total phenolic content (TPC)
Measurement of the total phenolic in soybean seed had referred to Yusnawan [13]. Similarly, about 0.5 g of soybean seed sample was extracted in 5 mL of 50% acetone, and the extraction was done twice. Distilled water was added to the extract (1:60 v/v), and then undergone a reaction with 250 µL of Folin–Ciocalteu’s reagent and 750 µL of sodium carbonate. After incubation of the mixture, the extract was subjected to a spectrophotometer (Genesys 10 s, USA) and detected the absorbance at 765 nm. The TPC was presented as gallic acid equivalents per gram of sample (mg GAE/g) through a calculation using the gallic acid calibration curve.
2.3.3 Daidzein and genistein content
In this study, only two isoflavone components, namely daidzein and genistein, were analyzed due to the limited availability of the standards. The sample extraction process was accomplished using a method employed by Ginting et al. [16]. The seed samples were finely ground, followed by maceration of 1 g sample with 20 mL of 50% methanol and shaking for 24 h at room temperature, and then filtered using a Whatmann paper No. 42. One milliliter of the sample extract was taken using a syringe and purified through a microfilter (0.45 μm, 33 mm i.d., SLHV033RS/Millex, Millipore, Merck) and gently put into a vial. The extract was then subjected to a UHPLC unit for separation and detection. The instrument belonged to Agilent Technologies 1290 Infinity II series, USA, which consisted of a quaternary pump (Agilent G7104A), a degasser (Agilent G1322A), an auto multi sampler (Agilent G7167B), and a Diode Array Detector (Agilent G1315D). About 10 μL of the analyte was injected onto a reversed-phase InfinityLab Poroshell 120EC-C18 column (75 mm × 4.6 mm i.d., 2.7 μm, Agilent, USA) equipped with a guard column of Zorbax Eclipse Plus-C-18 (12.5 mm × 4.6 mm i.d., 5 μm, Agilent, USA). The gradient elution was applied for daidzein and genistein separation using the mobile phase of acetonitrile containing 0.1% acetic acid (A) and water containing acetic acid 0.1% (B) as follows: 0 min 20% A, 3.3 min 25% A, 7.5 min 35% A, 10 min 40% A, and went back to 20% of A after 11 min. The flow rate of the mobile phase was 1.0 mL/min, and the time between injections was 1 min. Detection of the analyte was performed at 260 nm of wavelength and quantified using the calibration curves of both daidzein and genistein standards (Sigma, Aldrich, St. Louis, MO, USA). The individual content of daidzein and genistein was expressed in µg/g, and the total content was calculated as the sum of both isoflavone components.
2.3.4 DPPH assay for free radical scavenging activity
Antioxidant activity was estimated according to Yusnawan [13]. About 0.5 g of soybean seed sample was extracted in 5 mL of 70% ethanol, and the extraction was done twice. The soybean extract was reacted with ethanolic DPPH solution (0.1 mM; 1:19 v/v) and incubated for 30 min, followed by reading the absorbance at 515 nm using a spectrophotometer (Genesys 10 s, USA). The antioxidant activity was calculated as micromoles of Trolox equivalent per gram of sample (µmol TE/g).
3 Results
3.1 Weather conditions and soil chemical properties
Figure 2 shows that the amount of rainfall was considerably low from the beginning of soybean planting in July up to September. Therefore, watering the plant was performed once a week during this period as such condition was less favorable for soybean growth and development. The soil chemical properties obtained from the three replicates were almost similar (Table 2), except for the P2O5 content, which was lower in replicate 2 relative to the other replicates. All the P2O5 contents were much higher than the recommended dosage as well as for the K contents. This suggests that P2O5 and K were sufficiently available for plant growth and development. In contrast, the N contents were considerably low which may cause low absorption of other elements, such as P and K. The CEC value in replicate 1 was lower than in other replicates; however, the Fe content was higher. Soils with high CEC retain more nutrients than low-CEC soils, reflecting that the nutrient availability is high.
Chemical properties of soil collected from Jambegede Experimental Station, Malang, Indonesia (July 2020)
| Parameter | Unit | Replicate 1 | Replicate 2 | Replicate 3 |
|---|---|---|---|---|
| pH (H2O) | 7.5 | 7.6 | 7.5 | |
| pH (KCl) | 5.6 | 5.7 | 5.7 | |
| N-Total (Kjeldahl) | % | 0.11 | 0.09 | 0.09 |
| P2O5 (Olsen) | ppm | 101.77 | 91.72 | 102.5 |
| K (NH4Oac pH 7.0) | cmol+/kg | 0.75 | 0.68 | 0.70 |
| Na (NH4Oac pH 7.0) | cmol+/kg | 0.97 | 1.06 | 0.82 |
| Ca (NH4Oac pH 7.0) | cmol+/kg | 8.5 | 9.55 | 8.08 |
| Mg (NH4Oac pH 7.0) | cmol+/kg | 0.64 | 0.69 | 0.57 |
| CEC (NH4Oac pH 7.0) | cmol+/kg | 17.6 | 22.08 | 20.16 |
| Al-dd (KCl 1N) | cmol+/kg | 0 | 0 | 0 |
| H-dd (KCl 1N) | cmol+/kg | 0.66 | 0.66 | 0.66 |
| C-Org (Walkey & Black) | % | 1.73 | 1.34 | 1.36 |
| SO4 (NH4OAc pH 4.8) | ppm | 43.16 | 40.68 | 39.71 |
| Cu (DTPA extract) | ppm | 8.81 | 7.94 | 8.45 |
| Mn (DTPA extract) | ppm | 10.77 | 10.06 | 10.44 |
| Fe (DTPA extract) | ppm | 28.24 | 21.88 | 25.53 |
| Zn (DTPA extract) | ppm | 2.15 | 2.13 | 2.31 |
3.2 Agronomic characteristics
The agronomic characteristics of soybean genotypes, particularly the days to flowering, maturity, and plant height, were significantly affected by replicate (Table 3), while other characteristics showed no effect of replicate. Conversely, the soybean genotype showed a very significant effect on all observed agronomic characteristics, with the exception of the number of unfilled pods (Table 3). This illustrates that the 12 genotypes studied were obviously different with respect to their agronomic characteristics.
Mean square of agronomic characteristics of 12 soybean genotypes
| Characteristic | Replicate | Genotype | Error |
|---|---|---|---|
| DTF | 2.33* | 51.76** | 0.64 |
| DTM | 16.08** | 47.40** | 0.78 |
| HGT | 162.63** | 686.88** | 23.04 |
| BRC | 0.00 | 2.05** | 0.24 |
| NOD | 4.71 | 88.14** | 15.10 |
| POF | 50.41 | 774.82** | 154.83 |
| POU | 0.32 | 1.05 | 0.51 |
| SEW | 0.94 | 48.59** | 0.85 |
| YLD | 0.05 | 0.36** | 0.06 |
**Significant at P < 0.01; *significant at P < 0.05; DTF – days to flowering; DTM – days to maturity; HGT – plant height (cm); BRC – branches per plant; NOD – number of productive nodes per plant; POF – number of filled pods per plant; POU – number of unfilled pods per plant; SEW – 100-seed weight (g); YLD – seed yield per plot (t/ha).
Days to flowering is the initial change from the vegetative to generative phase; thus, this is an important characteristic for plant growth and development. The days to flowering of 12 soybean genotypes varied from 30 to 43 days (Table 4). The earliest days of flowering were shown in Dega 1 and GH 73, while the longest one was seen in Deja 1. None of the genotypes had early days to flowering (less than 30 days).
Agronomic characteristics of 12 soybean genotypes
| Genotype | DTF | DTM | HGT | BRC | NOD | POF | POU | SEW | YLD |
|---|---|---|---|---|---|---|---|---|---|
| Anjasmoro | 36.33 ± 1.15ef | 84 ± 1b | 66.82 ± 8.54bc | 2.57 ± 0.38bc | 18.13 ± 2.18bc | 55.6 ± 8.51abcd | 1.1 ± 0.8a | 16.14 ± 0.09cd | 2.33 ± 0.39abc |
| Dega 1 | 30 ± 0.00g | 78 ± 2cd | 33.23 ± 4.43e | 1.93 ± 0.23c | 9.7 ± 0.5c | 26.73 ± 4.09d | 0.37 ± 0.25a | 24.69 ± 0.88a | 1.81 ± 0.13c |
| Deja 1 | 43 ± 0.00a | 84.67 ± 2.08b | 78.13 ± 5.48ab | 4.27 ± 0.55a | 19.67 ± 1.75abc | 49.93 ± 13.87abcd | 1.83 ± 0.55a | 13.99 ± 0.62de | 2.76 ± 0.17a |
| Dena 1 | 39.33 ± 1.15bcd | 84.67 ± 1.15b | 75.92 ± 8ab | 4.37 ± 0.06a | 19.57 ± 0.45abc | 51.5 ± 7.24abcd | 1.2 ± 0.62a | 18.54 ± 0.96c | 2.84 ± 0.21a |
| Dering 1 | 40.33 ± 0.58b | 84.67 ± 1.15b | 84.81 ± 2.79a | 4.63 ± 0.32a | 25.8 ± 9.53ab | 58.43 ± 6.19abcd | 0.87 ± 0.61a | 11.21 ± 1.23f | 2.82 ± 0.11a |
| Detam 1 | 37.33 ± 1.15def | 91 ± 0a | 60.13 ± 6.93c | 3.73 ± 0.76ab | 30.97 ± 5.45a | 80.57 ± 25.09a | 2.13 ± 1.01a | 13.69 ± 1.89def | 2.03 ± 0.21bc |
| Detam 4 | 40 ± 1.73bc | 80 ± 2c | 63.77 ± 4.44bc | 4.53 ± 0.45a | 19.3 ± 2.88bc | 67.7 ± 13.4ab | 0.5 ± 0.44a | 11.69 ± 0.1ef | 2.71 ± 0.19ab |
| Detap 1 | 35.33 ± 0.58f | 83.33 ± 1.53b | 65.37 ± 6.81bc | 3.5 ± 0.26ab | 19.8 ± 2.52abc | 64.3 ± 6.76abc | 1.97 ± 0.64a | 15.46 ± 0.95d | 2.39 ± 0.21abc |
| Devon 1 | 38.67 ± 1.15bcde | 84 ± 1b | 55.39 ± 6.27cd | 4.47 ± 0.15a | 20.27 ± 1.34abc | 55.97 ± 6.7abcd | 1.1 ± 0.3a | 14.18 ± 0.9de | 2.21 ± 0.17abc |
| Devon 2 | 37.67 ± 0.58cdef | 84 ± 0b | 65.49 ± 3.27bc | 3.93 ± 0.74ab | 20.03 ± 2.12abc | 67.53 ± 13.24ab | 2.07 ± 0.85a | 14.9 ± 0.75d | 1.97 ± 0.4c |
| GH 63 | 32 ± 0g | 76.67 ± 1.15d | 45.46 ± 6.33de | 3.53 ± 0.38ab | 13.77 ± 1.92c | 29.47 ± 4.48cd | 1.53 ± 0.4a | 18.56 ± 0.8c | 2.45 ± 0.16abc |
| GH 73 | 30 ± 0g | 78 ± 2cd | 43.32 ± 4.17de | 3.4 ± 0.7abc | 14.97 ± 4.17bc | 37.73 ± 16.92bcd | 1.27 ± 1.27a | 21.89 ± 0.46b | 2.24 ± 0.31abc |
Values within a column followed by the same letter are not significantly different (P < 0.05). DTF – days to flowering; DTM – days to maturity; HGT – plant height (cm); BRC – number of branches per plant; NOD – number of productive nodes per plant; POF – number of filled pods per plant; POU – number of unfilled pods per plant; SEW – 100-seed weight (g); YLD – seed yield per plot (t/ha).
Table 4 shows a significant variation on the DTM. Detam 1 had the longest day of maturity, while the earliest maturity was found in Dega 1. The genotypes with early days to flowering are normally followed by early DTM as well (Table 4). However, the genotypes with relatively longer days to flowering tended to have a more diverse range of maturity than those with early days to flowering. This can be observed in Detam 1, which had the longest days of maturity, even though the days to flowering were earlier than the other five varieties. In Indonesia, the soybean maturity is classified as early maturity genotypes (<80 days), medium maturity (80‒85 days), and late maturity (>85 days). In this study, the shortest plant height was seen in Dega 1, followed by GH 73 and GH 63, which belong to early maturity. Dering 1, Deja 1, and Dena 1 which had medium maturity showed the highest plant height (Table 4).
The highest number of plant branches was obtained in Dering 1, followed by Detam 4. Dega 1, an early maturity genotype showed the least number of branches (1.93) due to a short vegetative phase of the plant. However, GH 63 and GH 73, which are also grouped as early maturity genotypes, could develop branches up to 3.5 and 3.4 per plant, respectively. Similarly, Anjasmoro that belongs to medium maturity did not have many branches compared to other medium maturity genotypes. Meanwhile, the average number of productive nodes was 19 per plant (Table 4). However, two genotypes showed more than 20 nodes per plant, namely Detam 1 and Dering 1. Meanwhile, the smallest number of productive nodes (9.7) was noted in Dega 1. In particular, the promising lines of GH 63 and GH 73 had 14 and 15 nodes per plant, respectively.
Detam 1, which had the highest productive node numbers, showed the highest number of filled pods. Likewise, Dega 1 which had the least productive node numbers also had the least filled pod numbers (Table 4). A similar finding occurred in two early maturity genotypes (GH 63 and GH 73), which had a smaller number of filled pods than those of medium and late maturity genotypes. The number of pods per plant is dictated by the interaction between the variety and the environment. The number of filled pods was not consistently followed by the number of unfilled pods, except for Anjasmoro, Detam 1, and Devon 1. Meanwhile, Dega 1 exhibited the smallest number of unfilled pods.
Seed yield per plot (t/ha) (YLD) varied significantly among the genotypes with the highest value achieved by Dena 1, Dering 1, and Deja 1, while the lowest yield was shown by Dega 1. These three genotypes belonged to medium maturity, while Dega 1 was categorized as early maturity. GH 63 and GH 73 genotypes, which also belong to early maturity, had higher seed yields than those of varieties with medium maturity, including Detam 1 and Devon 1. Growing environmental conditions may be attributed to such differences in seed yield.
The 100-seed weight represents the seed size of soybean, which is large (if >14 g), medium (10‒14 g), and small (<10 g). This characteristic obviously had a different pattern compared to other agronomic characteristics (Table 4). Based on such criteria, eight genotypes belonged to large-seeded, and four genotypes were medium-seeded. The largest seed size was shown by Dega 1 (24.69 g/100 seeds), followed by GH 73, GH 63, and Dena 1, while Dering 1 and Detam 4 had the smallest sizes (Table 4). The large-seeded genotypes normally have early maturity, as seen in Dega 1, GH 73, and GH 63.
3.3 Chemical composition
The ash contents which reflect the amounts of minerals in soybean seeds were slightly different between genotypes that ranged from 5.62 to 6.20% (dw) (Table 5). The protein contents varied from 35.08 to 39.79% (Tabel 5). All genotypes had protein contents ≥35% and Detam 1 had the highest value, followed by Detam 4. A significant difference in the amounts of fat was obtained in 12 soybean genotypes that varied from 12.19% (dw) in Devon 1 up to 18.61% (dw) in GH 63 as shown in Table 5. Among 12 genotypes, only Devon 1 had fat content <15%; however, no genotype contained a high amount of fat (>20%).
Chemical composition and bioactive components of 12 soybean genotypes
| Genotype | ASH | PRT | FAT | TFC | TPC | DAID | GEN | TDG | ANOX |
|---|---|---|---|---|---|---|---|---|---|
| Anjasmoro | 5.81 ± 0.23bcd | 36.48 ± 0.37cd | 18.14 ± 0.85ab | 0.63 ± 0.10c | 3.58 ± 0.46ef | 41.38 ± 8.72f | 36.59 ± 12.25def | 78.17 ± 20.97fg | 4.25 ± 0.40e |
| Dega 1 | 5.40 ± 0.25f | 36.36 ± 1.06cd | 16.58 ± 0.73cde | 0.64 ± 0.09c | 3.74 ± 0.18def | 112.52 ± 10.79c | 62.39 ± 2.82bc | 174.90 ± 13.51c | 4.38 ± 0.34de |
| Deja 1 | 5.57 ± 0.15e | 36.97 ± 0.43bc | 16.65 ± 1.71bcde | 0.70 ± 0.04c | 4.41 ± 0.44cd | 86.54 ± 6.15d | 50.52 ± 5.79bcd | 137.07 ± 11.86cd | 4.76 ± 0.25cde |
| Dena 1 | 5.88 ± 0.09bc | 35.09 ± 0.65ef | 16.55 ± 1.17cde | 0.58 ± 0.05c | 3.80 ± 0.14def | 79.39 ± 6.16d | 37.41 ± 4.25def | 116.83 ± 10.41def | 4.92 ± 0.16cde |
| Dering 1 | 5.74 ± 0.18cd | 34.95 ± 0.68f | 17.24 ± 0.18abcde | 0.79 ± 0.06c | 4.85 ± 0.50c | 63.23 ± 10.39def | 34.07 ± 7.27ef | 97.30 ± 17.66efg | 5.42 ± 0.26bc |
| Detam 1 | 6.18 ± 0.22a | 39.79 ± 0.51a | 15.84 ± 0.67e | 2.00 ± 0.12b | 6.24 ± 0.05b | 44.57 ± 3.06ef | 25.33 ± 3.32f | 69.90 ± 6.24g | 5.88 ± 0.42b |
| Detam 4 | 5.67 ± 0.14de | 37.97 ± 1.09b | 17.54 ± 0.65abcd | 2.38 ± 0.41a | 7.18 ± 1.03a | 69.66 ± 6.68d | 47.35 ± 4.79cde | 117.01 ± 11.47def | 7.83 ± 0.61a |
| Detap 1 | 5.88 ± 0.09bc | 35.42 ± 0.33def | 16.34 ± 0.40de | 0.74 ± 0.11c | 3.88 ± 0.16de | 76.25 ± 9.66d | 63.17 ± 12.42b | 139.35 ± 21.96cd | 5.26 ± 0.70bc |
| Devon 1 | 6.22 ± 0.10a | 36.64 ± 0.57c | 12.18 ± 0.82f | 0.82 ± 0.01c | 4.11 ± 0.40de | 155.70 ± 34.09b | 102.26 ± 21.84a | 257.96 ± 55.88b | 5.16 ± 0.34c |
| Devon 2 | 5.90 ± 0.25b | 35.10 ± 0.77ef | 17.05 ± 0.67bcde | 0.60 ± 0.03c | 3.56 ± 0.18ef | 67.68 ± 8.96de | 59.50 ± 7.92bc | 127.18 ± 16.88de | 4.78 ± 0.13cde |
| GH 63 | 6.08 ± 0.15a | 36.12 ± 0.27cde | 18.61 ± 0.33a | 0.59 ± 0.05c | 4.16 ± 0.41cde | 229.96 ± 34.79a | 108.65 ± 17.60a | 338.61 ± 52.07a | 5.04 ± 0.09cd |
| GH 73 | 6.19 ± 0.14a | 35.07 ± 0.41ef | 17.96 ± 0.97abc | 0.61 ± 0.15c | 3.14 ± 0.59f | 72.22 ± 24.69d | 54.07 ± 19.44 bc | 126.03 ± 44.12de | 5.21 ± 0.38c |
Values within a column followed by the same letter are not significantly different (P < 0.05). ASH – ash content (% dw); PRT – protein (% dw); FAT – fat (% dw); TFC – total flavonoid content (mg CE/g dw); TPC – total phenolic content (mg GAE/g dw); DAID – daidzein (µg/g dw); GEN – genistein (µg/g dw); TDG – total daidzein and genistein content (µg/g dw); ANOX – antioxidant activity (µmol TE/g dw).
3.4 Bioactive component
In the present study, the isoflavones were detected in the aglycone forms as daidzein and genistein (Figure 3). The daidzein and genistein contents and total (sum) of both isoflavones were significantly different between genotypes (Table 5). GH 63 possessed the highest daidzein and genistein contents with a total value of 338.61 µg/g (dw), followed by Devon 1 and Dega 1. Meanwhile, the lowest value was seen in Detam1, Dering 1, and Anjasmoro.
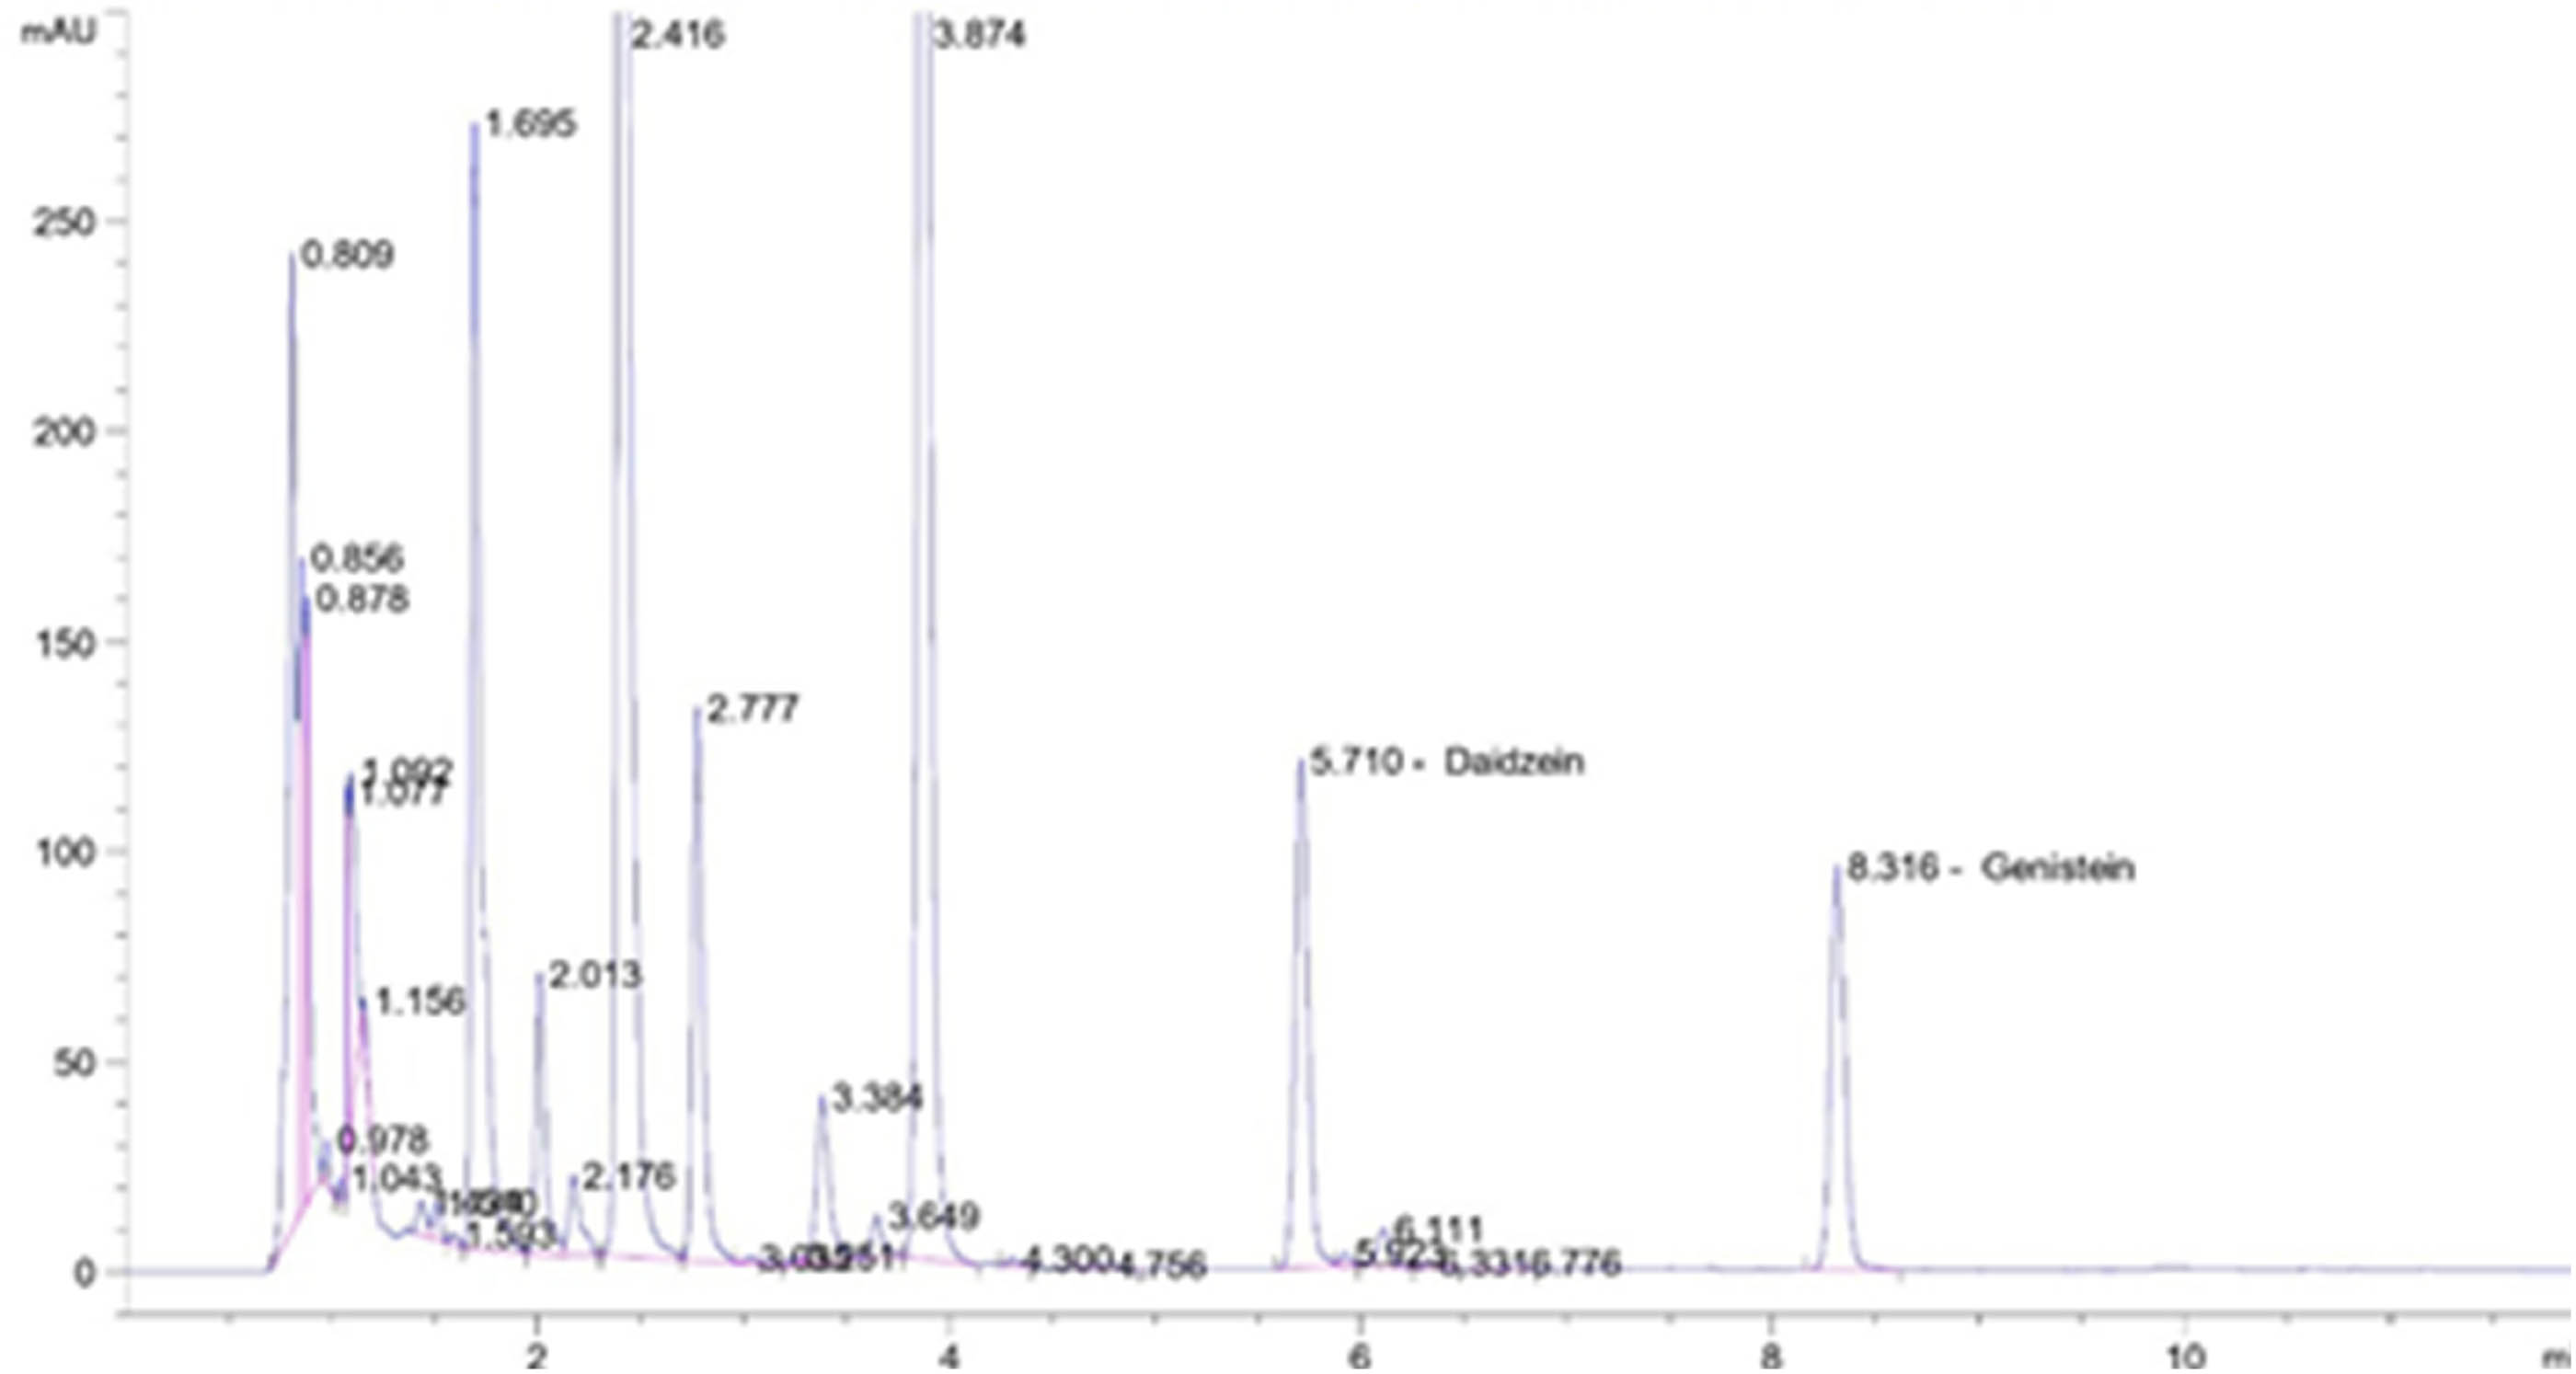
Chromatogram of daidzein and genistein detected in GH 63 genotype.
Two black-seeded genotypes, namely Detam 4 and Detam 1, had higher TFC than those of ten yellow-seeded genotypes (Table 5). No variation in TFC was observed in the yellow-seeded genotypes. Meanwhile, variations in TFC were noted between black- and yellow-seeded soybeans (Table 5), which showed genotypic variations based on the seed coat color. The black-seeded genotypes contained higher TPC than those of the yellow-seeded. Detam 4 gave the highest value of TPC (7.18 mg GAE/g), followed by Detam 1. Similarly, Detam 4 had the highest antioxidant activity compared to the yellow-seeded genotypes as well as Detam 1 (Table 5). The antioxidant activities in yellow-seeded genotypes varied from 4.25 to 5.42 mol TE/g.
3.5 Genetic variability, heritability, and correlation
The genetic variability values of all agronomic characteristics studied were classified as narrow, except for the number of unfilled pods and seed yield (Table 6). In this study, most of the soybean genotypes (10) belonged to released varieties; thus, they might have narrow genetic variability. Broad genetic variability was seen in the number of unfilled pods as normally this characteristic is less considered in releasing a new variety. High heritability was observed in all agronomic characteristics with an exception for the number of unfilled pods per plant (POU; Table 6). This reflects that all characteristics were controlled more by genetic factors relative to environment factors. Based on such reason, if the genotypes are crossed each other, expectedly the offsprings would have high heritability, and the characteristic used as a criterion for selection can be simply predicted.
Genetic variability and heritability of agronomic characteristics
| Characteristic | PCV | GCV | GSD | GCV category† | Vp | Vg | Ve | Hbs | Hbs category |
|---|---|---|---|---|---|---|---|---|---|
| DTF | 5.12 | 0.14 | 0.54 | Narrow | 26.20 | 25.56 | 0.64 | 0.98 | High |
| DTM | 4.91 | 0.06 | 0.53 | Narrow | 24.09 | 23.31 | 0.78 | 0.97 | High |
| HGT | 18.84 | 0.30 | 2.16 | Narrow | 354.96 | 331.92 | 23.04 | 0.94 | High |
| BRC | 1.07 | 0.25 | 0.15 | Narrow | 1.15 | 0.90 | 0.24 | 0.79 | High |
| NOD | 7.19 | 0.31 | 1.10 | Narrow | 51.62 | 36.52 | 15.10 | 0.71 | High |
| POF | 21.56 | 0.33 | 3.42 | Narrow | 464.83 | 310.00 | 154.83 | 0.67 | High |
| POU | 0.88 | 0.39 | 0.18 | Broad | 0.78 | 0.27 | 0.51 | 0.34 | High |
| SEW | 4.97 | 0.30 | 0.54 | Narrow | 24.72 | 23.87 | 0.85 | 0.97 | High |
| YLD | 0.46 | 0.16 | 0.07 | Broad | 0.21 | 0.15 | 0.06 | 0.73 | High |
†category for GCV/GSD; Broad – more than 2 GSD; Narrow – below 2 GSD; DTF – days to flowering; DTM – days to maturity; HGT – plant height (cm); BRC – number of branches per plant; NOD – number of productive nodes per plant; POF – number of filled pods per plant; POU – number of unfilled pods per plant; SEW – 100 seeds weight (g); YLD – seed yield per plot (t/ha); PCV – phenotypic coefficient of variation; GCV – genetic coefficient of variation; MS – mean square; Vp – phenotypic variance; Vg – genetic variance; Ve – environmental variance; Hbs – broad sense heritability.
A significant phenotypic correlation was exhibited by days to flowering (DTF) with all agronomic characteristics, except for POU, DTM with HIG and branches per plant (BRC), HIG with BRC and number of productive nodes per plant (NOD), NOD with number of filled pods per plant (POF) and POU, POF with POU, POU with YLD, and SEW with YLD (Table 7). In addition, a significant genetic correlation was also obtained for DTF with TT, BRC with SEW, as well as NOD with POF (Table 7). In the present study, YLD had a positive phenotypic correlation with DTF; however, a negative correlation was seen for YLD with POU and SEW. Meanwhile, no genetic correlation between YLD with other characteristics was noted.
Phenotypic and genetic correlation among agronomic characteristics
| Characteristic | DTM | HGT | BRC | NOD | POF | POU | SEW | YLD |
|---|---|---|---|---|---|---|---|---|
| DTF | 0.624** | 0.865** | 0.71** | 0.578** | 0.561** | 0.136 | −0.82** | 0.573** |
| 0.642 | 0.887** | 0.81* | 0.695 | 0.699 | 0.215 | −0.84** | 0.678 | |
| DTM | 0.606** | 0.333** | 0.09 | 0.08 | 0.045 | −0.064 | 0.007 | |
| 0.638 | 0.373 | 0.11 | 0.1 | 0.08 | −0.067 | 0.007 | ||
| HGT | 0.61** | 0.584** | 0.058 | 0.021 | −0.082 | 0.074 | ||
| 0.71 | 0.712 | 0.073 | 0.039 | −0.085 | 0.087 | |||
| BRC | 0.562** | 0.524** | 0.019 | −0.077 | 0.063 | |||
| 0.583 | 0.425 | 0.02 | −0.088 | 0.087 | ||||
| NOD | 0.815** | 0.46** | −0.079 | 0.019 | ||||
| 0.914** | 0.444 | −0.093 | 0.03 | |||||
| POF | 0.476** | −0.079 | 0.014 | |||||
| 0.328 | −0.098 | 0.182 | ||||||
| POU | −0.023 | −0.23* | ||||||
| −0.037 | 0.078 | |||||||
| SEW | −0.418** | |||||||
| −0.538 |
**significant at P < 0.01; *significant at P < 0.05; Upper – phenotypic correlation; lower – genetic correlation; DTF – days to flowering; DTM – days to maturity; HGT – plant height (cm); BRC – number of branches per plant; NOD – number of productive nodes per plant; POF – number of filled pods per plant; POU – number of unfilled pods per plant; SEW – 100 seeds weight (g); YLD – seed yield per plot (t/ha).
The genetic variability of all genotypes was narrow, while the heritability was high (Table 8). The category for genetic variability in this study was calculated based on genetic standard deviation. The broad sense of heritability of chemical composition and bioactive components varied from 0.82 to 0.96. The lowest heritability was reached by fat content, and the highest value was reached by TPC.
Genetic variability and heritability of seed characteristics
| Characteristic | PCV | GCV | GSD | Category† | Vp | Vg | Ve | Hbs |
|---|---|---|---|---|---|---|---|---|
| ASH | 0.32 | 0.05 | 0.04 | Narrow | 0.10 | 0.10 | 0.01 | 0.93 |
| PROT | 1.81 | 0.05 | 0.23 | Narrow | 3.28 | 2.89 | 0.40 | 0.88 |
| FAT | 2.11 | 0.11 | 0.28 | Narrow | 4.45 | 3.66 | 0.79 | 0.82 |
| TFC | 746.40 | 0.79 | 81.13 | Narrow | 557106.99 | 537130.79 | 19976.20 | 0.96 |
| TPC | 1486.96 | 0.32 | 176.23 | Narrow | 2211051.93 | 2021845.67 | 189206.27 | 0.91 |
| DAID | 65.86 | 0.70 | 7.32 | Narrow | 4337.17 | 4130.83 | 206.35 | 0.95 |
| GEN | 32.15 | 0.54 | 3.80 | Narrow | 1033.88 | 946.79 | 87.10 | 0.92 |
| TDG | 96.09 | 0.63 | 10.89 | Narrow | 9233.41 | 8692.44 | 540.97 | 0.94 |
| ANOX | 1.17 | 0.21 | 0.14 | Narrow | 1.37 | 1.21 | 0.16 | 0.89 |
†category for GCV/GSD; Broad – more than 2 GSD; Narrow – below 2 GSD; ASH – ash content (% dw); PRT – protein (% dw); FAT – fat (% dw); TFC – total flavonoid content (mg CE/g dw); TPC – total phenolic content (mg GAE/g dw); DAID – daidzein (µg/g dw); GEN – genistein (µg/g dw); TDG – total daidzein and genistein content (µg/g dw); ANOX – antioxidant activity (µmol TE/g dw); PCV – phenotypic coefficient of variation; GCV – genetic coefficient of variation; MS – mean square; Vp – phenotypic variance; Vg – genetic variance; Ve – environmental variance; Hbs – broad sense heritability.
Table 9 shows the relation between seed chemical composition and bioactive components. There was no correlation between protein and fat contents. Meanwhile, daidzein positively correlated with genistein. However, both isoflavones negatively correlated with TFC. The latter was noted to have a positive correlation with TPC.
Phenotypic and genetic correlation among seed characteristics
| Characteristic | PROT | FAT | TFC | TPC | DAID | GEN | TDG | ANOX |
|---|---|---|---|---|---|---|---|---|
| ASH | 0.074 | −0.275* | 0.003 | −0.009 | 0.023 | 0.032 | 0.026 | 0.006 |
| 0.076 | −0.291 | 0.003 | −0.01 | 0.025 | 0.034 | 0.029 | 0.008 | |
| PROT | −0.191 | 0.084 | 0.079 | −0.122 | −0.021 | −0.016 | 0.049 | |
| −0.232 | 0.092 | 0.087 | −0.107 | −0.022 | −0.016 | 0.054 | ||
| FAT | −0.006 | −0.004 | −0.123 | −0.272* | −0.019 | 0.001 | ||
| −0.008 | −0.005 | −0.122 | −0.292 | −0.021 | 0.002 | |||
| TFC | 0.938** | −0.031 | −0.035 | −0.298** | 0.863** | |||
| 0.962** | −0.033 | −0.038 | −0.314 | 0.903** | ||||
| TPC | −0.02 | −0.032 | −0.024 | 0.843** | ||||
| −0.021 | −0.034 | −0.025 | 0.895** | |||||
| DAID | 0.912** | 0.991** | −0.015 | |||||
| 0.914** | 0.991** | −0.016 | ||||||
| GEN | 0.96** | −0.158 | ||||||
| 0.96** | −0.142 | |||||||
| TDG | −0.153 | |||||||
| −0.139 |
**significant at P < 0.01; *significant at P < 0.05; Upper – phenotypic corrletaion; lower – genetic correlation; ASH – ash content (% dw); PRT – protein (% dw); FAT – fat (% dw); TFC – total flavonoid content (mg CE/g dw); TPC – total phenolic content (mg GAE/g dw); DAID – daidzein (µg/g dw); GEN – genistein (µg/g dw); TDG – total daidzein and genistein content (µg/g dw); ANOX – antioxidant activity (µmol TE/g dw).
No genetic correlation was observed between the agronomic and seed chemical characteristics (Table 10). However, a phenotypic correlation was noted for TFC and TPC. In particular, TPC showed phenotypic correlations with all agronomic characteristics studied, except for unfilled pods. Similar phenotypic correlations were also seen for TPC with all characteristics, with the exception of POU. Meanwhile, TFC showed significant phenotypic correlations with flowering day, number of productive nodes, and 100-seed weight.
Phenotypic dan genetic correlation between agronomic and seed characteristics
| Characteristic | DTF | DTM | HGT | BRC | NOD | POF | POU | SEW | YLD |
|---|---|---|---|---|---|---|---|---|---|
| ASH | −0.019 | 0.021 | −0.017 | 0.026 | 0.033 | 0.022 | 0.042 | −0.009 | −0.019 |
| −0.020 | 0.022 | −0.018 | 0.030 | 0.040 | 0.026 | 0.070 | −0.009 | −0.019 | |
| PROT | 0.021 | 0.044 | −0.011 | 0.001 | 0.042 | 0.043 | 0.010 | −0.033 | −0.018 |
| 0.023 | 0.048 | −0.012 | 0.000 | 0.054 | 0.053 | 0.015 | −0.035 | −0.023 | |
| FAT | −0.030 | −0.043 | −0.001 | −0.031 | −0.028 | −0.027 | −0.003 | 0.021 | 0.019 |
| −0.034 | −0.048 | −0.001 | −0.035 | −0.036 | −0.034 | −0.009 | 0.025 | 0.027 | |
| TFC | 0.297** | 0.000 | 0.064 | 0.000 | 0.449** | 0.000 | −0.073 | −0.480** | 0.000 |
| 0.290 | 0.000 | 0.060 | 0.000 | 0.527 | 0.000 | −0.156 | −0.502 | 0.000 | |
| TPC | 0.446** | 0.288** | 0.226* | 0.417** | 0.470** | 0.528** | −0.061 | −0.590** | 0.228* |
| 0.445 | 0.298 | 0.218 | 0.442 | 0.602 | 0.592 | −0.257 | −0.636 | 0.300 | |
| DAID | −0.035 | −0.060 | −0.051 | −0.002 | −0.049 | −0.062 | −0.009 | 0.03 | −0.004 |
| −0.037 | −0.063 | −0.054 | −0.002 | −0.059 | −0.076 | −0.010 | 0.032 | −0.006 | |
| GEN | −0.036 | −0.059 | −0.054 | −0.004 | −0.052 | −0.050 | −0.004 | 0.024 | −0.020 |
| −0.039 | −0.063 | −0.059 | −0.003 | −0.062 | −0.060 | 0.003 | 0.026 | −0.026 | |
| TDG | −0.036 | −0.061 | −0.053 | −0.003 | −0.051 | −0.059 | −0.008 | 0.029 | −0.010 |
| −0.038 | −0.064 | −0.057 | −0.002 | −0.061 | −0.072 | −0.006 | 0.03 | −0.012 | |
| ANOX | 0.032 | 0.002 | 0.013 | 0.053 | 0.034 | 0.047 | −0.017 | −0.055 | 0.032 |
| 0.033 | 0.001 | 0.014 | 0.063 | 0.042 | 0.060 | −0.033 | −0.06 | 0.038 |
**significant at P < 0.01; *significant at P < 0.05; DTF – days to flowering; DTM – days to maturity; HGT – plant height (cm); BRC – number of branches per plant; NOD – number of productive nodes per plant; POF – number of filled pods per plant; POU – number of unfilled pods per plant; SEW – 100-seed weight (g); YLD – seed yield per plot (t/ha); ASH – ash content (% dw); PRT – protein (% dw); FAT – fat (% dw); TFC – total flavonoid content (mg CE/g dw); TPC – total phenolic content (mg GAE/g dw); DAID – daidzein (µg/g dw); GEN – genistein (µg/g dw); TDG – total daidzein and genistein content (µg/g dw); and ANOX – antioxidant activity (µmol TE/g dw).
4 Discussion
The environment's optimal temperature and relative humidity for soybean growth and development are about 22‒27°C and 78.5‒81.6%, respectively [21]. Figure 2 shows that the relative humidity met the crop requirement; however, the temperature was relatively high. Elevated temperature may speed up the pod filling and increase the total number of pods per plant [22].
The significant effects of replication on days to flowering, DTM, and plant height might be caused by the differences in soil chemical properties as replicate 1 had lower CEC and higher Fe values relative to other replicates. The plant height in replicate 1 (57.3 cm) was lower than in replicate 2 (64.1 cm) and 3 (63.1 cm). This may be related to the higher amount of Fe in the soil, which may decrease the plant height [23]. A lower CEC value in replicate 1 may decrease the nutrient availability [24], resulting in extended days to flowering and maturity.
In general, days to flowering and maturity expose high heritability [25]; thus, differences in both characteristics due to crossed location may not be significant. In contrast to our findings, Kuswantoro et al. reported that the days to flowering and maturity of a particular genotype would be consequently different when grown in locations with considerable differences in temperature and rainfall [26]. The heritability of the number of branches belonged to moderate, suggesting that genetic and growing environments considerably dictated the number of branches [25]. The number of pods per plant is dictated by the interaction between the variety and the environment. The heritability of this characteristic in soybeans varied from moderate [26] to high [27]; thus, it might give different results from different studies.
A high heritability for protein and fat contents was also investigated in soybean seeds [28]. In particular for bioactive components, the values were relatively high and had narrow variation (0.89–0.96), reflecting that the heritability for such characteristics was more controlled by the genetic factor rather than the environmental factor.
The correlation between seed yield and 100-seed weight is not consistent across experiments. In this study, seed yield had a negative correlation with 100-seed weight, but previous studies reported that seed yield positively correlated with 100-seed weight [27,29]. This phenomenon may be due to the differences in plant materials and growing conditions. The 100-seed weight obtained in the present study was relatively greater than those listed in the variety description, which was 22.98 and 14.3 g for Dega 1 and Dena 1, respectively [4]. The 100-seed weight was significantly affected by genetic, growing conditions or environments, and interaction of both factors [30]. A study conducted under 20 different environments proved that the heritability of 100-seed weight was 79%, indicating that most of the variation is related to genetic factors [30]. A similar finding was also recorded for 146 soybean accessions grown in three eco-regions in China with a broad-sense heritability ranging from 69.93 to 95.99% [31].
No single genotype showed protein content >40%, including Detam 1 which was previously recorded to have high protein content (45.36% dw) in the variety description [4]. Growing environment and planting time may contribute to such variations in protein content [32]. The values obtained in this study were within the range of protein contents of 49 soybean genotypes (yellow and black-seeded) grown previously at the same location c.a. 34.72–40.54% (dw) [17]. In terms of utilization for food products, 12 genotypes that contained protein >35% (dw) were tailored for ingredients of tofu, soymilk, and soy sauce as well as with large seed sizes for tempe [5].
The fat values studied were slightly smaller than most of the improved soybean varieties released in Indonesia that ranging from 13.06% to 20.48% (dw) [4] as well as 20 soybean genotypes adapted to acid soil c.a. 16.85‒20.58% (dw) [16]. Besides genetic factors, growing conditions, particularly temperature would linearly increase the amount of fat [33]. Maturity and planting season or date in a particular region were also essential in determining the soybean composition, including fat [34]. In addition to genetic factors, the ash content is likely dictated by the amounts of Ca, P, Na, K, Fe, and Mg, which are closely related to soil fertility conditions of soybean crops [35]. The fact that replicates in this study significantly affected the ash content (data not shown) was in agreement with the differences in soil chemical properties, particularly the amount of Fe which is higher in replicate 1 than in other replicates (Table 2).
The total genistein and daidzein content obtained in GH 63 was considerably greater than those of Devon 1 and Devon 2, which were previously released as varieties containing considerable amounts of isoflavones [4]. Detam 4, which was a black-seeded genotype, contained relatively higher total daidzein and genistein content relative to Detam 1. Genetic factor seems to be predominantly dictating the isoflavone content as both genotypes were grown at the same location, particularly the proportion of secondary metabolites in each variety. A similar phenomenon was also observed in Detap 1 as a new breed of Anjasmoro variety, which exhibited a total value of 1.8-fold greater than its parent (Table 5). The major role of genetic factors in isoflavone accumulation in soybean seed across environments is also highlighted by Pei et al. [36].
The mean of daidzein and genistein content found in this study was lower relative to those of seven soybean varieties originating from Vietnam c.a. 316 and 91 µg/g, respectively [37]. However, the present study’s results were higher than the values noted in four Brazil soybean genotypes c.a. 35.5–61.4 µg/g and 26.2–44.4 µg/g for daidzein and genistein, respectively [38] as well as in 20 promising lines adapted to acid soil that ranged from 0–10.9 µg/g for daidzein and 3.2–20.4 µg/g for genistein [16] and in 218 Chinese soybean genotypes, ranging from 4.2 to 24.7 µg/g for daidzein and 4.2–31.5 µg/g for genistein [39]. In particular, Daud et al. [40] reported a lower genistein content in Dena 1 variety (52.4 µg/g), while higher daidzein and genistein content was found in Devon 1 variety c.a. 191.1 and 170.4 µg/g, respectively [41]. In addition to genetic variability, these differences may be due to growing conditions. High temperature and dry environment may cause a decrease in isoflavone content [42].
Both Detam 4 and Detam 1 exhibited slightly lower TFC relative to six Indonesian black-seeded genotypes (3.47 ± 1.50 mg CE/g) as reported by Yusnawan [13]. The differences in seed coat colors may cause differences in TFCs among soybean seeds. The main naturally occurring flavonoid compounds in soybean seeds are anthocyanins, proanthocyanidins, and isoflavones. Anthocyanins and proanthocyanidins are predominantly condensed in black-seeded soybeans [43]. Anthocyanins are not found in soybeans with yellow and green seed coat colors [43]; thus, isoflavones account for the largest proportion of TFC in these types of soybeans [43]. The highest to lowest isoflavone contents in soybeans differing in seed coat colors are green, black, yellow, and yellowish green [44]. No significant variation in TFC in yellow-seeded genotypes in this study may be due to compounds other than isoflavones that may also contribute to TFC.
Significant differences in TPC between black and yellow-seeded soybean genotypes as noted in the present study were also reported by some authors [18,45], and the highest value was seen in the black-seeded genotypes. TPC as a source of antioxidants is valuable for human consumption due to its beneficial health effects. The high TPC in black-seeded soybeans compared to yellow-seeded indicate that black-seeded soybeans contain high concentrations of bioactive compounds belonging to the phenolic groups. This reflects that the seed coat of soybean contributes more to TPC than the embryo and cotyledons [46].
Variations of TPC in black-seeded soybeans were also found in 20 genotypes grown in Korea with TPC ranging from 1.99 to 5.54 mg GAE/g [47] with the lowest TPC (1.99 mg GAE/g) much lower than Detam 1 (6.24 mg GAE/g). The range of TPC in the yellow-seeded genotypes (3.14‒7.18 mg GAE/g) was within the average value investigated in light yellow, yellow, and greenish yellow-seeded soybeans from Korea that was 4.69, 4.80, and 5.04 mg GAE/g, respectively [48]. Methods of extraction and measurement of bioactive compounds may affect the different TPC in a particular sample in addition to the differences in soybean genotypes [20,48].
The antioxidant values of DPPH obtained in Detam 4 and Detam 1 (7.83 and 5.88 µmol TE/g) were lower than the antioxidant values of DPPH reported in black soybean extracts, which were between 10.99 and 20.38 µmol TE/g [18]. However, a higher antioxidant activity in black-seeded genotypes compared to yellow-seeded genotypes was in line with the previous study, which was analyzed using the DPPH,2,2′-azino-bis (3-ethylbenzothiazoline-6-sulfonic acid) (ABTS), and ferric reducing antioxidant power methods [49]. Antioxidant activities in black- and yellow-seeded soybeans were positively correlated with anthocyanin and isoflavone contents as reported by Bursać et al. [45] and Dhungana et al. [50]. Anthocyanins are predominantly present in black-seeded soybeans, while isoflavones exist predominantly in yellow-seeded soybeans [47,51].
Table 8 shows that all characteristics of chemical composition and bioactive components had a narrow genetic coefficient of variation (GCV), suggesting that 12 soybean genotypes exhibited a closed genetic relationship. This is interesting as they are primarily released for different trait purposes (derived from different parental genotypes) as listed in Table 1. A similar GCV confirmed in the present study may be due to most of the genotypes used being improved varieties. However, if we look at each characteristic, the variability occurred, such as high amounts of TFC and TPC in Detam 4 and high daidzein and genistein contents in GH 63. Thus, both genotypes can be used further as gene sources for increasing TFC and TPC (Detam 4) as well as daidzein and genistein contents (GH 63).
A previous study reported that the protein content of soybeans had a negative correlation with fat content [16]. However, in present study, such a correlation was not obtained (Table 9). A narrow range of protein content as shown in Table 5 may be attributed to this finding. Both genistein and daidzein significantly affected the total isoflavone content. However, total daidzein and genistein content had a negative correlation with TFC. In fact, isoflavones belong to flavonoids [52], suggesting that the greater the value of total isoflavones, the lower the content of other flavonoid compounds. TFC showed a positive correlation with TPC, and both significantly influenced the antioxidant activity as seen in Table 9. The phenolic compounds are found to be primarily responsible for the antioxidant activity of soybeans [12].
A positive correlation obtained in this study between TPC and seed yield (Table 10) may suggest a possibility of such bioactive component contribution to the yield of soybean crops. Phenolic compounds are known to have an important role as a defensive mechanism in a plant against insects, microorganisms, and competing plants [53].
The seed size is essential regarding the end-use of soybeans. Yellow and large-seeded soybeans are favorable for the ingredient of tempe due to the bigger volume of tempe produced relative to those of small and medium-seeded soybeans [5]. Based on the seed size criteria, eight genotypes belonged to yellow and large-seeded (including two promising lines of GH 63 and GH 73) were desired for tempe preparation, while 10 genotypes with yellow and large to medium-seeded were suitable for ingredients of tofu and soymilk and two black-seeded genotypes with medium size were tailored for soy sauce. This reflects that the 100-seed weight or seed size characteristic is highly of concern in releasing improved soybean varieties in Indonesia considering the preferences of soybean food processors and consumers.
5 Conclusion
This study reflects that soybean agronomic characteristics, seed chemical composition, and bioactive components were greatly dictated by soybean genotype. Regarding the seed coat color, size, and protein content criteria, eight, ten, and two studied genotypes were respectively tailored for ingredients of tempe, tofu, soy milk, and soy sauce. Significant phenotypic correlations of TPC with most agronomic characteristics suggest that both traits can be used as criteria for soybean breeding selection. Two high-yielding promising lines (GH 63 and GH 73) with large seed size and early maturity superiority are potential as soybean variety candidates adapted/tolerant to those regions with water shortage conditions. Nutritional and health benefits of soybeans can be improved by using two genotypes, namely Detam 4 (black-seeded) and GH 63 (yellow-seeded) as the gene resources. Promising lines derived from both genotypes either the black- or yellow-seeded would enrich the farmers’ and processors’ choices of superior soybeans.
Acknowledgments
The authors thank The Ministry of Agriculture through the Agency for Agricultural Research and Development for research facility support as well as Purwono, Sutrisno, Fajar, Lina Kusumawati, Ria Gustina, Yulius Eko Laksamana Samba, Amri Amanah, and Intarti for their technical and administrative assistance.
-
Funding information: This study was funded by The Indonesian Ministry of Finance/LPDP through The Ministry of Research and Technology/National Research and Innovation Agency (PRN Kedelai-02/2020-2021).
-
Author contributions: Conceptualization: H.K., E.G., E.Y., J.S.U., T.S. Methodology: H.K., E.G., E.Y., J.S.U. Formal analysis: H.K., E.G., E.Y., J.S.U. Investigation: H.K., E.G., E.Y., J.S.U., T.S. Writing-original draft: H.K., E.G., E.Y., J.S.U., T.S. Writing-review & editing: H.K., E.G., E.Y., J.S.U. Supervision: H.K., E.G., T.S. Project administration: T.S., E.G. Funding acquisition: E.G., T.S. All co-authors reviewed the final version and approved the manuscript before submission.
-
Conflict of interest: The authors state no conflict of interest.
-
Data availability statement: The datasets generated during and/or analyzed during the current study are available from the corresponding author on reasonable request.
References
[1] Pusat Data dan Informasi Pertanian [PDIP]. Buletin Konsumsi Pangan (Bulettin of Food Consumption). 2014;5:9–14. http://epublikasi.setjen.pertanian.go.id/arsip-buletin/53-buletin-konsumsi/189-buletin-konsumsi-pangan-volume-5-no-2-tahun-2014.Search in Google Scholar
[2] Triyanti DR. Soybean outlook. Center for Data and Information System. Indonesian Ministry of Agriculture Jakarta. [in Indonesian]. 2020. http://epublikasi.pertanian.go.id/arsip-outlook/81-outlook-tanaman-pangan/741-outlook-kedelai-2020.Search in Google Scholar
[3] Sleper DA, Poehlman JM. Breeding Field Crops. 5th edn. Oxford, UK: Wiley-Blackwell Publishing; 2006.Search in Google Scholar
[4] ILETRI. Description of New Improved Legumes and Tuber Varieties. Indonesian Legume and Tuber Crops Research Institute. Malang. 2021. [Indonesian]. [Accessed Nov 19 2021].Search in Google Scholar
[5] Ginting E, Utomo JS, Kuswantoro H, Han WY. Physicochemical characteristics of promising soybean lines adapted to acid soil and the tofu produced. Biodiversitas. 2021;22(11):5012–22. 10.13057/biodiv/d221137.Search in Google Scholar
[6] Kiani R, Arzani A, Mirmohammady Maibody SAM. Polyphenols, flavonoids, and antioxidant activity involved in salt tolerance in wheat, Aegilops cylindrica and their amphidiploids. Front Plant Sci. 2021;12:646221. 10.3389/fpls.2021.646221.Search in Google Scholar PubMed PubMed Central
[7] Tepavčević V, Cvejić J, Poša M, Bjelica A, Miladinović J, Rizou M, et al. Classification and discrimination of soybean (Glycine max (L.) Merr.) genotypes based on their isoflavone content. J Food Compos Anal. 2021;95:103670. 10.1016/j.jfca.2020.103670.Search in Google Scholar
[8] Kim EH, Lee OK, Kim JK, Kim SL, Lee J, Kim SH, et al. Isoflavones and anthocyanins analysis in soybean (Glycine max (L.) Merill) from three different planting locations in Korea. Field Crop Res. 2014;156:76–83. 10.1016/j.fcr.2013.10.020.Search in Google Scholar
[9] Devi MA, Kumar SS, Giridhar P. LC–ESI–MS based characterization of isoflavones in soybean (Glycine max (L.) Merr.) from India. J Food Sci Technol. 2018;55:5045–54. 10.1007/s13197-018-3443-0.Search in Google Scholar PubMed PubMed Central
[10] Hsiao YH, Ho CT, Pan MH. Bioavailability and health benefits of major isoflavone aglycones and their metabolites. J Funct Foods. 2020;74:104164. 10.1016/j.jff.2020.104164.Search in Google Scholar
[11] Hu C, Wong WT, Wu R, Lai WF. Biochemistry and use of soybean isoflavones in functional food development. Crit Rev Food Sci Nut. 2020;60(12):2098–112. 10.1080/10408398.2019.1630598.Search in Google Scholar PubMed
[12] Król-Grzymała A, Amarowicz R. Phenolic compounds of soybean seeds from two European countries and their antioxidant properties. Molecules. 2020;25:2075. 10.3390/molecules25092075.Search in Google Scholar PubMed PubMed Central
[13] Yusnawan E. The diversity of secondary metabolites in Indonesian soybean genotypes. Biodiversitas. 2016;17(2):704–10. 10.13057/biodiv/d170245.Search in Google Scholar
[14] Alghamdi SS, Khan MA, El-Harty EH, Ammar MH, Farooq M, Migdadi HM. Comparative phytochemical profiling of different soybean (Glycine max (L.) Merr) genotypes using GC–MS. Saudi J Bio Sci. 2018;25(1):15–21. 10.1016/j.sjbs.2017.10.014.Search in Google Scholar PubMed PubMed Central
[15] Bellaloui N, Bruns HA, Abbas HK, Mengistu A, Fisher DK, Reddy KN. Agricultural practices altered soybean seed protein oil fatty acids sugars and minerals in the Midsouth USA. Front Plant Sci. 2015;6(article 31):1–14. 10.2135/cropsci2010.04.0187.Search in Google Scholar
[16] Ginting E, Yulifianti R, Kuswantoro H, Lee BW, Baek IY. Protein, fatty acid and isoflavone contents of soybean lines tolerant to acid soil. J Korean Soc Inter Agric. 2018;30(3):167–76. http://db.koreascholar.com/article.aspx?code=357239.10.12719/KSIA.2018.30.3.167Search in Google Scholar
[17] Kuswantoro H, Ginting E, Yuniarti N, Artari R, Rahajeng W, Nugrahaeni N. Agronomic characters and seed protein content of soybean (Glycine max [L.] Merr.) lines across environments. SABRAO J Breed Gen. 2020;52(2):91–108. http://sabraojournal.org/wp-content/uploads/2020/06/SABRAO-J-Breed-Genet-522-91-108Kuswantoro.pdf.Search in Google Scholar
[18] Badan Standarisasi Nasional. Testing Procedure for Foods and Drinks (SNI 01-2891-1992). Badan Standarisasi Nasional. Jakarta. [Indonesian]. 1992. https://fdokumen.com/document/sni-01-2891-1992-cara-uji-makanan-dan-minuman.html. [Accessed March 14 2021].Search in Google Scholar
[19] AOAC. Microchemical determination of nitrogen using microKjeldhal method (12.1.07). In: Latimer Jr GW, editor. Official Methods of Analysis of AOAC International. 20th edn. 2016. Rockyville, Maryland, USA: AOAC International. Chapter 12, p. 7.Search in Google Scholar
[20] Yusnawan E. Effects of different extraction methods on total phenolic content and antioxidant activity in soybean cultivars. IOP Conf Series: Earth Environ Sci. 2018;102(1):012039. 10.1088/1755-1315/102/1/012039.Search in Google Scholar
[21] Alsajri FA, Singh B, Wijewardana C, Irby JT, Gao W, Reddy KR. Evaluating soybean cultivars for low- and high-temperature tolerance during the seedling growth stage. Agron. 2019;9(1):13. 10.3390/agronomy9010013.Search in Google Scholar
[22] Allen LH, Zhang L, Boote KJ, Hauser BA. Elevated temperature intensity timing and duration of exposure affect soybean internode elongation mainstem node number and pod number per plant. Crop J. 2018;6(2):148–61. 10.1016/j.cj.2017.10.005.Search in Google Scholar
[23] Gülser F, Yavuz HI, Gökkaya TH, Sedef M. Effects of iron sources and doses on plant growth criteria in soybean seedlings. Eurasian J Soil Sci. 2019;8(4):298–303. 10.18393/ejss.582231.Search in Google Scholar
[24] Ngiruwonsanga I, Maniragaba A, Muhirwa F. The cation exchange capacity, pH of soil in Mwogo Marshland, and the rice plantation in Huye District -Rwanda. Int J Environ Agric Res. 2019;5(2):36–40.Search in Google Scholar
[25] Kuswantoro H. Genetic variability and heritability of acid-adaptive soybean promising lines. Biodiversitas. 2017;18(1):378–82. 10.13057/biodiv/d180148.Search in Google Scholar
[26] Kuswantoro H, Artari R, Rahajeng W, Ginting E, Supeno A. Genetic variability heritability and correlation of some agronomical characters of soybean varieties. Biosaintifika J Bio Bio Edu. 2018;10(1):9–15. 10.15294/biosaintifika.v10i1.9939.Search in Google Scholar
[27] Kuswantoro H, Santoso J, Suryanto A. Genetic variability correlation and path coefficient among agronomic characters of soybeans [Glycine max (L.) Merr.] lines. IOP Conf Ser: Earth Environ Sci. 2022;1114:012037. 10.1088/1755-1315/1114/1/012037.Search in Google Scholar
[28] Chandrawati KS, Baig KS, Hashmi S, Sarang DH, Kumar A, Dumai PK. Study on genetic variability heritability and genetic advance in soybean. Inter J Pure App Bio. 2017;5(1):57–63. 10.18782/2320-7051.2592.Search in Google Scholar
[29] Faot MM, Zubaidah S, Kuswantoro H. Genetic correlation and path analysis of agronomical traits of soybean (Glycine max) lines infected by CpMMV. Biodiversitas. 2019;20(6):1496–503. 10.13057/biodiv/d200602.Search in Google Scholar
[30] Qi Z, Song J, Zhang K, Liu S, Tian X, Wang Y, et al. Identification of QTNs controlling 100-seed weight in soybean using multilocus genome-wide association studies. Front Gen. 2020;11:689. 10.3389/fgene.2020.00689.Search in Google Scholar PubMed PubMed Central
[31] Li J, Zhao J, Li Y, Gao Y, Hua S, Nadeem M, et al. Identification of a novel seed size associated locus SW9-1 in soybean. Crop J. 2019;7(4):548–59. 10.1016/j.cj.2018.12.010.Search in Google Scholar
[32] Medic J, Atkinson C, Hurburgh CR. Current knowledge in soybean composition. J Am Oil Chem Soc. 2014;91:363–84. 10.1007/s11746-013-2407-9.Search in Google Scholar
[33] Alsajri FA, Wijewardana C, Irby JT, Bellaloui N, Krutz LJ, Golden B, et al. Developing functional relationships between temperature and soybean yield and seed quality. Agron J. 2020;112(1):194–204. 10.1002/agj2.20034.Search in Google Scholar
[34] Mourtzinis S, Gaspar AP, Naeve SL, Conley S. Planting date maturity and temperature effects on soybean seed yield and composition. Agron J. 2017;109(5):2040–9. 10.2134/agronj2017.05.0247.Search in Google Scholar
[35] Vargas RLD, Schuch LO, Barros WS, Rigo GA, Szareski VJ, Carvalho IR, et al. Macronutrients and micronutrients variability in soybean seeds. J Agric Sci. 2018;10(4):209–22. 10.5539/jas.v10n4p209.Search in Google Scholar
[36] Pei R, Zhang J, Tian L, Zhang S, Han F, Yan S, et al. Identification of novel QTL associated with soybean isoflavone content. Crop J. 2018;6(3):244–52. 10.1016/j.cj.2017.10.004.Search in Google Scholar
[37] Cong LC, Seguin P, Khanh TD, Kim EH, Ahn JK, Chung IM. Isoflavone concentrations and composition of soybean varieties grown in upland and lowland regions of Vietnam. Korean J Crop Sci. 2011;56(1):64–71. 10.7740/kjcs.2011.56.1.064.Search in Google Scholar
[38] Ciabotti S, Silva ACBB, Juhasz ACP, Mendonça CD, Tavano OL, Mandarino JMG, et al. Chemical composition protein profile and isoflavones content in soybean genotypes with different seed coat colors. Int Food Res J. 2016;23(2):621–9. https://ainfo.cnptia.embrapa.br/digital/bitstream/item/142166/1/chemical-composition-protein-profile-.mandarino.pdf.Search in Google Scholar
[39] Azam M, Zhang S, Qi J, Abdelghany AM, Shaibu AS, Ghosh S, et al. Profiling and associations of seed nutritional characteristics in Chinese and USA soybean cultivars. J Food Compos Anal. 2021;98:103803. 10.1016/j.foodres.2019.108957.Search in Google Scholar PubMed
[40] Daud A, Sulistyarti H, Retnowati R, Ginting E. High performance liquid chromatography (HPLC) method for determination of isoflavones content in shade-tolerant soybean Dena 1. IOP Conf Series: Mater Sci Eng. 2019;546:032004. 10.1088/1757-899X/546/3/032004.Search in Google Scholar
[41] Setyawati E, Martono S, Riyanto S, Lukitaningsih E. Development and validation for free aglycones daidzein and genistein in soybean [Glycine max (L.) Merr] using RP HPLC method. Int J Appl Pharm. 2019;11(2):138–42. https://innovareacademics.in/journals/index.php/ijap/article/view/31222.10.22159/ijap.2019v11i2.31222Search in Google Scholar
[42] Carrera CS, Dardanelli JL. Changes in the relationship between temperature during the seed‐filling period and soya bean seed isoflavones under water‐deficit conditions. J Agron Crop Sci. 2016;202(6):421–32. 10.2135/cropsci2010.06.0314.Search in Google Scholar
[43] Lim YJ, Kwon SJ, Qu S, Kim DG, Eom SH. Antioxidant contributors in seed seed coat and cotyledon of γ-ray-induced soybean mutant lines with different seed coat colors. Antioxidants. 2021;10(3):353. 10.3390/antiox10030353.Search in Google Scholar PubMed PubMed Central
[44] Choi YM, Yoon H, Lee S, Ko HC, Shin MJ, Lee MC, et al. Comparison of isoflavone composition and content in seeds of soybean (Glycine max (L.) Merrill) germplasms with different seed coat colors and days to maturity. Korean J Plant Res. 2020;33(6):558–77. 10.7732/kjpr.2020.33.6.558.Search in Google Scholar
[45] Bursać M, Krstonošić MA, Miladinović J, Malenčić Đ, Gvozdenović L, Cvejić JH. Isoflavone composition, total phenolic content and antioxidant capacity of soybeans with colored seed coat. Nat Prod Commun. 2017;12(4):527–32. 10.1177/1934578X1701200.Search in Google Scholar
[46] Kumar A, Ramesh KV, Singh C, Sripathy KV, Agarwal DK, Pal G, et al. Bioprospecting nutraceuticals from soybean (Glycine max) seed coats and cotyledons. Indian J Agric Sci. 2019;89(12):2064–8. 10.1007/s13197-018-3443-0.Search in Google Scholar PubMed PubMed Central
[47] Choi YM, Yoon H, Lee S, Ko HC, Shin MJ, Lee MC, et al. Isoflavones anthocyanins phenolic content and antioxidant activities of black soybeans (Glycine max (L.) Merrill) as affected by seed weight. Sci Rep. 2020;10(1):19960. 10.1038/s41598-020-76985-4.Search in Google Scholar PubMed PubMed Central
[48] Choi YM, Yoon H, Shin MJ, Lee Y, Hur OS, Lee BC, et al. Metabolite contents and antioxidant activities of soybean (Glycine max (L.) Merrill) seeds of different seed coat colors. Antioxidants. 2021;10:1210. 10.3390/antiox10081210.Search in Google Scholar PubMed PubMed Central
[49] Lee LS, Choi EJ, Kim CH, Kim YB, Kum JS, Park JD. Quality characteristics and antioxidant properties of black and yellow soybeans. Korean J Food Sci Technol. 2014;46(6):757–61. 10.9721/KJFST.2014.46.6.757.Search in Google Scholar
[50] Dhungana SK, Seo JH, Kang BK, Park JH, Kim JH, Sung JS, et al. Protein amino acid oil fatty acid sugar anthocyanin isoflavone lutein and antioxidant variations in colored seed-coated soybeans. Plants. 2021;10(9):1765. 10.3390/plants10091765.Search in Google Scholar PubMed PubMed Central
[51] Chu HN, Lee SJ, Wang X, Lee SH, Yoon HM, Hwang YJ, et al. A correlation study on in vitro physiological activities of soybean cultivars 19 individual isoflavone derivatives and genetic characteristics. Antioxidants. 2021;10(12):2027. 10.3390/antiox10122027.Search in Google Scholar PubMed PubMed Central
[52] Brodowska KM. Natural flavonoids: classification potential role and application of flavonoid analogues. Eur J Bio Res. 2017;7(2):108–23. 10.5281/zenodo.545778.Search in Google Scholar
[53] Belete T. Defense mechanisms of plants to insect pests: from morphological to biochemical approach. Trends Tech Sci Res. 2018;2(2):30–8. https://juniperpublishers.com/ttsr/pdf/TTSR.MS.ID.555584.pdf.10.19080/TTSR.2018.02.555584Search in Google Scholar
© 2023 the author(s), published by De Gruyter
This work is licensed under the Creative Commons Attribution 4.0 International License.
Articles in the same Issue
- Regular Articles
- The impact of COVID-19 pandemic on business risks and potato commercial model
- Effects of potato (Solanum tuberosum L.)–Mucuna pruriens intercropping pattern on the agronomic performances of potato and the soil physicochemical properties of the western highlands of Cameroon
- Machine learning-based prediction of total phenolic and flavonoid in horticultural products
- Revamping agricultural sector and its implications on output and employment generation: Evidence from Nigeria
- Does product certification matter? A review of mechanism to influence customer loyalty in the poultry feed industry
- Farmer regeneration and knowledge co-creation in the sustainability of coconut agribusiness in Gorontalo, Indonesia
- Lablab purpureus: Analysis of landraces cultivation and distribution, farming systems, and some climatic trends in production areas in Tanzania
- The effects of carrot (Daucus carota L.) waste juice on the performances of native chicken in North Sulawesi, Indonesia
- Properties of potassium dihydrogen phosphate and its effects on plants and soil
- Factors influencing the role and performance of independent agricultural extension workers in supporting agricultural extension
- The fate of probiotic species applied in intensive grow-out ponds in rearing water and intestinal tracts of white shrimp, Litopenaeus vannamei
- Yield stability and agronomic performances of provitamin A maize (Zea mays L.) genotypes in South-East of DR Congo
- Diallel analysis of length and shape of rice using Hayman and Griffing method
- Physicochemical and microbiological characteristics of various stem bark extracts of Hopea beccariana Burck potential as natural preservatives of coconut sap
- Correlation between descriptive and group type traits in the system of cow’s linear classification of Ukrainian Brown dairy breed
- Meta-analysis of the influence of the substitution of maize with cassava on performance indices of broiler chickens
- Bacteriocin-like inhibitory substance (BLIS) produced by Enterococcus faecium MA115 and its potential use as a seafood biopreservative
- Meta-analysis of the benefits of dietary Saccharomyces cerevisiae intervention on milk yield and component characteristics in lactating small ruminants
- Growth promotion potential of Bacillus spp. isolates on two tomato (Solanum lycopersicum L.) varieties in the West region of Cameroon
- Prioritizing IoT adoption strategies in millennial farming: An analytical network process approach
- Soil fertility and pomelo yield influenced by soil conservation practices
- Soil macrofauna under laying hens’ grazed fields in two different agroecosystems in Portugal
- Factors affecting household carbohydrate food consumption in Central Java: Before and during the COVID-19 pandemic
- Properties of paper coated with Prunus serotina (Ehrh.) extract formulation
- Fertiliser cost prediction in European Union farms: Machine-learning approaches through artificial neural networks
- Molecular and phenotypic markers for pyramiding multiple traits in rice
- Natural product nanofibers derived from Trichoderma hamatum K01 to control citrus anthracnose caused by Colletotrichum gloeosporioides
- Role of actors in promoting sustainable peatland management in Kubu Raya Regency, West Kalimantan, Indonesia
- Small-scale coffee farmers’ perception of climate-adapted attributes in participatory coffee breeding: A case study of Gayo Highland, Aceh, Indonesia
- Optimization of extraction using surface response methodology and quantification of cannabinoids in female inflorescences of marijuana (Cannabis sativa L.) at three altitudinal floors of Peru
- Production factors, technical, and economic efficiency of soybean (Glycine max L. Merr.) farming in Indonesia
- Economic performance of smallholder soya bean production in Kwara State, Nigeria
- Indonesian rice farmers’ perceptions of different sources of information and their effect on farmer capability
- Feed preference, body condition scoring, and growth performance of Dohne Merino ram fed varying levels of fossil shell flour
- Assessing the determinant factors of risk strategy adoption to mitigate various risks: An experience from smallholder rubber farmers in West Kalimantan Province, Indonesia
- Analysis of trade potential and factors influencing chili export in Indonesia
- Grade-C kenaf fiber (poor quality) as an alternative material for textile crafts
- Technical efficiency changes of rice farming in the favorable irrigated areas of Indonesia
- Palm oil cluster resilience to enhance indigenous welfare by innovative ability to address land conflicts: Evidence of disaster hierarchy
- Factors determining cassava farmers’ accessibility to loan sources: Evidence from Lampung, Indonesia
- Tailoring business models for small-medium food enterprises in Eastern Africa can drive the commercialization and utilization of vitamin A rich orange-fleshed sweet potato puree
- Revitalizing sub-optimal drylands: Exploring the role of biofertilizers
- Effects of salt stress on growth of Quercus ilex L. seedlings
- Design and fabrication of a fish feed mixing cum pelleting machine for small-medium scale aquaculture industry
- Indicators of swamp buffalo business sustainability using partial least squares structural equation modelling
- Effect of arbuscular mycorrhizal fungi on early growth, root colonization, and chlorophyll content of North Maluku nutmeg cultivars
- How intergenerational farmers negotiate their identity in the era of Agriculture 4.0: A multiple-case study in Indonesia
- Responses of broiler chickens to incremental levels of water deprivation: Growth performance, carcass characteristics, and relative organ weights
- The improvement of horticultural villages sustainability in Central Java Province, Indonesia
- Effect of short-term grazing exclusion on herbage species composition, dry matter productivity, and chemical composition of subtropical grasslands
- Analysis of beef market integration between consumer and producer regions in Indonesia
- Analysing the sustainability of swamp buffalo (Bubalus bubalis carabauesis) farming as a protein source and germplasm
- Toxicity of Calophyllum soulattri, Piper aduncum, Sesamum indicum and their potential mixture for control Spodoptera frugiperda
- Consumption profile of organic fruits and vegetables by a Portuguese consumer’s sample
- Phenotypic characterisation of indigenous chicken in the central zone of Tanzania
- Diversity and structure of bacterial communities in saline and non-saline rice fields in Cilacap Regency, Indonesia
- Isolation and screening of lactic acid bacteria producing anti-Edwardsiella from the gastrointestinal tract of wild catfish (Clarias gariepinus) for probiotic candidates
- Effects of land use and slope position on selected soil physicochemical properties in Tekorsh Sub-Watershed, East Gojjam Zone, Ethiopia
- Design of smart farming communication and web interface using MQTT and Node.js
- Assessment of bread wheat (Triticum aestivum L.) seed quality accessed through different seed sources in northwest Ethiopia
- Estimation of water consumption and productivity for wheat using remote sensing and SEBAL model: A case study from central clay plain Ecosystem in Sudan
- Agronomic performance, seed chemical composition, and bioactive components of selected Indonesian soybean genotypes (Glycine max [L.] Merr.)
- The role of halal requirements, health-environmental factors, and domestic interest in food miles of apple fruit
- Subsidized fertilizer management in the rice production centers of South Sulawesi, Indonesia: Bridging the gap between policy and practice
- Factors affecting consumers’ loyalty and purchase decisions on honey products: An emerging market perspective
- Inclusive rice seed business: Performance and sustainability
- Design guidelines for sustainable utilization of agricultural appropriate technology: Enhancing human factors and user experience
- Effect of integrate water shortage and soil conditioners on water productivity, growth, and yield of Red Globe grapevines grown in sandy soil
- Synergic effect of Arbuscular mycorrhizal fungi and potassium fertilizer improves biomass-related characteristics of cocoa seedlings to enhance their drought resilience and field survival
- Control measure of sweet potato weevil (Cylas formicarius Fab.) (Coleoptera: Curculionidae) in endemic land of entisol type using mulch and entomopathogenic fungus Beauveria bassiana
- In vitro and in silico study for plant growth promotion potential of indigenous Ochrobactrum ciceri and Bacillus australimaris
- Effects of repeated replanting on yield, dry matter, starch, and protein content in different potato (Solanum tuberosum L.) genotypes
- Review Articles
- Nutritional and chemical composition of black velvet tamarind (Dialium guineense Willd) and its influence on animal production: A review
- Black pepper (Piper nigrum Lam) as a natural feed additive and source of beneficial nutrients and phytochemicals in chicken nutrition
- The long-crowing chickens in Indonesia: A review
- A transformative poultry feed system: The impact of insects as an alternative and transformative poultry-based diet in sub-Saharan Africa
- Short Communication
- Profiling of carbonyl compounds in fresh cabbage with chemometric analysis for the development of freshness assessment method
- Special Issue of The 4th International Conference on Food Science and Engineering (ICFSE) 2022 - Part I
- Non-destructive evaluation of soluble solid content in fruits with various skin thicknesses using visible–shortwave near-infrared spectroscopy
- Special Issue on FCEM - International Web Conference on Food Choice & Eating Motivation - Part I
- Traditional agri-food products and sustainability – A fruitful relationship for the development of rural areas in Portugal
- Consumers’ attitudes toward refrigerated ready-to-eat meat and dairy foods
- Breakfast habits and knowledge: Study involving participants from Brazil and Portugal
- Food determinants and motivation factors impact on consumer behavior in Lebanon
- Comparison of three wine routes’ realities in Central Portugal
- Special Issue on Agriculture, Climate Change, Information Technology, Food and Animal (ACIFAS 2020)
- Environmentally friendly bioameliorant to increase soil fertility and rice (Oryza sativa) production
- Enhancing the ability of rice to adapt and grow under saline stress using selected halotolerant rhizobacterial nitrogen fixer