Food determinants and motivation factors impact on consumer behavior in Lebanon
-
 and
and

Abstract
The current study looks at a variety of factors that affect eating patterns. This is about internal and external aspects that lead to a thorough assessment of consumer behavior, with an emphasis on driving forces and obstacles that significantly affect each consumer’s food preferences. The information is based on questionnaire research of traditional and fiber food consumption as well as specific consumer purchasing behaviors. The results of the questionnaire survey were analyzed using qualitative aspects analysis and other statistical methods (ANOVA, t-test). The study’s goal is to provide comprehensive strategies that encourage and support the intake of nutritious meals, especially in light of how different food motivations and knowledge factors influence Lebanese consumer behavior. Based on the findings, individual eating motivation and its impact on consumers’ behavior in Lebanon when making food purchase decisions were found. Sources of potential influences include information, the social environment, and environmental variables. Processes like social learning influence the interplay between these components as well as food choices and eating habits. As a result, future programs to encourage healthy eating habits might profit by putting more of an emphasis on learning principles and food preferences when programs are implemented.
1 Introduction
Numerous studies have been carried out on the effects of social and cultural factors on eating habits in different populations [1]. There is strong evidence that the kind, quantity, and intake of food are significantly influenced by social norms [2]. A balanced diet can improve dietary practices and overall population health. The scientific literature has used a variety of variables to study consumer behavior in the food market, with sociodemographic characteristics, motives and attitudes, religious characteristics, cultural and social background, regional variability, and lifestyle being the most frequently used ones [3,4].
Unfortunately, the majority of customers are either uninformed of or uninterested in reading food labels, depending on their social and cultural backgrounds [5]. Many questions about what people believe about healthy eating remain unresolved. Although customers’ main objective is to satisfy the demand for basic food commodities, their conduct nowadays is different [6]. The way that modern consumers act toward food has been impacted by changes in their socioeconomic priorities.
Education and emotional eating both significantly influence the choice of food products [7]. Like many other nations, Lebanon encourages healthy eating practices. To do this, it is important to investigate and create sociodemographic, cultural, economic, emotional, and environmental factors as well as some distinct characteristics that motivate healthy eating [8].
This knowledge gap must be filled in order to develop comprehensive methods that support and reinforce the consumption of healthy foods, particularly with regard to how various aspects of food motivation and knowledge affect consumer behavior.
This study sought to evaluate Lebanese people’s motivations for healthy eating as well as demographic information and elements related to eating habits as a first step in creating health policies and techniques to encourage nutritional behavior. This groundbreaking study from Lebanon is a component of a global effort named “Psycho-social reasons associated with food choices and eating behaviors (EATMOT).”
In the current study, two research questions were addressed:
RQ1: what are the sociodemographic factors that could influence eating motivations in Lebanon? Do age, gender, living environment, level of studies, responsibility in buying food, civil status, and current employment affect eating motivation?
RQ2: what is the impact of motivation food factors and sociodemographic on consumer behavior model?
The article is organized as follows: The theoretical background (Section 2) is followed by the explanation of the methods and materials used in Section 3; Section 4 presents the research findings. The results of the study, its theoretical and practical implications, and potential directions for future research will be covered by the authors in Sections 5 and 6.
2 Theoretical background
Local government policy has recently concentrated on acknowledging the potential advantages of traditional and regional food systems and encouraging local food [9]. Despite the enthusiasm of consumers, producers, and policymakers for the benefits of locally grown and traditionally prepared foods, marketing systems continue to outperform labor force survey in terms of economies of scale, profit agglomeration, and negotiating power [10].
The consumer’s preference for local foods and their perceptions about the origin of the food items they eat have been reported by Feldmann and Hamm [11] in their published review. The Alphabet Theory is a newly developed theoretical framework aimed at representing the relations and attitudes of consumers towards alternative food choices. It has been reported that in the last two decades there has been a great boom in the consumer’s interest for local foods, which has led to a corresponding increase in the investigations focusing on consumers’ attitudes and purchase behavior concerning the local foods. Research has demonstrated that people believe that local foods are not expensive and are willing to buy them, even if they are a little more expensive compared to their non-local equivalents, because they perceive other values in local foods.
The review by Monaco and Bonetto [12] highlights the research works that have been focusing on the social representations of food, which have been highly studied and reported in the scientific literature. In fact, besides the individual’s relations with food, there are also very relevant social and group determinants of food consumption. The social representations encompass structured sets of ideas, opinions, knowledge, and beliefs about food which are shared among a group of people, constituting a social group. For that reason, to investigate these relations and even explore how they vary according to social influences, or even countries, is essential to understand the eating motivations. According to the authors [12], food social representations and culture can be investigated from three perspectives: (a) focusing on the role that social representations have in the construction of connotations attached to food and their incorporation into the thinking frameworks, either individual or group, shaping the role of culture to the representations; (b) addressing the way by which the charring of social representations can allow the identification with and the sense of belonging to a certain group; and (c) looking at social representations as determinants and predictors of consumer behavior.
The Theory of Planned Behavior is one of the tools that uses social–psychological–attitude models to express relationships between attitudes and behavior [13]. This can be further enhanced by adding measures of moral concern, which have been proven relevant for some food consumption decisions.
With respect to social customs and culture, Lebanon is a multiracial nation home to a wide variety of religions and worldviews. Each ethnicity and religion also have its own set of social customs and dietary habits. Hoek et al. [14] found that a person’s religious beliefs affected their attitudes about and behavior as consumers when it came to food preferences, food purchasing decisions, and eating routines. Muslim customers expect wholesome, premium goods that also adhere to Shariah requirements, just like any other kind of customer [15]. Without a doubt, religion has a big role on the cuisine of many nations. With the exception of Christianity, which has no such prohibitions, certain religions exclude specific foods, such as pork and meat that has not been ritually sacrificed in Judaism and Islam. According to estimates, just 16% of Jews, 75% of Muslims, and 90% of Buddhists and Hindus in the United States faithfully follow their religious dietary rules [16].
The way demographics, attitudes, and incentives affect how people purchase food has been investigated. Numerous studies have stressed the importance of the social aspect of consumer behavior and the need for consumers to satisfy both psychosocial and utilitarian needs [17,18]. Since price, convenience, and quality are still important factors in economic motivation, consumer motivations are not necessarily unique in this environment [19], but a social component might be important.
The current study’s goal is to fill the aforementioned research gaps by first examining Lebanese people’s motivations for healthy eating in relation to food, and then looking at how demographic data (such as living conditions, gender, educational attainment, and age groups), elements related to eating habits, and consumer acceptance can affect consumers’ purchase intentions. Our ultimate objective pertains to purchase intention of nutritious food in developing health policies and methods to promote dietary behavior.
Individual food patterns are influenced by a great diversity of social, psychological, sensory, and economic factors [20], as described by a number of theoretical models. The environmental determinants of diet are considerably variable across regions or countries [20–25]. Also the age or sex have been pointed out in many investigations as greatly determining food choices [26–29], with preferences variable according to their own perceptions of any common food item.
3 Materials and methods
3.1 Instrument
For the purpose of this research, the questionnaire used was structured in ten different parts englobing 84 questions as previously reported [30]. The questionnaire included 55 statements related to eating habits and the choice of a certain food, which were compiled according to different motivations. These types of motivations were chosen because many different studies somehow have indicated that eating habits and/or food choices are dependable on factors such as the ones investigated through this questionnaire, which was developed and validated at first on a sample of Portuguese people [3] and then was extended into other countries. A five-point Likert scale was used to measure the participants’ opinions regarding the different types of motivations: 1 (totally disagree), 2 (disagree), 3 (neither agree nor disagree), 4 (agree), and 5 (strongly agree). For the purpose of this study the variables of Parts III to X were carefully examined, tested, and studied.
3.2 Data collection
This descriptive cross-sectional study involved 410 people who lived in Lebanon and was conducted using a non-probabilistic sample. The questionnaires were distributed on social media and submitted online using a Google Forms link. In order to gather the data, a period of time from November 2019 to March 2020 was used. Ethics-related questions and restrictions on the questionnaire were checked before the Ethical Committee gave its approval with reference number 2020-89 (USJ).
3.3 Statistical analysis
Basic descriptive statistical tools were used to do an exploratory study of the data. IBM SPSS Statistics version 20 was used for statistical processing, while Microsoft Excel 2013 was used for data centralization (IBM Corp., Armonk, NY, USA).
To investigate the relationships between the following variables, it was essential to determine the average of the results from Parts III to X replies.
Various sociodemographic factors, as well as reasons for healthy eating vs perceptions of a good diet.
The difference between the motivation for a healthy diet and the various environmental, political, social, and cultural factors.
As previously mentioned, the items were coded on a Likert scale ranging from 1 (completely disagree) to 5 (strongly agree). An average score for each measurement variable for each participant was derived using the scores for the various items. The scale for motivations ranged from 1 to 5, with numbers under 3 representing “no influence” and those over 3 representing “influence.” The authors conducted a reliability analysis using Cronbach’s alpha for the data in the Lebanese sample for the three food motivation variables as well as the dependent variable, despite the questionnaire having previously undergone validation.
When there were two or more groups to compare, the Student’s t-test for independent samples was used to compare the mean values for each group. When there were three or more groups to compare, the analysis of variance (ANOVA) method was used. The requirements were validated, including the distribution’s normality, making the application of parametric tests conceivable. Additionally, the Pearson correlation coefficients were computed in order to assess the relationships between some study variables. The level of significance taken into account was 5% for all statistical analyses (p < 0.05).
The study included 410 Lebanese from diverse regions of the country, making it nationally representative. Only people who completed the entire questionnaire and were at least 18 years old were included. Two sets of questions were posed to the participants: the first set concerned demographic information, anthropometric information, and behavior and health-related aspects; the second set addressed reasons for adopting a healthy diet.
Depending on the distribution of the variables, we employed the Student’s t-test to compare continuous variables between groups (normal or non-Gaussian distribution) and the Pearson test for correlations. The ANOVA test for Gaussian distributions is used to compute the mean difference between several continuous variables [31].
4 Results
4.1 Sample characterization
The demographical data for the sample studied are summarized in Figures 1 and 2, highlighting the highest percentages for each demographical variable. There were 410 people who participated in the poll, and of those, 74.1% were female and 25.9% were male. The age range of the participants was from 18 to 72 years, with a median age of 37. They were divided into four age groups: young adults (18–30 years old), which made up 32.4%; average adults (31–50 years old), which made up 57.3%; senior adults (51–64 years old), which made up 8.3%; and finally, the elderly (more than 65 years old), which made up 2% of the sample. A significant portion of the participants – nearly 95% – had a university degree. The participants’ marital status was as follows: 40% were single, 56.8% were married or cohabiting, 2.7% were divorced or separated, and 0.5% were widowed. Regarding the participants’ living situations, 30% of them resided in urban areas, 15.1% in rural areas, and 54.9% in suburban areas (Figure 1). Regarding the current professional activity, most participants (68%) were employed. The remaining participants (13.2%) were students, 2.7% were working students, 14.4% were unemployed, and 1.7% were retirees. Another inquiry concerned the participant’s professional endeavors or academic pursuits, particularly those pertaining to certain sectors, such as food, nutrition, agriculture, sports, psychology, or other health-related pursuits. Regarding this, 70.2% of respondents indicated that none of the aforementioned professional fields applied to them (Figure 2). Finally, 75.1% of participants were found to be in charge of making their own food purchases.

Demographical data: age, gender, highest level of education, living environment, civil state.

Demographical data: job situation, professional area.
4.2 Results for research question one
In order to respond to RQ1 and investigate the possibility that sociodemographic characteristics in Lebanon might have an impact on people’s motivations for eating. ANOVA and student t-tests were run.
H0: There are no sociodemographic differences influencing eating motivations in Lebanon
H1: There are sociodemographic differences influencing eating motivations in Lebanon
Age, gender, housing situation, level of education, responsibility in purchasing food, civil status, and present employment situation were the main sociodemographic variables that the researchers focused on in terms of how they affect food motivation.
T-test for gender and responsibility in buying food results are shown in Tables 1 and 2, the results show that we can reject the null hypothesis and state that the variable gender has a significant difference only for the motivation factor economic and availability motivation, whereas there are no gender differences for remaining food motivation factors. As for the responsibility in buying food, we accept the null hypothesis since no differences were noted for the responsibility in buying foods leading to a specific food behavior.
T-test for gender and responsibility in buying food results
| Food motivations | Gender | N | Mean | Std. deviation | F | Sig. | t | df |
|---|---|---|---|---|---|---|---|---|
| Healthy motivation | Male | 106 | 3.4623 | 0.61990 | 0.266 | 0.606 | −2.474 | 408 |
| Female | 304 | 3.6414 | 0.64975 | |||||
| Emotional motivation | Male | 106 | 3.05 | 1.008 | 1.589 | 0.208 | −3.332 | 408 |
| Female | 304 | 3.42 | 0.978 | |||||
| Economic and availability motivation | Male | 106 | 2.98 | 0.676 | 26.632 | 0.000 | 1.796 | 238.074 |
| Female | 304 | 2.83 | 0.883 | |||||
| Environmental and political motivation | Male | 106 | 3.43 | 0.840 | 0.072 | 0.789 | 0.921 | 408 |
| Female | 304 | 3.35 | 0.815 | |||||
| Social and cultural motivation | Male | 106 | 3.09 | 0.737 | 3.405 | 0.066 | 2.211 | 408 |
| Female | 304 | 2.90 | 0.804 | |||||
| Marketing and commercial motivation | Male | 106 | 3.17 | 0.810 | 0.004 | 0.947 | −1.667 | 408 |
| Female | 304 | 3.32 | 0.788 |
T-test for gender and responsibility in buying food results
| Food motivations | Responsibility for buying food | N | Mean | Std. deviation | F | Sig. | t | df |
|---|---|---|---|---|---|---|---|---|
| Healthy motivation | No | 102 | 3.4510 | 0.59081 | 0.008 | 0.927 | −2.618 | 408 |
| Yes | 308 | 3.6429 | 0.65749 | |||||
| Emotional motivation | No | 102 | 3.45 | 1.050 | 1.197 | 0.274 | 1.509 | 408 |
| Yes | 308 | 3.28 | 0.979 | |||||
| Economic and availability motivation | No | 102 | 2.76 | 0.858 | 0.706 | 0.401 | −1.479 | 408 |
| Yes | 308 | 2.91 | 0.828 | |||||
| Environmental and political motivation | No | 102 | 3.28 | 0.837 | 0.057 | 0.811 | −1.227 | 408 |
| Yes | 308 | 3.40 | 0.815 | |||||
| Social and cultural motivation | No | 102 | 2.91 | 0.797 | 0.125 | 0.724 | −0.545 | 408 |
| Yes | 308 | 2.96 | 0.790 | |||||
| Marketing and commercial motivation | No | 102 | 3.20 | 0.784 | 0.366 | 0.546 | −1.237 | 408 |
| Yes | 308 | 3.31 | 0.798 |
The authors noted that the participants’ eating motivations according to gender and, as it can be observed, for women, the most important motivation was health; whereas, men’s food choices were mainly influenced by health as well as environmental and political concerns.
When it comes to age differences, the ANOVA results (Table 3) showed the existence of age difference for three motivations: healthy motivation, marketing and commercial motivation, and emotional motivation. We can reject the null hypothesis and state that the variable age has a significant difference for the mentioned three motivations.
ANOVA and mean
| Food motivations | Age | N | Mean | Std. deviation | F | Sig. |
|---|---|---|---|---|---|---|
| Healthy motivation | Young adults | 133 | 3.4436 | 0.59561 | 4.369 | 0.005 |
| Average adults | 236 | 3.6864 | 0.65492 | |||
| Senior adults | 32 | 3.5313 | 0.50701 | |||
| Elderly | 8 | 3.7500 | 1.16496 | |||
| Total | 409 | 3.5966 | 0.64632 | |||
| Emotional motivation | Young adults | 133 | 3.56 | 1.018 | 10.103 | 0.000 |
| Average adults | 236 | 3.21 | 0.920 | |||
| Senior adults | 32 | 2.88 | 1.157 | |||
| Elderly | 8 | 4.50 | 0.535 | |||
| Total | 409 | 3.32 | 0.999 | |||
| Economic and availability motivation | Young adults | 133 | 2.85 | 0.802 | 0.789 | 0.501 |
| Average adults | 236 | 2.91 | 0.812 | |||
| Senior adults | 32 | 2.69 | 0.896 | |||
| Elderly | 8 | 3.00 | 1.512 | |||
| Total | 409 | 2.88 | 0.832 | |||
| Environmental and political motivation | Young adults | 133 | 3.35 | 0.789 | 0.130 | 0.942 |
| Average adults | 236 | 3.38 | 0.840 | |||
| Senior adults | 32 | 3.34 | 0.745 | |||
| Elderly | 8 | 3.50 | 1.195 | |||
| Total | 409 | 3.37 | 0.821 | |||
| Social and cultural motivation | Young adults | 133 | 3.04 | 0.690 | 3.788 | 0.011 |
| Average adults | 236 | 2.96 | 0.768 | |||
| Senior adults | 32 | 2.53 | 0.983 | |||
| Elderly | 8 | 2.75 | 1.581 | |||
| Total | 409 | 2.95 | 0.792 | |||
| Marketing and commercial motivation | Young adults | 133 | 3.41 | 0.676 | 6.359 | 0.000 |
| Average adults | 236 | 3.28 | 0.809 | |||
| Senior adults | 32 | 2.81 | 0.780 | |||
| Elderly | 8 | 2.75 | 1.389 | |||
| Total | 409 | 3.28 | 0.796 |
As shown in Table 4, related to ANOVA test results for healthy motivation and level of studies, we can reject the null hypothesis and state that the variable education level has a significant difference for one motivation factor that is healthy motivation. As for the other motivation variables we can accept the null hypothesis.
ANOVA and mean results of education degree and food motivation factors
| Food motivations | Education level | N | Mean | Std. deviation | F | Sig. |
|---|---|---|---|---|---|---|
| Healthy motivation | University | 390 | 3.5744 | 0.64800 | 6.986 | 0.001 |
| Primary school | 2 | 3.0000 | 0.00000 | |||
| Secondary school | 18 | 4.1111 | 0.32338 | |||
| Total | 410 | 3.5951 | 0.64620 | |||
| Emotional motivation | University | 390 | 3.31 | 0.990 | 2.921 | 0.055 |
| Primary school | 2 | 5.00 | 0.000 | |||
| Secondary school | 18 | 3.39 | 1.092 | |||
| Total | 410 | 3.32 | 0.998 | |||
| Economic and availability motivation | University | 390 | 2.88 | 0.828 | 1.406 | 0.246 |
| Primary school | 2 | 2.00 | 0.000 | |||
| Secondary school | 18 | 2.72 | 1.018 | |||
| Total | 410 | 2.87 | 0.836 | |||
| Environmental and political motivation | University | 390 | 3.37 | 0.823 | 0.226 | 0.798 |
| Primary school | 2 | 3.00 | 0.000 | |||
| Secondary school | 18 | 3.33 | 0.840 | |||
| Total | 410 | 3.37 | 0.821 | |||
| Social and cultural motivation | University | 390 | 2.95 | 0.784 | 0.004 | 0.996 |
| Primary school | 2 | 3.00 | 0.000 | |||
| Secondary school | 18 | 2.94 | 0.998 | |||
| Total | 410 | 2.95 | 0.791 | |||
| Marketing and commercial motivation | University | 390 | 3.28 | 0.783 | 0.164 | 0.849 |
| Primary school | 2 | 3.00 | 0.000 | |||
| Secondary school | 18 | 3.33 | 1.085 | |||
| Total | 410 | 3.28 | 0.795 |
As for the results of healthy motivation factors and living area as shown in Table 5, we can reject the null hypothesis and state that the variable living area has a significant difference for just one motivation which is healthy motivation. As for the other motivation variables we can accept the null hypothesis.
ANOVA and mean results of living environment and food motivation factors
| Food motivations | Living environment | N | Mean | Std. deviation | F | Sig. |
|---|---|---|---|---|---|---|
| Healthy motivation | Rural | 62 | 3.2097 | 0.81255 | 16.447 | 0.000 |
| Suburban | 123 | 3.7642 | 0.58787 | |||
| Urban | 225 | 3.6089 | 0.58088 | |||
| Total | 410 | 3.5951 | 0.64620 | |||
| Emotional motivation | Rural | 62 | 3.27 | 1.011 | 0.154 | 0.857 |
| Suburban | 123 | 3.36 | 1.041 | |||
| Urban | 225 | 3.32 | 0.974 | |||
| Total | 410 | 3.32 | 0.998 | |||
| Economic and availability motivation | Rural | 62 | 2.90 | 0.762 | 0.421 | 0.657 |
| Suburban | 123 | 2.81 | 0.803 | |||
| Urban | 225 | 2.89 | 0.875 | |||
| Total | 410 | 2.87 | 0.836 | |||
| Environmental and political motivation | Rural | 62 | 3.21 | 0.890 | 2.032 | 0.132 |
| Suburban | 123 | 3.33 | 0.754 | |||
| Urban | 225 | 3.44 | 0.833 | |||
| Total | 410 | 3.37 | 0.821 | |||
| Social and cultural motivation | Rural | 62 | 2.95 | 0.711 | 0.005 | 0.995 |
| Suburban | 123 | 2.94 | 0.813 | |||
| Urban | 225 | 2.95 | 0.803 | |||
| Total | 410 | 2.95 | 0.791 | |||
| Marketing and commercial motivation | Rural | 62 | 3.19 | 0.827 | 2.287 | 0.103 |
| Suburban | 123 | 3.41 | 0.651 | |||
| Urban | 225 | 3.24 | 0.852 | |||
| Total | 410 | 3.28 | 0.795 |
There are differences for three food motivation factors and civil status; the healthy, emotional, and social and cultural motivations have a significant difference. We can reject the null hypothesis and state that the variable civil status has a significant difference for the mentioned three motivations (Table 6).
ANOVA and mean results of civil status and food motivation factors
| Food motivations | Marital status | N | Mean | Std. deviation | F | Sig. |
|---|---|---|---|---|---|---|
| Healthy motivation | Single | 164 | 3.3841 | 0.60061 | 11.563 | 0.000 |
| Married/living together | 233 | 3.7339 | 0.64160 | |||
| Divorced/separated | 11 | 3.6364 | 0.50452 | |||
| Widow | 2 | 4.5000 | 0.70711 | |||
| Total | 410 | 3.5951 | 0.64620 | |||
| Emotional motivation | Single | 164 | 3.42 | 1.057 | 3.001 | 0.030 |
| Married/living together | 233 | 3.24 | 0.931 | |||
| Divorced/separated | 11 | 3.18 | 1.250 | |||
| Widow | 2 | 5.00 | 0.000 | |||
| Total | 410 | 3.32 | 0.998 | |||
| Economic and availability motivation | Single | 164 | 2.82 | 0.850 | 2.537 | 0.056 |
| Married/living together | 233 | 2.91 | 0.815 | |||
| Divorced/separated | 11 | 2.45 | 0.820 | |||
| Widow | 2 | 4.00 | 1.414 | |||
| Total | 410 | 2.87 | 0.836 | |||
| Environmental and political motivation | Single | 164 | 3.41 | 0.843 | 0.968 | 0.408 |
| Married/living together | 233 | 3.35 | 0.806 | |||
| Divorced/separated | 11 | 3.36 | 0.809 | |||
| Widow | 2 | 2.50 | 0.707 | |||
| Total | 410 | 3.37 | 0.821 | |||
| Social and cultural motivation | Single | 164 | 2.98 | 0.730 | 4.038 | 0.008 |
| Married/living together | 233 | 2.95 | 0.813 | |||
| Divorced/separated | 11 | 2.27 | 0.786 | |||
| Widow | 2 | 4.00 | 1.414 | |||
| Total | 410 | 2.95 | 0.791 | |||
| Marketing and commercial motivation | Single | 164 | 3.35 | 0.733 | 0.858 | 0.463 |
| Married/living together | 233 | 3.23 | 0.807 | |||
| Divorced/separated | 11 | 3.27 | 1.348 | |||
| Widow | 2 | 3.50 | 0.707 | |||
| Total | 410 | 3.28 | 0.795 |
Another sociodemographic variable is the current employment situation that was tested for significant difference in food motivation factors; the results showed that there are significant differences in these groups’ motivations except for emotional motivation. We can reject the null hypothesis and state that the variable current employment situation has a significant difference for five food motivations (Tables 7 and 8).
ANOVA and mean results of current employment situation and food motivation factors
| Food motivations | Employment status | N | Mean | Std. deviation | F | Sig. |
|---|---|---|---|---|---|---|
| Healthy motivation | Employed | 279 | 3.5699 | 0.67426 | 3.847 | 0.004 |
| Unemployed | 59 | 3.7627 | 0.59709 | |||
| Student | 54 | 3.5000 | 0.50469 | |||
| Retired | 7 | 4.2857 | 0.48795 | |||
| Student worker | 11 | 3.3636 | 0.50452 | |||
| Total | 410 | 3.5951 | 0.64620 | |||
| Emotional motivation | Employed | 279 | 3.26 | 0.978 | 1.177 | 0.320 |
| Unemployed | 59 | 3.36 | 0.905 | |||
| Student | 54 | 3.50 | 1.112 | |||
| Retired | 7 | 3.43 | 1.718 | |||
| Student worker | 11 | 3.73 | 0.786 | |||
| Total | 410 | 3.32 | 0.998 | |||
| Economic and availability motivation | Employed | 279 | 2.89 | 0.759 | 2.931 | 0.021 |
| Unemployed | 59 | 2.86 | 1.121 | |||
| Student | 54 | 2.63 | 0.808 | |||
| Retired | 7 | 3.43 | 1.134 | |||
| Student worker | 11 | 3.36 | 0.505 | |||
| Total | 410 | 2.87 | 0.836 | |||
| Environmental and political motivation | Employed | 279 | 3.30 | 0.841 | 2.474 | 0.044 |
| Unemployed | 59 | 3.42 | 0.875 | |||
| Student | 54 | 3.56 | 0.664 | |||
| Retired | 7 | 3.43 | 0.535 | |||
| Student worker | 11 | 3.91 | 0.539 | |||
| Total | 410 | 3.37 | 0.821 | |||
| Social and cultural motivation | Employed | 279 | 2.88 | 0.777 | 4.090 | 0.003 |
| Unemployed | 59 | 3.00 | 0.891 | |||
| Student | 54 | 3.24 | 0.612 | |||
| Retired | 7 | 3.57 | 1.272 | |||
| Student worker | 11 | 2.64 | 0.505 | |||
| Total | 410 | 2.95 | 0.791 | |||
| Marketing and commercial motivation | Employed | 279 | 3.20 | 0.802 | 4.246 | 0.002 |
| Unemployed | 59 | 3.31 | 0.933 | |||
| Student | 54 | 3.46 | 0.503 | |||
| Retired | 7 | 4.00 | 0.000 | |||
| Student worker | 11 | 3.82 | 0.751 | |||
| Total | 410 | 3.28 | 0.795 |
ANOVA and mean results of field of work and food motivation factors
| Food motivations | Profession | N | Mean | Std. deviation | F | Sig. |
|---|---|---|---|---|---|---|
| Healthy motivation | Nutrition | 26 | 3.7308 | 0.53349 | 1.077 | 0.375 |
| Food | 5 | 3.6000 | 0.54772 | |||
| Agriculture | 2 | 4.0000 | 0.00000 | |||
| Sports | 57 | 3.6667 | 0.54554 | |||
| Psychology | 3 | 4.0000 | 0.00000 | |||
| Health-related activities | 29 | 3.7241 | 0.52757 | |||
| The professional activity is not related to any of the above areas | 288 | 3.5486 | 0.68666 | |||
| Total | 410 | 3.5951 | 0.64620 | |||
| Emotional motivation | Nutrition | 26 | 3.19 | 1.021 | 2.449 | 0.024 |
| Food | 5 | 2.40 | 0.548 | |||
| Agriculture | 2 | 4.00 | 0.000 | |||
| Sports | 57 | 3.19 | 1.076 | |||
| Psychology | 3 | 3.67 | 0.577 | |||
| Health-related activities | 29 | 3.83 | 0.759 | |||
| The professional activity is not related to any of the above areas | 288 | 3.32 | 0.995 | |||
| Total | 410 | 3.32 | 0.998 | |||
| Economic and availability motivation | Nutrition | 26 | 2.81 | 0.939 | 1.317 | 0.248 |
| Food | 5 | 2.80 | 0.447 | |||
| Agriculture | 2 | 3.00 | 0.000 | |||
| Sports | 57 | 2.61 | 0.921 | |||
| Psychology | 3 | 2.67 | 0.577 | |||
| Health-related activities | 29 | 2.79 | 0.675 | |||
| The professional activity is not related to any of the above areas | 288 | 2.94 | 0.828 | |||
| Total | 410 | 2.87 | 0.836 | |||
| Environmental and political motivation | Nutrition | 26 | 3.62 | 0.983 | 0.731 | 0.625 |
| Food | 5 | 3.00 | 0.000 | |||
| Agriculture | 2 | 3.00 | 0.000 | |||
| Sports | 57 | 3.33 | 0.873 | |||
| Psychology | 3 | 3.67 | 0.577 | |||
| Health-related activities | 29 | 3.31 | 0.806 | |||
| The professional activity is not related to any of the above areas | 288 | 3.37 | 0.807 | |||
| Total | 410 | 3.37 | 0.821 | 1.312 | 0.250 | |
| Social and cultural motivation | Nutrition | 26 | 3.12 | 0.711 | ||
| Food | 5 | 2.80 | 0.447 | |||
| Agriculture | 2 | 2.00 | 0.000 | |||
| Sports | 57 | 3.02 | 0.790 | |||
| Psychology | 3 | 3.33 | 0.577 | |||
| Health-related activities | 29 | 3.14 | 0.693 | |||
| The professional activity is not related to any of the above areas | 288 | 2.91 | 0.810 | |||
| Total | 410 | 2.95 | 0.791 | |||
| Marketing and commercial motivation | Nutrition | 26 | 3.00 | 0.980 | 2.445 | 0.025 |
| Food | 5 | 2.40 | 0.548 | |||
| Agriculture | 2 | 3.00 | 0.000 | |||
| Sports | 57 | 3.18 | 0.947 | |||
| Psychology | 3 | 3.00 | 0.000 | |||
| Health-related activities | 29 | 3.52 | 0.574 | |||
| The professional activity is not related to any of the above areas | 288 | 3.32 | 0.758 | |||
| Total | 410 | 3.28 | 0.795 |
4.3 Results for RQ2
In order to respond to this second research question, we performed a regression analysis on two different models, the first of which considered the influence of the six-food motivator on habit and consumer food behavior.
The second model takes into account the effects of the previous sociodemographic variables on dietary habits and consumer behavior.
4.3.1 Model one
For the impact and relationship of motivation food factors on consumer behavior a model was tested in this research with, a Pearson correlation test between these motivations and a multiple regression was conducted; the results of first model (Figure 3) are reported in Table 9 and showed that Lebanese population has the highest level for the healthy diet behavior and attitude followed by the environmental and political motivation, whereas the social and cultural motivation has the lowest mean (Table 10).

Impact of motivation food factors and consumer behavior model.
Summary of findings related to sociodemographic differences
| Variables | Healthy motivation | Emotional motivation | Economic and availability motivation | Environmental and political motivation | Social and cultural motivation | Marketing and commercial motivation |
|---|---|---|---|---|---|---|
| Age | Significant difference | Significant difference | Significant difference | |||
| Highest education level | Significant difference | |||||
| Living environment | Significant difference | |||||
| Civil state | Significant difference | Significant difference | Significant difference | |||
| Present professional | Significant difference | Significant difference | Significant difference | Significant difference | Significant difference | |
| Gender | Significant difference | |||||
| Responsibility for buying food |
Correlations between the sociodemographic variables
| Healthy motivation | Emotional motivation | Economic and availability motivation | Environmental and political motivation | Social and cultural motivation | Marketing and commercial motivation | |
|---|---|---|---|---|---|---|
| Healthy motivation | 1 | |||||
| Emotional motivation | 0.108* | 1 | ||||
| Economic and availability motivation | 0.111* | 0.152** | 1 | |||
| Environmental and political motivation | 0.261** | 0.063 | 0.049 | 1 | ||
| Social and cultural motivation for food | 0.165** | 0.241** | 0.378** | 0.112* | 1 | |
| Marketing and commercial motivation for food | 0.088 | 0.252** | 0.363** | 0.136** | 0.307** | 1 |
*Correlation is significant at the 0.05 level (2-tailed). **Correlation is significant at the 0.01 level (2-tailed).
Furthermore, a multiple regression was run, and the multiple correlation coefficient R can be considered to be one measure of the quality of the prediction of the dependent variable healthy diet behavior and attitude. Its value of 0.373 indicates a good level of prediction. The coefficient of determination R 2, which is the proportion of variance in the dependent variable that can be explained by the independent variables has a value of 0.139 that our independent variables explain 13.9% of the variability of our dependent variable (Tables 11 and 12).
Summary for model one
| R a | R 2 | Adjusted R 2 | Std. error of the estimate |
|---|---|---|---|
| 0.373 | 0.139 | 0.126 | 0.823 |
aPredictors: (Constant), healthy motivation, marketing and commercial motivation for food, emotional motivation, environmental and political motivation, social and cultural motivation for food, economic and availability motivation.
ANOVA for model one (dependent variable: healthy diet behavior and attitude)
| Modela | Sum of squares | df | Mean square | F | Sig. |
|---|---|---|---|---|---|
| Regression | 43.950 | 6 | 7.325 | 10.828 | 0.000 |
| Residual | 272.638 | 403 | 0.677 | ||
| Total | 316.588 | 409 |
aPredictors: (Constant), healthy motivation, marketing and commercial motivation for food, emotional motivation, environmental and political motivation, social and cultural motivation for food, economic and availability motivation.
The F-ratio in the ANOVA table tests whether the overall regression model is a good fit of the data, which is the case in our model since we have that the independent variables statistically significantly predict the dependent variable, F(6, 403) = 10.828, p < 0.0005.
A multiple regression was run to predict healthy diet behavior and attitude from the six food motivation factors. These variables statistically significantly predicted Lebanese food behavior and attitude, F(6, 403) = 10.828, p < 0.0005, R 2 = 0.139. Four variables marketing and commercial motivation for food, social and cultural motivation for food, environmental and political motivation, and economic and availability motivation did not add statistically significantly to the prediction, p < 0.05; whereas, emotional motivation and healthy motivation variable add statistically significantly to the prediction model (Table 13).
Coefficients for model one (dependent variable: healthy diet behavior and attitude)
| Model | Unstandardized coefficients | Standardized coefficients | t | Sig. | |
|---|---|---|---|---|---|
| B | Std. error | Beta | |||
| (Constant) | 1.214 | 0.309 | 3.924 | 0.000 | |
| Marketing and commercial motivation | 0.030 | 0.057 | 0.027 | 0.528 | 0.598 |
| Social and cultural motivation | 0.082 | 0.058 | 0.074 | 1.421 | 0.156 |
| Environmental and political motivation | 0.001 | 0.052 | 0.001 | 0.021 | 0.983 |
| Economic and availability motivation | 0.051 | 0.055 | 0.049 | 0.937 | 0.349 |
| Emotional motivation | 0.170 | 0.043 | 0.193 | 3.964 | 0.000 |
| Healthy motivation | 0.323 | 0.066 | 0.237 | 4.883 | 0.000 |
The general form of the equation to predict healthy diet behavior and attitude from food motivation factors in Lebanon is
where PHDBAis the predicted healthy diet behavior and attitude, MCM is the marketing and commercial motivation, SCM is the social and cultural motivation, EPM is the environmental and political motivation, EAM is the economic and availability motivation, EM is the emotional motivation, and HM is the healthy motivation.
4.3.2 Model two
As for the sociodemographic variables that might influence habits and consumer food behavior, a second model was conceptualized and tested (Figure 4).
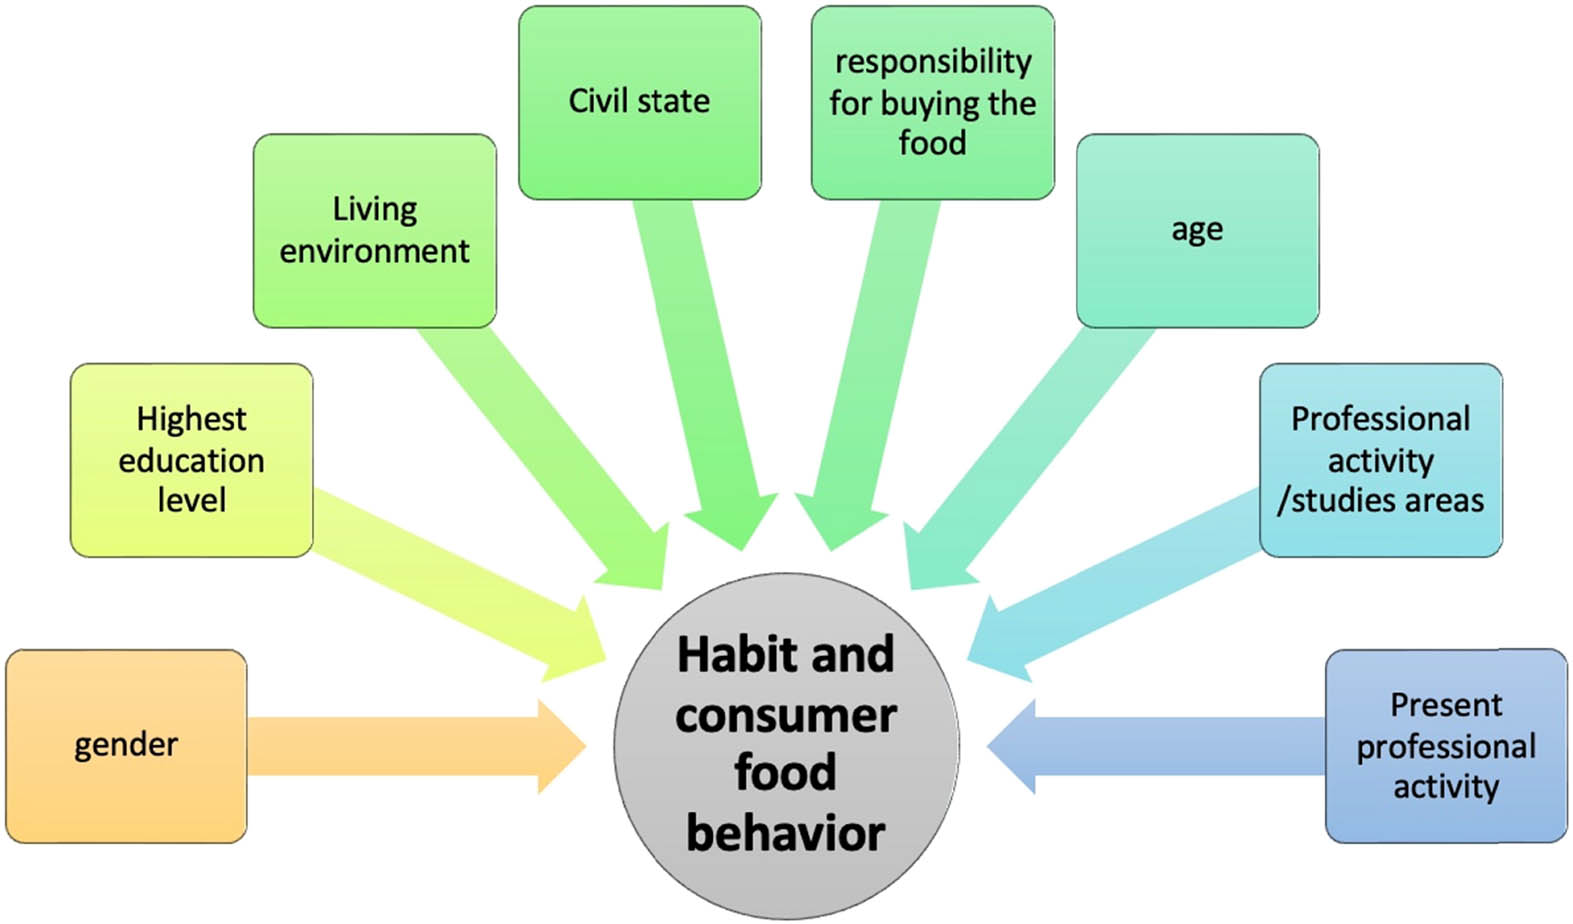
Impact of sociodemographic factors and consumer food behavior model.
A multiple regression was run to predict healthy diet behavior and attitude from the sociodemographic factors. These variables statistically significantly predicted Lebanese food behavior and attitude, F(8, 400) = 1.922, p < 0.0005, R 2 = 0.037. All sociodemographic variables are not statistically significant to the prediction, p < 0.05 (Tables 14 and 15).
Summary for model two
| R a | R 2 | Adjusted R 2 | Std. error of the estimate |
|---|---|---|---|
| 0.192 | 0.037 | 0.018 | 0.870 |
aPredictors: (Constant) Are you responsible for buying the food you eat? living environment; highest education level completed; professional activity/studies related to any of the following areas; gender; present professional activity; age; civil state.
ANOVA for model two (dependent variable: healthy diet behavior and attitude)
| Modela | Sum of squares | df | Mean square | F | Sig. |
|---|---|---|---|---|---|
| Regression | 11.644 | 8 | 1.455 | 1.922 | 0.055 |
| Residual | 302.889 | 400 | 0.757 | ||
| Total | 314.533 | 408 |
aPredictors: (Constant) Are you responsible for buying the food you eat? living environment; highest education level completed; professional activity/studies related to any of the following areas; gender; present professional activity; age; civil state.
The general form of the equation to predict healthy diet behavior and attitude from Lebanese sociodemographic variable is
where PHDBA is the predicted healthy diet behavior and attitude, AG is the age, GD is the gender, HELC is the highest education level completed, LE is the living environment, CS is the civil state, PPA is the present professional activity, APA is the area of professional activity, and RBF is the responsibility to buy food (Table 16).
Coefficients for model two (dependent variable: healthy diet behavior and attitude)
| Model | Unstandardized coefficients | Standardized coefficients | t | Sig. | |
|---|---|---|---|---|---|
| B | Std. error | Beta | |||
| (Constant) | 3.231 | 0.285 | 11.332 | 0.000 | |
| 1. Age | 0.032 | 0.088 | 0.024 | 0.368 | 0.713 |
| 2. Gender | −0.155 | 0.102 | −0.078 | −1.529 | 0.127 |
| 3. Highest education level completed | −0.053 | 0.105 | −0.025 | −0.506 | 0.613 |
| 5. Living environment | 0.025 | 0.060 | 0.021 | 0.415 | 0.678 |
| 6. Civil state | 0.059 | 0.112 | 0.038 | 0.525 | 0.600 |
| 7. Present professional activity | 0.065 | 0.049 | 0.071 | 1.333 | 0.183 |
| 8. Professional activity | 0.010 | 0.025 | 0.019 | 0.391 | 0.696 |
| 9. Responsibility for buying the food you eat | −0.287 | 0.112 | −0.141 | −2.552 | 0.011 |
5 Discussion
These findings are not unexpected because people’s eating choices tend to be heavily influenced by their level of health [32]. Consumers are more aware of the environmental effects of their meals and the significance of adopting diets that are more sustainable from an environmental point of view in addition to health motivations [33].
When it comes to the gender differences, the findings of the T-test revealed that, with the exception of social and cultural reasons (p = 0.21), differences between genders were statistically significant for practically every type of incentive. Nevertheless, because the average scores for both men and women were always lower than 1.5, none of the motivational factors that were taken into consideration had much of an impact on how they chose to eat. These findings are consistent with an earlier study that discovered that women tend to have stronger positive motives for eating a healthy diet because they are generally more concerned with controlling their diet, weight, and health [34].
As for the age variable, in late adulthood, age is a significant factor in society and has a negative impact on people’s health and wellbeing. The impacts of ageism on older people have been the subject of much research, particularly in relation to the treatment they receive from the medical system and the contacts they have at work [35]. There is evidence that one’s thoughts toward aging can have a significant impact on one’s health and wellbeing. Negative views of aging and outdated preconceptions are linked to memory problems [36], poor physical and mental functioning [37], and lower cardiovascular health [38]. Ageing is a dynamic process; people change from one category to another as they live – from young adulthood to middle adulthood to elder adulthood. This contrasts with other stigmatized identities and societal categories (such as race, gender, and sexual orientation). People of all ages likely come across fresh knowledge and experiences that cause them to re-evaluate how they feel about older people and aging. However, there is no evidence of age variations in attitudes and behaviors related to food. The current study filled this gap by analyzing cross-sectional age differences in food motives and demonstrating the divergent attitudes about food consumption between older and younger persons.
As for the environmental variables, they may be outweighing those of commodity or even price due to increased awareness of the effects of climate change and pollution, as people place value on intangible benefits related to the preservation of the natural biosystems.
The ability to respond intelligently to questions and possess sufficient knowledge does not always mean that one uses that knowledge in daily interactions. Participants in a study had adequate nutrition knowledge, but social and physical contextual factors had a significant impact on eating behavior [39]. The role of social media in spreading information about healthy eating and promoting healthy food choices is highlighted by Mete et al. [40].
Overall, the findings supported the fact that Lebanese citizens were sufficiently informed about some nutritional components of their diets and were not influenced by marketing campaigns or other influencing factors. These findings are conformed to the findings of Boustani et al. [41], where Lebanese people are becoming more aware of what they consume and the implications that a proper diet can have for their health. Consequently, they had beliefs that were consistent with a balanced diet.
These findings are crucial because they can help determine how people view healthy eating concerns, which is essential for promoting and putting into practice plans meant to encourage healthier eating patterns among Lebanese people. Moreover, these findings can help in conducting different communication tools for increasing the knowledge about healthy food consumption and positively changing in food habits behavior, specifically for the fact that the habit of checking food labels is not current for Lebanese citizens [42].
This work further showed some of the factors that strongly influence the participants’ eating habits, such as politics, the environment, and health. The fact that consumers are aware of the role of food choice over the environment allows to put into practice programs that help raise awareness of these aspects, including sustainable food choices. As a result, the sustainability and environmental aspects could be thoroughly investigated in other future studies. According to Boustani et al. [41], the subjective norm, which reflects the influence of others, was found to be significantly connected with the frequency of consumption of popular goods like organic products and to have a strong correlation with the intention to purchase organic food. As a result, in future work, the authors would take into account the consumption of organic food or even cultural and ethnic foods that are not typically eaten in Lebanon.
Future research ideas include expanding the sample size and even including additional neighboring nations. The sample size of participants from varied origins and environments must be raised in any subsequent study, though. As a result, this study may provide a fair representation of a variety of consumer behaviors across the entire Lebanese nation.
Furthermore, a study by Mete et al. [40] found that price was the primary factor in Portuguese and Greek consumers’ food selection decisions. Given that the Lebanese population is currently experiencing multiple financial and economic crises, it is important to consider the cost of goods when making food purchases. Among the motivating elements, the economic considerations variable had the greatest correlation. It is a well-known fact that Lebanon has a high cost of living.
The study provides important insight into consumer behavior by examining the factors that influence consumers’ purchasing intentions for food. Future studies on the supply and demand of food may utilize the findings of this study as a springboard. On the other hand, more in-depth research on the relationship between consumer attitude and purchase intention may be conducted using qualitative techniques like focus groups or face-to-face interviews.
6 Conclusions
This study offered new perspectives on behavioral and perception elements associated with eating motivations, particularly those connected to health-related features and views of a good diet. In general, participants demonstrated correct attitudes toward a healthy diet, with substantial variations in the results according to gender, age group, living situation, and educational level. The participants who had to pay for their own food or not, as well as the groupings according to their employment status or field of expertise, on the other hand, varied significantly.
Our study found that the social environment has a significant impact on nutrition, which is a crucial factor in the development and maintenance of healthy eating behaviors. Examples include frequent dining out, a preference for trendy or fast food, lack of time for cooking when one is a young adult, etc. Therefore, creating healthy eating plans and promoting them are long-term benefits, particularly for young people’s eating habits.
This research also made it possible to pinpoint some of the factors, such as politics, the environment, and health that participants’ eating habits were most influenced by. These can be used to adopt and put into practice programs that help raise awareness of the value and role of recycling and the environment.
According to global estimates, low-income countries like Lebanon today, which struggle with multiple crises and high inflation rates, are more affected by changes in food prices. As a result, there is a clear need for information and understanding about consumer practices and attitudes regarding food in order to assess the results of marketing programs and the risks of population malnutrition.
In an effort to reduce the burden of disease on the population, it is important to take socioeconomic status into account when modifying eating habits among the general population. Strategically combining the promotion of high consumption of fresh fruits and vegetables with other approaches and using social marketing to obtain the health benefits are both important. A deeper comprehension of these tactics can aid the development of policies resulting in a balanced diet by the restaurant syndicates, ministry of tourism, and ministry of health.
One limitation is that the study is conducted in an environment where socioeconomic factors changed very fast and people’s eating habits needed time to adapt to the variation in the social status of certain citizens who might have lost their work due to Covid-19 or due to financial crisis or are simply unable to retrieve their savings from banks due to capital control.
The sample size might be increased in future studies, and even more surrounding countries could be included. Any further research, however, must include a larger sample size with participants from diverse backgrounds and environments. As a result, this study may offer a realistic depiction of the range of consumer habits found throughout the entire Lebanese country.
As for future work, the researchers intend to add to the Theory of Planned Conduct and to test the mediating or moderating role of moral concern indicators, which have been shown to be pertinent for particular food consumption choices.
Acknowledgments
This work is funded by National Funds through the FCT – Foundation for Science and Technology, I.P., within the scope of the project Refª UIDB/00681/2020. Furthermore, the authors would like to thank the CERNAS Research Centre and the Polytechnic Institute of Viseu for their support.
-
Funding information: This work was supported by National Funds through the FCT – Foundation for Science and Technology, I.P., within the scope of the projects Refª UIDB/00681/2020.
-
Author contributions: Conceptualization, N.M.B. and R.P.F.G.; methodology, N.M.B.; software, N.M.B.; validation, N.M.B.; formal analysis, R.P.F.G.; investigation, N.M.B.; resources, N.M.B. and R.P.F.G.; data curation, N.M.B.; writing – original draft preparation, N.M.B. and R.P.F.G.; writing – review and editing, N.M.B. and R.P.F.G.; visualization, N.M.B.; supervision, N.M.B.; project administration, N.M.B. and R.P.F.G.; funding acquisition, R.P.F.G.
-
Conflict of interest: The authors state no conflict of interest.
-
Data availability statement: The datasets generated during and/or analyzed during the current study are available from the corresponding author on reasonable request.
References
[1] Pelletier JE, Graham DJ, Laska MN. Social norms and dietary behaviors among young adults. Am J Heal Behav. 2014;38:144–52. 10.5993/ajhb.38.1.15.Search in Google Scholar PubMed PubMed Central
[2] Higgs S. Social norms and their influence on eating behaviors. Appetite. 2015;86:38–44. 10.1016/j.appet.2014.10.021.Search in Google Scholar PubMed
[3] Ferrão AC, Guiné RP, Correia P, Ferreira M, Duarte J, Lima J. Development of a questionnaire to assess people’s food choices determinants. Curr Nutr Food Sci. 2019;15:281–95. 10.2174/1573401313666171117150648.Search in Google Scholar
[4] Liang AR-D, Lim WM. Exploring the online buying behavior of specialty food shoppers. Int J Hosp Manag. 2011;30:855–65. 10.1016/j.ijhm.2011.01.006.Search in Google Scholar
[5] Cecchini M, Warin L. Impact of food labelling systems on food choices and eating behaviors: a systematic review and metaanalysis of randomized studies. Obes Rev. 2016;17:201–10. 10.1111/obr.12364.Search in Google Scholar PubMed
[6] Bilgili Y. Macro economics. 4 T Publishing House, Istanbul. 6th edn. 2016. p. 107–10.Search in Google Scholar
[7] Harris JL, Bargh JA. The relationship between television viewing and unhealthy eating: implications for children and media interventions. Health Commun. 2009;24:660–73.10.1080/10410230903242267Search in Google Scholar PubMed PubMed Central
[8] Ferrão AC, Correia P, Ferreira M, Guiné RPF. Perceptions towards healthy diet of the Portuguese according to area of work or studies. Slov J Public Heal. 2019;58:40–6. 10.2478/sjph-2019-0005.Search in Google Scholar PubMed PubMed Central
[9] Martinez SW. Policies supporting local food in the united states. Agriculture. 2016;6(3):43.10.3390/agriculture6030043Search in Google Scholar
[10] Rotz S, Fraser EDG. Resilience and the industrial food system: analyzing the impacts of agricultural industrialization on food system vulnerability. J Environ Stud Sci. 2015;5(3):459–73.10.1007/s13412-015-0277-1Search in Google Scholar
[11] Feldmann C, Hamm U. Consumers’ perceptions and preferences for local food: a review. Food Qual Preference. 2015 Mar 1;40:152–64. 10.1016/j.foodqual.2014.09.014.Search in Google Scholar
[12] Monaco GL, Bonetto E. Social representations and culture in food studies. Food Res Int. 2019 Jan 1;115:474–9. 10.1016/j.foodres.2018.10.029.Search in Google Scholar PubMed
[13] Shepherd R. Social determinants of food choice. Proc Nutr Soc. 1999 Nov;58(4):807–12. 10.1017/S0029665199001093.Search in Google Scholar PubMed
[14] Hoek AC, Luning PA, Weijzen P, Engels W, Kok FJ, De Graaf C. Replacement of meat by meat substitutes. A survey on person-and product-related factors in consumer acceptance. Appetite. 2011;56(3):662–73.10.1016/j.appet.2011.02.001Search in Google Scholar PubMed
[15] Al-Harran S, Low P. Marketing of halal products: the wayforward. Halal J [Online]; 2008. www.halaljournal.comon December 3rd, 2009.Search in Google Scholar
[16] Shaharudin MR, Pani JJ, Mansor SW, Elias SJ, Sadek DM. Purchase intention of organic food in Kedah, Malaysia; a religious overview. Int J Mark Stud. 2010;2(1):96.10.5539/ijms.v2n1p96Search in Google Scholar
[17] Cassia F, Ugolini M, Bonfanti A, Cappellari C. The perceptions of Italian farmers’ market shoppers and strategic directions for customer-company-territory interaction (CCTI). Procedia–Social Behav Sci. 2012;58:1008–17.10.1016/j.sbspro.2012.09.1081Search in Google Scholar
[18] Chen W, Scott S. Shoppers’ perceived embeddedness and its impact on purchasing behavior at an organic farmers’ market. Appetite. 2014;83:57–62.10.1016/j.appet.2014.08.010Search in Google Scholar PubMed
[19] Hinrichs CC. Embeddedness and local food systems: notes on two types of direct agricultural market. J Rural Stud. 2000;16(3):295–303.10.1016/S0743-0167(99)00063-7Search in Google Scholar
[20] Barker ME, McClean SI, Thompson KA, Reid NG. Dietary behaviours and sociocultural demographics in Northern Ireland. Br J Nutr. 1990 Sep;64(2):319–29. 10.1079/BJN19900034.Search in Google Scholar PubMed
[21] Jaime PC, Duran AC, Sarti FM, Lock K. Investigating environmental determinants of diet, physical activity, and overweight among adults in Sao Paulo, Brazil. J Urban Health. 2011 Jun;88(3):567–81. 10.1007/s11524-010-9537-2.Search in Google Scholar PubMed PubMed Central
[22] Glanz K, Basil M, Maibach E, Goldberg J, Snyder DA. Why Americans eat what they do: taste, nutrition, cost, convenience, and weight control concerns as influences on food consumption. J Am Dietetic Assoc. 1998 Oct 1;98(10):1118–26. 10.1016/S0002-8223(98)00260-0.Search in Google Scholar PubMed
[23] Kandala NB, Madungu TP, Emina JB, Nzita KP, Cappuccio FP. Malnutrition among children under the age of five in the Democratic Republic of Congo (DRC): does geographic location matter? BMC Public Health. 2011 Dec;11(1):1–5. https://bmcpublichealth.biomedcentral.com/articles/10.1186/1471-2458-11-261.10.1186/1471-2458-11-261Search in Google Scholar PubMed PubMed Central
[24] Miller LC, Joshi N, Lohani M, Singh R, Bhatta N, Rogers B, et al. Head growth of undernourished children in rural Nepal: association with demographics, health and diet. Paediatrics Int Child Health. 2016 Apr 2;36(2):91–101. https://www.tandfonline.com/doi/full/10.1080/20469047.2015.1133517.10.1080/20469047.2015.1133517Search in Google Scholar PubMed
[25] Moro D, Sckokai P. Heterogeneous preferences in household food consumption in Italy. Eur Rev Agric Econ. 2000 Sep 1;27(3):305–23. 10.1093/erae/27.3.305.Search in Google Scholar
[26] Aranceta J, Perez-Rodrigo C, Ribas L, Serra-Majem LL. Sociodemographic and lifestyle determinants of food patterns in Spanish children and adolescents: the enKid study. Eur J Clin Nutr. 2003 Sep;57(1):S40–4. https://www.nature.com/articles/1601813.10.1038/sj.ejcn.1601813Search in Google Scholar PubMed
[27] Fanning J, Marsh TL, Stiegert KW Determinants of fast food consumption. (No. 1843-2016-152420); 2002. https://ageconsearch.umn.edu/record/36637/.Search in Google Scholar
[28] Mullie P, Guelinckx I, Clarys P, Degrave E, Hulens M, Vansant G. Cultural, socioeconomic and nutritional determinants of functional food consumption patterns. Eur J Clin Nutr. 2009 Nov;63(11):1290–6. https://www.nature.com/articles/ejcn200989.10.1038/ejcn.2009.89Search in Google Scholar PubMed
[29] Kraus A, Annunziata A, Vecchio R. Sociodemographic factors differentiating the consumer and the motivations for functional food consumption. J Am Coll Nutr. 2017 Feb 17;36(2):116–26. 10.1080/07315724.2016.1228489.Search in Google Scholar PubMed
[30] Boustani NM, Guiné RP. Food choice motivations and perception of a healthy diet in a developing Mediterranean country. Open Agric. 2020;5(1):485–95. 10.1515/opag-2020-0048.Search in Google Scholar
[31] Marusteri M, Bacârea V. Comparing groups for statistical differences: How to choose the right statistical test? Biochem Medica. 2010;20:15–32. 10.11613/bm.2010.004.Search in Google Scholar
[32] Birkenhead KL, Slater G. A review of factors influencing athletes’ food choices. Sports Med. 2015;45(11):1511–22.10.1007/s40279-015-0372-1Search in Google Scholar PubMed
[33] Hoek AC, Pearson D, James SW, Lawrence MA, Friel S. Shrinking the food-print: a qualitative study into consumer perceptions, experiences and attitudes towards healthy and environmentally friendly food behaviours. Appetite. 2017;108(1):117–31.10.1016/j.appet.2016.09.030Search in Google Scholar PubMed
[34] Naughton P, McCarthy SN, McCarthy MB. The creation of a healthy eating motivation score and its association with food choice and physical activity in a cross sectional sample of Irish adults. Int J Behav Nutr Phys Act. 2015;12(1):1.10.1186/s12966-015-0234-0Search in Google Scholar PubMed PubMed Central
[35] North MS, Fiske ST. Intergenerational resource tensions in the workplace and beyond: individual, interpersonal, institutional, international. Res Organ Behav. 2015a;35:159–79. 10.1016/j.riob.2015.10.003.Search in Google Scholar
[36] Barber SJ, Mather M. Stereotype threat can both enhance and impair older adults’ memory. Psychol Sci. 2013;24:2522–9. 10.1177/0956797613497023.Search in Google Scholar PubMed PubMed Central
[37] Levy BR, Myers LM. Preventive health behaviors influenced by self-perceptions of aging. Preventive Med. 2004;39:625–9. 10.1016/j.ypmed.2004.02.029.Search in Google Scholar PubMed
[38] Levy BR, Zonderman AB, Slade MD, Ferrucci L. Age stereotypes held earlier in life predict cardiovascular events in later life. Psychol Sci. 2009;20:296–8. 10.1111/j.1467-9280.2009.02298.x.Search in Google Scholar PubMed PubMed Central
[39] van der Velde LA, Schuilenburg LA, Thrivikraman JK, Numans ME, Kiefte-de Jong JC. Needs and perceptions regarding healthy eating among people at risk of food insecurity: a qualitative analysis. Int J Equity Health. 2019;18:184.10.1186/s12939-019-1077-0Search in Google Scholar PubMed PubMed Central
[40] Mete R, Shield A, Murray K, Bacon R, Kellett J. What is healthy eating? A qualitative exploration. Public Heal Nutr. 2019;22:2408–18. 10.1017/s1368980019001046.Search in Google Scholar
[41] Boustani N, MallahFerreira M, Guiné RP. Food consumption knowledge and habits in a developing country: a case of Lebanon. Insights into Reg Dev. 2021;3(4):62–79. 10.9770/IRD.2021.3.4(5).Search in Google Scholar
[42] Boustani NM, Cardoso AP, Guiné RP. Understanding the role of media and food labels to disseminate food related information in Lebanon. Open Agric. 2022;7(1):147–60. 10.1515/opag-2022-0068.Search in Google Scholar
© 2023 the author(s), published by De Gruyter
This work is licensed under the Creative Commons Attribution 4.0 International License.
Articles in the same Issue
- Regular Articles
- The impact of COVID-19 pandemic on business risks and potato commercial model
- Effects of potato (Solanum tuberosum L.)–Mucuna pruriens intercropping pattern on the agronomic performances of potato and the soil physicochemical properties of the western highlands of Cameroon
- Machine learning-based prediction of total phenolic and flavonoid in horticultural products
- Revamping agricultural sector and its implications on output and employment generation: Evidence from Nigeria
- Does product certification matter? A review of mechanism to influence customer loyalty in the poultry feed industry
- Farmer regeneration and knowledge co-creation in the sustainability of coconut agribusiness in Gorontalo, Indonesia
- Lablab purpureus: Analysis of landraces cultivation and distribution, farming systems, and some climatic trends in production areas in Tanzania
- The effects of carrot (Daucus carota L.) waste juice on the performances of native chicken in North Sulawesi, Indonesia
- Properties of potassium dihydrogen phosphate and its effects on plants and soil
- Factors influencing the role and performance of independent agricultural extension workers in supporting agricultural extension
- The fate of probiotic species applied in intensive grow-out ponds in rearing water and intestinal tracts of white shrimp, Litopenaeus vannamei
- Yield stability and agronomic performances of provitamin A maize (Zea mays L.) genotypes in South-East of DR Congo
- Diallel analysis of length and shape of rice using Hayman and Griffing method
- Physicochemical and microbiological characteristics of various stem bark extracts of Hopea beccariana Burck potential as natural preservatives of coconut sap
- Correlation between descriptive and group type traits in the system of cow’s linear classification of Ukrainian Brown dairy breed
- Meta-analysis of the influence of the substitution of maize with cassava on performance indices of broiler chickens
- Bacteriocin-like inhibitory substance (BLIS) produced by Enterococcus faecium MA115 and its potential use as a seafood biopreservative
- Meta-analysis of the benefits of dietary Saccharomyces cerevisiae intervention on milk yield and component characteristics in lactating small ruminants
- Growth promotion potential of Bacillus spp. isolates on two tomato (Solanum lycopersicum L.) varieties in the West region of Cameroon
- Prioritizing IoT adoption strategies in millennial farming: An analytical network process approach
- Soil fertility and pomelo yield influenced by soil conservation practices
- Soil macrofauna under laying hens’ grazed fields in two different agroecosystems in Portugal
- Factors affecting household carbohydrate food consumption in Central Java: Before and during the COVID-19 pandemic
- Properties of paper coated with Prunus serotina (Ehrh.) extract formulation
- Fertiliser cost prediction in European Union farms: Machine-learning approaches through artificial neural networks
- Molecular and phenotypic markers for pyramiding multiple traits in rice
- Natural product nanofibers derived from Trichoderma hamatum K01 to control citrus anthracnose caused by Colletotrichum gloeosporioides
- Role of actors in promoting sustainable peatland management in Kubu Raya Regency, West Kalimantan, Indonesia
- Small-scale coffee farmers’ perception of climate-adapted attributes in participatory coffee breeding: A case study of Gayo Highland, Aceh, Indonesia
- Optimization of extraction using surface response methodology and quantification of cannabinoids in female inflorescences of marijuana (Cannabis sativa L.) at three altitudinal floors of Peru
- Production factors, technical, and economic efficiency of soybean (Glycine max L. Merr.) farming in Indonesia
- Economic performance of smallholder soya bean production in Kwara State, Nigeria
- Indonesian rice farmers’ perceptions of different sources of information and their effect on farmer capability
- Feed preference, body condition scoring, and growth performance of Dohne Merino ram fed varying levels of fossil shell flour
- Assessing the determinant factors of risk strategy adoption to mitigate various risks: An experience from smallholder rubber farmers in West Kalimantan Province, Indonesia
- Analysis of trade potential and factors influencing chili export in Indonesia
- Grade-C kenaf fiber (poor quality) as an alternative material for textile crafts
- Technical efficiency changes of rice farming in the favorable irrigated areas of Indonesia
- Palm oil cluster resilience to enhance indigenous welfare by innovative ability to address land conflicts: Evidence of disaster hierarchy
- Factors determining cassava farmers’ accessibility to loan sources: Evidence from Lampung, Indonesia
- Tailoring business models for small-medium food enterprises in Eastern Africa can drive the commercialization and utilization of vitamin A rich orange-fleshed sweet potato puree
- Revitalizing sub-optimal drylands: Exploring the role of biofertilizers
- Effects of salt stress on growth of Quercus ilex L. seedlings
- Design and fabrication of a fish feed mixing cum pelleting machine for small-medium scale aquaculture industry
- Indicators of swamp buffalo business sustainability using partial least squares structural equation modelling
- Effect of arbuscular mycorrhizal fungi on early growth, root colonization, and chlorophyll content of North Maluku nutmeg cultivars
- How intergenerational farmers negotiate their identity in the era of Agriculture 4.0: A multiple-case study in Indonesia
- Responses of broiler chickens to incremental levels of water deprivation: Growth performance, carcass characteristics, and relative organ weights
- The improvement of horticultural villages sustainability in Central Java Province, Indonesia
- Effect of short-term grazing exclusion on herbage species composition, dry matter productivity, and chemical composition of subtropical grasslands
- Analysis of beef market integration between consumer and producer regions in Indonesia
- Analysing the sustainability of swamp buffalo (Bubalus bubalis carabauesis) farming as a protein source and germplasm
- Toxicity of Calophyllum soulattri, Piper aduncum, Sesamum indicum and their potential mixture for control Spodoptera frugiperda
- Consumption profile of organic fruits and vegetables by a Portuguese consumer’s sample
- Phenotypic characterisation of indigenous chicken in the central zone of Tanzania
- Diversity and structure of bacterial communities in saline and non-saline rice fields in Cilacap Regency, Indonesia
- Isolation and screening of lactic acid bacteria producing anti-Edwardsiella from the gastrointestinal tract of wild catfish (Clarias gariepinus) for probiotic candidates
- Effects of land use and slope position on selected soil physicochemical properties in Tekorsh Sub-Watershed, East Gojjam Zone, Ethiopia
- Design of smart farming communication and web interface using MQTT and Node.js
- Assessment of bread wheat (Triticum aestivum L.) seed quality accessed through different seed sources in northwest Ethiopia
- Estimation of water consumption and productivity for wheat using remote sensing and SEBAL model: A case study from central clay plain Ecosystem in Sudan
- Agronomic performance, seed chemical composition, and bioactive components of selected Indonesian soybean genotypes (Glycine max [L.] Merr.)
- The role of halal requirements, health-environmental factors, and domestic interest in food miles of apple fruit
- Subsidized fertilizer management in the rice production centers of South Sulawesi, Indonesia: Bridging the gap between policy and practice
- Factors affecting consumers’ loyalty and purchase decisions on honey products: An emerging market perspective
- Inclusive rice seed business: Performance and sustainability
- Design guidelines for sustainable utilization of agricultural appropriate technology: Enhancing human factors and user experience
- Effect of integrate water shortage and soil conditioners on water productivity, growth, and yield of Red Globe grapevines grown in sandy soil
- Synergic effect of Arbuscular mycorrhizal fungi and potassium fertilizer improves biomass-related characteristics of cocoa seedlings to enhance their drought resilience and field survival
- Control measure of sweet potato weevil (Cylas formicarius Fab.) (Coleoptera: Curculionidae) in endemic land of entisol type using mulch and entomopathogenic fungus Beauveria bassiana
- In vitro and in silico study for plant growth promotion potential of indigenous Ochrobactrum ciceri and Bacillus australimaris
- Effects of repeated replanting on yield, dry matter, starch, and protein content in different potato (Solanum tuberosum L.) genotypes
- Review Articles
- Nutritional and chemical composition of black velvet tamarind (Dialium guineense Willd) and its influence on animal production: A review
- Black pepper (Piper nigrum Lam) as a natural feed additive and source of beneficial nutrients and phytochemicals in chicken nutrition
- The long-crowing chickens in Indonesia: A review
- A transformative poultry feed system: The impact of insects as an alternative and transformative poultry-based diet in sub-Saharan Africa
- Short Communication
- Profiling of carbonyl compounds in fresh cabbage with chemometric analysis for the development of freshness assessment method
- Special Issue of The 4th International Conference on Food Science and Engineering (ICFSE) 2022 - Part I
- Non-destructive evaluation of soluble solid content in fruits with various skin thicknesses using visible–shortwave near-infrared spectroscopy
- Special Issue on FCEM - International Web Conference on Food Choice & Eating Motivation - Part I
- Traditional agri-food products and sustainability – A fruitful relationship for the development of rural areas in Portugal
- Consumers’ attitudes toward refrigerated ready-to-eat meat and dairy foods
- Breakfast habits and knowledge: Study involving participants from Brazil and Portugal
- Food determinants and motivation factors impact on consumer behavior in Lebanon
- Comparison of three wine routes’ realities in Central Portugal
- Special Issue on Agriculture, Climate Change, Information Technology, Food and Animal (ACIFAS 2020)
- Environmentally friendly bioameliorant to increase soil fertility and rice (Oryza sativa) production
- Enhancing the ability of rice to adapt and grow under saline stress using selected halotolerant rhizobacterial nitrogen fixer