Effect of short-term grazing exclusion on herbage species composition, dry matter productivity, and chemical composition of subtropical grasslands
-
Shanker Raj Barsila
 ,
Mahendra Singh Dhami
,
Mahendra Singh Dhami

Abstract
Grazing exclusion (GE) is a useful management technique for restoring degraded grasslands. The herbage mass productivity and chemical makeup in the grazing-excluded subtropical grassland environment has, however, received little attention. A subtropical riverine grassland was selected to determine the effect of GE on herbage mass productivity and chemical composition in Nepal. In three successive harvesting times from September to November 2020, the herbage was sampled along the six randomly selected transects of 100 m length and at two treatments (GA: Grazing-allowed and GE: Grazing-excluded plots) at three different times of harvest from a 1,000-ha grassland. A total of 108 herbage cut samples were collected from the individual 1 m × 1 m quadrats at the three harvests, respectively, from the GA and GE plots. Fences were used to maintain the GE plots to avoid grazing to prevent the vegetation altered by grazing. Day before herbage sampling, the functional groups, cover-abundance within the sampling quadrats were investigated. By cutting the fresh herbage 5 cm above the ground and subjecting it to oven drying for laboratory examination, the herbage mass productivity within each quadrat was measured. Using established laboratory procedures, the chemical analysis of herbage was evaluated for its proximate, fibre, and mineral contents. The results of the study demonstrated that GE significantly increased grass species than other-forbs, other-graminoids, and legumes, respectively, and increased dry matter productivity, which could be seen by an increase in leaf stem ratio, tiller productivity, increased coarseness (fibrous content), total ash, calcium (Ca), and phosphorus (P), but with a decreased nonstructural carbohydrate, and the concentrations of ether extract and crude protein. Research results also confirmed that GE increases herbages’ fibrousness and productivity, though the herbage quality, intake, and digestibility decline. It further demonstrates that grazing is a crucial biological component for maintaining pasture quality in subtropical grasslands and that managing grasslands through livestock grazing would make grasslands more stable and nutrient-enriched. The findings of this study can be useful in the long-term monitoring of grazing livestock in the subtropical grasslands when considering further investigations with the multiple factors in future.
1 Introduction
The grassland ecosystem is one of the global vulnerable ecosystems and has been threatened due to anthropogenic disturbances such as grazing. Grazing has a negative effect on dry matter (DM) production and its dynamics [1] i.e. on the vegetation structure, species composition, and richness of grassland communities [2]. Grazing affects species composition not only by selective behaviour but also because of plants’ differential response [3] and thus decreases foliar biomass at the expense of increasing livestock stocking rate [4]. Overgrazing has a profound effect on important ecosystem characteristics such as species richness and diversity [5] and ecosystem stability [6]. The herbage defoliated by grazing or cutting produces higher nutritional quality [7] but the total DM accumulated leads to a decreased leaf/stem ratio (LSR) and herbage mass [8].
Grazing pressure in Nepal’s subtropical grasslands is quite significant [9]. The floristic makeup of the grasslands is also influenced by the seasonality of grazing and grazing species. The management of the grassland and its declining condition has become a challenge. Long-term grazing exclusion (GE) may cause the species richness to drop or slightly change [10], because different species’ ecological niches complement and differ from one another [11]. One of the most successful strategies for the regeneration of damaged grasslands is GE [12]. It has been discovered that grazing management also influences pasture growth [13]. In this study, the evaluation of the impact of GE on subtropical riverine grasslands in Nepal was the main objective. The specific objectives of this study were to: (a) determine the cover-abundance of the herbages in GA and GE sites of subtropical grasslands at various harvest times; (b) determine the herbage mass productivity; and (c) determine the chemical composition of the herbages in grazed and GE sites at different harvest times (Figure 1).
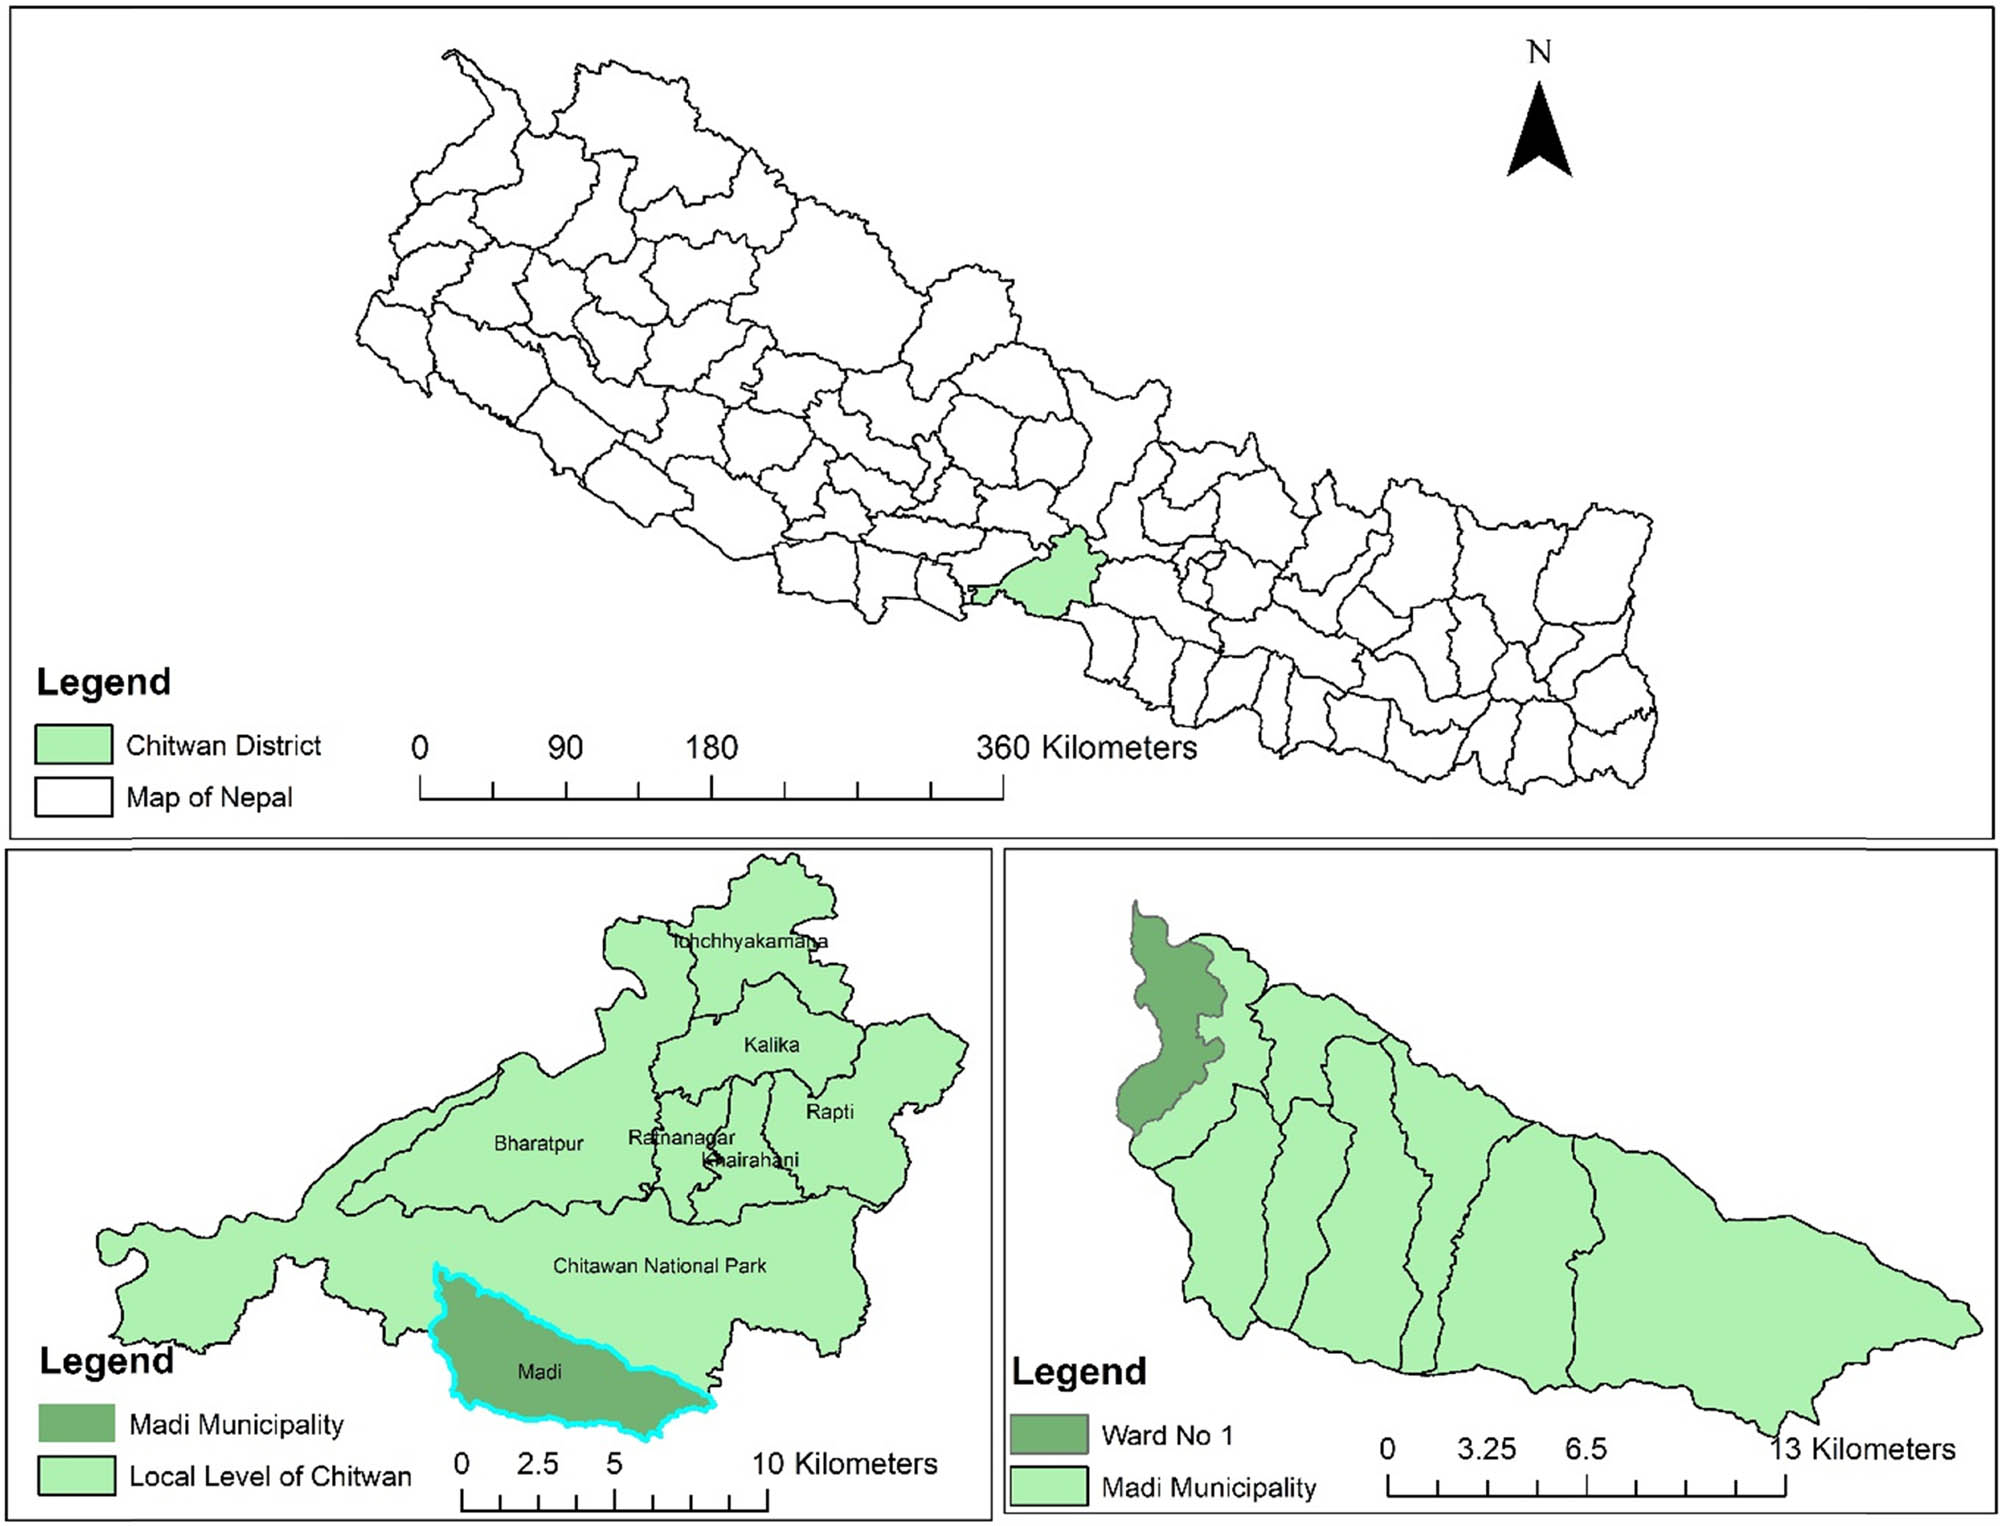
Map showing the study grasslands of Riu river basin at Madi, Chitwan of Nepal.
2 Materials and methods
2.1 Study site
The experiment took place in a riverine grassland of approximately 1,000 ha at Madi (27°50′N, 84°28′E), which is next to Chitwan National Park and is situated on the bank of the Riu River, 25 km south of Bharatpur Municipality in Chitwan, Nepal. The experimental site was 228 m above sea level. For the past 30 years (1989–2018), the average annual temperature was 25°C, and the average annual precipitation was 1,051 mm, with most of the precipitation during the monsoon season (June to August). During the research year, the study site’s average annual temperature was 25.14°C, and there was 1,200 mm of total annual rainfall (Figure 2). The average organic matter content (1.262%), pH (5.2), total nitrogen content by Kjeldahl method (0.051 g kg−1), and available phosphorus content (Bray and Kurz P method, 34.81 mg kg−1) of the soil were all examined. The three main grazing animal species were buffaloes, cattle, and goats, and adjacent residents grazed livestock freely. The silts, sands, and clays deposited by river floods and inundation were used to form the experimental grassland.
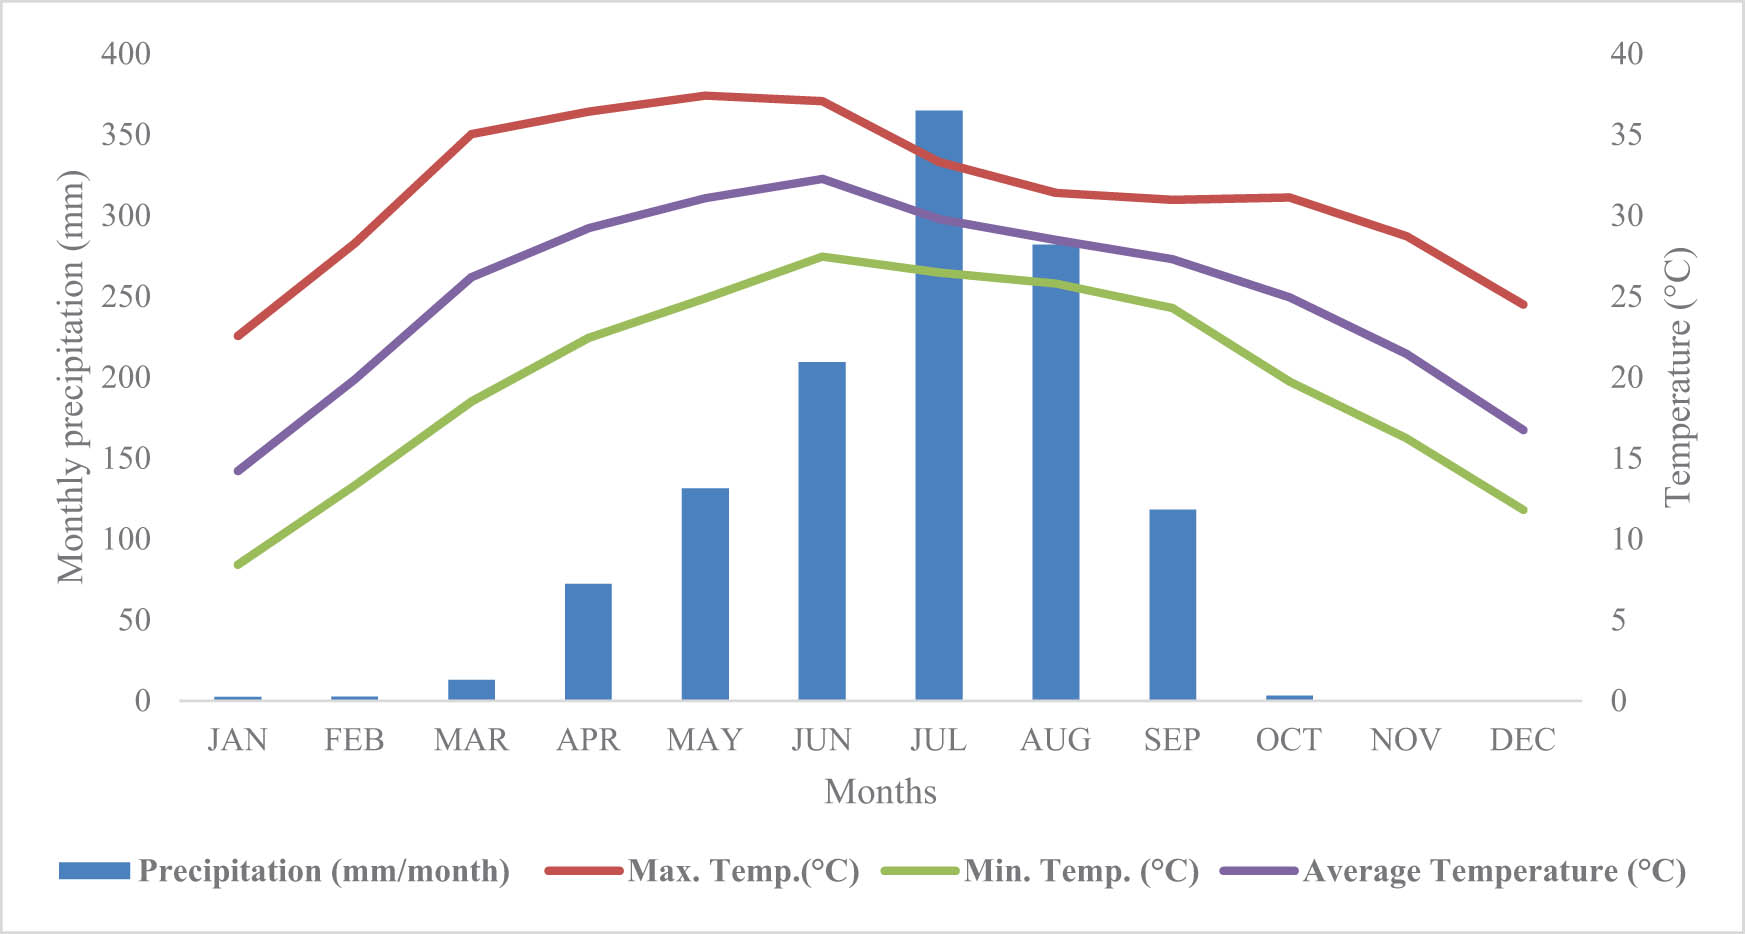
Maximum, minimum, and average temperature patterns and monthly precipitation for the study area in Madi Chitwan, Nepal.
2.2 Sampling design and quadrat allocation
In the grassland, six line transects, each measuring 100 m, were randomly placed every 150 m apart. To preserve the vegetation impacted by grazing and trampling, three 1 m × 1 m quadrats each were randomly marked within each transect and fenced in May 2020 (GE plots). Additionally, following grazing, the GA plots were placed at random 20 m apart from each fenced plot. Samples of the herbage were obtained at regular intervals from the three successive harvests (15th September to 15th November). There were 108 sampling quadrats employed in total (54 GE and 54 GA, respectively).
2.3 Cover-abundance of the herbages
Prior to cutting or herbage sampling, the dominance of herbage species and botanical coverage were assessed in all sampling plots. The botanical composition i.e. grasses, forbs, legumes, graminoids, and bare soil were recorded over the grassland to determine the herbage dominance [14], and the coverage of each of the species present within the sampling quadrats (1 m × 1 m) was recorded following the Braun-Blanquet cover-abundance method [15].
2.4 Herbage sampling
The herbage samples were taken from the GA and GE plots using a random sampling procedure. Each sampling unit had three consecutive harvestings at monthly intervals. To simulate the overall removal of foliage by grazing livestock, foliage within a quadrat of 1 m × 1 m was cut 5 cm above the ground. At the same time, 18 additional samples were collected from GA plots, where livestock species were allowed to graze freely during the day. The dead matter (litter) was avoided for reducing the bulkiness of the herbage samples during transport. Before the lab analysis began, the gathered samples were packaged and labelled for respective treatments and harvest dates.
The tiller number per square meter in grasses was determined by counting every tiller per plant from each quadrat [16], recorded for each harvest. After oven-drying (60°C for 48 h) samples in the Animal Nutrition Laboratory of the Agriculture and Forestry University, Nepal, the dried samples were then manually separated into leaf and stem portions and weighed to determine the LSR [17].
2.5 Laboratory analysis
The laboratory analysis was carried out in accordance with the recommendations for determining proximate composition [18]. In the Animal Nutrition Laboratory of the Nepal Agriculture Research Council, Lalitpur, Nepal, total ash (TA), ether extract (EE), and crude protein (CP), as well as fibre content and mineral composition (Ca and P), were analysed.
Following the established procedure, the neutral detergent fibre (NDF), acid detergent fibre (ADF), and acid detergent lignin (ADL) were measured [19]. Additionally, components such as the non-structural carbohydrate (NSC) = 100 – (CP + NDF + EE + Ash), hemicellulose (HCEL) = NDF-ADF, cellulose (CEL) = ADF-ADL, and total solubles (TS = 100-NDF) were estimated [20]. Later, the percentage of body weight of cattle-based DM digestibility% (DMD% = 88.9 – 0.779 × ADF) and DM intake% (DMI = 120/NDF) were also computed [21].
The atomic absorption spectrophotometer’s (Chromtech®, USA) accepted procedure was used to analyse the herbage’s calcium and phosphorus content.
2.6 Statistical analysis
R Statistics (version 4.2.3) was used to analyse the data.
A 2 × 3 factorial analysis of variance model was used to analyse the effects of two treatments (GA and GE) and time of harvest (harvested at three different dates) on the parameters, which is given as follows:
where µ is the constant factor, σ i is the effect of ith level of treatment, β j is the effect of jth level of time of harvest, ρβ is the interaction effect of treatments and time of harvests, and ∈ ijk is the random error.
Although results and figures are given with untransformed values, all variables were subjected to normality tests for parameters except those presented in Table 1. Duncan’s multiple range test was used to compare the mean differences set at a 5% level of significance.
Abundant herbage species over three harvesting times in GA and GE plots in a subtropical grassland of the Riu river basin at Madi, Chitwan, Nepal
| Season | Herbage cover | GA | Herbage cover | GE | ||||
|---|---|---|---|---|---|---|---|---|
| Abundant herbage species | Abundant Herbage Species | |||||||
| Species | Family | Growth stages | Species | Family | Growth stages | |||
| Harvest 1 (September) | n = 36 sampling plots | |||||||
| 45–55 | Saccharum spontaneum | Poaceae | Vegetative | 50–70 | Saccharum spontaneum | Poaceae | Vegetative | |
| 27–45 | Imperata cylindrica | Poaceae | Vegetative | 35–50 | Imperata cylindrica | Poaceae | Vegetative | |
| 28–41 | Saccharum bengalense | Poaceae | Vegetative | 25–36 | Saccharum bengalense | Poaceae | Vegetative | |
| 20–32 | Cynodon dactylon | Poaceae | Vegetative | 30–42 | Ageratum conyzoides | Asteraceae | Vegetative | |
| 22–30 | Cyperus rotundus | Cyperaceae | Vegetative | 25–32 | Cynodon dactylon | Poaceae | Vegetative | |
| 15–25 | Ageratum conyzoides | Asteraceae | Vegetative | 13–18 | Cyperus rotundus | Cyperaceae | Vegetative | |
| Harvest 2 (October) | n = 36 sampling plots | |||||||
| 40–50 | Saccharum spontaneum | Poaceae | Flowering | 45–60 | Saccharum spontaneum | Poaceae | Flowering | |
| 30–40 | Cyperus rotundus | Cyperaceae | Flowering | 32–44 | Imperata cylindrica | Poaceae | Flowering | |
| 24–35 | Imperata cylindrica | Poaceae | Flowering | 30–36 | Saccharum bengalense | Poaceae | Flowering | |
| 22–32 | Ageratum conyzoides | Asteraceae | Flowering | 25–40 | Cynodon dactylon | Poaceae | Flowering | |
| 20–32 | Saccharum bengalense | Poaceae | Flowering | 22–33 | Ageratum conyzoides | Asteraceae | Flowering | |
| 14–18 | Cynodon dactylon | Poaceae | Flowering | 14–16 | Cyperus rotundus | Cyperaceae | Flowering | |
| Harvest 3 (November) | n = 36 sampling plots | |||||||
| 35–45 | Saccharum spontaneum | Poaceae | Fruiting | 40–44 | Saccharum spontaneum | Poaceae | Fruiting | |
| 35–40 | Cyperus rotundus | Cyperaceae | Fruiting | 27–38 | Imperata cylindrica | Poaceae | Fruiting | |
| 25–38 | Ageratum conyzoides | Asteraceae | Fruiting | 25–32 | Saccharum bengalense | Poaceae | Fruiting | |
| 22–30 | Imperata cylindrica | Poaceae | Fruiting | 20–30 | Ageratum conyzoides | Asteraceae | Fruiting | |
| 20–28 | Saccharum bengalense | Poaceae | Fruiting | 28–42 | Cynodon dactylon | Poaceae | Fruiting | |
| 13–15 | Cynodon dactylon | Poaceae | Fruiting | 13–16 | Cyperus rotundus | Cyperaceae | Fruiting | |
Only the top six most abundant species are listed in the table. Herbage cover is expressed in percentage. GA – grazing allowed, GE – grazing excluded plots as treatments (T). The total number of samples was 108.
3 Results and discussion
3.1 Abundant herbage species
The top six most dominant herbage species in the experiment are shown in detail in Table 1. At all the treatments and time of harvest, Saccharum spontaneum remained the most dominating species (Table 1). However, during the subsequent harvests in the GA plots, the grass species were found to be in a decreasing trend (Table 1).
The dominance of S. spontaneum as compared to other species would be due to its tall stature and invasiveness and being with more regeneration capacity than the other species when they are mixed in grassland and, thus, it may dominate over other small understorey grasses [22] being an aggressive and allelopathic species in nature [23]. It has been reported that the S. spontaneum has a faster adaptation habit in unfertile, degraded, and poorly drained soil conditions too [24,25].
3.2 Herbage mass productivity and herbage composition
The DM and tiller productivity, LSR, the calculated intake, digestibility and feed quality (relative feed quality), and the botanical groups were significantly affected by the treatments and time of harvests (Table 2), respectively, and their interaction (T × H).
Herbage DM productivity, calculated feed value details, and contribution of botanical composition to DM accumulation at GA and GE plots of subtropical grassland at the Riu river basin of Madi, Chitwan, Nepal
| Parameters | GA | GE | SEM | p-value | ||||||
|---|---|---|---|---|---|---|---|---|---|---|
| First harvest | Second harvest | Third harvest | First harvest | Second harvest | Third harvest | Treatment (T) | Harvesting time (H) | T × H | ||
| DM Productivity (t ha−1) | 35.00b | 18.50d | 15.50f | 38.00a | 20.00c | 16.87e | 0.13 | <0.001 | <0.001 | 0.030 |
| Leaf: stem ratio | 1.26d | 1.60c | 1.88b | 1.27d | 1.62c | 2.15a | 0.01 | <0.001 | <0.001 | <0.001 |
| Number of tillers, m−2 | 718b | 697d | 671e | 744.5a | 710c | 690d | 8.75 | <0.001 | <0.001 | 0.040 |
| DMD, % | 45.28d | 48.09bc | 51.12a | 41.54e | 46.93c | 48.66b | 0.42 | <0.001 | <0.001 | 0.008 |
| DMI, % BW | 1.73e | 1.78bc | 1.81a | 1.69e | 1.75 cd | 1.81a | 0.01 | <0.01 | <0.001 | <0.010 |
| Relative feed value (RFV), % | 60.57d | 66.45b | 72.86a | 54.35e | 63.82c | 68.25b | 1.05 | <0.001 | <0.001 | 0.012 |
| Botanical group composition | ||||||||||
| Grasses, % | 63.50c | 54.50d | 46.00e | 73.50a | 67.50b | 63.00c | 1.67 | <0.001 | <0.001 | 0.003 |
| δOther-graminoids, % | 10.00c | 15.50b | 22.00a | 5.00e | 7.00d | 10.00c | 0.08 | <0.001 | <0.001 | <0.001 |
| Legumes, % | 3.00c | 2.00d | 1.00e | 5.00a | 4.00b | 3.00c | 0.001 | <0.001 | <0.001 | <0.010 |
| ωOther-forbs, % | 15.50a | 13.00b | 11.00c | 10.50c | 9.50 cd | 8.00d | 0.58 | <0.001 | 0.002 | 0.024 |
| Barren, % | 8.00e | 15.00c | 20.00a | 6.00 f | 12.00d | 16.00b | 0.001 | <0.001 | <0.001 | <0.001 |
SEM – standard error of the mean, S – site, H – harvesting time, DM – dry matter, BW – body weight of cattle. Different superscripts within the same column indicated a significant difference at p < 0.05 level of significance. The first herbage harvested on 15th September, the second on 15th October, and the third on 15th November 2020. Dead matter % not shown in table. GA – grazing allowed, GE – grazing excluded plots as treatments (T). δOther-graminoids – grass-like plants of Cyperaceae family. ωOther-forbs – broad-leaved plants other than Leguminosae family.
The GE plots always had the highest DM and tiller productivity across all harvests. However, the calculated intake and herbage digestibility were found to be highest at the GA plots in the third harvest, respectively. Repeated reports relating to GE experiments [26,27] had concluded that the higher herbage productivity in GE grasslands is often associated with the lower defoliation rate of herbage that allows higher biomass allocation. When grazing is allowed, the palatable species are often heavily defoliated by the grazing livestock or it might also be due to less or no grazing pressure as the mechanism for increased biomass after GE [28,29]. Another mechanism further suggests that GE allows the continuous increment in plant height and coverage of abundant species leading to improvement in the moisture-holding capacity of the soil and thus in return promotes plant growth [28,29,30]. The prevention of soil compaction due to trampling could also allow better growth and development of roots that in turn would allow for higher biomass productivity [30,31]. In the present study, the DM productivity was found to be highest in the first harvest than in the third harvest, which might be caused by the lower regrowth at the advancing stage of maturity [32]. It has been pointed out that the more frequent and severe the clipping, the more DM is depressed [33]. Reduction of DM yields by increased frequency and intensity of harvesting [34,35] had shown that frequent defoliation leads to a greater LSR, which was not shown in the grazed plots in the present study. The present findings are similar to the findings where LSR was also found to be higher in the un-grazed pasture land and lower yield from grazed land [17]. The higher leaf proportions in the stem might divulge due to the selection of the leaf portion of herbage than the stem by the animal, which ultimately lowers the leaf portion of the plant at the end. But, consecutive harvesting of herbage imparts a higher LSR as can be seen in third harvest compared to the first harvest of the current study. This might be due to the higher regrowth potential of the leaf than the stem [32,17]. The higher tiller number in the GE plots might be associated with the less demolition of tillers due to grazing and trampling. Correspondingly, the tiller number per square meter was found to be higher in the first harvest in contrast to the third harvest which might be due to the higher mortality of tiller in the later age of growth which could be due to other factors such as the insect kill, early winter senescence, and wildlife attack [36]. This might be because herbage had repeated defoliation which reduced the nutrient reserve and decreased the survival of the tiller. Livestock in the GA site of grassland grazed herbage, so tillers were damaged by trampling. If the tiller is repeatedly defoliated, support from physiologically integrated neighbouring tillers is cut off [37].
3.3 DM productivity and herbage botanical groups
The average vegetation coverage was recorded at about 94% in the GE and 92% in the GA site at the first harvest (data not shown in Table 1). The herbage cover was reduced continuously during the second and third harvests and finally recorded 84% in the GE plots and 80% in the GA plots at the third harvest (data not shown in Table 1). The interactive effect of treatments (T) and time of harvest (H) had a significant effect on the botanical composition of the herbages (Table 2). All the plant growth characteristics could not have been mentioned in the present study. For example, A. conyzoides might not be preferred by livestock during grazing due to its toxin content or some of them might have grown later than grasses e.g., C. rotundus might have been abundant at later harvests in the present study.
Under the GE condition, on average, 73.5, 67.5, and 63.0% of grasses were recorded in the first, second, and third harvests, respectively. Under the GA sites, on average, 63.5, 54.5, and 46.0% of grasses were recorded in the first, second, and third harvests, respectively. The coverage of other-forbs was about 16.0, 13.0, and 11.0% at first, second, and third harvests of the GA site and about 11.0, 10.0, and 8.0% at first, second, and third harvests of the GE sites, respectively. On average, legumes were the minor species. The abundance of other-graminoids was increased at the later stage of harvest in both treatments, which would have probably been due to its comparatively less aggressive growth habit than that of grass species. The details of the herbage cover and their abundance are presented in Table 2.
Grazing reduces the vigour capacity and reproduction ability of plant, so the grass coverage was decreased within the GA area [38]. There was a higher density of grasses and broadleaf forbs within the protected area than in open areas [39], and this statement is supportive of the present research findings well. Grazing causes a reduction in the proportion of grass species [40] and a similar trend was observed in the present study. It is usual that the continuous trampling of graziers on grassland decreased the green grass cover at the end of a grazing period [41] due to the cessation of certain herbaceous species growth but increased the content of broadleaf herbs and this statement supported the current study. The other-forbs were higher in the grazed condition as compared to the non-grazed condition because of their grazing tolerant habit [42]. The total other-graminoids in the grazed area were more dominant than in the un-grazed area and the amount increased extremely in the grazed area at the final harvest than in the first harvest. It might be because the other-graminoids are less preferable to livestock than grasses and have more grazing resistance [43]. It would also be likely that the other-graminoids might not tolerate the shade of the grass canopies at earlier stage.
3.4 Fibre composition of herbage in grassland
The overall interactive effect of treatment and harvesting time (T × H) remained significant to NDF, ADF, TS, and NSC content. However, there was no effect of the fixed factors on CEL but only the harvesting time was found significant to HCEL content (Table 3).
Fibrous components and total cell soluble composition of herbages in GA and GE plots of subtropical grassland of the Riu river basin of Madi, Chitwan, Nepal
| Parameters | GA | GE | SEM | p-value | ||||||
|---|---|---|---|---|---|---|---|---|---|---|
| First harvest | Second harvest | Third harvest | First harvest | Second harvest | Third harvest | Treatment (T) | Harvesting time (H) | T × H | ||
| NDF | 69.53b | 67.33cd | 65.26e | 71.09a | 68.40bc | 66.33de | 0.34 | 0.011 | <0.001 | 0.020 |
| ADF | 56.00b | 52.38cd | 48.50d | 60.8a | 53.08c | 51.65d | 0.69 | <0.001 | <0.001 | 0.018 |
| ADL | 25.64b | 21.01cd | 18.95e | 29.96a | 22.04c | 20.02de | 0.29 | <0.001 | <0.001 | 0.009 |
| HCEL | 13.53 | 14.95 | 16.76 | 10.29 | 15.32 | 14.68 | 0.97 | 0.247 | 0.030 | 0.113 |
| CEL | 30.35 | 31.37 | 29.55 | 30.83 | 31.84 | 31.44 | 1.08 | 0.166 | 0.317 | 0.570 |
| TS | 30.46d | 32.67ab | 33.67a | 28.91e | 31.59cd | 33.66ab | 0.34 | 0.011 | <0.001 | 0.018 |
| NSC | 16.32de | 18.23bc | 19.9a | 15.1e | 17.16cd | 19.06ab | 0.36 | 0.023 | <0.001 | 0.019 |
SEM – standard error of the mean, S – site, H – harvesting time, NDF – neutral detergent fibre, ADF – acid detergent fibre, ADL – acid detergent lignin, HCEL – hemi-cellulose, CEL – cellulose, TS – total cell soluble, NSC – non-structural carbohydrates. Different superscripts within the same column indicated a significant difference at p < 0.05 level of significance. All values expressed on a percentage DM basis. The first herbage harvested on 15th September, the second on 15th October, and the third on 15th November 2020. Dead matter % not shown in the table. GA – grazing allowed, GE – grazing excluded plots as treatments (T).
The highest content of NDF (about 71.0%), ADF (about 61.0%), and ADL (30.0%) were found on the first date of harvest at the GE sites. The fibre content was found to be higher in the GE plots rather than GA plots and more on the first date of harvest than in subsequent harvests due to the growth of forbs and graminoids. Such trend of the fibre composition had also been reported [44] that explained that the herbage canopies clipped at short intervals reduced the NDF content but those clipped at longer intervals increased the NDF content due to the progression of the growing season which induced more fibre content, and this confirms the findings of the present study. It is likely that herbage nutritive value (NDF, ADF, and ADL) reduces as the vegetative period progressed [45], due to the advancing maturity of the herbage harvested [46].
Higher NSC content of herbage was found at the GA plots at the same harvest date rather than that in the GE sites, and the NSC content was found in increasing trend at the subsequent date of harvests towards maturity (Table 3).
The prevailing climatic condition might have also influenced the cell contents in herbage. For example, rainfall and temperature were found to be higher during the first harvest rather than in subsequent harvests, so that promoted herbage growth and NSC content [47]. It is likely that the NSC content might be higher during the late vegetative phase to mitigate the energy required to produce the inflorescence. The accumulation of NSC in the herbage occurs in general when carbohydrate production from photosynthesis is greater than the amount required for herbage growth and development [48]. For instance, the photosynthesis capacity of the plant is higher during the active growth stage, and re-growth of herbage has more NSC content. The NSC content remained the highest during the third harvest (November), which is the starting phase of the inflorescence, and the NSC content would be higher towards the cool season than the warm season in grass and legumes because the plants do not produce fructans, so use starch as majorly reserve carbohydrate [49]. The NSC content was reduced under a high rainfall duration that promotes grass growth through the utilization of reserve carbohydrates [50].
3.5 Proximate and mineral composition of herbage in grassland
The treatments (T) and time of harvest (H) and their interaction had an effect on the CP, EE, TA, calcium, and phosphorus content of the herbage (Table 4).
Proximate and mineral composition of herbage in GA and GE plots of subtropical grasslands at the Riu river basin of Madi, Chitwan, Nepal
| Parameters | GA | GE | SEM | p-value | ||||||
|---|---|---|---|---|---|---|---|---|---|---|
| Fist harvest | Second harvest | Third harvest | First harvest | Second harvest | Third harvest | Treatment (T) | Harvesting time (H) | T × H | ||
| CP | 6.39bc | 6.73b | 7.43a | 6.1c | 6.53bc | 6.95ab | 0.05 | 0.048 | 0.003 | 0.037 |
| EE | 2.3c | 2.75b | 3.05a | 2.1d | 2.65b | 2.85b | 0.01 | 0.013 | <0.001 | 0.029 |
| TA | 5.45ab | 4.95cd | 4.35e | 5.6a | 5.25bc | 4.8d | 0.02 | 0.007 | <0.001 | 0.033 |
| Ca | 0.40d | 0.46c | 0.48c | 0.42d | 0.53b | 0.61a | 0.0001 | <0.001 | <0.001 | 0.003 |
| P | 0.03c | 0.06bc | 0.07bc | 0.05bc | 0.16b | 0.34a | 0.002 | 0.005 | 0.001 | 0.019 |
SEM – standard error of the mean, S – site, H – harvesting time, CP – crude protein, EE – ether extract, TA – total ash, Ca – calcium, P – phosphorus. The first herbage harvested on 15th September, the second on 15th October, and the third harvest on 15th November 2020. Different superscripts within the same column indicated a significant difference at p < 0.05 level of significance. All values expressed on percentage DM basis. GA – grazing allowed, GE – grazing excluded plots as treatments (T).
The proximate fractions i.e. CP, EE, and TA, and the Ca and P content were influenced by both the treatments (T) and time of harvests. The interactive effects were significant only to the Ca and Mg content. At GA plots, CP and EE remained the highest during third harvest. The CP content remained the lowest at the first harvest and in the GE plots (Table 4). The TA content also remained the highest at the first harvest and the least in the third harvest at both treatments.
The higher content of CP and EE had been found in the GA plots rather than in the GE plots, which might be due to the influence of grazing on the herbage’s nutritive value because of the removal of young and protein-rich tissues and the need of the plant to replace the older senescent parts of herbage [51]. Furthermore, grazing could raise the nitrogen availability in the soil through the deposition of animal excreta and increase the rate of N-mineralization in soil, which in turn would have enhanced the CP content in the herbage [52]. The CP and EE contents were found to be lower at the first harvest date and higher at the third harvest, which might be because the concentration increases in the re-growth of new tissues after defoliation by grazing, which further results in a delayed herbage maturation and tissue lignification [53].
The higher TA concentration at an earlier stage of harvest might be associated with the plant maturity [54]. However, it is not well understood from the present study that the herbage had a higher Ca and P content at the later stage of harvest in the GE plots [55]. However, it could be speculated that the tiny numbers of legumes in the un-grazed plots might have incorporated the mineral content. The higher LSR might have further contributed to higher Ca and P content, which might even be possible at the later stage of growth [56]. It is speculated that the herbage with increasing presence of grass and with the reduced proportions of legumes at later harvest in grazed plots might have lowered phosphorus and calcium concentration [57]. The processes affecting soil properties during floods and inundation, dung deposition, and the decomposition of herbage residues, among others, may well represent the cause of the Ca and P content of the harvested herbage, even though not measured in the present investigation.
However, the present study was confined with a small-scale herbage sampling and reports the first insight of the series of experiments intended in the same grasslands in multiple years. The investigation of other edaphic aspects, such as stocking rate and animal species effects, along with data on other anthropogenic incidences like flooding, dung deposition, and burning, would provide long-term support the findings of the experiment.
The majority of the parameters in the current study (Tables 2–4) showed a significant interactive effect of the treatments (T) and time of harvest (H), indicating that the fixed factors and their inter-relationships in the subtropical grasslands could have an impact on the productivity and quality components of the herbage. There are a number of additional aspects to be taken into account, for example, the plant’s growth and development stage (plant phenological stage), soil properties, the external environment (such as temperature and precipitation), the abundance of the herbage species, and so forth, in order to decide the suitable time for harvesting or grazing by defoliation.
4 Conclusions
Research results demonstrated that GE augmented the abundance of the perennial grass species but diminished forbs and graminoids, respectively. Herbage mass productivity was found to be higher in GE sites overall, however, with accumulated fibrous residues towards maturity. In contrast, the cell contents were higher in GA plots due to the regrowth of herbage defoliation by grazing. From these findings, it could be concluded that grassland management by light grazing could help to revitalize the herbage with more nutritious contents and maintains the stable grassland than GE. Investigations using a larger sample size and taking into account a variety of anthropogenic and edaphic factors, the livestock species present, and the stocking rates may help to confirm the findings in future studies.
Acknowledgments
The authors are grateful to Basant Shrestha and Buddhi Sagar Pokhrel as senior laboratory assistants who have provided support for this study.
-
Funding information: The project was funded by the University Grants Commission Nepal (Collaborative Research Grant, No.: CRG-073/074 Ag &F-02) for 2018–2021.
-
Conflict of interest: The authors state no conflict of interest.
-
Data availability statement: The data sets generated during and/or analysed during the current study are available from the corresponding author on reasonable request.
References
[1] Fang J, Yang Y, Ma W, Mohammat A, Shen H. Ecosystem carbon stocks and their changes in China’s grasslands. Sci China: Life Sci. 2010;53:757–65. 10.1007/s11427-010-4029-x.Search in Google Scholar PubMed
[2] Altesor A, Oesterheld M, Leoni E, Lezama F, Rodríguez C. Effect of grazing on community structure and productivity of a Uruguayan grassland. Plant Ecol. 2005;179:83–91. 10.1007/s11258-004-5800-5.Search in Google Scholar
[3] Tilman D, Knops J, Wedin D, Reich P, Ritchie M, Siemann E. The influence of functional diversity and composition on ecosystem processes. Science. 1997;277(5330):1300–2. 10.1126/science.277.5330.13.Search in Google Scholar
[4] Christiansen S, Svejcar T. Grazing effects on shoot and root dynamics and above‐and below‐ground non‐structural carbohydrate in Caucasian bluestem. Grass Forage Sci. 1988;43:111–9. 10.1111/j.1365-2494.1988.tb01878.x.Search in Google Scholar
[5] Hickman KR, Hartnett DC, Cochran RC, Owensby CE. Grazing management effects on plant species diversity in tallgrass prairie. J Range Manag. 2004;57:58–65. 10.2111/1551-5028(2004)057[0058:GMEOPS]2.0.CO;2.Search in Google Scholar
[6] Ren H, Han G, Ohm M, Schönbach P, Gierus M, Taube F. Do sheep grazing patterns affect ecosystem functioning in steppe grassland ecosystems in Inner Mongolia? Agric Ecosyst Environ. 2015;213:1–10. 10.1016/j.agee.2015.07.015.Search in Google Scholar
[7] Donkor NT, Bork EW, Hudson RJ. Defoliation regime effects on accumulated season‐long herbage yield and quality in boreal grassland. J Agron Crop Sci. 2003;189:39–46. 10.1046/j.1439-037X.2003.00007.x.Search in Google Scholar
[8] Nelson ML, Finley JW, Scarnecchia DL, Paris SM. Diet and forage quality of intermediate wheatgrass managed under continuous and short-duration grazing. Rangel Ecol Manag/J Range Manage Arch. 1989;42:474–9.10.2307/3899231Search in Google Scholar
[9] Pokhrel SK. Floristic composition, biomass production, and biomass harvest in the grasslands of the Royal Bardia National Park, Bardia, Nepal. MSc Thesis, Agricultural University of Norway; 1993.Search in Google Scholar
[10] Shi F, Chen H, Wu Y, Wu N. Effects of livestock exclusion on vegetation and soil properties under two topographic habitats in an alpine meadow on the eastern Qinghai-Tibetan Plateau. Pol J Ecol. 2010;58:125–33.Search in Google Scholar
[11] Papanikolaou AD, Fyllas NM, Mazaris AD, Dimitrakopoulos PG, Kallimanis AS, Pantis JD. Grazing effects on plant functional group diversity in Mediterranean shrublands. Biodivers Conserv. 2011;20:2831–43. 10.1007/s10531-011-0112-2.Search in Google Scholar
[12] Hu Z, Li S, Guo Q, Niu S, He N, Li L, et al. A synthesis of the effect of grazing exclusion on carbon dynamics in grasslands in China. Glob Change Biol. 2016;22:1385–93. 10.1111/gcb.13133.Search in Google Scholar
[13] Hirata M, Yamamoto K, Tobisa M. Selection of feeding areas by cattle in a spatially heterogeneous environment: selection between two tropical grasses differing in accessibility and abiotic environment. J Ethol. 2010;28:95–103. 10.1007/s10164-009-0160-1.Search in Google Scholar
[14] Gibbens RP, Beck RF. Increase in number of dominant plants and dominance-classes on a grassland in the Northern Chihuahuan Desert. Rangel Ecol Manag/J Range Manage Arch. 1987;40:136–9.10.2307/3899205Search in Google Scholar
[15] Bonham CD. Measurements for terrestrial vegetation. New York, NY: John Wiley & Sons; 2013.10.1002/9781118534540Search in Google Scholar
[16] Scheneiter O, Rimieri P. Herbage accumulation, tiller population density, and sward components of prairie grass under different nitrogen levels. N Zealand J Agric Res. 2001;44:13–22. 10.1080/00288233.2001.9513457.Search in Google Scholar
[17] Smart AJ, Schacht WH, Moser LE. Predicting leaf/stem ratio and nutritive value in grazed and nongrazed big bluestem. Agron J. 2001;93(6):1243–9. 10.2134/agronj2001.1243.Search in Google Scholar
[18] AOAC. Official methods of analysis. 15th edn. Association of Official Analytical Chemists (A.O.A.C). Washington, DC; 1995. p. 69–88.Search in Google Scholar
[19] Van Soest PV, Robertson JB, Lewis BA. Methods for dietary fiber, neutral detergent fiber, and nonstarch polysaccharides in relation to animal nutrition. J Dairy Sci. 1991;74:3583–97. 10.3168/jds.S0022-0302(91)78551-2.Search in Google Scholar PubMed
[20] Casper DP, Schingoethe DJ, Eisenbeisz WA. Response of early lactation dairy cows fed diets varying in source of nonstructural carbohydrate and crude protein. J Dairy Sci. 1990;73:1039–50. 10.3168/jds.S0022-0302(90)78763-2.Search in Google Scholar PubMed
[21] Rohweder D, Barnes RF, Jorgensen N. Proposed hay grading standards based on laboratory analyses for evaluating quality. J Anim Sci. 1978;47:747–59. 10.2527/jas1978.473747x.Search in Google Scholar
[22] Jones ER, Wishnie MH, Deago J, Sautu A, Cerezo A. Facilitating natural regeneration in Saccharum spontaneum (L.) grasslands within the Panama Canal Watershed: effects of tree species and tree structure on vegetation recruitment patterns. For Ecol Manag. 2004;191:171–83. 10.1016/j.foreco.2003.12.002.Search in Google Scholar
[23] Cummings JA, Parker IM, Gilbert GS. Allelopathy: a tool for weed management in forest restoration. Plant Ecol. 2012;213:1975–89. 10.1007/s11258-012-0154-x.Search in Google Scholar
[24] Barsila SR, Joshi NP, Poudel TN, Devkota B, Devkota NR, Chalise DR. Farmers’ perceptions of grassland management in Magui Khola basin of Madi Chitwan, Nepal. Pastoralism. 2022;12:40. 10.1186/s13570-022-00243-7.Search in Google Scholar
[25] Liu X, Ma Z, Huang X, Li L. How does grazing exclusion influence plant productivity and community structure in alpine grasslands of the Qinghai-Tibetan Plateau? Glob Ecol Conserv. 2020;23:e01066. 10.1016/j.gecco.2020.e01066.Search in Google Scholar
[26] Oba G, Stenseth NC, Lusigi WJ. New perspectives on sustainable grazing management in arid zones of sub-Saharan Africa. BioScience. 2000;50(1):35–51. 10.1641/0006-3568(2000)050[0035:NPOSGM]2.3.CO;2.Search in Google Scholar
[27] Grace C, Boland TM, Sheridan H, Brennan E, Fritch R, Lynch MB. The effect of grazing versus cutting on dry matter production of multispecies and perennial ryegrass‐only swards. Grass Forage Sci. 2019;74(3):437–49. 10.1111/gfs.12440.Search in Google Scholar
[28] Wu GL, Du GZ, Liu ZH, Thirgood S. Effect of fencing and grazing on a Kobresia-dominated meadow in the Qinghai-Tibetan Plateau. Plant Soil. 2009;319:115–26. 10.1007/s11104-008-9854-3.Search in Google Scholar
[29] Deng L, Shangguan ZP, Wu GL, Chang XF. Effects of grazing exclusion on carbon sequestration in China’s grassland. Earth-Sci Rev. 2017;173:84–95. 10.1016/j.earscirev.2017.08.008.Search in Google Scholar
[30] Piñeiro G, Paruelo JM, Oesterheld M, Jobbágy EG. Pathways of grazing effects on soil organic carbon and nitrogen. Rangel Ecol Manag. 2010;63(1):109–19. 10.2111/08-255.1.Search in Google Scholar
[31] Allington GR, Valone TJ. Long-term livestock exclusion in an arid grassland alters vegetation and soil. Rangel Ecol Manag. 2011;64(4):424–8. 10.2111/REM-D-10-00098.1.Search in Google Scholar
[32] Regmi PR, Devkota NR, Timsina J. Re-growth and nutritional potentials of Eleusine indica (L.) Gaertn.(Goose Grass). J Inst Agric Anim Sci. 2004;25:55–63.10.3126/jiaas.v25i0.387Search in Google Scholar
[33] Heady HF. Continuous vs specialized grazing systems: a review and application to the California annual type. Rangel Ecol Manag/J Range Manage Arch. 1961;14(4):182–93.10.2307/3895147Search in Google Scholar
[34] Davis WE. Effect of clipping at various heights on characteristics of regrowth in reed canarygrass (Phalaris arundinacea L.). Can J Plant Sci. 1960;40(3):452–6. 10.4141/cjps60-059.Search in Google Scholar
[35] Bekewe PE, Castillo MS, Rivera R. Defoliation management affects productivity, leaf/stem ratio, and tiller counts of ‘Performer’switchgrass. Agron J. 2018;110(4):1467–72. 10.2134/agronj2018.01.0003.Search in Google Scholar
[36] Woodward SJ. Quantifying different causes of leaf and tiller death in grazed perennial ryegrass swards. N Zealand J Agric Res. 1998;41(2):149–59. 10.1080/00288233.1998.9513298.Search in Google Scholar
[37] Jónsdóttir IS, Callaghan TV. Localized defoliation stress and the movement of 14 C between tillers of Carex bigelowii. Oikos. 1989;54:211–9. 10.2307/3565269.Search in Google Scholar
[38] Heitschmidt RK, Dowhower SL, Walker JW. Some effects of a rotational grazing treatment on quantity and quality of available forage and amount of ground litter. Rangel Ecol Manag/J Range Manage Arch. 1987;40(4):318–21.10.2307/3898728Search in Google Scholar
[39] Akbarzadeh M, Moghadam MR, Jalili A, Jafari M, Arzani H. Vegetation dynamic study of Kuhrang exclosure. 2007;13:324–36.Search in Google Scholar
[40] Dormaar JF, Smoliak S, Willms WD. Vegetation and soil responses to short-duration grazing on fescue grasslands. Rangel Ecol Manag/J Range Manage Arch. 1989;42(3):252–6.10.2307/3899484Search in Google Scholar
[41] Chaichi MR, Saravi MM, Malekian AR. Effects of livestock trampling on soil physical properties and vegetation cover (case study: Lar Rangeland, Iran). Int J Agric Biol. 2005;7:904–8.Search in Google Scholar
[42] Amiri F, Ariapour A, Fadai S. Effects of livestock grazing on vegetation composition and soil moisture properties in grazed and non-grazed range site. J Biol Sci. 2008;8(8):1289–97.10.3923/jbs.2008.1289.1297Search in Google Scholar
[43] Sternberg M, Golodets C, Gutman M, Perevolotsky A, Ungar ED, Kigel J, et al. Testing the limits of resistance: a 19‐year study of Mediterranean grassland response to grazing regimes. Glob Change Biol. 2015;21(5):1939–50. 10.1111/gcb.12866.Search in Google Scholar PubMed
[44] Belesky DP, Fedders JM, Turner KE, Ruckle JM. Productivity, botanical composition, and nutritive value of swards including forage chicory. Agron J. 1999;91(3):450–6. 10.2134/agronj1999.00021962009100030015x.Search in Google Scholar
[45] Ren H, Han G, Lan Z, Wan H, Schönbach P, Gierus M, et al. Grazing effects on herbage nutritive values depend on precipitation and growing season in Inner Mongolian grassland. J Plant Ecol. 2016;9(6):712–23. 10.1093/jpe/rtw011.Search in Google Scholar
[46] Nair J, Beattie AD, Christensen D, Yu P, McAllister T, Damiran D, et al. Effect of variety and stage of maturity at harvest on nutrient and neutral detergent fiber digestibility of forage barley grown in western Canada. Can J Anim Sci. 2018;98(2):299–310. 10.1139/cjas-2017-0060.Search in Google Scholar
[47] Pollock CJ, Jones T. Seasonal patterns of fructan metabolism in forage grasses. N Phytol. 1979;83(1):9–15. 10.1111/j.1469-8137.1979.tb00720.x.Search in Google Scholar
[48] Watts KA, Chatterton NJ. A review of factors affecting carbohydrate levels in forage. J Equine Vet Sci. 2004;24(2):84–7.10.1016/j.jevs.2004.01.005Search in Google Scholar
[49] Chatterton NJ, Harrison PA, Bennett JH, Asay KH. Carbohydrate partitioning in 185 accessions of Gramineae grown under warm and cool temperatures. J Plant Physiol. 1989;134(2):169–79. 10.1016/S0176-1617(89)80051-3.Search in Google Scholar
[50] Waite R, Boyd J. The water-soluble carbohydrates of grasses. I.– Changes occurring during the normal life-cycle. J Sci Food Agric. 1953;4(4):197–204. 10.1002/jsfa.2740040408.Search in Google Scholar
[51] Albon SD, Langvatn R. Plant phenology and the benefits of migration in a temperate ungulate. Oikos. 1992;65:502–13. 10.2307/3545568.Search in Google Scholar
[52] Shan Y, Chen D, Guan X, Zheng S, Chen H, Wang M, et al. Seasonally dependent impacts of grazing on soil nitrogen mineralization and linkages to ecosystem functioning in Inner Mongolia grassland. Soil Biol Biochem. 2011;43(9):1943–54. 10.1016/j.soilbio.2011.06.002.Search in Google Scholar
[53] Garcia F, Carrère P, Soussana JF, Baumont R. The ability of sheep at different stocking rates to maintain the quality and quantity of their diet during the grazing season. J Agric Sci. 2003;140(1):113–24. 10.1017/S0021859602002769.Search in Google Scholar
[54] Osborne DJ, Thimann KV. Senescence in plants. In: Thimann KV, editor. Boca Raton: CRC Press; 1980. p. 13–37.Search in Google Scholar
[55] Kilcher M. Plant development, stage of maturity and nutrient composition. Rangel Ecol Manag/J Range Manage Arch. 1981;34(5):363–4.10.2307/3897904Search in Google Scholar
[56] Casler MD, Collins M, Reich JM. Location, Year, Maturity, and Alfalfa Competition Effects on Mineral Element Concentrations in Smooth Bromegrass1. Agron J. 1987;79(5):774–8. 10.2134/agronj1987.00021962007900050004x.Search in Google Scholar
[57] Schlegel P, Wyss U, Arrigo Y, Hess HD. Mineral concentrations of fresh herbage from mixed grassland as influenced by botanical composition, harvest time and growth stage. Anim Feed Sci Technol. 2016;219:226–33. 10.1016/j.anifeedsci.2016.06.022.Search in Google Scholar
© 2023 the author(s), published by De Gruyter
This work is licensed under the Creative Commons Attribution 4.0 International License.
Articles in the same Issue
- Regular Articles
- The impact of COVID-19 pandemic on business risks and potato commercial model
- Effects of potato (Solanum tuberosum L.)–Mucuna pruriens intercropping pattern on the agronomic performances of potato and the soil physicochemical properties of the western highlands of Cameroon
- Machine learning-based prediction of total phenolic and flavonoid in horticultural products
- Revamping agricultural sector and its implications on output and employment generation: Evidence from Nigeria
- Does product certification matter? A review of mechanism to influence customer loyalty in the poultry feed industry
- Farmer regeneration and knowledge co-creation in the sustainability of coconut agribusiness in Gorontalo, Indonesia
- Lablab purpureus: Analysis of landraces cultivation and distribution, farming systems, and some climatic trends in production areas in Tanzania
- The effects of carrot (Daucus carota L.) waste juice on the performances of native chicken in North Sulawesi, Indonesia
- Properties of potassium dihydrogen phosphate and its effects on plants and soil
- Factors influencing the role and performance of independent agricultural extension workers in supporting agricultural extension
- The fate of probiotic species applied in intensive grow-out ponds in rearing water and intestinal tracts of white shrimp, Litopenaeus vannamei
- Yield stability and agronomic performances of provitamin A maize (Zea mays L.) genotypes in South-East of DR Congo
- Diallel analysis of length and shape of rice using Hayman and Griffing method
- Physicochemical and microbiological characteristics of various stem bark extracts of Hopea beccariana Burck potential as natural preservatives of coconut sap
- Correlation between descriptive and group type traits in the system of cow’s linear classification of Ukrainian Brown dairy breed
- Meta-analysis of the influence of the substitution of maize with cassava on performance indices of broiler chickens
- Bacteriocin-like inhibitory substance (BLIS) produced by Enterococcus faecium MA115 and its potential use as a seafood biopreservative
- Meta-analysis of the benefits of dietary Saccharomyces cerevisiae intervention on milk yield and component characteristics in lactating small ruminants
- Growth promotion potential of Bacillus spp. isolates on two tomato (Solanum lycopersicum L.) varieties in the West region of Cameroon
- Prioritizing IoT adoption strategies in millennial farming: An analytical network process approach
- Soil fertility and pomelo yield influenced by soil conservation practices
- Soil macrofauna under laying hens’ grazed fields in two different agroecosystems in Portugal
- Factors affecting household carbohydrate food consumption in Central Java: Before and during the COVID-19 pandemic
- Properties of paper coated with Prunus serotina (Ehrh.) extract formulation
- Fertiliser cost prediction in European Union farms: Machine-learning approaches through artificial neural networks
- Molecular and phenotypic markers for pyramiding multiple traits in rice
- Natural product nanofibers derived from Trichoderma hamatum K01 to control citrus anthracnose caused by Colletotrichum gloeosporioides
- Role of actors in promoting sustainable peatland management in Kubu Raya Regency, West Kalimantan, Indonesia
- Small-scale coffee farmers’ perception of climate-adapted attributes in participatory coffee breeding: A case study of Gayo Highland, Aceh, Indonesia
- Optimization of extraction using surface response methodology and quantification of cannabinoids in female inflorescences of marijuana (Cannabis sativa L.) at three altitudinal floors of Peru
- Production factors, technical, and economic efficiency of soybean (Glycine max L. Merr.) farming in Indonesia
- Economic performance of smallholder soya bean production in Kwara State, Nigeria
- Indonesian rice farmers’ perceptions of different sources of information and their effect on farmer capability
- Feed preference, body condition scoring, and growth performance of Dohne Merino ram fed varying levels of fossil shell flour
- Assessing the determinant factors of risk strategy adoption to mitigate various risks: An experience from smallholder rubber farmers in West Kalimantan Province, Indonesia
- Analysis of trade potential and factors influencing chili export in Indonesia
- Grade-C kenaf fiber (poor quality) as an alternative material for textile crafts
- Technical efficiency changes of rice farming in the favorable irrigated areas of Indonesia
- Palm oil cluster resilience to enhance indigenous welfare by innovative ability to address land conflicts: Evidence of disaster hierarchy
- Factors determining cassava farmers’ accessibility to loan sources: Evidence from Lampung, Indonesia
- Tailoring business models for small-medium food enterprises in Eastern Africa can drive the commercialization and utilization of vitamin A rich orange-fleshed sweet potato puree
- Revitalizing sub-optimal drylands: Exploring the role of biofertilizers
- Effects of salt stress on growth of Quercus ilex L. seedlings
- Design and fabrication of a fish feed mixing cum pelleting machine for small-medium scale aquaculture industry
- Indicators of swamp buffalo business sustainability using partial least squares structural equation modelling
- Effect of arbuscular mycorrhizal fungi on early growth, root colonization, and chlorophyll content of North Maluku nutmeg cultivars
- How intergenerational farmers negotiate their identity in the era of Agriculture 4.0: A multiple-case study in Indonesia
- Responses of broiler chickens to incremental levels of water deprivation: Growth performance, carcass characteristics, and relative organ weights
- The improvement of horticultural villages sustainability in Central Java Province, Indonesia
- Effect of short-term grazing exclusion on herbage species composition, dry matter productivity, and chemical composition of subtropical grasslands
- Analysis of beef market integration between consumer and producer regions in Indonesia
- Analysing the sustainability of swamp buffalo (Bubalus bubalis carabauesis) farming as a protein source and germplasm
- Toxicity of Calophyllum soulattri, Piper aduncum, Sesamum indicum and their potential mixture for control Spodoptera frugiperda
- Consumption profile of organic fruits and vegetables by a Portuguese consumer’s sample
- Phenotypic characterisation of indigenous chicken in the central zone of Tanzania
- Diversity and structure of bacterial communities in saline and non-saline rice fields in Cilacap Regency, Indonesia
- Isolation and screening of lactic acid bacteria producing anti-Edwardsiella from the gastrointestinal tract of wild catfish (Clarias gariepinus) for probiotic candidates
- Effects of land use and slope position on selected soil physicochemical properties in Tekorsh Sub-Watershed, East Gojjam Zone, Ethiopia
- Design of smart farming communication and web interface using MQTT and Node.js
- Assessment of bread wheat (Triticum aestivum L.) seed quality accessed through different seed sources in northwest Ethiopia
- Estimation of water consumption and productivity for wheat using remote sensing and SEBAL model: A case study from central clay plain Ecosystem in Sudan
- Agronomic performance, seed chemical composition, and bioactive components of selected Indonesian soybean genotypes (Glycine max [L.] Merr.)
- The role of halal requirements, health-environmental factors, and domestic interest in food miles of apple fruit
- Subsidized fertilizer management in the rice production centers of South Sulawesi, Indonesia: Bridging the gap between policy and practice
- Factors affecting consumers’ loyalty and purchase decisions on honey products: An emerging market perspective
- Inclusive rice seed business: Performance and sustainability
- Design guidelines for sustainable utilization of agricultural appropriate technology: Enhancing human factors and user experience
- Effect of integrate water shortage and soil conditioners on water productivity, growth, and yield of Red Globe grapevines grown in sandy soil
- Synergic effect of Arbuscular mycorrhizal fungi and potassium fertilizer improves biomass-related characteristics of cocoa seedlings to enhance their drought resilience and field survival
- Control measure of sweet potato weevil (Cylas formicarius Fab.) (Coleoptera: Curculionidae) in endemic land of entisol type using mulch and entomopathogenic fungus Beauveria bassiana
- In vitro and in silico study for plant growth promotion potential of indigenous Ochrobactrum ciceri and Bacillus australimaris
- Effects of repeated replanting on yield, dry matter, starch, and protein content in different potato (Solanum tuberosum L.) genotypes
- Review Articles
- Nutritional and chemical composition of black velvet tamarind (Dialium guineense Willd) and its influence on animal production: A review
- Black pepper (Piper nigrum Lam) as a natural feed additive and source of beneficial nutrients and phytochemicals in chicken nutrition
- The long-crowing chickens in Indonesia: A review
- A transformative poultry feed system: The impact of insects as an alternative and transformative poultry-based diet in sub-Saharan Africa
- Short Communication
- Profiling of carbonyl compounds in fresh cabbage with chemometric analysis for the development of freshness assessment method
- Special Issue of The 4th International Conference on Food Science and Engineering (ICFSE) 2022 - Part I
- Non-destructive evaluation of soluble solid content in fruits with various skin thicknesses using visible–shortwave near-infrared spectroscopy
- Special Issue on FCEM - International Web Conference on Food Choice & Eating Motivation - Part I
- Traditional agri-food products and sustainability – A fruitful relationship for the development of rural areas in Portugal
- Consumers’ attitudes toward refrigerated ready-to-eat meat and dairy foods
- Breakfast habits and knowledge: Study involving participants from Brazil and Portugal
- Food determinants and motivation factors impact on consumer behavior in Lebanon
- Comparison of three wine routes’ realities in Central Portugal
- Special Issue on Agriculture, Climate Change, Information Technology, Food and Animal (ACIFAS 2020)
- Environmentally friendly bioameliorant to increase soil fertility and rice (Oryza sativa) production
- Enhancing the ability of rice to adapt and grow under saline stress using selected halotolerant rhizobacterial nitrogen fixer