Effects of repeated replanting on yield, dry matter, starch, and protein content in different potato (Solanum tuberosum L.) genotypes
-
Péter Pál Mikó


Abstract
This investigation scrutinized the yield, starch, and protein content of five distinct potato genotypes (Desiree, Borostyán, Piroska, Rubinka, and Rózsa) over 5 years of repetitive replanting. The experiment aimed to compare different potato genotypes and examine the yield reduction resulting from possible genetic deterioration over the years. The research took place in Zirc, Hungary’s temperate deciduous forest zone, at 450 m elevation from 2017 to 2021, on a 100 m2 plot. Potato dry matter was measured according to MSZ 6369-4:1987, and starch content followed MSZ 6830-18:1988 standards. Tubers’ total nitrogen was gauged using the Kjeldahl method, while crude protein analysis employed the Dumas method. Pure protein evaluation adhered to the trichloroacetic acid precipitation technique, all consistent with WBSE-131:2018. Observed variations in starch content revealed Borostyán as the genotype with the highest mean starch content (75.41%) and Desiree with the least (74.98%). Protein content also varied among the genotypes; Borostyán exhibited the highest average level (10.99%), while Desiree had the least (5.52%). The remaining genotypes, Piroska, Rubinka, and Rózsa, exhibited comparable mean protein levels between 8.15 and 8.82%. Findings also noted a positive correlation between yield and starch and protein content. However, certain genotypes demonstrated a negative correlation, highlighting the impact of genetic factors and management practices such as nitrogenous fertilization and crop rotation on these associations. Additionally, the findings suggest that not only the standard Desiree variety but also the Borostyán variety can be reliably recommended for use in potato research and breeding initiatives. Conclusively, this study provides insights valuable for potato breeding and selection programs and the potential development of high-protein potato products. Further investigation is recommended to elucidate the mechanisms and genetic determinants that impact these observed relationships.
1 Introduction
Solanum tuberosum L., commonly known as potatoes, is a global dietary crop catering to a vast population’s nutritional needs. Potatoes are a nutrient-dense food containing various essential minerals, energy-yielding macronutrients, protein, and vitamins [1]. Approximately 85% of the total potato biomass is suitable for human consumption [2]. In 2020, the Food and Agriculture Organization (FAO) reported that the global potato cultivation area was 16.494 million hectares. Potato can yield 35 t/ha depending on environmental conditions and the variety of potatoes [3]. According to the 2022 data provided by FAO, the mean yield was 21,768 t/ha, while the overall yield amounted to approximately 359.071 million tonnes. The global production of potatoes has experienced a notable increase, rising from 270 million tonnes in 1961 to 370 million tonnes in 2019 [4]. In 2013, the mean global per capita potato consumption was 35 kg/year [1,5]. However, this figure will increase to 46 kg per capita per year by 2020 [6]. Although potatoes possess the highest water content at 80%, they also exhibit the highest energy content per 1 l of water [2,7]. This is particularly true given that a mere 0.06 ha of land is necessary to yield one metric ton of potatoes. The duration of production, however, may serve as a constraining element within a given region, as farmers must select optimal genotypes based on their specific requirements. After all, based on harvesting time, the potato genotypes are classified: early varieties (75–90 days), mid varieties (90–100), and late varieties (100–110 days) [3,8,9]. The selection of potato variety holds great significance due to the notable variations in yield observed among different varieties [10–12], especially in nutrient content [13]. It is noteworthy that the absence of sufficient nutrient supply through fertilization can result in a lack of significant yield or nutrient composition. Adequate proportions of nitrogen [14,15], phosphorus, and potassium [16] are required. The future food supply relies on the ongoing advancement of agrotechnology and the utilization of appropriate potato genotypes. This is due to the anticipated decrease in per capita production area, which is projected to occur by 2050 due to the world’s projected population of 9.8 billion and by 2100, 11.2 billion, according to the UN scenario. Therefore, there is a necessity for the development of more tolerant and highly cultivable varieties.
The genetic enhancement of potato germplasm through breeding has been a longstanding objective of plant scientists to enhance the potential to surmount existing and forthcoming pests and diseases and improve nutrient content [17]. To achieve this objective, breeding endeavors have predominantly depended on populations derived from crosses within and between market classes and the incorporation of genetic material from wild and domesticated Solanum species [18]. Over the past century, significant progress has been achieved in potato breeding, from using conventional cross-breeding techniques to integrating molecular tools to facilitate marker-assisted selection. The trend of potato breeding investigations appears to be focused on enhancing resistance to various diseases [19]. Developing new varieties resistant to Phytophthora infestans has been a longstanding potato breeding objective. Genotypes with resistance to viruses (PVY, PLRV, PVS, PVX), nematodes (Globodera and Meloidogyne) species, and a broader spectrum of genotypes tolerant to abiotic stresses, and focus on beneficial root traits can increase productivity and expand potato production to new areas [20–22]. In addition, there is a heightened emphasis on enhancing nutritional value attributes and drought-resistant traits [23].
The reduction in Europe’s production area yields results from climate change [4,24,25]. Apart from climate change, viral degradation is also a significant contributor to crop losses, accounting for 0–83% of such losses [26–28]. Furthermore, Phytophthora infestans is responsible for late blight in potatoes, resulting in a significant reduction in yield of up to 71%. Therefore, aside from the fungicide treatments, cultivating resistant potato varieties holds immense significance [29]. Other experiments have a similar conclusion; the ratio between actual and potential yield ranges from 10 to 75%. However, the usual range falls between 30 and 40%, subject to the extent of input [30]. The history of Hungarian potato breeding is extensive, spanning over 50 years of research. As a result of this research, the potato varieties developed possess a notable level of resistance to viruses such as PVY, PVA, PVX, PLRV, and phytophthora. Additionally, these varieties exhibit above-average nutrient content [31,32]. The Keszthely Potato Research Center employs a breeding strategy involving resistance genes sourced from the wild Solanum demissum species to combat phytophthora (dominant R genes). However, ongoing research is being conducted regarding the utilization of resistance genes of Solanum bulbocastanum [31,33,34]. Potato breeding poses a significant challenge due to the complex nature of the potato genome. The genetic resources used for enhancing potato crops comprise a range of polyploids, ranging from 2n = 2x = 24 to 2n = 6x = 72, that exhibit genetic traits that allow for easy transfer of genes across different ploidy levels. Notwithstanding these distinctive characteristics, potato breeding is a laborious undertaking that necessitates a minimum of 8–10 years, and frequently more, from the initial hybridization to the ultimate introduction of a novel potato variety. Several studies have documented the sluggish rate of advancement [19,20]. Our investigation aimed to analyze the yield, dry matter, starch, and protein content of five potato genotypes across several annual cycles. The genotypes studied were Desiree, Borostyán, Piroska, Rubinka, and Rozsa. Our objective was to evaluate the performance of each variety over time and measure the degree of genetic deterioration by replanting the tubers annually. Furthermore, we aim to offer significant perspectives on the stability and uniformity of potato variety performance while contributing to the continuous endeavors to enhance potato breeding and variety advancement.
2 Materials and methods
2.1 Location of the experiment
The study was carried out within a region primarily characterized by temperate deciduous forest in Zirc, Hungary, situated at an elevation of 450 m (coordinates: 47°15′53.6″N 17°51′22.1″E) during the period spanning from 2017 to 2021. The study site was selected due to Brown Forest Soils, characterized by a dark brown to black soil color, sandy loam to clay texture, slightly acidic to neutral pH (6.0–7.5), and medium organic matter content (2.5–3%). The soil exhibited a well-organized and friable structure, and its nutrient content was deemed fertile, characterized by moderate nitrogen, phosphorus, and potassium levels. The experimental site indicated prime agricultural terrain in temperate climatic zones, albeit vulnerable to deterioration due to various factors such as excessive application of chemical fertilizers, excessive tillage, and erosion.
The site’s climatic conditions, which are cooler and exhibit higher precipitation levels than the Hungarian average, render it an ideal location for conducting potato experiments. The annual moisture in the growing seasons (May–September) during the experimental period varied from 400 (2021) to 565 mm (2018). The average temperature of the growing season was 17.55°C (Figure 1).

Monthly average precipitation and temperature of the experimental site between 2017 and 2020.
2.2 Experimental design and agrotechnology
A complete block design (CBD) with four replicates was used to evaluate the performance of five potato genotypes (Desiree, Borostyán, Piroska, Rubinka, and Rózsa). The area of the plot was 100 m2. The experiment was initiated with a C1 (certified seed of first generation) reproductive rate in 2017, and the tubers were replanted annually to assess the extent of genetic deterioration. Winter wheat was cultivated during the preceding agricultural cycle, and the resulting average yield was 7.5 metric tons per hectare (Table 1).
CBD of the experiment with four replicates
| Replicate | Variety | Block | Replicate | Variety | Block |
|---|---|---|---|---|---|
| 1 | Desiree | A | 3 | Desiree | A |
| 1 | Borostyán | B | 3 | Borostyán | B |
| 1 | Piroska | C | 3 | Piroska | C |
| 1 | Rubinka | D | 3 | Rubinka | D |
| 1 | Rozsa | E | 3 | Rozsa | E |
| 2 | Desiree | A | 4 | Desiree | A |
| 2 | Borostyán | B | 4 | Borostyán | B |
| 2 | Piroska | C | 4 | Piroska | C |
| 2 | Rubinka | D | 4 | Rubinka | D |
| 2 | Rozsa | E | 4 | Rozsa | E |
The initial tillage was conducted each year using a reversible plow and a packomat surface leveler. This was implemented to mitigate potential soil moisture and organic matter depletion. In addition, an annual application of a fundamental fertilizer of 200 kg ha−1 (6-15-41 NPK) was applied before fall tillage, and 200 kg ha−1 of calcium ammonium nitrate was used in two separate portions (100 kg before planting in early April and 100 kg at the end of May). The act of planting was conducted annually during the period spanning from March 25 to April 10, coinciding with the attainment of an average soil temperature of 8°C. The study utilized a Unia Cora 2-spoon planter with a 30–32 cm distance between stems and 75 cm between rows for planting potatoes in a small plot. Mechanical weed control was employed, and the potato beetle was managed using Novodor FC, a 3% solution of Bacillus thuringiensis, at the L1–L2 (earlier larva stage) stage of larval development. The treatments, applied twice annually, were based on forecasts and consisted of 4 l of the solution per hectare in 300 l of water per hectare. The experiment was conducted without the application of any fungicides or herbicides.
2.3 Description of the used genotypes
Description of the used genotypes is given in Table 2.
Variety descriptions of the examined potatoes
| Potato variety | Description |
|---|---|
| Desiree | Desirée is a type of potato variety widely grown for its high yields and good taste. It has smooth, red skin, and yellow flesh and is popular for making mashed, roasted, and chips. In addition, the potato is considered a medium-starch variety and has a good storage life |
| Borostyán | Borostyán is a potato variety commonly grown in Hungary and other central European countries. This late-season variety features yellow skin and cream flesh and is well-regarded for its firm texture and pleasing flavor. Borostyán is highly versatile and can be used for various cooking methods, including boiling, roasting, and frying, making it an excellent all-purpose potato |
| Piroska | Piroska is a potato variety grown in Hungary and other central European countries. It is a mid-season variety with red skin and yellow flesh. It has high yields, good taste, and excellent storage qualities. Piroska potatoes are considered to be all-purpose, suitable for boiling, roasting, and frying |
| Rubinka | Rubinka is a potato variety grown in Russia and other Eastern European countries. It is a late-season variety with red skin and yellow flesh. It is known for its high yields, good taste, and storage qualities. Rubinka potatoes are considered to be all-purpose, suitable for boiling, roasting, and frying |
| Rózsa | Rózsa is a potato variety grown in Hungary and other central European countries. It is a mid-season variety with red skin and yellow flesh. It is known for its high yields, good taste, and storage qualities. Rózsa potatoes are considered to be all-purpose, suitable for boiling, roasting, and frying. The name “Rózsa” translates to “rose” in Hungarian, possibly referring to the color of the potato skin |
2.4 Measured parameters
During the harvesting process, the planting medium was extracted along with the plants, and subsequently, the sand adhered to the roots was removed by rinsing them with cold water. Later, the shoots were segregated, and the fresh mass of tubers per plot was expeditiously quantified. The dry matter content of potatoes was determined according to MSZ 6369-4:1987. The harvested and selected parts of the plant were subjected to a drying process at a temperature of 65°C for 24 h, after which their weight in a dehydrated state was determined. To ascertain the dry matter content, the weight of the sample was measured while submerged in water (VMT), followed by a drying process in a cabinet at a temperature of 105°C until a consistent weight was attained. This method is consistent with the guidelines outlined in Annex III A of Regulation 152/2009/EC.
The starch content of potatoes was determined according to MSZ 6830-18:1988. The sample was cooked with a dilute solution of hydrochloric acid. After the precipitation of proteins, the optical rotation of the mirror filtrate was measured on a polarimeter. The rotation value obtained has been corrected by the value of the optical rotation of the components treated with a dilute hydrochloric acid solution soluble in ethanol at 40% vol. Two techniques were employed to evaluate the starch content: specific gravity-based determination and polarimetric measurement. These methods follow the guidelines outlined in Regulation/EC 2235/2003 and Annex III I of Regulation 152/2009/EC.
The total nitrogen content of tubers was determined according to the Kjeldahl method [35]. The formula was utilized to compute the entire nitrogen content as follows:
where a – 0.01 n H2SO4 TSD solution (ml) consumed by titration, f – 0.01 n H2SO4 factor, b – the amount of vegetable sample used for distillation in mg.
From the total N content thus calculated, the crude protein content can also be calculated directly using the following formula [36]:
The crude protein content was assessed via the Dumas method, and the pure protein content was determined through the trichloroacetic acid precipitation method, according to WBSE-131:2018 guidelines.
2.5 Statistical analysis
The potato yield, protein, starch, and dry matter content data were subjected to statistical analysis using a combination of IBM SPSS v27 and R (version 4.2.2). Descriptive statistics were calculated in SPSS to obtain the central tendency and dispersion of the data. Pearson’s correlation was performed in SPSS to examine the relationship between yield, protein, starch, and dry matter content. A t-test was conducted for pairwise comparison of the genotypes. The graphics were generated using R’s “ggplot2” package [37].
3 Results
3.1 Average yield of genotypes between 2017 and 2021
In 2017, the average yield for genotype Desiree was 20.273 t/ha; for genotype Borostyán, it was 27.245 t/ha; for genotype Piroska, it was 29.680 t/ha; for genotype Rubinka, it was 26.950 t/ha; and for genotype Rózsa, it was 27.400 t/ha. In 2018, the average yield for genotype Desiree was 20.700 t/ha; for genotype Borostyán, it was 30.225 t/ha; for genotype Piroska, it was 27.425 t/ha; for genotype Rubinka, it was 27.563 t/ha; and for genotype Rózsa, it was 27.075 t/ha. In 2019, the average yield for genotype Desiree was 14,000 t/ha; for genotype Borostyán, it was 27.440 t/ha; for genotype Piroska, it was 30.328 t/ha; for genotype Rubinka, it was 26.935 t/ha, and for genotype Rózsa, it was 28.100 t/ha. In 2020, the average yield for genotype Desiree was 10.495 t/ha; for genotype Borostyán, it was 29.275 t/ha; for genotype Piroska, it was 28.500 t/ha; for genotype Rubinka, it was 27.550 t/ha, and for genotype Rózsa, it was 27.875 t/ha. In 2021, the average yield for genotype Desiree was 9.725 t/ha; for genotype Borostyán, it was 31.300 t/ha; for genotype Piroska, it was 29.875 t/ha; for genotype Rubinka, it was 31.200 t/ha; and for genotype Rózsa, it was 26.563 t/ha.
3.2 Ratio of dry matter and starch content
Upon analysis of the alterations in starch content throughout the years, as depicted in Figure 2, it is evident that the Desiree variety consistently exhibits the lowest levels of starch, with a minimum of 68.89%, a maximum of 75.66%, and an average of 72.73 ± 1.32%. This trait sets it apart from the other varieties. From 2017 to 2019, a declining pattern in the case of Desiree can be discerned, which is succeeded by a rise in the starch content of the variety until 2021.
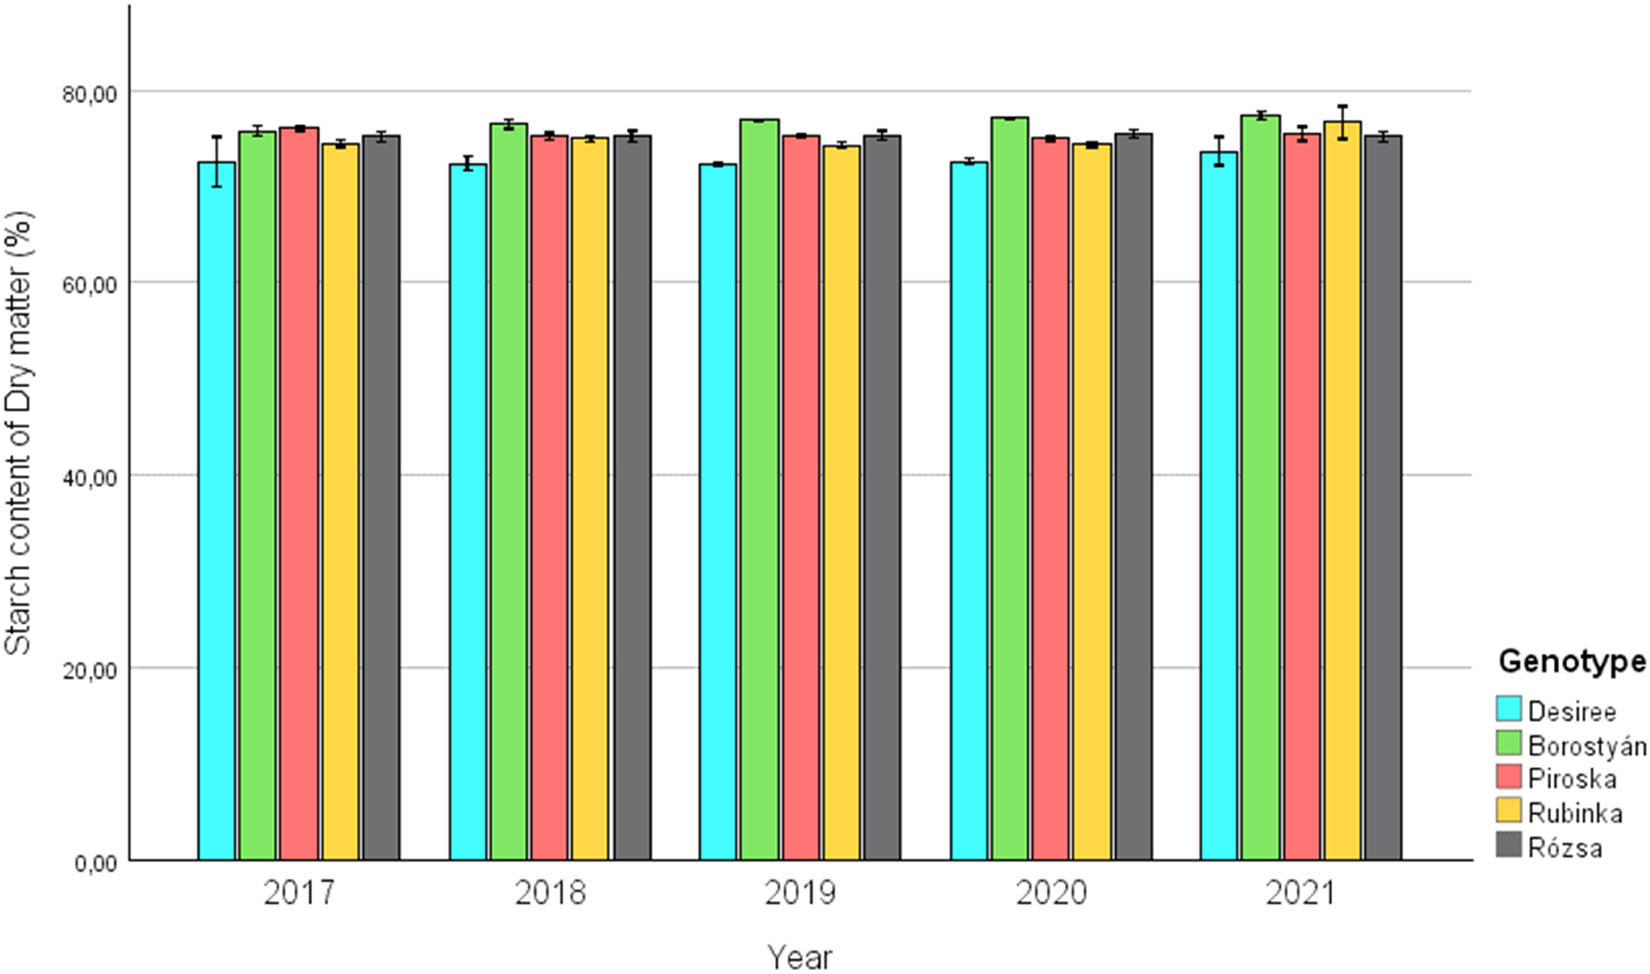
Change of starch content of the examined and replanted potato genotypes between 2017 and 2021.
Except for the first year, it has been observed that the Borostyán genotype exhibited an initial starch content ranging from a minimum of 75.32% to a maximum of 77.82%, with an average of 76.73 ± 0.64%. This trend sets Borostyán apart from other genotypes, as it exhibits higher starch content levels than the average. The Piroska and Rubinka genotypes responded hectically according to the climatic conditions of the given year; regarding the change in starch content, Piroska (75.41 ± 0.49%) and Rubinka (74.98 ± 1.13%) produced similar results on average. The Rózsa variety potato, which can be classified in the middle field, showed the most balanced results during the 5 years of the experiment, with an average starch content of (75.27 ± 0.45%).
The present study examined the impact of replanting five distinct genotypes over 5 years on the starch content, as depicted in Figure 3. The t-test comparing potato genotypes Borostyán and Rubinka in 2017 found a significant difference between the means, (t(6) = 4.304, p = 0.005). The mean of Borostyán was 75.78 ± 0.48, while the mean of Rubinka was 74.50 ± 0.34. We also found a significant difference (t(6) = 7.334, p = 0.001) between Rubinka and Piroska (76.02 ± 0.23), which last one also differ (t(6) = 2.751, p = 0.033) from Rózsa (75.24 ± 0.52). In the season of 2018, only Desiree (72.32 ± 0.22) showed lower starch content, and Borostyán (76.89 ± 0.11) showed significantly higher starch content than the other genotypes. Desiree had lower starch content compared to Borostyán (t(6) = −9.49, p = 0.001), Piroska (75.26 ± 0.36) (t(6) = −6.870, p = 0.001), Rubinka (74.99 ± 0.28) (t(6) = −6.472, p = 0.003), and Rózsa (76.21 ± 0.58) (t(6) = −5.89, p = 0.001). At the same time, Borostyán showed significantly higher results compared to Piroska (t(6) = 4.323, p = 0.005), Rubinka (t(6) = 5.775, p = 0.001), and Rózsa (t(6) = 3.51, p = 0.013) as well. In 2019, the results were similar to the previous year, where Desiree (72.41 ± 0.74) and Borostyán (76.48 ± 0.74) had significant differences from the other genotypes. Desiree had lower starch content compared to Borostyán (t(6) = −36.419, p = 0.001), Piroska (75.27 ± 0.22) (t(6) = −22.531, p = 0.001), Rubinka (74.33 ± 0.34) (t(6) = −9.816, p = 0.003), and Rózsa (76.21 ± 0.58) (t(6) = −11.015, p = 0.001). At the same time, Borostyán showed significantly higher results compared to Piroska (t(6) = 17.892, p = 0.001), Rubinka (t(6) = 14.076, p = 0.001), and Rózsa (t(6) = 6.367, p = 0.001). In 2018, Rubinka exhibited a lower starch content than Rózsa (t(6) = −3.188, p = 0.006). Conversely, Piroska demonstrated a higher starch content than Rubinka (t(6) = 5.031, p = 0.002).
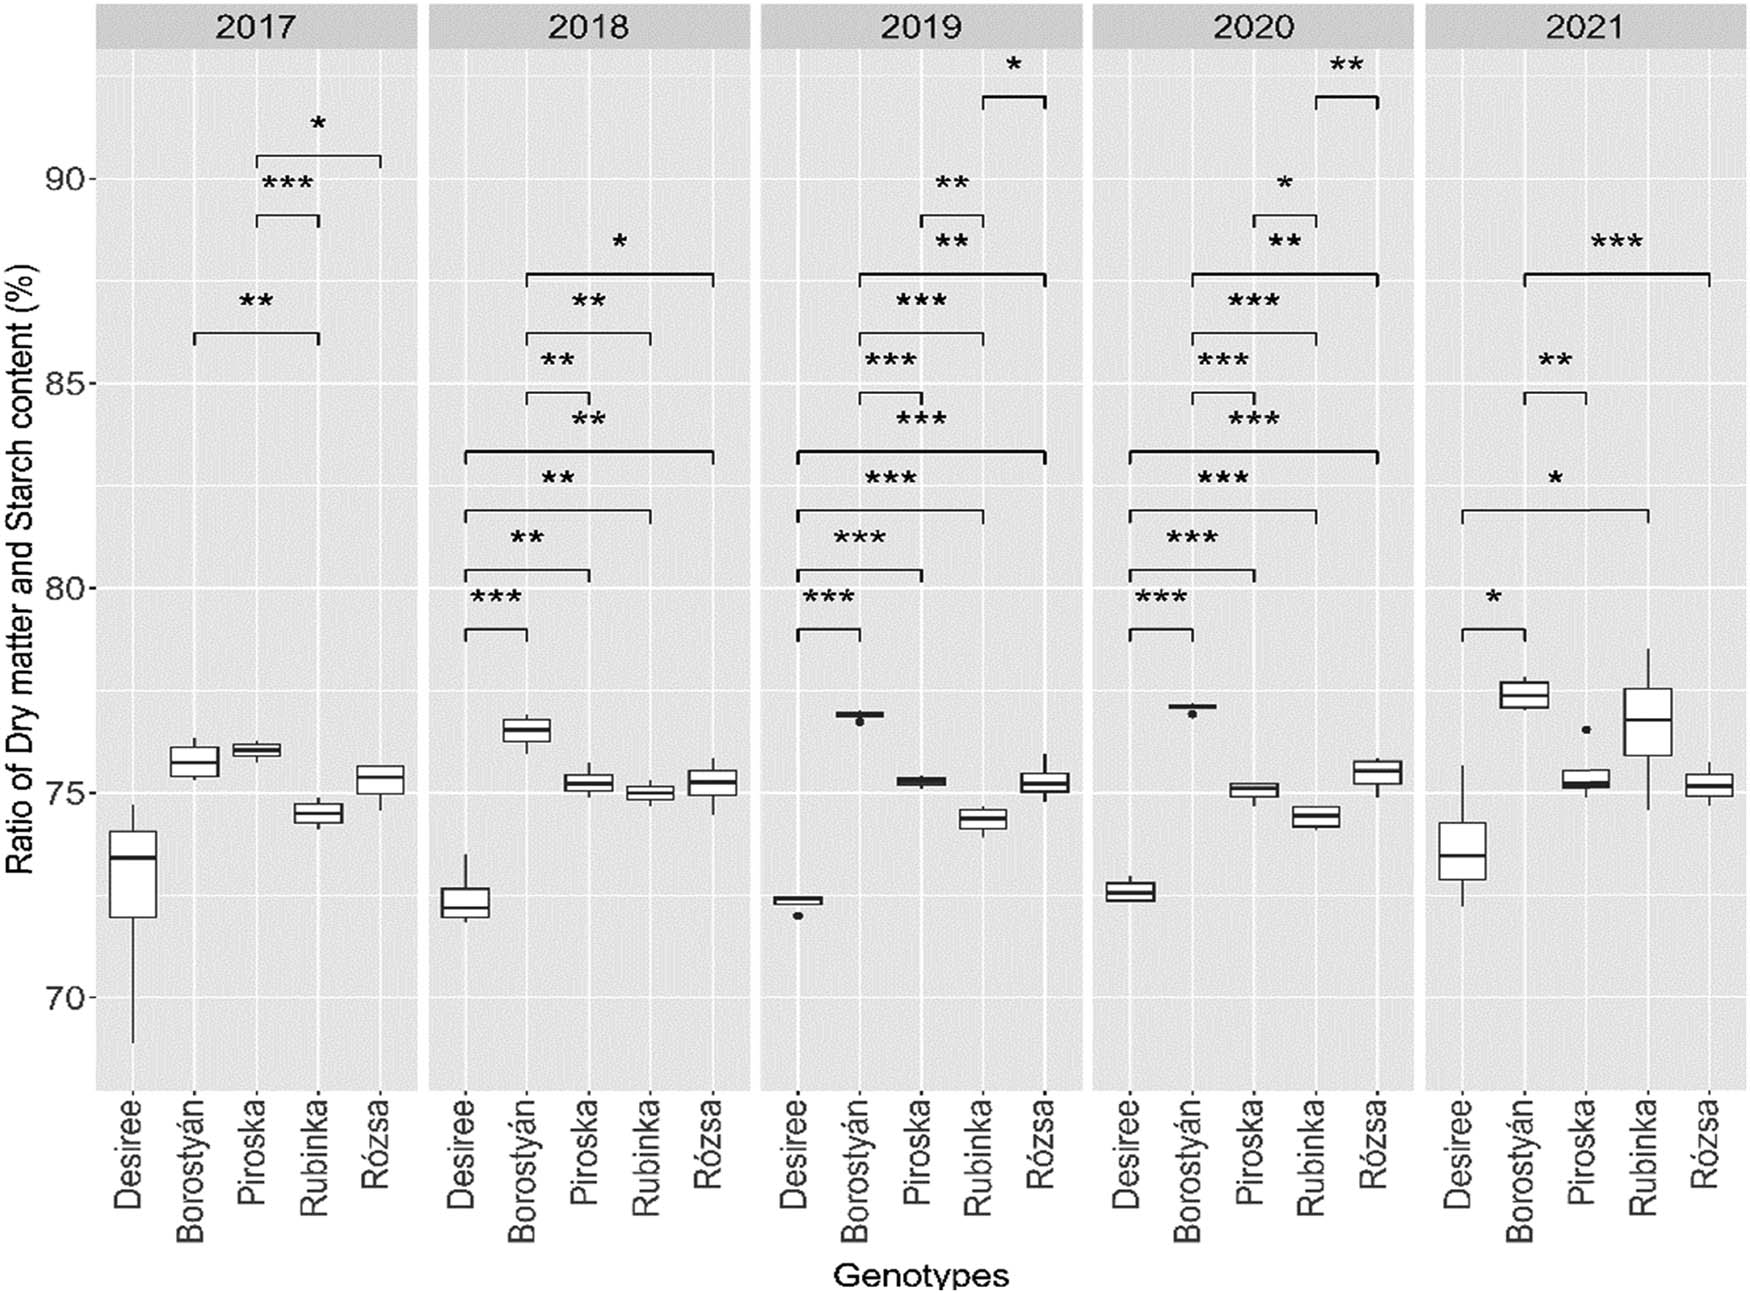
The ratio of starch content to dry matter per genotype in 5 years of the experiment. The interconnected genotypes marked with an asterisk significantly differ at the indicated p levels (p levels: * = 0.05, ** = 0.01, *** = 0.001). Where there is no marking, there was no significant difference between the genotypes.
The findings of the year 2020 exhibited several resemblances in comparison to the preceding year, 2019. Desiree (72.60 ± 0.30) had lower starch content compared to Borostyán (77.08 ± 0.11) (t(6) = −27.167, p = 0.001), Piroska (75.02 ± 0.26) (t(6) = −11.988, p = 0.001), Rubinka (74.40 ± 0.30) (t(6) = −8.326, p = 0.001), and Rózsa (75.45 ± 0.43) (t(6) = −10.630, p = 0.001), while Borostyán had significantly higher results compared to Piroska (t(6) = 14.456, p = 0.001), Rubinka (t(6) = 16.438, p = 0.001), and Rózsa (t(6) = 7.216, p = 0.001). Furthermore, Rubinka had a lower starch content compared to Piroska (t(6) = −3.078, p = 0.022) and Rózsa (t(6) = −3.919, p = 0.019).
In the last year of the experiment in 2020, the results showed that Desiree (73.70 ± 1.45) had significantly lower values than Borostyán (77.39 ± 0.39) (t(6) = −4.891, p = 0.001) and Rubinka (75.45 ± 0.43) (t(6) = −2.681, p = 0.037); meanwhile, Borostyán presents higher starch content compared to Piroska (75.46 ± 0.73) (t(6) = 4.881, p = 0.003) and Rózsa (75.18 ± 0.46) (t(6) = 7.292, p = 0.001) genotypes (Figure 4).
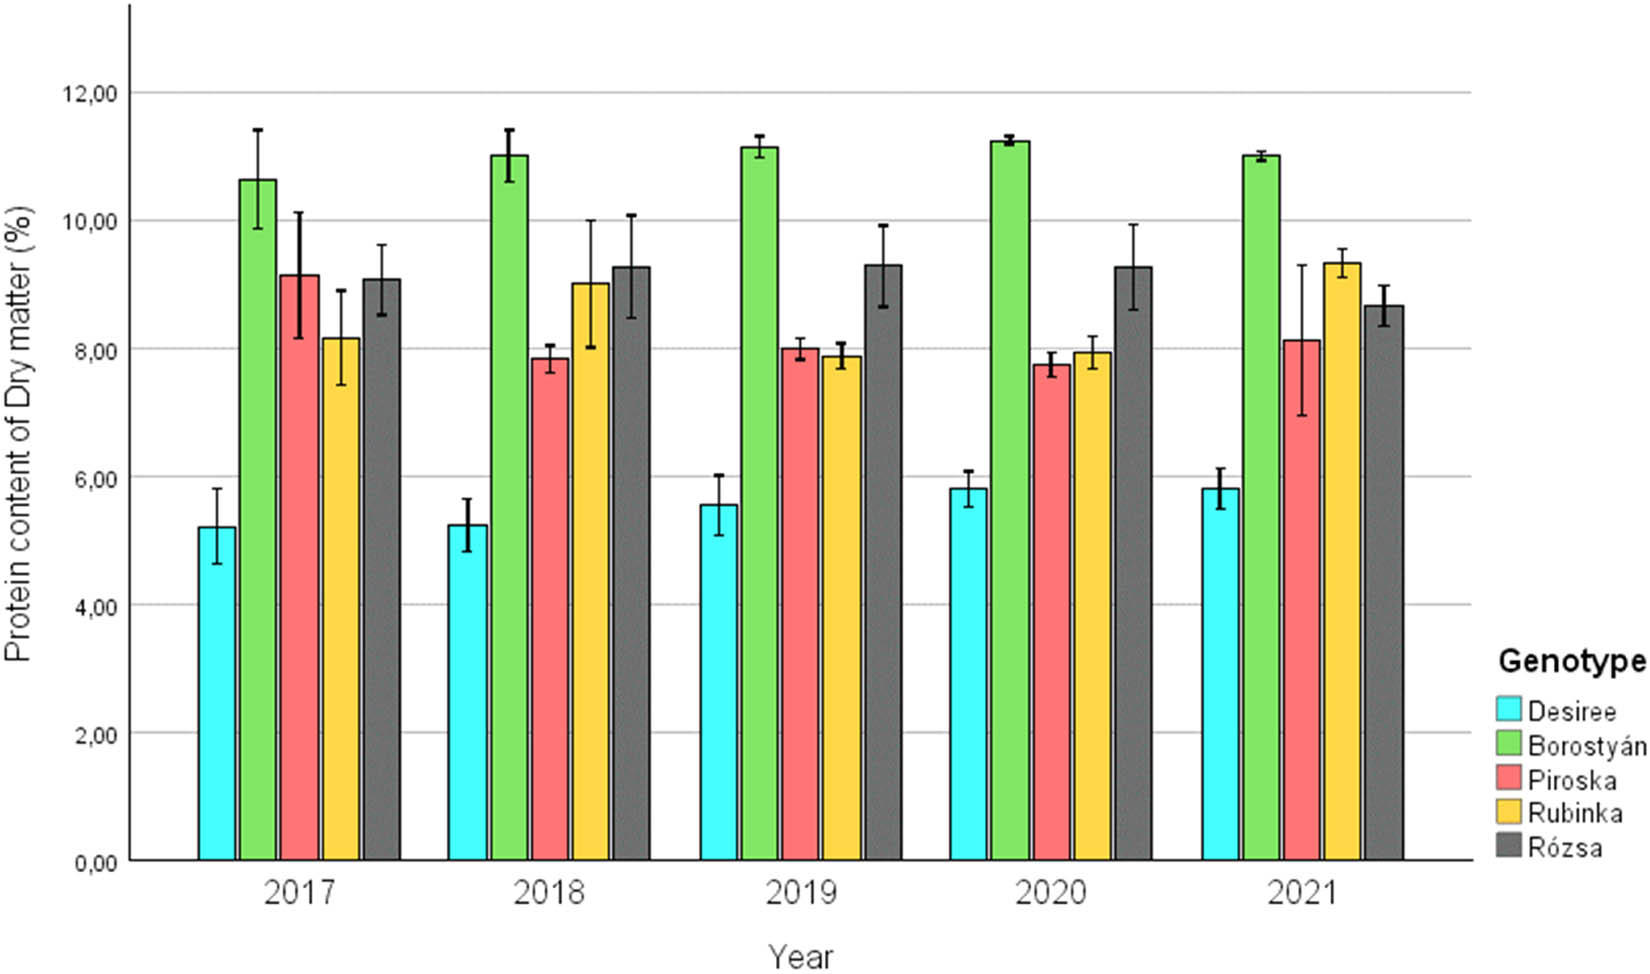
Change of protein content of the examined and replanted potato genotypes between 2017 and 2021.
3.3 Ratio of dry matter and protein content
In the case of changes in protein content, it is evident that the Desiree genotype exhibited the poorest performance among the selected varieties (min. 4.44%; max. 6.22%; avg. 5.52 ± 0.46%). In contrast to the baseline year 2017, 2021 exhibited a marginal rise in protein content. The highest results were equally achieved by the Borostyán genotype (min. 9.65%; max. 11.37%; avg. 10.99 ± 0.41%). The varieties Piroska (8.15 ± 0.81), Rubinka (8.45 ± 0.79), and Rózsa (8.82 ± 0.59) performed in an indistinguishable manner in terms of average protein content during the 5 years examined.
If we examine the changes in the protein content of the genotypes over the years (Figure 5), the average protein content in the season of 2017, the results showed that only the variety Desiree (5.21 ± 0.58) had lower protein content compared to the other genotypes. Desiree had lower protein content compared to Borostyán (10.63 ± 0.76) (t(6) = −11.242, p = 0.001), Piroska (9.13 ± 0.98) [t(6) = −6.861, p = 0.001], Rubinka (8.15 ± 0.73) (t(6) = −6.28, p = 0.001), and Rózsa (9.06 ± 0.54) (t(6) = −9.656, p = 0.001). On the other hand, Borostyán showed significantly higher protein content compared to Rubinka (t(6) = 4.65, p = 0.004) and Rózsa (t(6) = 3.333, p = 0.016) genotypes.
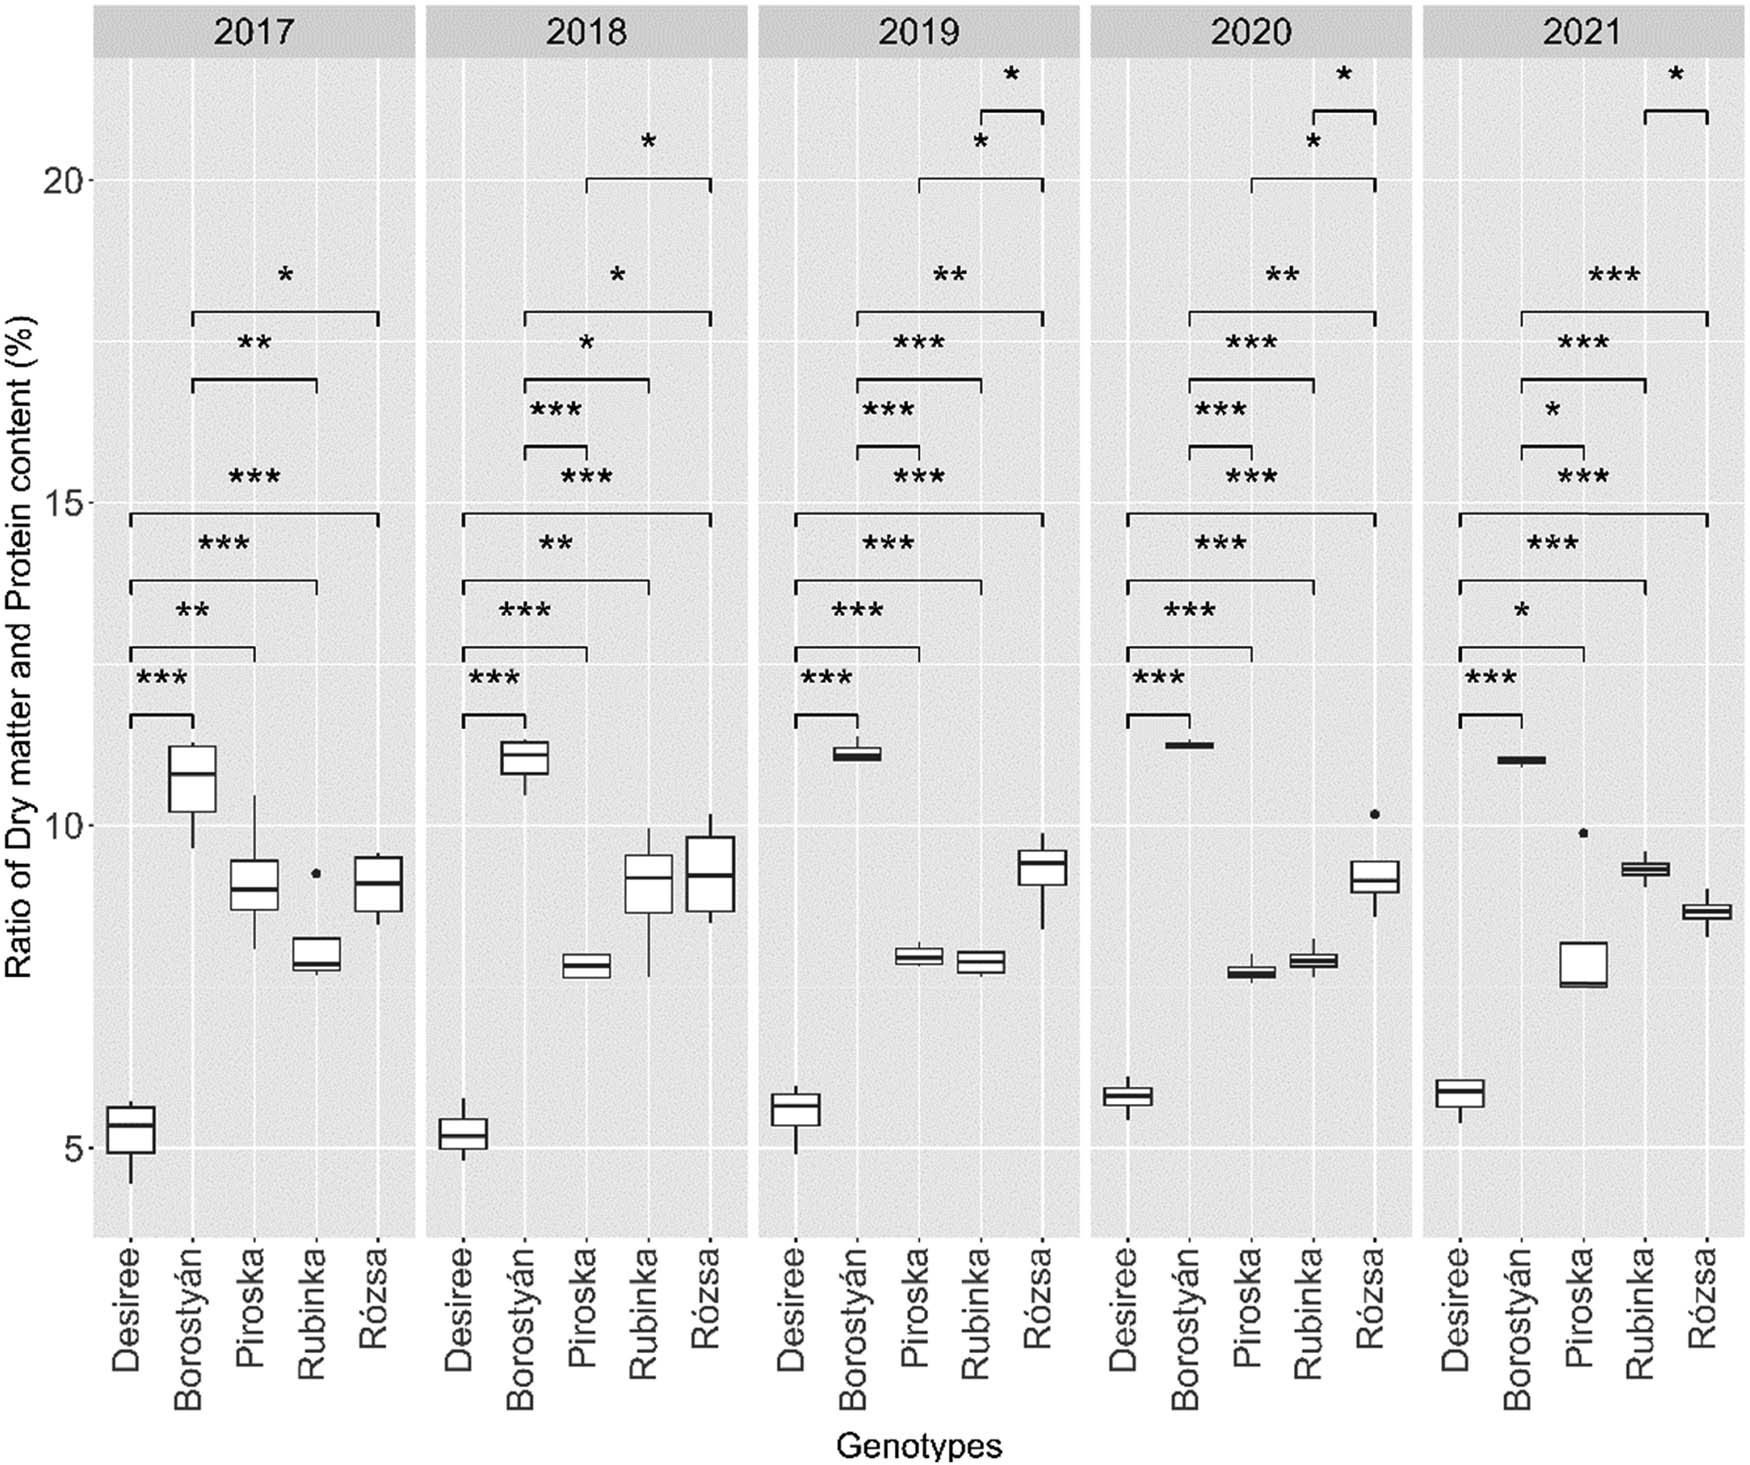
The ratio of protein content to dry matter per genotype in the 5 years of the experiment. The interconnected genotypes marked with an asterisk significantly differ at the indicated p levels (p levels: * = 0.05, ** = 0.01, *** = 0.001). Where there is no marking, there was no significant difference between the genotypes.
The findings from the year 2018 indicate that Desiree (5.23 ± 0.41) exhibited a statistically significant reduction in protein content to all the other genotypes. Specifically, Desiree presented lower protein content compared to Borostyán (10.99 ± 0.39) (t(6) = −19.993, p = 0.001), Piroska (7.81 ± 0.21) (t(6) = −11.034, p = 0.001), Rubinka (8.99 ± 0.98) (t(6) = −7.036, p = 0.001), and Rózsa (9.27 ± 0.79) (t(6) = −8.995, p = 0.001). Furthermore, Borostyán had significantly higher protein content compared to Piroska (t(6) = 14.00, p = 0.001), Rubinka (t(6) = 3.76, p = 0.009), and Rózsa (t(6) = 3.87, p = 0.008). Additionally, Piroska had lower protein content than Rózsa (t(6) = −3.529, p = 0.012).
In 2019, Desiree (5.53 ± 0.46) exhibited lower protein content compared to Borostyán (11.13 ± 0.16) (t(6) = −22.674, p = 0.001), Piroska (7.98 ± 0.17) (t(6) = −9.877, p = 0.001), Rubinka (7.86 ± 0.19) (t(6) = −9.816, p = 0.001), and Rózsa (9.27 ± 0.63) (t(6) = −9.483, p = 0.001) genotypes. Borostyán had significantly higher protein content compared to Piroska (t(6) = 26.403, p = 0.001), Rubinka (t(6) = 25.107, p = 0.001), and Rózsa (t(6) = 5.653, p = 0.001). Piroska and Rubinka had significantly higher protein content compared to Rózsa (t(6) = −9.323, p = 0.008) and (t(6) = −4.226, p = 0.017), respectively.
In the season of 2020, the results present that Desiree (5.78 ± 0.28) had significantly lower protein content compared to Borostyán (11.23 ± 0.06) (t(6) = −27.167, p = 0.001), Piroska (7.74 ± 0.18) (t(6) = −11.988, p = 0.001), Rubinka (7.91 ± 0.25) (t(6) = −11.257, p = 0.001), and Rózsa (9.26 ± 0.66) (t(6) = −10.630, p = 0.001). Moreover, Borostyán had significantly higher protein content compared to Piroska (t(6) = 35.273, p = 0.001), Rubinka (t(6) = 25.337, p = 0.001), and Rózsa (t(6) = 5.954, p = 0.001). Also, Piroska had lower protein content compared to Rózsa (t(6) = −4.421, p = 0.004), and Rubinka had lower protein content compared to Rózsa (t(6) = −3.792, p = 0.009).
The findings of the most recent iteration of the experiment conducted in 2021 indicate that Desiree (5.80 ± 0.31) exhibited a statistically significant reduction in protein content relative to all other genotypes. Desiree had lower protein content compared to Borostyán (10.99 ± 0.07) (t(6) = −31.861, p = 0.001), Piroska (8.11 ± 1.17) (t(6) = −3.789, p = 0.009), Rubinka (9.31 ± 0.22) (t(6) = −18.070, p = 0.001), and Rózsa (8.65 ± 0.30) (t(6) = −12.882 p = 0.001). However, Borostyán had significantly higher protein content again compared to Piroska (t(6) = 4.881, p = 0.003), Rubinka (t(6) = 14.207, p = 0.001), and Rózsa (t(6) = 14.743, p = 0.001). Rubinka also had higher protein content than Rózsa (t(6) = 3.471, p = 0.013).
3.4 Correlation between the yield, the starch, and protein content
The correlation between the yield, starch, and protein content was analyzed, as presented in Table 3. The Pearson-type correlation matrix results from the potato experiment suggest that the yield of the five genotypes (Desiree, Borostyán, Piroska, Rubinka, and Rózsa) positively correlates with starch and protein contents. The finding indicates a significant positive correlation between starch content and yields for the genotype Rubinka (0.797). The same pattern was found for the correlation between protein content and yield, with a significant positive correlation for the genotypes Piroska (0.867), Rubinka (0.681), and Rózsa (0.789). The study revealed a negative correlation (−0.23) between the starch content and yield of the Desiree genotype, indicating that an increase in starch content was associated with a decrease in yield. Additionally, a negative correlation was found between protein content and yield for the genotype Desiree (−0.585), meaning that the yield decreased as the protein content increased (Table 4).
Average yield of genotypes between 2017 and 2021
| Year | Genotype | Yield (t/ha) |
|---|---|---|
| 2017 | Desiree | 20.273 |
| Borostyán | 27.245 | |
| Piroska | 29.680 | |
| Rubinka | 26.950 | |
| Rózsa | 27.400 | |
| 2018 | Desiree | 20.700 |
| Borostyán | 30.225 | |
| Piroska | 27.425 | |
| Rubinka | 27.563 | |
| Rózsa | 27.075 | |
| 2019 | Desiree | 14.000 |
| Borostyán | 27.440 | |
| Piroska | 30.328 | |
| Rubinka | 26.935 | |
| Rózsa | 28.100 | |
| 2020 | Desiree | 10.495 |
| Borostyán | 29.275 | |
| Piroska | 28.500 | |
| Rubinka | 27.550 | |
| Rózsa | 27.875 | |
| 2021 | Desiree | 9.725 |
| Borostyán | 31.300 | |
| Piroska | 29.875 | |
| Rubinka | 31.200 | |
| Rózsa | 26.563 |
Pearson-type correlation matrix results between yield, starch content, and protein content in potato genotypes
| Genotype | Parameters | Yield (t/ha) | Starch content (%) | Protein content (%) |
|---|---|---|---|---|
| Yield (t/ha) | — | |||
| Desiree | Starch content (%) | −0.23 | — | |
| Protein content (%) | −0.585** | 0.514* | — | |
| Yield (t/ha) | — | |||
| Borostyán | Starch content (%) | 0.327 | — | |
| Protein content (%) | 0.01 | 0.653** | — | |
| Yield (t/ha) | — | |||
| Piroska | Starch content (%) | 0.311 | — | |
| Protein content (%) | 0.224 | 0.867** | — | |
| Yield (t/ha) | — | |||
| Rubinka | Starch content (%) | 0.797** | — | |
| Protein content (%) | 0.538* | 0.681** | — | |
| Yield (t/ha) | — | |||
| Rózsa | Starch content (%) | 0.530* | — | |
| Protein content (%) | 0.507* | 0.789** | — | |
| Yield (t/ha) | — | |||
| Total | Starch content (%) | 0.701** | — | |
| Protein content (%) | 0.693** | 0.872** | — |
*Results are significant at p < 0.05 level. ** Results are significant at p < 0.01 level.
If we compare all of the genotypes, we observe that the starch content and protein content had a strong positive correlation with a Pearson correlation coefficient of 0.701 and 0.693, respectively. This implies that as the starch content increases, the protein content also increases, and vice versa.
4 Discussion
The results indicated significant differences in starch content among the genotypes. The Desiree genotype had the lowest average starch content, and the Borostyán genotype had the highest. The Piroska and Rubinka genotypes indicate a more variable response with an average starch content. The Rózsa genotype had a more balanced moderate starch content. The t-tests revealed that in some years, the starch content of the Desiree genotype was lower than the other genotypes, while in other years, the starch content of the Borostyán genotype was significantly higher. These results suggest that replanting significantly impacts potato plants’ starch content, with genotype being a significant factor. In light of these findings, it is worth noting that the environment can also influence starch content and viscosity behavior [38]. The enhancement of crucial traits, such as disease resistance and high yields, could be achieved by means of breeding programs that capitalize on the advantageous starch profile present in these potato genotypes [39]. Moreover, prior research has demonstrated that wild potato species exhibit greater variability than cultivated potatoes across all investigated characteristics [40].
We received robust evidence for the variations in protein content across the genotypes. The results suggest that the Desiree variety exhibited the lowest mean protein content, whereas the Borostyán genotype demonstrated the highest. The remaining three genotypes, Piroska, Rubinka, and Rózsa, exhibited comparable mean protein content, around 8.5%. The research findings indicate that the protein content of potato tubers is subject to the impact of various factors, including the type of nitrogenous fertilization and the crop rotation involving potatoes. This study also supports previous research indicating that the protein content of genotypes can differ significantly [41]. It should be emphasized that applying proper nitrogen fertilization can enhance both the quality and quantity of tubers [42]. Moreover, when combined with crop rotation, it has the potential to further augment the yield [43].
Our results also revealed the relationship between the five potato genotypes’ yield, starch, and protein content. The correlation between yield and the parameters mentioned above exhibits variability across genotypes, as specific genotypes demonstrate an inverse correlation. As demonstrated by Liu et al. [44], starch is the major component of the dry matter in potatoes. However, as noted in other species, high protein levels, for example, in peas, can result in significantly lower starch content [45]. The present investigation revealed a positive association between the yield and the starch and protein content for the five potato genotypes. However, the nature of this correlation was not uniform across all the genotypes, as specific genotypes exhibited an inverse correlation. These findings have implications for potato breeding and selection programs. They can guide the selection of potato genotypes for various purposes, such as breeding programs or the production of high-protein potato products. Further studies are needed to confirm and expand on these results and to explore the mechanisms and genetic factors that influence these relationships.
5 Conclusion
The results indicate that replanting had a significant impact on the starch content of potato plants, with genotype being an important factor. These results suggest that the protein content of the potato tubers is influenced by factors such as the type of nitrogenous fertilization and the rotation of crops with potatoes. The findings indicate a positive correlation between yield, starch, and protein content. However, this association exhibited variability across the genotypes, with specific genotypes demonstrating a negative correlation. In conclusion, the study provides valuable insights into the effect of replanting on the starch and protein content of different potato genotypes. The results indicate that genetics play a significant role in the starch content of potato plants and that some genotypes consistently have higher or lower starch content than others. The findings of this study have implications for potato breeding and selection programs. They can be used to guide the selection of potato genotypes for various purposes, such as breeding programs or the production of high-protein potato products. Also, based on these results, it can also be said that, in addition to the standard Desiree variety, the Hungarian Borostyán variety can also be confidently recommended as a test subject in potato research and breeding programs. Further studies are necessary to confirm and expand on these results and to explore the mechanisms and genetic factors that influence these relationships.
Acknowledgment
We would like to sincerely thank the Hungarian University of Agriculture and Life Sciences Institute of Agronomy for their support and contributions to this project.
-
Funding information: The authors state no funding involved.
-
Author contributions: Conceptualization and methodology, P.P.M. and Á.K.; formal analysis and investigation, Á.K.; writing – original draft preparation, review and editing: Z.K. supervision, A.P.
-
Conflict of interest: All authors have read and approved the final manuscript. The authors state no conflict of interest.
-
Data availability statement: The data sets generated during and/or analyzed during the current study are available from the corresponding author on reasonable request.
References
[1] Wijesinha-Bettoni R, Mouillé B. The contribution of potatoes to global food security, nutrition and healthy diets. Am J Potato Res. Jan 2019;96(2):139–49. 10.1007/s12230-018-09697-1.Search in Google Scholar
[2] Robertson T, Alzaabi A, Robertson M, Fielding B. Starchy carbohydrates in a healthy diet: The role of the humble potato. Nutrients. Nov. 2018;10(11):1764. 10.3390/nu10111764.Search in Google Scholar PubMed PubMed Central
[3] Reddy BJ, Mandal R, Chakroborty M, Hijam L, Dutta P. A review on potato (Solanum Tuberosum L.) and its genetic diversity. Int J Genet. Mar. 2018;10(2):360. 10.9735/0975-2862.10.2.360-364.Search in Google Scholar
[4] Nasir MW, Toth Z. Effect of drought stress on potato production: A review. Agronomy. Mar. 2022;12(3):635. 10.3390/agronomy12030635.Search in Google Scholar
[5] Dineva S. Monitoring of nitrate content in potatous from bulgarian market. International Conference on Technics, Technologies and Education, no. ICTTE 2019; 2019. p. 534–7. 10.15547/ictte.2019.07.081.Search in Google Scholar
[6] Mohammadi A, Tabatabaeefar A, Shahin S, Rafiee S, Keyhani A. Energy use and economical analysis of potato production in Iran a case study: Ardabil province. Energy Convers Manag. Dec. 2008;49(12):3566–70. 10.1016/j.enconman.2008.07.003.Search in Google Scholar
[7] Zangeneh M, Omid M, Akram A. A comparative study on energy use and cost analysis of potato production under different farming technologies in Hamadan province of Iran. Energy. Jul. 2010;35(7):2927–33. 10.1016/j.energy.2010.03.024.Search in Google Scholar
[8] Stalham MA, Allen EJ. Effect of variety, irrigation regime and planting date on depth, rate, duration and density of root growth in the potato (iSolanum tuberosum/i) crop. J Agric Sci. Nov. 2001;137(3):251–70. 10.1017/s0021859601001332.Search in Google Scholar
[9] Gupta VK, Luthra SK, Singh BP. Storage behaviour and cooking quality of Indian potato varieties. J Food Sci Technol. Oct. 2014;52(8):4863–73. 10.1007/s13197-014-1608-z.Search in Google Scholar PubMed PubMed Central
[10] Kolech SA, Halseth D, De Jong W, Perry K, Wolfe D, Tiruneh FM, et al. Potato variety diversity, determinants and implications for potato breeding strategy in Ethiopia. Am J Potato Res. Jul. 2015;92(5):551–66. 10.1007/s12230-015-9467-3.Search in Google Scholar
[11] Kolech SA, De Jong W, Perry K, Halseth D, Mengistu F. Participatory variety selection: A tool to understand farmers potato variety selection criteria. Open Agric. Aug. 2017;2(1):453–63. 10.1515/opag-2017-0049.Search in Google Scholar
[12] Tessema L, Mohammed W, Abebe T. Evaluation of potato (iSolanum tuberosum/i L.) varieties for yield and some agronomic traits. Open Agric. Jan. 2020;5(1):63–74. 10.1515/opag-2020-0006.Search in Google Scholar
[13] Luis G, Rubio C, González-Weller D, Gutiérrez AJ, Revert C, Hardisson A. Comparative study of the mineral composition of several varieties of potatoes (Solanum tuberosum L.) from different countries cultivated in Canary Islands (Spain). Int J Food Sci Technol. 2011;46(4):774–80. 10.1111/j.1365-2621.2011.02556.x.Search in Google Scholar
[14] Ierna A, Mauromicale G. Sustainable and profitable nitrogen fertilization management of potato. Agronomy. Sep. 2019;9(10):582. 10.3390/agronomy9100582.Search in Google Scholar
[15] Duguma H, Chewaka M. Review on coffee (Coffea arabica L.) wet processing more focus in Ethiopia. Acta Sci Agric. Oct. 2019;3(11):11–5. 10.31080/asag.2019.03.0676.Search in Google Scholar
[16] Torabian S, Farhangi-Abriz S, Qin R, Noulas C, Sathuvalli V, Charlton B, et al. Potassium: A vital macronutrient in potato production – A review. Agronomy. Mar. 2021;11(3):543. 10.3390/agronomy11030543.Search in Google Scholar
[17] Bradshaw JE, Ramsay G. Utilisation of the Commonwealth Potato Collection in potato breeding. Euphytica. 2005;146:9–19.10.1007/s10681-005-3881-4Search in Google Scholar
[18] Hirsch CN, Hirsch CD, Felcher K, Coombs J, Zarka D, Van Deynze A, et al. Retrospective view of North American potato (Solanum tuberosum L.) breeding in the 20th and 21st centuries. G3: Genes Genomes Genet. 2013;3:1003–13.10.1534/g3.113.005595Search in Google Scholar PubMed PubMed Central
[19] Clark CF. Recent developments in potato breeding: review of literature. Am Potato J. 2008;15:16–26.10.1007/BF02884603Search in Google Scholar
[20] Baebler Š, Coll A, Gruden K. Plant molecular responses to Potato Virus Y: A continuum of outcomes from sensitivity and tolerance to resistance. Viruses. Feb. 2020;12(2):217. 10.3390/v12020217.Search in Google Scholar PubMed PubMed Central
[21] Torrance L, Talianksy ME. Potato Virus Y emergence and evolution from the Andes of South America to become a major destructive pathogen of potato and other solanaceous crops worldwide. Viruses. Dec. 2020;12(12):1430. 10.3390/v12121430.Search in Google Scholar PubMed PubMed Central
[22] Aljawasim BD, Khaeim HM, Manshood MA. Assessment of arbuscular mycorrhizal fungi (Glomus spp.) as potential biocontrol agents against damping-off disease Rhizoctonia solani on cucumber. J Crop Prot. Dec. 2020;9(1):141–7. Accessed: May 21, 2023 [Online]. http://jcp.modares.ac.ir/article-3-33473-en.html.Search in Google Scholar
[23] Sood S, Bhardwaj V, Pandey SK, Chakrabarti SK. History of potato breeding: improvement, diversification, and diversity. Berlin: Springer-Verlag; 2017.10.1007/978-3-319-66135-3_3Search in Google Scholar
[24] Supit I, Van Diepen CA, De Wit AJ, Wolf J, Kabat P, Baruth B, et al. Assessing climate change effects on European crop yields using the Crop Growth Monitoring System and a weather generator. Agric Meteorol. Oct. 2012;164:96–111. 10.1016/j.agrformet.2012.05.005.Search in Google Scholar
[25] Khaeim H, Kende Z, Jolánkai M, Kovács GP, Gyuricza C, Tarnawa Á. Impact of temperature and water on seed germination and seedling growth of maize (Zea mays L.). Agronomy. 2022;12(2):397. 10.3390/agronomy12020397.Search in Google Scholar
[26] Hameed A, Iqbal Z, Asad S, Mansoor S. Detection of multiple potato viruses in the field suggests synergistic interactions among potato viruses in Pakistan. Plant Pathol J. Dec. 2014;30(4):407–15. 10.5423/ppj.oa.05.2014.0039.Search in Google Scholar
[27] Khaeim H, Kende Z, Balla I, Gyuricza C, Eser A, Tarnawa Á. The effect of temperature and water stresses on seed germination and seedling growth of wheat (Triticum aestivum L.). Sustainability. 2022;14(7):3887. 10.3390/su14073887.Search in Google Scholar
[28] Tarnawa Á, Kende Z, Haj Sghaier A, Kovács P, Gyuricza C, Khaeim H. Effect of abiotic stresses from drought, temperature, and density on germination and seedling growth of barley (Hordeum vulgare L.). Plants. Apr. 2023;12(9):1792. 10.3390/PLANTS12091792.Search in Google Scholar PubMed PubMed Central
[29] Mekonen S, Tadesse T. Effect of varieties and fungicides on potato late blight (Phytophthora infestans, (Mont.) de Bary) management. Agrotechnology. 2018;7(2):1–4. 10.4172/2168-9881.1000182.Search in Google Scholar
[30] Haverkort AJ, Struik PC. Yield levels of potato crops: Recent achievements and future prospects. Field Crop Res. Oct. 2015;182:76–85. 10.1016/j.fcr.2015.06.002.Search in Google Scholar
[31] Esztergályos Á, Polgár Z. The effect of chemical treatments on the tuber dormancy of hungarian potato cultivars. Potato Res. Oct. 2020;64(3):327–37. 10.1007/s11540-020-09479-5.Search in Google Scholar
[32] Tömösközi-Farkas R, Berki M, Nagy-Gasztonyi M, Wolf I, Polgár Z. Investigation of antinutritive components in Hungarian potato cultivars depending on production technology. Acta Aliment. Nov. 2014;43(Supplement 1):188–96. 10.1556/aalim.43.2014.suppl.26.Search in Google Scholar
[33] Spooner DM, Rodríguez F, Polgár Z, Ballard HE, Jansky SH. Genomic origins of potato polyploids: GBSSI gene sequencing data. Crop Sci. Mar. 2008;48(S1):S27–S36. 10.2135/cropsci2007.09.0504tpg.Search in Google Scholar
[34] Tömösközi-Farkas R, Daood HG, Polgár Z, Hajós G. Determination of glycoalcaloids in Hungarian potatoes by HPLC. Chromatographia. Apr. 2006;63(S13):S115–8. 10.1365/s10337-006-0763-4.Search in Google Scholar
[35] Bradstreet RB. The Kjeldahl Digestion. In The Kjeldahl method for organic nitrogen. New York: Academic Press; 1965. p. 9–88. 10.1016/b978-1-4832-3298-0.50005-9.Search in Google Scholar
[36] Balázs G, Bugyi ZS, Gergely SZ, Hegyi A, Hevér A, Salgó A, et al. Fehérjetartalom meghatározás módszerei. Élelmiszeranalitika gyors és automatizált módszerei. Nemzeti Tankönyvkiadó; 2011.Search in Google Scholar
[37] Wickham H. ggplot2: Elegant graphics for data analysis. New York: Springer-Verlag; 2016 [Online]. https://ggplot2.tidyverse.org.10.1007/978-3-319-24277-4Search in Google Scholar
[38] Haase NU, Plate J. Properties of potato starch in relation to varieties and environmental factors. Starch – Stärke. Jan. 1996;48(5):167–71. 10.1002/star.19960480503.Search in Google Scholar
[39] Bach S, Yada RY, Bizimungu B, Fan M, Sullivan JA. Genotype by environment interaction effects on starch content and digestibility in potato (Solanum tuberosum L.). J Agric Food Chem. Apr. 2013;61(16):3941–8. 10.1021/jf3030216.Search in Google Scholar PubMed
[40] Jansen G, Flamme W, Schüler K, Vandrey M. Tuber and starch quality of wild and cultivated potato species and cultivars. Potato Res. 2001;44(2):137–46. 10.1007/BF02410100.Search in Google Scholar
[41] Purcell AE, Pope DT, Walter WM. Effect of length of growing season on protein content of sweet potato cultivars1. HortScience. 1976;11(1):31. 10.21273/HORTSCI.11.1.31.Search in Google Scholar
[42] Mitrus J, Stankiewicz C, Stec E, Kamecki M, Starczewski J. The influence of selected cultivation on the content of total protein and amino acids in the potato tubers. Plant Soil Env. 2003;49(3):131–4 [Online]. https://pse.agriculturejournals.cz/artkey/pse-200303-0007.php.10.17221/4102-PSESearch in Google Scholar
[43] Honeycutt CW. Crop rotation impacts on potato protein. Plant Foods Hum Nutr. 1998;52(4):279–92. 10.1023/A:1008046223958.Search in Google Scholar
[44] Liu Q, Donner E, Tarn R, Singh J, Chung H-J. Chapter 8 - Advanced Analytical Techniques to Evaluate the Quality of Potato and Potato Starch. In: Singh J, Kaur L, editors. Advances in Potato Chemistry and Technology. San Diego: Academic Press; 2009. p. 221–48. 10.1016/B978-0-12-374349-7.00008-8.Search in Google Scholar
[45] Shen S, Hou H, Ding C, Bing D-J, Lu Z-X. Protein content correlates with starch morphology, composition and physicochemical properties in field peas. Can J Plant Sci. Jun. 2016;96(3):404–12. 10.1139/cjps-2015-0231.Search in Google Scholar
© 2023 the author(s), published by De Gruyter
This work is licensed under the Creative Commons Attribution 4.0 International License.
Articles in the same Issue
- Regular Articles
- The impact of COVID-19 pandemic on business risks and potato commercial model
- Effects of potato (Solanum tuberosum L.)–Mucuna pruriens intercropping pattern on the agronomic performances of potato and the soil physicochemical properties of the western highlands of Cameroon
- Machine learning-based prediction of total phenolic and flavonoid in horticultural products
- Revamping agricultural sector and its implications on output and employment generation: Evidence from Nigeria
- Does product certification matter? A review of mechanism to influence customer loyalty in the poultry feed industry
- Farmer regeneration and knowledge co-creation in the sustainability of coconut agribusiness in Gorontalo, Indonesia
- Lablab purpureus: Analysis of landraces cultivation and distribution, farming systems, and some climatic trends in production areas in Tanzania
- The effects of carrot (Daucus carota L.) waste juice on the performances of native chicken in North Sulawesi, Indonesia
- Properties of potassium dihydrogen phosphate and its effects on plants and soil
- Factors influencing the role and performance of independent agricultural extension workers in supporting agricultural extension
- The fate of probiotic species applied in intensive grow-out ponds in rearing water and intestinal tracts of white shrimp, Litopenaeus vannamei
- Yield stability and agronomic performances of provitamin A maize (Zea mays L.) genotypes in South-East of DR Congo
- Diallel analysis of length and shape of rice using Hayman and Griffing method
- Physicochemical and microbiological characteristics of various stem bark extracts of Hopea beccariana Burck potential as natural preservatives of coconut sap
- Correlation between descriptive and group type traits in the system of cow’s linear classification of Ukrainian Brown dairy breed
- Meta-analysis of the influence of the substitution of maize with cassava on performance indices of broiler chickens
- Bacteriocin-like inhibitory substance (BLIS) produced by Enterococcus faecium MA115 and its potential use as a seafood biopreservative
- Meta-analysis of the benefits of dietary Saccharomyces cerevisiae intervention on milk yield and component characteristics in lactating small ruminants
- Growth promotion potential of Bacillus spp. isolates on two tomato (Solanum lycopersicum L.) varieties in the West region of Cameroon
- Prioritizing IoT adoption strategies in millennial farming: An analytical network process approach
- Soil fertility and pomelo yield influenced by soil conservation practices
- Soil macrofauna under laying hens’ grazed fields in two different agroecosystems in Portugal
- Factors affecting household carbohydrate food consumption in Central Java: Before and during the COVID-19 pandemic
- Properties of paper coated with Prunus serotina (Ehrh.) extract formulation
- Fertiliser cost prediction in European Union farms: Machine-learning approaches through artificial neural networks
- Molecular and phenotypic markers for pyramiding multiple traits in rice
- Natural product nanofibers derived from Trichoderma hamatum K01 to control citrus anthracnose caused by Colletotrichum gloeosporioides
- Role of actors in promoting sustainable peatland management in Kubu Raya Regency, West Kalimantan, Indonesia
- Small-scale coffee farmers’ perception of climate-adapted attributes in participatory coffee breeding: A case study of Gayo Highland, Aceh, Indonesia
- Optimization of extraction using surface response methodology and quantification of cannabinoids in female inflorescences of marijuana (Cannabis sativa L.) at three altitudinal floors of Peru
- Production factors, technical, and economic efficiency of soybean (Glycine max L. Merr.) farming in Indonesia
- Economic performance of smallholder soya bean production in Kwara State, Nigeria
- Indonesian rice farmers’ perceptions of different sources of information and their effect on farmer capability
- Feed preference, body condition scoring, and growth performance of Dohne Merino ram fed varying levels of fossil shell flour
- Assessing the determinant factors of risk strategy adoption to mitigate various risks: An experience from smallholder rubber farmers in West Kalimantan Province, Indonesia
- Analysis of trade potential and factors influencing chili export in Indonesia
- Grade-C kenaf fiber (poor quality) as an alternative material for textile crafts
- Technical efficiency changes of rice farming in the favorable irrigated areas of Indonesia
- Palm oil cluster resilience to enhance indigenous welfare by innovative ability to address land conflicts: Evidence of disaster hierarchy
- Factors determining cassava farmers’ accessibility to loan sources: Evidence from Lampung, Indonesia
- Tailoring business models for small-medium food enterprises in Eastern Africa can drive the commercialization and utilization of vitamin A rich orange-fleshed sweet potato puree
- Revitalizing sub-optimal drylands: Exploring the role of biofertilizers
- Effects of salt stress on growth of Quercus ilex L. seedlings
- Design and fabrication of a fish feed mixing cum pelleting machine for small-medium scale aquaculture industry
- Indicators of swamp buffalo business sustainability using partial least squares structural equation modelling
- Effect of arbuscular mycorrhizal fungi on early growth, root colonization, and chlorophyll content of North Maluku nutmeg cultivars
- How intergenerational farmers negotiate their identity in the era of Agriculture 4.0: A multiple-case study in Indonesia
- Responses of broiler chickens to incremental levels of water deprivation: Growth performance, carcass characteristics, and relative organ weights
- The improvement of horticultural villages sustainability in Central Java Province, Indonesia
- Effect of short-term grazing exclusion on herbage species composition, dry matter productivity, and chemical composition of subtropical grasslands
- Analysis of beef market integration between consumer and producer regions in Indonesia
- Analysing the sustainability of swamp buffalo (Bubalus bubalis carabauesis) farming as a protein source and germplasm
- Toxicity of Calophyllum soulattri, Piper aduncum, Sesamum indicum and their potential mixture for control Spodoptera frugiperda
- Consumption profile of organic fruits and vegetables by a Portuguese consumer’s sample
- Phenotypic characterisation of indigenous chicken in the central zone of Tanzania
- Diversity and structure of bacterial communities in saline and non-saline rice fields in Cilacap Regency, Indonesia
- Isolation and screening of lactic acid bacteria producing anti-Edwardsiella from the gastrointestinal tract of wild catfish (Clarias gariepinus) for probiotic candidates
- Effects of land use and slope position on selected soil physicochemical properties in Tekorsh Sub-Watershed, East Gojjam Zone, Ethiopia
- Design of smart farming communication and web interface using MQTT and Node.js
- Assessment of bread wheat (Triticum aestivum L.) seed quality accessed through different seed sources in northwest Ethiopia
- Estimation of water consumption and productivity for wheat using remote sensing and SEBAL model: A case study from central clay plain Ecosystem in Sudan
- Agronomic performance, seed chemical composition, and bioactive components of selected Indonesian soybean genotypes (Glycine max [L.] Merr.)
- The role of halal requirements, health-environmental factors, and domestic interest in food miles of apple fruit
- Subsidized fertilizer management in the rice production centers of South Sulawesi, Indonesia: Bridging the gap between policy and practice
- Factors affecting consumers’ loyalty and purchase decisions on honey products: An emerging market perspective
- Inclusive rice seed business: Performance and sustainability
- Design guidelines for sustainable utilization of agricultural appropriate technology: Enhancing human factors and user experience
- Effect of integrate water shortage and soil conditioners on water productivity, growth, and yield of Red Globe grapevines grown in sandy soil
- Synergic effect of Arbuscular mycorrhizal fungi and potassium fertilizer improves biomass-related characteristics of cocoa seedlings to enhance their drought resilience and field survival
- Control measure of sweet potato weevil (Cylas formicarius Fab.) (Coleoptera: Curculionidae) in endemic land of entisol type using mulch and entomopathogenic fungus Beauveria bassiana
- In vitro and in silico study for plant growth promotion potential of indigenous Ochrobactrum ciceri and Bacillus australimaris
- Effects of repeated replanting on yield, dry matter, starch, and protein content in different potato (Solanum tuberosum L.) genotypes
- Review Articles
- Nutritional and chemical composition of black velvet tamarind (Dialium guineense Willd) and its influence on animal production: A review
- Black pepper (Piper nigrum Lam) as a natural feed additive and source of beneficial nutrients and phytochemicals in chicken nutrition
- The long-crowing chickens in Indonesia: A review
- A transformative poultry feed system: The impact of insects as an alternative and transformative poultry-based diet in sub-Saharan Africa
- Short Communication
- Profiling of carbonyl compounds in fresh cabbage with chemometric analysis for the development of freshness assessment method
- Special Issue of The 4th International Conference on Food Science and Engineering (ICFSE) 2022 - Part I
- Non-destructive evaluation of soluble solid content in fruits with various skin thicknesses using visible–shortwave near-infrared spectroscopy
- Special Issue on FCEM - International Web Conference on Food Choice & Eating Motivation - Part I
- Traditional agri-food products and sustainability – A fruitful relationship for the development of rural areas in Portugal
- Consumers’ attitudes toward refrigerated ready-to-eat meat and dairy foods
- Breakfast habits and knowledge: Study involving participants from Brazil and Portugal
- Food determinants and motivation factors impact on consumer behavior in Lebanon
- Comparison of three wine routes’ realities in Central Portugal
- Special Issue on Agriculture, Climate Change, Information Technology, Food and Animal (ACIFAS 2020)
- Environmentally friendly bioameliorant to increase soil fertility and rice (Oryza sativa) production
- Enhancing the ability of rice to adapt and grow under saline stress using selected halotolerant rhizobacterial nitrogen fixer