Factors affecting consumers’ loyalty and purchase decisions on honey products: An emerging market perspective
-
Nanang Febrianto


Abstract
The aim of this study is to investigate factors affecting customer behaviours towards purchasing decisions of honey. A questionnaire was used to collect data; the data were analysed with a quantitative research method. Structural Equation Modelling is used to analyse the data, assess the network of structural relationships, and analyse the relationship between each factor in this research using the Partial Least Square method. Based on this relationship, the factors affecting customer purchasing decisions are analysed. The respondents are 400 customers spread all over Indonesia. The result shows that product quality and promotion significantly affect consumer purchasing decisions for honey. Consumers who repeat purchases are loyal consumers of a product. Therefore, to maintain consumer loyalty and to encourage them to continue purchasing honey products, Kembang Joyo Sriwijaya should maintain the quality of its products and carry out promotions as often as possible. The purchase decision can also affect the loyalty of consumers.
1 Introduction
The food industry has a vital role in economic growth in Indonesia. The food industry is a significant contributor to Indonesia’s Gross Domestic Product (GDP) [1]. It encompasses various sectors such as agriculture, food processing, food manufacturing, and food services. According to data from the Indonesian Central Bureau of Statistics in 2023, the food and beverage industry has consistently been among the largest contributors to Indonesia’s GDP [2]. In recent decades, the food industry sector has experienced significant yearly growth due to increasing customer demand [3]. The demand might increase because of customers’ satisfaction while consuming the products. However, the COVID-19 pandemic in the last several years has caused customers to be more concerned about a healthy lifestyle [4,5]. Therefore, customers are more concerned and consider consuming healthy products.
One of the healthy products that are consumed by the public is honey. Honey is a natural product with a sweet taste produced by bees from nectar, flower juice, or liquid derived from living plants [6]. Honey is a nutritious and healthy food, and customers are more aware of the benefits of honey consumption [7]. In addition, in the last 3 years, the demand for honey in Indonesia has increased significantly, reaching 0.5 million litres per year [8]. This condition causes the business climate of the honey industry to be more competitive. The company needs to keep the quality of its products and services for customer satisfaction to maintain customer loyalty to the products [9,10]. One company that produces honey is Kembang Joyo Sriwijaya (KJS). KJS has marketing outlets throughout Indonesia located in 30 provinces. There are different ways of marketing, offline marketing is promoted in shopping centres, while online marketing is promoted on social media platforms. KJS customers consist of various groups and are from various backgrounds.
Honey, being a widely consumed commodity with diverse options available, necessitates a deeper exploration of what drives consumer choices. In emerging markets, where consumer behaviour is rapidly evolving, gaining insights into this topic can guide businesses like KJS in tailoring their strategies to effectively attract and retain customers. Existing studies have explored similar themes, but their applicability to this specific niche has not been comprehensively addressed. Furthermore, the dynamics of emerging markets introduce unique variables and consumer behaviours that require dedicated investigation. With some knowledge from previous research, we need to adapt and extend these findings to the context of honey products in the emerging markets.
The aim of this research is to address the lack of a holistic understanding of the factors driving consumers' loyalty and purchase decisions in the context of honey products within the emerging markets. By conducting a quantitative study focused on KJS outlets in Indonesia, this study provides a comprehensive analysis of this niche market segment. To identify the specific factors that influence consumers' choices, insights that can be valuable not only to KJS but also to businesses operating in similar market environments need to be uncovered. By bridging this gap, research contributes to the fulfilment of the knowledge void in this area, empowering businesses to make data-driven decisions, refine their marketing strategies, and ultimately thrive in emerging markets.
In order to fulfil customer satisfaction, KJS has to know the customer's needs and identify what factors affect customers' decisions to buy KJS honey products. Customers consider several factors while buying a product: price, product quality, and brand image [11,12]. Knowing the factors that determine customer purchases of KJS honey products can maintain customer loyalty and increase sales of KJS honey products. Many studies have shown that the development of Industry 4.0 affected customer behaviour [13,14,15]. In today's consumer landscape, customers increasingly prioritise modernity and seek convenience when accessing services and products [16]. If a company cannot read changes in customer behaviour, customers will quickly switch to consuming other products [17]. Previous studies only described customer behaviour, such as the type of product that can affect customers' preference, the factors are the quality of the product, customer satisfaction, and price of the product [19].
The limitation of the previous research was that it needed to explore new customer changes. Companies need help getting basic information about customer behaviour [19]. Therefore, this study considers using the digitisation factors that influence customers’ behaviour. The study expected results that are not only valid but also basic information so that it can increase the competitive advantage for KJS. This study aimed to investigate factors affecting customer behaviours toward purchasing decisions of honey products.
2 Materials and methods
This study gathered data during two periods, in September 2021 and November 2021, across various KJS outlets throughout Indonesia. The research employed a quantitative approach, utilising a questionnaire survey as the primary data collection method. The survey methodology was chosen to efficiently obtain quantitative insights.
The analysis in this study consists of three main components: an examination of customer buying behaviour regarding honey, an assessment of independent variables, and a demographic profiling of customers. The study's respondents were comprised of 400 customers who had purchased Kembang Joyo honey in Indonesia. These respondents were selected randomly from outlets across Indonesia.
To analyse the gathered data, Structural Equation Modelling (SEM) was employed to evaluate the intricate network of structural relationships. As noted by Basco et al. [18], the Partial Least Square (PLS) method was suitable for measuring the relationships among factors influencing customer purchase decisions. Within the framework of latent variables, multiple factors exert influence, as illustrated in Table 1. Furthermore, the SEM model for this study is visually presented in Figure 1.
Factors affecting customer purchasing decision
| Variables | Factors | Notation |
|---|---|---|
| Product quality (X1) | Packaging | X1.1 |
| Product performance | X1.2 | |
| Product features | X1.3 | |
| Reliabilities | X1.4 | |
| Promotion (X2) | Sales promotion | X2.1 |
| Product image | X2.2 | |
| Convenience information | X2.3 | |
| Location (X3) | Strategic outlet location | X3.1 |
| Access location | X3.2 | |
| Environment (X4) | Culture | X4.1 |
| Social groups | X4.2 | |
| Social class | X4.3 | |
| Purchasing decisions (Y1) | Alternative evaluation | Y1.1 |
| Purchase decision | Y1.2 | |
| Repeat purchasing | Y1.3 | |
| Customer loyalty (Y2) | Regular repeat purchase | Y2.1 |
| Recommend | Y2.2 | |
| Willingness to pay more | Y2.3 |
Source: Authors’ estimate based on field survey 2021.
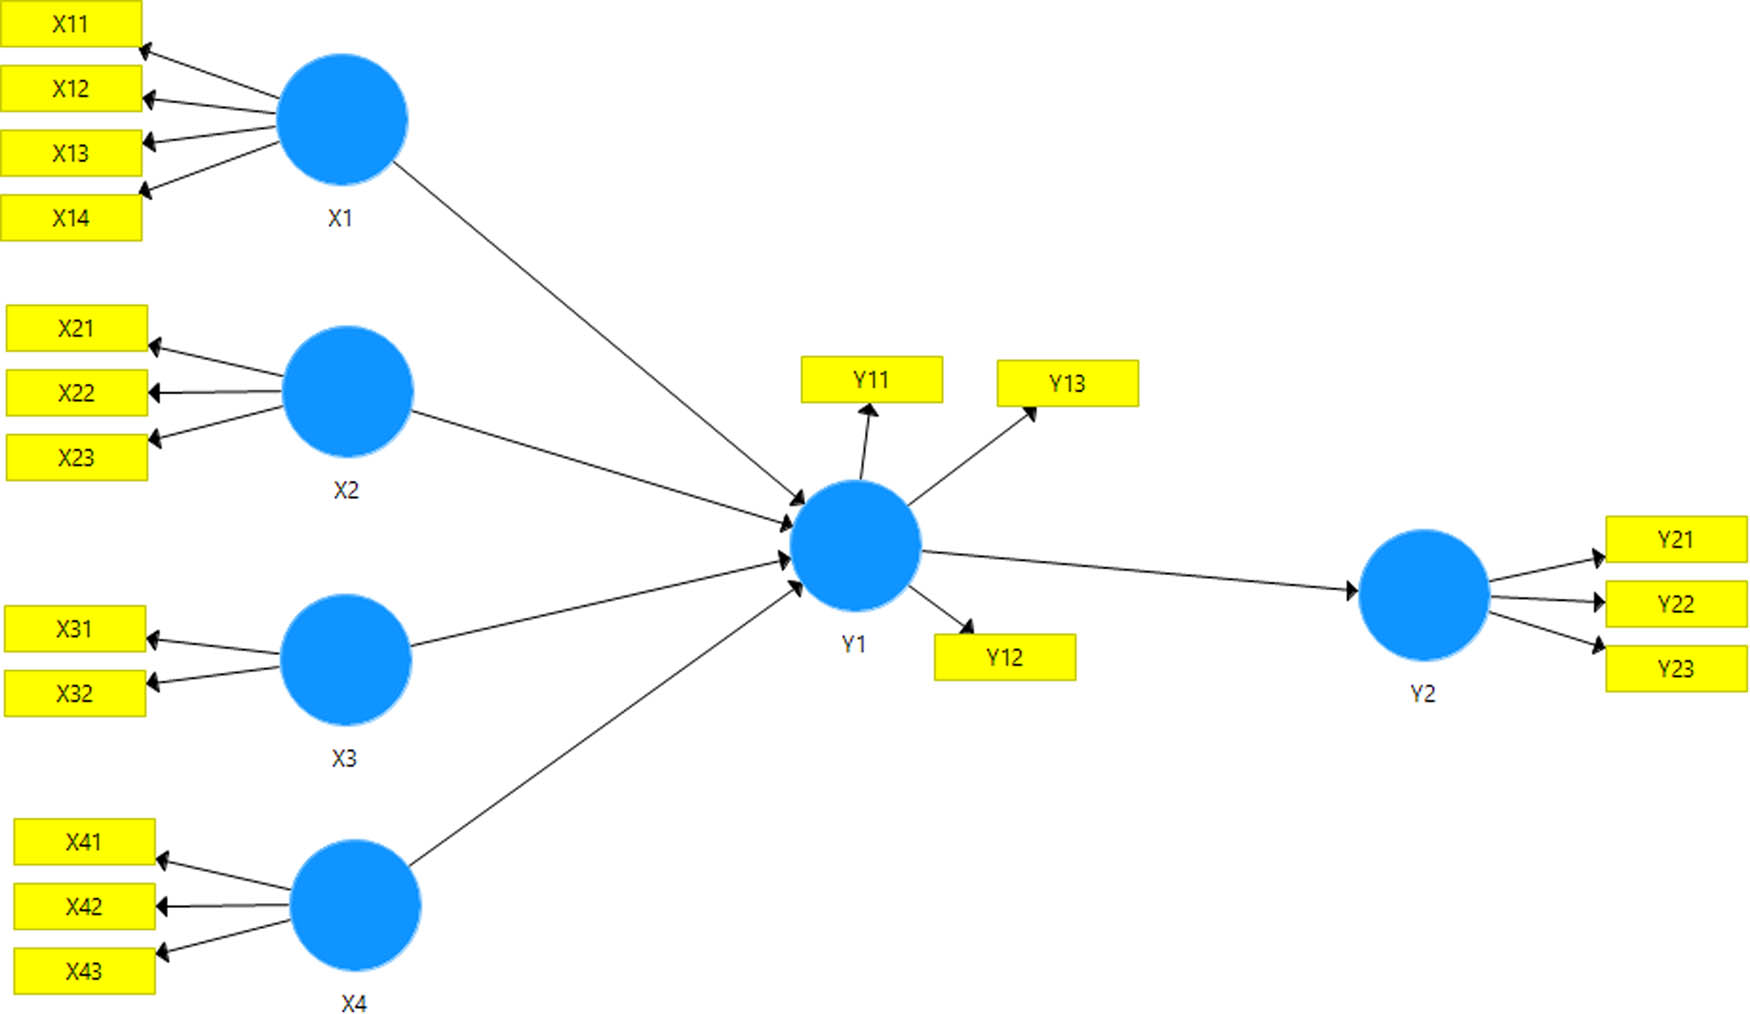
Research model.
The study provides a framework for KJS owners to understand the specific types of customer needs through information or how the customers would respond to the information from the company. This study proposes the following five hypotheses:
H1. The perceived product quality of honey directly affects purchase decisions positively and significantly.
H2. Perceived promotion of honey directly affects purchase decisions positively and significantly.
H3. The perceived location directly affects the purchase decisions positively and significantly.
H4. The perceived environment directly affects the purchase decisions significantly.
H5. The perceived purchasing decisions directly affect customer loyalty positively and significantly.
-
Informed consent: Informed consent has been received from all individuals included in this study.
-
Ethical approval: The conducted research is not related to either human or animal use.
3 Results and discussion
Livestock product, especially honey, is very potential for distribution in Indonesia. The demand in the market is increasing year by year from 2016 to 2020. The increasing demand depends on customers' awareness of the benefit of honey. The demand for honey for 5 years is shown in Figure 2.

The demand for Honey in Indonesia.
According to the data on honey demand published by the Ministry of Agriculture in 2021 [8], the highest demand was in 2017, and the lowest was in 2016. It shows that the fluctuation happens in the demand for honey. The demand for honey in 2017 could cover the demand in 2018; it becomes the average demand from 2019 to 2020. Indonesia is a very potential market for honey, the honey market has good demand [19]; so the honey producer could consider producing more honey to fulfil the demand for honey (Table 2).
Customer demographic
| Attributes | Distribution | Frequency (%) |
|---|---|---|
| Gender | Male | 49 |
| Female | 51 | |
| Age (years) | Under 20 | 8 |
| 21–30 | 46 | |
| 31–40 | 26 | |
| 41–50 | 16 | |
| Above 50 | 4 | |
| Education level | School | 15 |
| High School | 50 | |
| Bachelor/Master's Degree | 35 | |
| Purchasing frequency | 1–2 | 66 |
| 3–4 | 33 | |
| Above 4 | 1 |
Source: Authors’ estimate based on field survey 2021.
The company has many varieties of products – the product of perseroan terbatas. KJS supplies pure honey with sources of nectar from many places. Some of the products are shown in Figure 3.
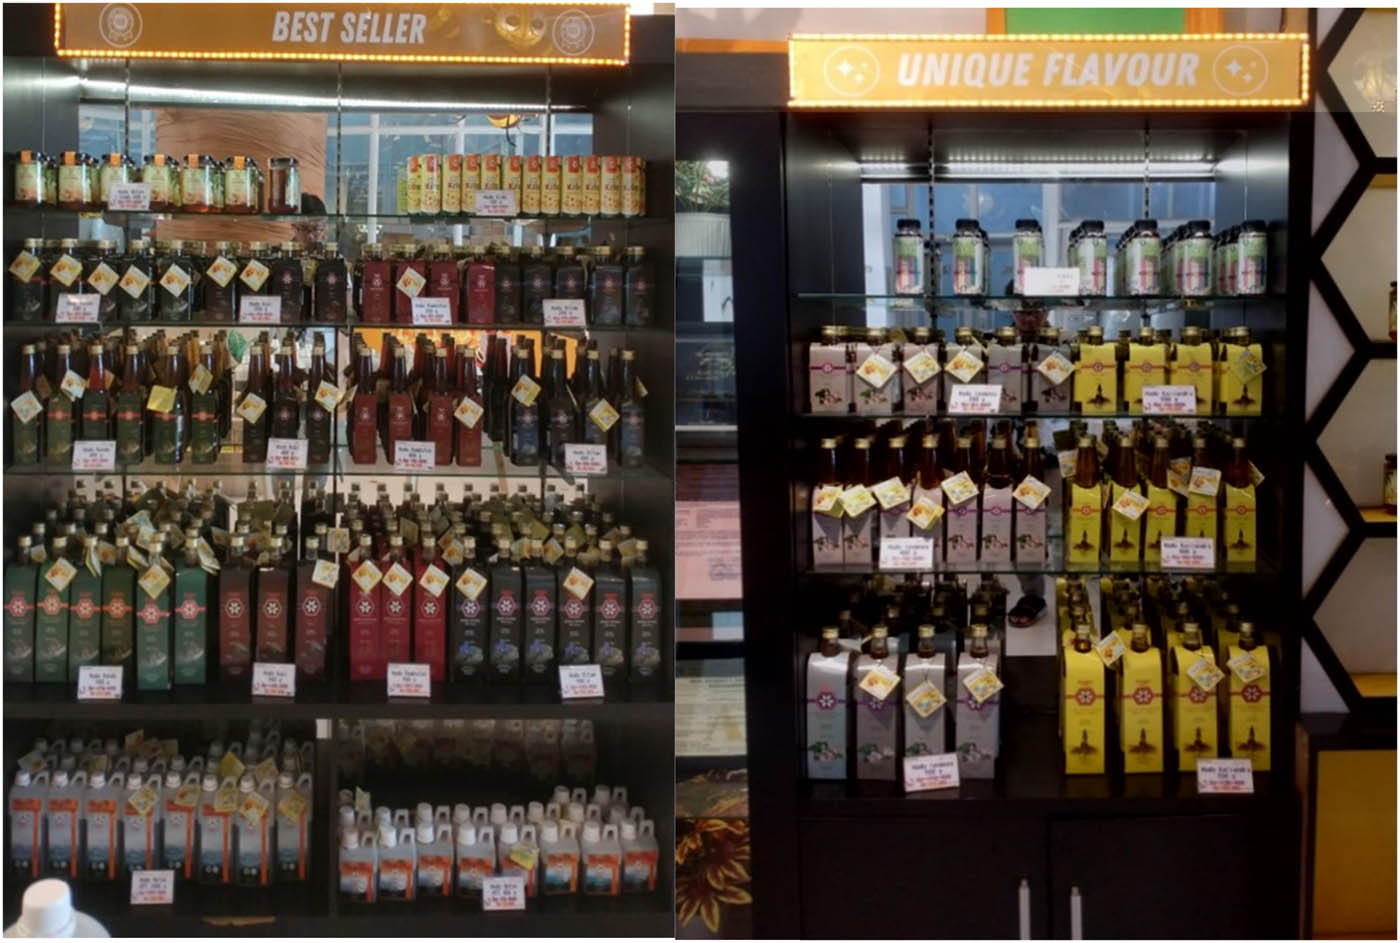
Kembang Joyo’s products.
The data analysis and discussion of research findings begin with a brief description of the respondent's demographic characteristics, including their age, gender, education level, and consumption frequency in the preceding 2 months. 49% of the total 400 respondents were male, while 51% were female. Almost 46% of the respondents were between the ages of 21 and 30. In addition, 16% of the respondents held a bachelor's degree, 50% held a high school diploma, and 15% held a school certificate. Regarding the frequency of honey purchases, 66% of respondents consume 1–2 times per month, while 33% purchase honey. 66% of respondents consume 3–4 times in 2 months, and one respondent purchases more than 4 times.
3.1 Analysis of reflective measurement models
Analysis using SEM with PLS approach used SmartPLS software to determine purchase decisions using the factors that influence the consumer. The PLS approach is a tool to model the relationship between latent variables. In this investigation, the latent variables encompass consumer loyalty and purchase decisions. The study results were obtained through two evaluation stages of the variables used. The evaluation consists of the measurement model (the model of the outer) and the structural model (the model of the inner). The outer model is first carried out at the stage by evaluating convergent validity, including the validity value (loading factor and average variance extracted; AVE value) and reliability (composite reliability). The results of the outer model are described in Figures 4 and 5.

Earlier outer model.

Diagram construction modification.
The validity level of the latent variable was tested and determined using the validity of convergent. The value of the AVE construct can be seen in SmartPLS output. These values must be above 0.50. AVE, composite reliability, and Cronbach’s Alpha result values are shown in Table 3. Table 3 describes that all latent constructs have an AVE result value greater than 0.50, and then all latent variables have a high level of validity.
Validity and reliability of latent constructs
| Variable | AVE | Cronbach’s Alpha | Composite reliability |
|---|---|---|---|
| Product quality (X1) | 0.988 | 0.94 | 0.92 |
| Promotion (X2) | 0.999 | 0.98 | 0.99 |
| Location (X3) | 1 | 1 | 1 |
| Environment (X4) | 0.912 | 0.92 | 0.953 |
| Purchasing decisions (Y1) | 0.885 | 0.935 | 0.958 |
| Customer loyalty (Y2) | 1 | 1 | 1 |
Source: Authors’ estimate based on field survey 2021.
Furthermore, the measurement of the reliability value is carried out when the variables are valid. The value of composite reliability was used to determine reliability. The model of SEM model was reliable if the values were more than 0.70. The analysis of the results shows that the value of composite reliability and Cronbach’s alpha for the latent variables is up to 0.70. This means that the SEM model has good reliability. Table 3 shows that all constructs have a value of more than 0.70, which shows that all constructs have an excellent reliability value.
3.2 Analysis of reflective measurement models
The R 2 value, the predictive relevance of the path coefficient, and the Q2 value were applied to assess the structural model's overall explanatory power of constructs. Figure 5 depicts the structural model's findings. R Square Adjusted value measures the level of variation in changes in the independent variable using the dependent variable. To adjust the value, a higher R Square is needed; a higher prediction model of the proposed research model is appropriate.
These results indicate that the proposed model has 90% explanatory power for purchasing decisions with R 2 = 0.907. Moreover, it is found that the relationship between purchasing decisions and loyalty is positive and significant. As shown in Table 4, the R 2 value of our structural model is 0.90, indicating that the conceptual model proposed has sufficient explanatory significance. Here caution is required because relying solely on the R 2 value to support a model is not an appropriate strategy.
R square
| R square | R square adjusted | |
|---|---|---|
| Y1 | 0.907 | 0.903 |
| Y2 | 0.900 | 0.899 |
Source: Authors’ estimate based on field survey 2021.
The results of hypothesis testing are presented in Figure 5, which indicates the level of significant value in the hypothesis using the path coefficient value. T-statistics should be above the t-table value and could be used to indicate the path coefficient score. The significance level used is about 5% (1.96). Comparing t-statistics with t-table was used to generate hypothesis testing. If the value of t-statistics > t-table (1.96), then the hypothesis accepts the formulation. The hypothesis rejects the formulation if the value of t-statistics < t-table (1.96). The path coefficient output results are shown in Figure 5.
The direct influence of product quality variables on honey purchasing decisions according to t-statistic point 3.197 means that there is a direct and significant influence of product quality variables on purchasing decisions. This is because every consumer who buys a product will consider the quality of the product to be consumed. Quality products have an essential role in shaping customer satisfaction. The higher the quality of the product, the higher the customer's satisfaction, so the consumer will repurchase the product (Table 5).
Hypothesis assessment
| Hypothesised path | T statistic | Decision |
|---|---|---|
| Product quality → purchasing decisions | 3.197 | Supported |
| Promotion → purchasing decisions | 2.638 | Supported |
| Location → purchasing decisions | 1.456 | Unsupported |
| Environment → purchasing decisions | 1.678 | Unsupported |
| Purchasing decisions → customer loyalty | 4.582 | Supported |
Source: Authors’ estimate based on field survey 2021.
Promotion variables have a significant influence on honey purchasing decisions. The value of the t statistic is 2.638, which indicates the influence of promotion variables on honey purchasing decisions by consumers. Promotional variables affect purchasing decisions because several forms of promotions are carried out, such as product discounts and additional free products, that make consumers interested in buying honey products. Meanwhile, location and environment variables do not influence purchasing decisions because t-statistic values for location and environment are 1.456 and 1.678, respectively. Both variables have a t-statistic value <1.96, so hypothesis 1 is rejected. Then, the purchase decision variable affects consumer loyalty. The t-statistic value is 4.582. Consumers who make repeated purchases are loyal consumers of a product. Therefore, to maintain consumer loyalty and to continue to make purchasing decisions for this honey product, KJS should maintain the quality of its products and carry out promotions as often as possible.
Furthermore, customers’ level of concern or choice is affected significantly by household income [20]. The higher income customers want a better choice because they want a higher price and a product that is better in quality than others. The product of PT KJS that has better quality, for example, is a premium honey product. It has a higher price than a regular honey product.
4 Conclusion
The recent study has several implications for KJS as policymakers and practitioners. The findings of this study will be helpful for policymakers and practitioners in gaining a deeper understanding of customer purchasing decisions and customer loyalty. It provides valuable insights that can inform decision-making, drive marketing strategies, enhance customer loyalty, foster innovation, and ultimately contribute to the long-term success and competitiveness of KJS in the market. Product quality and promotion significantly affect consumer purchasing decisions for honey. In addition, the purchase decision can also affect the loyalty of consumers. Future research can consider more variables in purchasing decisions and strategies to improve satisfaction and customer loyalty.
Acknowledgments
The authors would like to thank the University of Brawijaya for providing the research funding and the reviewers for their constructive feedback that helped improve this article’s quality.
-
Funding information: This research has received research funding from Brawijaya University through a program of research grant in 2021 for professors.
-
Author contributions: B.H. was involved in planning and supervising the work. N.F., D.M., and P.A. processed the experimental data, performed the analysis, designed the figures, and performed the calculations in this study. M.H. drafted the manuscript and aided in interpreting the results. All authors discussed the results and commented on the manuscript.
-
Conflict of interest: The authors state no conflict of interest.
-
Data availability statement: The datasets generated during and/or analysed during the current study are available from the corresponding author on reasonable request.
References
[1] Gareta SP Food and beverage highest contributor to industry growth. ANTARA; 2021. https://en.antaranews.com/news/182866/food-and-beverage-highest-contributor-to-industry-growth.Search in Google Scholar
[2] Badan Pusat Statistik. Data series subyek Produk Domestic Bruto/ Gross Domestik Bruto (GDP); 2023. https://www.bps.go.id/indicator/11/65/1/-seri-2010-pdb-seri-2010.html.Search in Google Scholar
[3] Sikone HY, Hartono B, Utami HD, Nugroho BA. Value-added analysis of the meat agroindustry in Indonesia. Online J Anim Feed Res. 2022;12(5):266–71. 10.51227/ojafr.2022.36.Search in Google Scholar
[4] Aydin E, Ayvazoglu Demir P. The effect of the pandemic on the consumption of animal products: the case of Kafkas University of Turkey. Online J Anim Feed Res. 2022;12(1):37–45. 10.51227/ojafr.2022.6.Search in Google Scholar
[5] Ben Khadda Z, Ezrari S, Radouane N, Boutagayout A, El Housni Z, Lahmamsi H, et al. Organic food consumption and eating habit in Morocco, Algeria, and Tunisia during the COVID-19 pandemic lockdown. Open Agric. 2022;7(1):21–9. 10.1515/opag-2022-0064.Search in Google Scholar
[6] Karuniawan A, Maulana H, Anindita PA, Yoel A, Ustari D, Suganda T, et al. Storage root yield and sweetness level selection for new honey sweet potato (Ipomoea batatas [L.] Lam). Open Agric. 2021;6(1):329–45. 10.1515/opag-2021-0219.Search in Google Scholar
[7] Mahamed A, Abdimahad K, Abdilahi A, Hassen G, Hassen M, Omer A. Traditional management practices and production potential of beekeeping in Erer zone of Somali regional state, Ethiopia. Online J Anim Feed Res. 2022;12(3):165–75. 10.51227/ojafr.2022.22.Search in Google Scholar
[8] Ministry of Agriculture. Livestocks and animal health statistics; 2022. p. 1–276. https://satudata.pertanian.go.id/assets/docs/publikasi/Statistik_Peternakan_dan_Kesehatan_Hewan_2022_compressed.pdf.Search in Google Scholar
[9] Moser AK. Consumers’ purchasing decisions regarding environmentally-friendly products: An empirical analysis of German consumers. J Retail Consum Serv. 2016;31:389–97. 10.1016/j.jretconser.2016.05.006.Search in Google Scholar
[10] Wu T, Zhang R, Liu X, Liu F, Ding Y. A social commerce purchasing decision model with trust network and item review information. Knowl Syst. 2022;235:107628. 10.1016/j.knosys.2021.107628.Search in Google Scholar
[11] Farooq MS, Salam M, Fayolle A, Jaafar N, Ayupp K. Impact of service quality on customer satisfaction in Malaysia airlines: A PLS-SEM approach. J Air Transp Manag. 2018;67:169–80. 10.1016/j.jairtraman.2017.12.008.Search in Google Scholar
[12] Malusi N, Falowo AB, Hosu YS, Idamokoro EM. Prevalent constraints towards production and commercialization of cattle owned by smallholder farmers in south Africa – A review. Adv Anim Vet Sci. 2022;10(3):659–75. 10.17582/journal.aavs/2022/10.3.659.675.Search in Google Scholar
[13] Lezoche M, Hernandez JE, Alemany Díaz MdME, Panetto H, Kacprzyk J. Agri-food 4.0: A survey of the supply chains and technologies for the future agriculture. Comput Ind. 2020;117:103187. 10.1016/j.compind.2020.103187.Search in Google Scholar
[14] Latino ME, Menegoli M, Lazoi M, Corallo A. Voluntary traceability in food supply chain: A framework leading its implementation in Agriculture 4.0. Technol Forecast Soc Change. 2022;178:121564. 10.1016/j.techfore.2022.121564.Search in Google Scholar
[15] Liu Y, Ma X, Shu L, Hancke GP, Abu-Mahfouz AM. From Industry 4.0 to Agriculture 4.0: Current status, enabling technologies, and research challenges. IEEE Trans Ind Inform. 2021;17(6):4322–34. 10.1109/tii.2020.3003910.Search in Google Scholar
[16] Yeo SF, Tan CL, Kumar A, Tan KH, Wong JK. Investigating the impact of AI-powered technologies on Instagrammers’ purchase decisions in digitalization era–A study of the fashion and apparel industry. Technol Forecast Soc Change. 2022;177:121551. 10.1016/j.techfore.2022.121551.Search in Google Scholar
[17] Subramanian N, Gunasekaran A, Yu J, Cheng J, Ning K. Customer satisfaction and competitiveness in the Chinese E-retailing: Structural equation modeling (SEM) approach to identify the role of quality factors. Expert Syst Appl. 2014;41(1):69–80. 10.1016/j.eswa.2013.07.012.Search in Google Scholar
[18] Basco R, Hair JF, Ringle CM, Sarstedt M. Advancing family business research through modeling nonlinear relationships: Comparing PLS-SEM and multiple regression. J Fam Bus Strategy. 2022;13(3):100457. 10.1016/j.jfbs.2021.100457.Search in Google Scholar
[19] Suherman N, Kadarsih S. Strategi pemasaran madu berdasarkan karakteristik konsumen di kota bengkulu. [Honey marketing strategy based on consumer characteristics in Bengkulu city]. ejournalunibacid. 2017;12(2):171–83. 10.31186/jspi.id.12.2.171-183.Search in Google Scholar
[20] Osmani M, Andoni M, Kambo A. Consumers’ concern on food safety for domestic fresh tomato and its socio-economic factors in Albania - a multinomial regression approach. Bulgarian. J Agric Sci. 2021;27(1):3–11. https://www.agrojournal.org/27/01-01.pdf.Search in Google Scholar
© 2023 the author(s), published by De Gruyter
This work is licensed under the Creative Commons Attribution 4.0 International License.
Articles in the same Issue
- Regular Articles
- The impact of COVID-19 pandemic on business risks and potato commercial model
- Effects of potato (Solanum tuberosum L.)–Mucuna pruriens intercropping pattern on the agronomic performances of potato and the soil physicochemical properties of the western highlands of Cameroon
- Machine learning-based prediction of total phenolic and flavonoid in horticultural products
- Revamping agricultural sector and its implications on output and employment generation: Evidence from Nigeria
- Does product certification matter? A review of mechanism to influence customer loyalty in the poultry feed industry
- Farmer regeneration and knowledge co-creation in the sustainability of coconut agribusiness in Gorontalo, Indonesia
- Lablab purpureus: Analysis of landraces cultivation and distribution, farming systems, and some climatic trends in production areas in Tanzania
- The effects of carrot (Daucus carota L.) waste juice on the performances of native chicken in North Sulawesi, Indonesia
- Properties of potassium dihydrogen phosphate and its effects on plants and soil
- Factors influencing the role and performance of independent agricultural extension workers in supporting agricultural extension
- The fate of probiotic species applied in intensive grow-out ponds in rearing water and intestinal tracts of white shrimp, Litopenaeus vannamei
- Yield stability and agronomic performances of provitamin A maize (Zea mays L.) genotypes in South-East of DR Congo
- Diallel analysis of length and shape of rice using Hayman and Griffing method
- Physicochemical and microbiological characteristics of various stem bark extracts of Hopea beccariana Burck potential as natural preservatives of coconut sap
- Correlation between descriptive and group type traits in the system of cow’s linear classification of Ukrainian Brown dairy breed
- Meta-analysis of the influence of the substitution of maize with cassava on performance indices of broiler chickens
- Bacteriocin-like inhibitory substance (BLIS) produced by Enterococcus faecium MA115 and its potential use as a seafood biopreservative
- Meta-analysis of the benefits of dietary Saccharomyces cerevisiae intervention on milk yield and component characteristics in lactating small ruminants
- Growth promotion potential of Bacillus spp. isolates on two tomato (Solanum lycopersicum L.) varieties in the West region of Cameroon
- Prioritizing IoT adoption strategies in millennial farming: An analytical network process approach
- Soil fertility and pomelo yield influenced by soil conservation practices
- Soil macrofauna under laying hens’ grazed fields in two different agroecosystems in Portugal
- Factors affecting household carbohydrate food consumption in Central Java: Before and during the COVID-19 pandemic
- Properties of paper coated with Prunus serotina (Ehrh.) extract formulation
- Fertiliser cost prediction in European Union farms: Machine-learning approaches through artificial neural networks
- Molecular and phenotypic markers for pyramiding multiple traits in rice
- Natural product nanofibers derived from Trichoderma hamatum K01 to control citrus anthracnose caused by Colletotrichum gloeosporioides
- Role of actors in promoting sustainable peatland management in Kubu Raya Regency, West Kalimantan, Indonesia
- Small-scale coffee farmers’ perception of climate-adapted attributes in participatory coffee breeding: A case study of Gayo Highland, Aceh, Indonesia
- Optimization of extraction using surface response methodology and quantification of cannabinoids in female inflorescences of marijuana (Cannabis sativa L.) at three altitudinal floors of Peru
- Production factors, technical, and economic efficiency of soybean (Glycine max L. Merr.) farming in Indonesia
- Economic performance of smallholder soya bean production in Kwara State, Nigeria
- Indonesian rice farmers’ perceptions of different sources of information and their effect on farmer capability
- Feed preference, body condition scoring, and growth performance of Dohne Merino ram fed varying levels of fossil shell flour
- Assessing the determinant factors of risk strategy adoption to mitigate various risks: An experience from smallholder rubber farmers in West Kalimantan Province, Indonesia
- Analysis of trade potential and factors influencing chili export in Indonesia
- Grade-C kenaf fiber (poor quality) as an alternative material for textile crafts
- Technical efficiency changes of rice farming in the favorable irrigated areas of Indonesia
- Palm oil cluster resilience to enhance indigenous welfare by innovative ability to address land conflicts: Evidence of disaster hierarchy
- Factors determining cassava farmers’ accessibility to loan sources: Evidence from Lampung, Indonesia
- Tailoring business models for small-medium food enterprises in Eastern Africa can drive the commercialization and utilization of vitamin A rich orange-fleshed sweet potato puree
- Revitalizing sub-optimal drylands: Exploring the role of biofertilizers
- Effects of salt stress on growth of Quercus ilex L. seedlings
- Design and fabrication of a fish feed mixing cum pelleting machine for small-medium scale aquaculture industry
- Indicators of swamp buffalo business sustainability using partial least squares structural equation modelling
- Effect of arbuscular mycorrhizal fungi on early growth, root colonization, and chlorophyll content of North Maluku nutmeg cultivars
- How intergenerational farmers negotiate their identity in the era of Agriculture 4.0: A multiple-case study in Indonesia
- Responses of broiler chickens to incremental levels of water deprivation: Growth performance, carcass characteristics, and relative organ weights
- The improvement of horticultural villages sustainability in Central Java Province, Indonesia
- Effect of short-term grazing exclusion on herbage species composition, dry matter productivity, and chemical composition of subtropical grasslands
- Analysis of beef market integration between consumer and producer regions in Indonesia
- Analysing the sustainability of swamp buffalo (Bubalus bubalis carabauesis) farming as a protein source and germplasm
- Toxicity of Calophyllum soulattri, Piper aduncum, Sesamum indicum and their potential mixture for control Spodoptera frugiperda
- Consumption profile of organic fruits and vegetables by a Portuguese consumer’s sample
- Phenotypic characterisation of indigenous chicken in the central zone of Tanzania
- Diversity and structure of bacterial communities in saline and non-saline rice fields in Cilacap Regency, Indonesia
- Isolation and screening of lactic acid bacteria producing anti-Edwardsiella from the gastrointestinal tract of wild catfish (Clarias gariepinus) for probiotic candidates
- Effects of land use and slope position on selected soil physicochemical properties in Tekorsh Sub-Watershed, East Gojjam Zone, Ethiopia
- Design of smart farming communication and web interface using MQTT and Node.js
- Assessment of bread wheat (Triticum aestivum L.) seed quality accessed through different seed sources in northwest Ethiopia
- Estimation of water consumption and productivity for wheat using remote sensing and SEBAL model: A case study from central clay plain Ecosystem in Sudan
- Agronomic performance, seed chemical composition, and bioactive components of selected Indonesian soybean genotypes (Glycine max [L.] Merr.)
- The role of halal requirements, health-environmental factors, and domestic interest in food miles of apple fruit
- Subsidized fertilizer management in the rice production centers of South Sulawesi, Indonesia: Bridging the gap between policy and practice
- Factors affecting consumers’ loyalty and purchase decisions on honey products: An emerging market perspective
- Inclusive rice seed business: Performance and sustainability
- Design guidelines for sustainable utilization of agricultural appropriate technology: Enhancing human factors and user experience
- Effect of integrate water shortage and soil conditioners on water productivity, growth, and yield of Red Globe grapevines grown in sandy soil
- Synergic effect of Arbuscular mycorrhizal fungi and potassium fertilizer improves biomass-related characteristics of cocoa seedlings to enhance their drought resilience and field survival
- Control measure of sweet potato weevil (Cylas formicarius Fab.) (Coleoptera: Curculionidae) in endemic land of entisol type using mulch and entomopathogenic fungus Beauveria bassiana
- In vitro and in silico study for plant growth promotion potential of indigenous Ochrobactrum ciceri and Bacillus australimaris
- Effects of repeated replanting on yield, dry matter, starch, and protein content in different potato (Solanum tuberosum L.) genotypes
- Review Articles
- Nutritional and chemical composition of black velvet tamarind (Dialium guineense Willd) and its influence on animal production: A review
- Black pepper (Piper nigrum Lam) as a natural feed additive and source of beneficial nutrients and phytochemicals in chicken nutrition
- The long-crowing chickens in Indonesia: A review
- A transformative poultry feed system: The impact of insects as an alternative and transformative poultry-based diet in sub-Saharan Africa
- Short Communication
- Profiling of carbonyl compounds in fresh cabbage with chemometric analysis for the development of freshness assessment method
- Special Issue of The 4th International Conference on Food Science and Engineering (ICFSE) 2022 - Part I
- Non-destructive evaluation of soluble solid content in fruits with various skin thicknesses using visible–shortwave near-infrared spectroscopy
- Special Issue on FCEM - International Web Conference on Food Choice & Eating Motivation - Part I
- Traditional agri-food products and sustainability – A fruitful relationship for the development of rural areas in Portugal
- Consumers’ attitudes toward refrigerated ready-to-eat meat and dairy foods
- Breakfast habits and knowledge: Study involving participants from Brazil and Portugal
- Food determinants and motivation factors impact on consumer behavior in Lebanon
- Comparison of three wine routes’ realities in Central Portugal
- Special Issue on Agriculture, Climate Change, Information Technology, Food and Animal (ACIFAS 2020)
- Environmentally friendly bioameliorant to increase soil fertility and rice (Oryza sativa) production
- Enhancing the ability of rice to adapt and grow under saline stress using selected halotolerant rhizobacterial nitrogen fixer