Dynamic response characteristics of 93W alloy with a spherical structure
-
Taiyong Zhao
 ,
Zhigang Chen
,
Zhigang Chen

Abstract
To study the dynamic response characteristics of 93W alloy spherical component under high overload, the deformation patterns of the 93W spherical component under different overloads are obtained by the sphereistic impact test, and the microscopic response characteristics are studied by the metallographic analysis experiments. Finally, the response characteristics are analyzed by the finite element method and the stress wave theory. The results show that with the change of impact overload, the axial direction of the 93W spherical component changes linearly with the radial deformation, and the axial strain increases with the increase of the impact overload. At the same time, along the radial direction from the center of the sphere, the micrograin distribution of 93W appears densely packed and sparsely separated, and the grain density is uniformly changed between dense area and sparse area, showing a ring-shaped “bright band” phenomenon between light and dark, and the width of the “bright band” is related to the size of the dense area of the grain; with the increase of the impact overload, the 93W alloy component first breaks at the central axis and the radial maximum position, and the fracture mode changes from the crystal fracture to the transgranular fracture tendency, and the two fracture forms eventually coexist.
1 Introduction
Tungsten alloys are widely used in the defense weapons industry because of their high density, high melting point, high strength, and good machinability. Among them, the 93W alloy tungsten sphere is widely used as a typical killing warhead damage element because of its excellent characteristics of tungsten alloy, small spherical structure drag coefficient, and big specific energy and power. For decades, various researchers have carried out a large number of experimental research studies and theoretical accumulations on 93W alloy tungsten sphere high-speed impact armor steel, successively calculated the ultimate penetration velocity of tungsten sphere [1,2,3], studied the deformation characteristics [4,5,6], and analyzed the target crater characteristics in the process of 93W alloy tungsten sphere high-speed impacting thin target and medium-thick target [7,8]. They also carried out experimental studies [9,10,11,12] and numerical calculation of the sphere breaking speed threshold and fragment fractal characteristics of the tungsten alloy spherical projectile during the impact of the target plate [12,13,14,15]. At the same time, researchers rely on the Hopkinson pressure bar experiment to study the mechanical properties [16,17,18,19,20,21], fracture mechanism [22,23,24,25,26,27], and strengthening characteristics of a rod-shaped 93W alloy component with different grain sizes [28], group distribution ratios, and process technology [29,30,31]. A variety of constitutive models [32,33,34] for related deformation and fracture failure are given. The experiments and numerical simulation were conducted to investigate the impact of spherical components such as metal and brittle materials on single-layer and multilayer target plates [35,36,37]. Results showed that the fracture characteristics, deformation degree, and posttarget distribution of spherical components are closely related to the impact overload applied on the components.
The aforementioned research studies are mainly based on the engineering application study of mechanical properties of 93W alloy and the mechanical properties and constitutive model research of 93W alloy based on the Hopkinson pressure bar test. However, the response mechanism of 93W alloy with a spherical structure under high overload is less studied. It is relatively rare in the current published academic achievements. Therefore, it is of practical significance to study the dynamic response characteristics of 93W alloy with the spherical structure under high overload.
On the basis of mechanical properties of 93W alloy and the typical structural characteristics of the sphere, this article uses a 12.7 mm sphereistic gun to test the impact armor steel of ∅7.51 mm spherical 93W alloy component and obtains the deformation patterns of 93W alloy component under different overload conditions. Subsequently, it studies the deformation and the fracture law of the microstructure of 93W component by metallographic analysis and combines the finite element method to numerically calculate the impact process, which better demonstrated the stress, strain change, and macroscopic deformation process of a tungsten sphere. Finally, the theoretical analysis of macroscopic and microscopic experimental phenomena is carried out based on the stress wave theory. Through the aforementioned research, the dynamic response characteristics of the 93W alloy under the spherical member during the impact process are well described.
2 Experimental plan
2.1 Experimental research
The experiment is carried out in the National Defense Key Discipline Laboratory of Underground Target Damage Technology of North University of China. A 12.7 mm caliber sphereistic gun is used to launch a ∅7.51 mm spherical 93W alloy component to vertically impact the 603 armored steel with a thickness of 6.7 mm. The 93W alloy has a density of 17.8 g/cm3 and a weight of 3.95 (+0.05) g. It is sintered by the powder metallurgy method from W, Ni, and Fe composite powders. The powder injection molding method is used to prepare a tungsten alloy ball for military industry, and its injection defects are eliminated by adjusting the injection parameters. The comprehensive performance is mainly improved by adjusting the appropriate injection rate, injection pressure, and injection temperature process. Tungsten powder, nickel powder, and iron powder are mixed according to a certain mass ratio. Then, 93W NiFe and a certain proportion of a binder are mixed well in a XSM 1/20–80 type rubber mixer, and the mixed materials in a single extrusion granulation are transferred to a screw extruder. After drying in BOY50T2 injection molding on an injection molding machine, the shaped blank is degreased in homemade hydrogen. The product is degreased in a furnace and finally sintered in a hydrogen furnace. After the test, the tungsten sphere residue is recovered, and a metallographic analysis experiment is performed on the axial profile. Figure 1 shows the experimental equipment. Figure 2 shows the spherical 93W alloy component patterns and the 603 armored steel entity.

Experimental equipment: (a) 12.7 mm sphereistic gun, (b) JMC-K500 speed target, and (c) target frame.

Experimental spherical 93W alloy component and 603 armored steel: (a) ∅7.51 mm 93W alloy tungsten sphere and (b) 6.7 mm thick 603 armored steel.
The impact velocity of the 93W alloy tungsten sphere is controlled from 401 to 1,511 m/s by adjusting the emission charge to study the dynamic response law of the 93W alloy component with the spherical structure under different overloads. The macroscopic and microscopic test phenomena of deformation and fracture of 93W alloy are observed and analyzed by adjusting the metallographic microscope objective lens at 0.8 times and 200 times.
2.2 Finite element research
To deeply study the dynamic response characteristics of 93W alloy tungsten sphere in the process of impacting 603 armored steel, based on the results of 2.1, the ANSYS/AUTODYN software is used to simulate the process of tungsten sphere impacting armor steel. A 1/4 axisymmetric 3D penetration model is established based on the vertical penetration environment of the component. The calculation grid uses Solid164 eight-node hexahedron units. The 93W component mesh size is 0.1 × 0.1 mm, the target grid size is 0.15 × 0.15 mm, and the whole model has 8,48,162 units. The Lagrange algorithm is used for the analysis of components and targets, and the face-to-face algorithm is used for the analysis of the contact between them.
In the impact process, the short action time, the high strain rate, and the plastic rheology of the metal material at high temperature and high pressure are considered. Both the 93W alloy and the armored steel adopt the JOHNSON-COOK thermal viscoplastic constitutive model and the GRUNEISEN state equation. The JOHNSON-COOK thermal viscoplastic constitutive model can better describe the strain hardening, strain rate strengthening, and coupling effect of a tungsten sphere and a target material during penetration. The plastic flow stress expression is given as follows:
where
Material performance parameters
| Material | ρ/cm cm−3 | G 0/GPa | μ | T 0/K | T m/K | c/J × (kg K−1) | A/MPa | B/MPa | n | C | m |
|---|---|---|---|---|---|---|---|---|---|---|---|
| 93W | 17.8 | 137 | 0.3 | 293 | 1,723 | 134 | 1,506 | 177 | 0.12 | 0.015 | 1.00 |
| 603 steel | 7.8 | 75 | 0.33 | 293 | 1,793 | 477 | 1,120 | 500 | 0.26 | 0.014 | 1.03 |
3 Results and analysis
A total of 14 ∅7.51 mm spherical 93W alloy component impacting steel target tests are carried out, and the 93W component and the plugging pattern are recovered as shown in Figure 3. Figure 4 shows a schematic diagram of the axial section structure of the recovered spherical 93W component. The test data are presented in Table 2.

93W components and squeezing patterns under different impact overloads.

Schematic diagram of spherical 93W alloy component. Note: h is the axial height of the component and d is the radial dimension of the component.
Test measurement data
| Number | 1 | 2 | 3 | 4 | 5 | 6 | 7 |
|---|---|---|---|---|---|---|---|
| Mass/g | 3.93 | 3.91 | 3.91 | 3.98 | 3.87 | 3.94 | 3.99 |
| h/mm | 6.93 | 6.88 | — | 6.83 | 6.72 | 6.60 | 6.48 |
| d/mm | 7.63 | 7.68 | — | 7.71 | 7.77 | 7.91 | 8.02 |
| Number | 8 | 9 | 10 | 11 | 12 | 13 | 14 |
|---|---|---|---|---|---|---|---|
| Mass/g | 3.91 | 3.95 | 3.79 | 3.89 | 3.96 | 3.91 | 3.94 |
| h/mm | — | 6.40 | 6.31 | 6.21 | 6.02 | 5.93 | 5.82 |
| d/mm | — | 8.13 | 8.20 | 8.28 | 8.35 | 8.37 | 8.39 |
3.1 Macroscopic deformation analysis
The finite element method is used to carry out the numerical simulation of spherical 93W components with 507–1,511 m/s vertical impacting steel targets. Three kinds of 93W alloy component patterns under different impact overloads are selected for the study. As shown in Figure 4, with the increase of impact overload, the spherical 93W alloy component undergoes axial compression and radial upset deformation (Figure 5). The axial shape variable (d/D) and the radial shape variable (h/D) show an approximately linear relationship change, and the finite element calculation results are compared with the experimental results, as shown in Figure 6, which shows that the results of the two are basically consistent. It can be seen that the finite element calculation has certain reliability.

The recovery of 93W component at the impact velocity of (a) 407 m/s, (b) 988 m/s, and (c) 1,511 m/s.

Relationship between axial and radial deformation of components under different impact overloads.
Figure 7 shows the relationship between the axial height h and the radial dimension d/2 of the 93W component, and Figure 8 shows the axial strain cloud diagram of the 93W component under the 1,511 m/s speed overload. It can be seen that the strain is distributed in a band shape, mainly based on the compressive strain, and there is only a slight tensile strain at the top of the sphere. The compressive strain from the impact surface to the top surface of the sphere gradually decreases and eventually changes to tensile strain. In Figure 9, it can be seen that the axial strain increase rate of the 93W spherical component gradually increases with the increase of the impact overload at the same height position in the axial direction. If the self-intrusion surface axial H is in the range of 0–0.8 mm and 3–7 mm, then the strain increase rate is large; if H is in the range of 1–2.5 cm, then the strain increase rate is small. Combined with Figure 7, it can be found that the radial dimension d/2 of the tungsten sphere is the largest in the range of 1–2.5 mm, and the axial strain change rate of the 93W tungsten sphere is small. If h is in the range of 0–8 mm and 3–7 mm, the radial dimension d/2 of the 93W tungsten sphere is small, but the tungsten sphere has a large axial strain change rate. The reason is analyzed. When the stress wave sweeps through the different cross-sectional area of the 93W tungsten sphere, the momentum conservation mv = I, the larger the radial dimension of the tungsten sphere, the larger the corresponding cross-sectional area, the larger the corresponding mass m in the unit axial height, the smaller the stress wave propagation speed, and the smaller the corresponding strain change rate per unit time. From m = Δh × πd 2 ρ, it can be seen that the axial strain change rate of the tungsten sphere changes inversely with the radial dimension (d/2)2.

The relationship between 93W member axial height h and radial dimension d/2.

Axial strain distribution of 93W component at 1,500 m/s.

Axial strain distribution of tungsten sphere at the impact velocity of 400–1,500 m/s.
From the experimental phenomenon, the internal stress wave propagation characteristics of the 93W component are analyzed. Under high-speed impact, the propagation of the internal shear wave is neglected, and the elastic wave and the plastic wave are equivalent to the shock wave. Figure 10 shows a schematic diagram of shock wave propagation by the finite element analysis and theoretical analysis. When an impact collision occurs, at time t 1, the 93W component produces a shock wave B1 that faces away from the impact surface, and the 93W component is axially compressed. The tensile wave R3 reflected by the target plate at the impact surface and the tensile wave B2 reflected from the free surface of both sides of the 93W component internal compression wave B1 propagate together to the inside of the component. Since B2 is a nonrigid wall vertical reflection, the stress wave B2 intensity is much smaller than B1. At time t 2, since B2 fails to completely unload the shock wave B1 of the initial incoming 93W component before it reaches the free face, the compression wave B1 of the initial incoming 93W component is reflected on the free surface as the tensile wave R1. Under the action of the tensile wave and the shock wave B1, the top free surface of the 93W component produces axial tensile plastic strain. At time t 3, the tensile wave B2 formed by the reflection of the free surface of B1 on both sides converges radially toward the central axis, and the concentrated tensile wave interacts at the axis to form a reverse tensile wave R2 to spread in the form of an approximately radial spherical wave, causing the spherical 93W to undergo radial plastic tensile deformation and then upset deformation.

Stress wave propagation in a 93W tungsten sphere at different times: (a) at time t 1, (b) at time t 2, and (c) at time t 3.
3.2 Microscopic deformation analysis
To study the microstructural variation of the spherical 93W component, the metallographic analysis experiment is carried out on the 93W component model with a velocity of 988 m/s under impact overload. Figure 11(a) shows that a ring-shaped “dark band” and a ring-shaped “bright band” are clearly observed in a 0.8-fold field of view. Samples are taken at axial, radial dark, and bright band positions (Figure 11(b) and (c)).
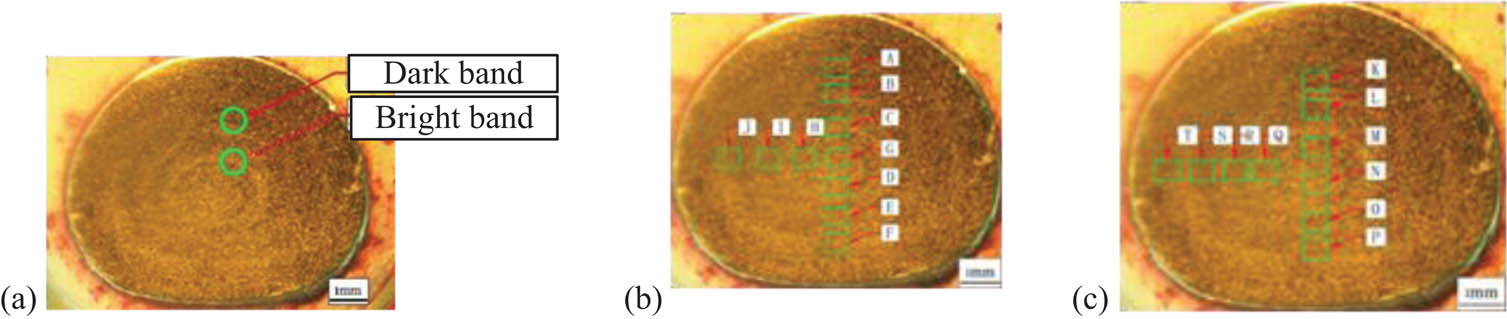
The bright, dark band, and sampling positions of the tungsten sphere axial section.
PhotoShop7.0 software is used to extract the pixel ratio of tungsten particles and binder phase in the sampling interval. As shown in Figure 12, the ratio of the image area of tungsten grains at each position is calculated to indicate the dense degree of tungsten grains. The calculation of the tungsten grain ratio at the A–T sampling positions is presented in Table 3. Figure 13 shows the distribution of tungsten grains at the A–T sampling positions.

Example of tungsten grain pixel extraction: (a) unextracted tungsten grain pixels and (b) extracted tungsten grain pixels.
Tungsten grain pixel ratio at different sampling positions
| Bright band sampling position | A | B | C | D | E |
|---|---|---|---|---|---|
| Tungsten grain ratio | 0.805 | 0.784 | 0.781 | 0.764 | 0.791 |
| Bright band sampling position | F | G | H | I | J |
|---|---|---|---|---|---|
| Tungsten grain ratio | 0.851 | 0.788 | 0.774 | 0.848 | 0.861 |
| Dark band sampling position | K | L | M | N | O |
|---|---|---|---|---|---|
| Tungsten grain ratio | 0.751 | 0.705 | 0.666 | 0.701 | 0.715 |
| Dark band sampling position | P | Q | R | S | T |
|---|---|---|---|---|---|
| Tungsten grain ratio | 0.764 | 0.712 | 0.755 | 0.808 | 0.850 |
Note: the dimensions of the pictures in Figure 13 are the same as those in Figure 12.

Tungsten grain distribution at the A–T sampling positions.
Referring to the “bright band” and “dark band” sampling positions in Figure 11, combined with the tungsten grain sampling distribution map of Figure 13, it can be seen that the tungsten particle dense region is the “bright band” position, and the tungsten particle sparse region is the “dark band” position. According to Table 3 and Figure 14, the tungsten grains show a dense–sparse–dense–sparse distribution trend along the axial direction of the component, and the tungsten grain density gradually increases from the center of the sphere along the axis to the bottom of the sphere and the top of the sphere. At the same time, the tungsten particles also exhibit a variety trend of dense-sparse-dense-sparse distribution along the radial direction, and the density of the tungsten particles gradually increases from the center of the sphere along the radial direction, and it is found that the axial and radial tungsten dense are larger with the more dense regions, and the corresponding bright band is wider. The author believes that the appearance of “dark band” and “bright band” is the result of multiple reflection interactions of shock waves. Combined with the stress wave propagation law in Section 3.1, it is found that after converging of the stress wave B2 at the axis, there is a generation of a tensile stress wave R2 with a large intensity, as shown in Figure 15, and under the action of the stress wave, the bond phase at the center of the sphere first produces radial plastic tensile deformation or even fracture. The fracture crack is shown in Figure 17. The radial tungsten particle spacing increases to form a sparse zone X. With the attenuation of the stress wave R2, the tungsten particle gap does not change any more. The tungsten particles are radially deposited at the radial boundary of the X zone. At this time, the X-zone of the tungsten sphere center is stretch strengthened, and the tensile strength is increased to σ 1 (σ 1 > σ 0, where σ 0 is the tensile strength of the tungsten alloy). When R2 is reflected by the free surface of the tungsten sphere and then concentrated at the center of the sphere, the stress wave R22 is generated (the R22 stress amplitude is less than R2), which no longer causes the strengthened X-zone bond phase deformation. When the stress wave R22 acts on the outside of X zone, the tensile phase of the Y zone is strengthened by radial stretching. The tensile strength of the sparse Y zone is σ 2 (σ 1 > σ 2 > σ 0), and the radial spacing of tungsten particles increases, and the tungsten particles are radially stacked at the outer boundary of the Y zone. According to the aforementioned process, the stress wave R22 formed by the convergence causes the formation of the sparse zone Z. Similarly, the tensile waves S1, S3, and R2 have the same principle, forming a sparse zone and a dense zone of axial tungsten particles. In the sparse zone X, Y, and Z junctions, it forms a bright band, which is observed in the experimental phenomenon, that is, the tungsten particle dense region, but because the tensile wave R3 is larger than the tensile wave R1 formed after the spherical free surface reflection, with the attenuation of stress wave many times on the free surface, the tungsten particle accumulation is no longer obvious, so the axial width of the bright band gradually decreases from the impact surface to the top.

The axial and radial distribution of grain pixel ratio at the A–T positions: (a) tungsten grain density distribution in axial dark brand and bright band, (b) tungsten grain density distribution in radial dark brand and bright band.

Schematic diagram of stress wave propagation inside a tungsten sphere.
3.3 Analysis of fracture characteristics
With the increase of the impact overload, under the action of the radial tensile stress R2, the fracture first occurs at the radial maximum of the 93W spherical member, as shown in Figure 16. The crack extends in the “Z” shape along the radial direction to the center of the sphere [38,39], and the crack width gradually decreases, as shown in Figure 17. Comparing the 93W microcrack structure under different impact overloads, it can be seen that when the 93W tungsten sphere impacts at a velocity of 809 m/s, the crack is mainly caused by grain boundary fracture. When the impact velocities are 1,187 and 1,511 m/s, the tungsten particle transgranular fracture begins to appear in the crack. As the impact overload increases, the number of tungsten particles cleaved increases. Finally, the two fracture forms coexist, and the statistical results of the fractured tungsten grains are shown in Figure 18.

Macroscopic crack appearance of 93W alloy at three speeds: (a) 809 m/s, (b) 1,187 m/s, and (c) 1,511 m/s.

Microcrack structure of 93W alloy at three speeds: (a) 809 m/s, (b) 1,187 m/s, and (c) 1,511 m/s.

Statistics on the number of tungsten grains cleavage.
According to the spherical wave theory, the deformed flat spherical 93W alloy member is approximated as a spherical finite medium with a cavity radius a (a is much smaller than the 93W tungsten sphere radius r 0), and the stress wave R2 (stress value is б 0) is the initial loading wave of the inner wall of the hole. For the powder metallurgy tungsten alloy, since the volume fraction of tungsten particles is much larger than the binder phase, the tungsten particles are in contact with each other, and the radial tensile fracture of the 93W spherical member can be equivalent to the uniaxial equiaxial tensile fracture. A radical microelement is analyzed as shown in Figure 19.

Force analysis of radial microelement of 93W alloy tungsten sphere.
According to the Taylor theory [29], the equation of motion of a spherical wave is (r is the radius of a radial direction of the tungsten sphere) expressed as follows:
Since the aperture a is much smaller than the radius r 0 of the tungsten sphere, the initial pressure of the inner wall of the tungsten bulb cavity is expressed as follows:
Therefore, the radial tensile stress σ r and the shear stress σ μ along the radial attenuation law are expressed as follows:
Note: Poisson’s ratio of 93W alloy ν = 0.3.
In Figure 20, it can be seen that the radial tensile stress σ r and the tangential stress σ μ are inversely proportional to r, which is a result of the diffusion effect of the spherical wave. The radial tensile stress σ r is the same as the tangential stress σ μ, which is the tensile stress. When the tungsten sphere is close to the free surface, the two stresses are nearly equal. The shear stress at the end of the crack tip is equal to the tensile strength of the tungsten alloy, and the crack extension is terminated. The crack length in Figure 17(c) is about 1 mm, and in Figure 20, the shear stress at r = 3.5 mm is about 1.2 times the shear stress value at r = 4.5 mm. The shear stress distribution of the radial crack is shown in Figure 21. It can be seen that in combination with the cracked metallographic structure at the impact velocities of 809, 1,187, and 1,511 m/s in Figure 14, the fracture form of the tungsten alloy is mainly dominated by the intergranular fracture under the low impact overload. However, as the impact overload increases, the strain rate increases. Due to the nonuniformity of the material, local stress concentration occurs, making it easier for the tungsten particles to reach the breaking strength. At the same time, the bond strength and the fracture strength of the tungsten particles increase with the increase of the strain rate. The former increases faster than the latter, and even exceeds the latter, so the probability of tungsten particles breaking increases. The strain rate increases, the deformation and fracture time will be shortened, and the deformation and disengagement speed of the grain and binder phase are much lower than the cleavage speed of the grain. At the same time, the tungsten particles are more likely to break. The critical stress e d (1,973 Mpa) of the self-fracture of the second phase tungsten particles proposed by Sun Jun is approximately 3.1 times the critical effective stress e c (625 MPa) of the interface separation caused by the tensile stress of the tungsten particles and the matrix [39,40,41,42,43,44]. The shear stress at the crack tip is 1.2 times the shear stress at the outer edge of the port. When the fracture shear stress is high enough, the two fracture modes of intergranular fracture and transgranular fracture occur simultaneously, and the cleavage of tungsten particles is more likely to occur near the crack tip. This is basically consistent with the result of the metallographic analysis experiment. It can be seen that the application of the stress wave theory can explain the experimental phenomena well.

Relationship between radial shear stress σ μ, tensile stress σ r, and r.

Tangential tensile stress distribution diagram of port crack.
4 Conclusion
Through the experimental research, theoretical analysis, and finite element calculation, dynamic response characteristics of 93W alloy with the spherical structure are analyzed. The following conclusions are obtained:
Within a certain range of the impact overload, the plastic deformation law of 93W alloy with the spherical structure is mainly axial compression and radial upsetting, and the axial compression amount changes linearly with the radial upsetting. As the impact overload increases, the overall strain of the spherical 93W member and the axial strain change rate increase.
Under the action of the spherical stress wave, the tungsten grain densely and sparsely separated along the radius from the center of the sphere, the tungsten grain density changes uniformly from the dense area to the sparse area, and the ring-shaped “bright band” phenomenon appears between the light and dark phases. The width of the bright band is significantly correlated with the proportion of the area occupied by the tungsten grains in the dense region.
With the increase of the impact overload, the 93W alloy with the spherical structure first breaks at the radial maximum and the central axis, and the crack width and radial extension length increase, and the crack fracture mode changes from the intergranular fracture to the transgranular fracture, and finally the two fracture forms coexist.
References
[1] Zhang GW, Jia GH, Li Q, et al. Deformation analysis of tungsten sphere in penetrating armor plate. J North Univ China (Nat Sci Ed). 1997;15(1):71–4.Suche in Google Scholar
[2] Zhao XX, Wang SS, Xu YX, Zhao XN, et al. Crater diameter calculation model of tungsten sphere impacting low carbon steel plate at high velocity. J Beijing Inst Technol. 2015;35(12):1217–21.Suche in Google Scholar
[3] Wang QT, Zhang QM, Zhai Z, Liu X, et al. Character of carter for tungsten spheres with a high-velocity penetrating into a medium-thick steel plate. J Vib Shock. 2013;32(23):121–5.Suche in Google Scholar
[4] Jia GH, Zhang GW, Pei SX, et al. Experimental study on the penetration of tungsten spheres into thin targets. Acta Armamentarii. 1998;19(2):185–8.Suche in Google Scholar
[5] Chen ZB, Liu ZG, et al. Experimental study on vertical collision of spherical targets with metal targets. J Sphereistics. 1991;7(1):66–70.Suche in Google Scholar
[6] Shen ZG, Yu Q, et al. Experimental study on spherical fragments colliding with metal targets. journal of projectiles. Rockets, Missiles Guidance. 1988;26(1):64–72.Suche in Google Scholar
[7] Chi RQ, Pang BJ, He MJ, Guan GS, Yang ZQ, Zhu Y, et al. Experimental investigation for deformation and fragmentation of spheres penetrating. Explos Shock Waves. 2009;29(3):231–6.Suche in Google Scholar
[8] Chi RQ, Pang BJ, Guan GS, Yang ZQ, Wang LW, et al. An experimental investigation of debris cloud generated by hypervelocity impact of aluminum spheres with aluminum sheets. Eur Conf Space Debris. 2009;23(6):672–4.Suche in Google Scholar
[9] He MJ. Characteristics of debris cloud produced by normal hypervelocity impact of spherical projectile with thin aluminum plate. Doctoral dissertation. Harbin, China: Harbin Institute of Technology; 2007.Suche in Google Scholar
[10] Ma G, Zhou W, Zhang Y, Wang Q, Chang X. Fractal behavior and shape characteristics of fragments produced by the impact of quasi-brittle spheres. Changsha, China: Powder Technology; 2017.10.1016/j.powtec.2017.11.030Suche in Google Scholar
[11] Zhang X, Liu T, Li X, et al. Numerical investigation of fragmentation initiation threshold for sphere impacting on thin wall at hypervelocity. Proc Inst Mech Eng Part G J Aerosp Eng. 2016;230:6.10.1177/0954410015602505Suche in Google Scholar
[12] Piekutowski AJ, et al. Fragmentation of a sphere initiated by hypervelocity impact with a thin sheet. Int J Impact Eng. 1995;17(4):627–38.10.1016/0734-743X(95)99886-VSuche in Google Scholar
[13] Piekutowski AJ, et al. Fragmentation-initiation threshold for spheres impacting at hypervelocity. Int J Impact Eng. 2003;29(1):563–74.10.1016/j.ijimpeng.2003.10.005Suche in Google Scholar
[14] Nowinski JL, Shahinpoor M. Radial oscillations of a thick-walled spherical highly stressed nonhomogeneous shell. J Frankl Inst. 1971;291(4):293–304.10.1016/0016-0032(71)90185-2Suche in Google Scholar
[15] Wang QT, Zhang QM, Zhai Z, Liu X, et al. Character of carter for tungsten spheres with a high-velocity penetrating into a medium-thick steel plate. J Vib Shock. 2013;32(23):121–5.Suche in Google Scholar
[16] Chen QS, Miao YG, Guo YZ, Li YL, et al. Comparative analysis of 3 constitutive models for 93 tungsten alloy. Chin J High Press Phys. 2017;31(6):753–60.Suche in Google Scholar
[17] Liu Y. Technology and mechanism of large deformation strengthening for tungsten heavy alloy. Doctoral dissertation. Nanjing, China: Nanjing University of Science and Technology; 2016.Suche in Google Scholar
[18] Ma HL, Hu GK, Tan CW, Yu XD, Bai YQ, Liu BK, et al. Damage mechanisms for 93W and 97w tungsten-based alloys. Rare Met Mater Eng. 2010;39(8):1344–7.10.1016/S1875-5372(10)60118-XSuche in Google Scholar
[19] Liu HY, Li ZY, Ning JG, et al. Study on fracture behavior of 91 tungsten alloy. J Taiyuan Univ Technol. 2005;36(6):716–7.Suche in Google Scholar
[20] Jiao T, Zhang B, Zhang HT, Liu CL, et al. Micro (fine) view response analysis of 90 and 93 W tungsten alloys under dynamic loading. Trans nonferrous Met Soc China. 2001;11(z1):92–7.Suche in Google Scholar
[21] Guo ZJ, Xu J, et al. Effect of large deformation on scanning fracture and mechanical properties of tungsten alloy materials. Ordnance Mater Sci Eng. 1999;5:45–8.Suche in Google Scholar
[22] Shi HG, Qi ZW, Guo ZJ, Fan CS, Xu J, et al.` Effect of forging deformation on properties of tungsten alloy materials. Ordnance Mater Sci Eng. 1998;4:3–6.Suche in Google Scholar
[23] Gao HM, Chen WG, Lian K, Zhang FQ, et al. Study on correlation between grain size and tungsten copper alloy. Rare Met. 2018;1:59–66.Suche in Google Scholar
[24] Feng HY, Liu HY, Hu HW, Zhao XJ, Li GJ, Song P, et al. Effect of tungsten content and particle shape on mechanical properties of tungsten alloys. Sci Technol Engeering. 2014;14(24):1–7.Suche in Google Scholar
[25] Song WD, Liu HY, Ning JG, et al. Dynamic tensile experiments of tungsten alloys. Natl Academic Conf Explosive Mech. 2007;13(9):9–12.Suche in Google Scholar
[26] Song WD, Liu HY, Ning JG, et al. Research and numerical simulation of mechanical properties of refined tungsten alloy. J Beijing Inst Technol. 2007;27(9):756–60.Suche in Google Scholar
[27] Lv XC, Tian SY, Ma L, et al. Research of relationship between dynamic tensile property and microcosmic fragment mechanism of tungsten alloy. Mech Test Technol Laboratory Constr Semin. 2007;17(3):498–500.Suche in Google Scholar
[28] Shi HG, Chai DL, et al. Analysis and calculation of microstructure fracture of tungsten alloy. Ordnance Mater Sci Eng. 1999;6:3–6.Suche in Google Scholar
[29] Wang ZX, Chai DL, Liu JH, et al. Cracking behavior and mechanical analysis of multiphase microstructure under dynamic load. Acta Metallurgica Sin. 1991;27(5):39–44.Suche in Google Scholar
[30] Zhang BP, Ding CT, Liu BH, Chen XL, et al. Expression of impact tensile behavior of tungsten alloys and their constitutive and fracture criteria. Eng Sci. 2003;5(3):44–50.Suche in Google Scholar
[31] Zhang BP, Ding CT, Liu BH, Chen XL, et al. Impact tensile behavior of tungsten alloys and their constitutive and fracture criteria expression. Engeering Sci. 2003;5(3):44–50.Suche in Google Scholar
[32] Guan GS, Yao Z, Chi RQ, Yue HA, Pang BJ, et al. Experimental investigation of space effect on damage of aluminum dual-wall structure by hypervelocity impact. J Exp Mech. 2008;21(3):299–306.Suche in Google Scholar
[33] Guan GS, Bang BJ, Niu RT, et al. Investigation into damage of al-mesh bumper under hypervelocity al-spheres impact. Key Eng Mater. 2011;488489:202–5.10.4028/www.scientific.net/KEM.488-489.202Suche in Google Scholar
[34] Guan GS, Ha Y, Pang BJ, Chi RQ, et al. A study of al-bumper thickness effect on damage of whipple shield by hypervelocity impact of al-spheres. Harbin, China: Harbin Institute of Technology; 2006.Suche in Google Scholar
[35] Chi RQ, Pang BJ, He MJ, Guan GS, Yang ZQ, Zhu Y, et al. Experimental investigation for deformation and fragmentation of spheres penetrating. Explos Shock Waves. 2009;29(3):231–6.Suche in Google Scholar
[36] Chi RQ, Pang BJ, Guan GS, Yang ZQ, Wang LW, et al. An experimental investigation of debris cloud generated by hypervelocity impact of aluminum spheres with aluminum sheets. Eur Conf Space Debris. 2009;672.Suche in Google Scholar
[37] Myagkov NN, Bezrukov LN, Shumikhin TA, et al. Experimental investigation of ejecta generated by the hypervelocity impact of aluminum projectiles on continuous and mesh bumpers. Eur Conf Space Debris, Fifth Eur Conf Space Debris. 2009;17(3):672.Suche in Google Scholar
[38] Zhang BP, Ding CT, Liu BH, Chen XL, et al. Expression of impact tensile behavior of tungsten alloys and their constitutive and fracture criteria. Eng Sci. 2003;5(3):44–50.Suche in Google Scholar
[39] Zhang BP, Ding CT, Liu BH, Chen XL, et al. Impact tensile behavior of tungsten alloys and their constitutive and fracture criteria expression. Engeering Sci. 2003;5(3):44–50.Suche in Google Scholar
[40] Aidara S. Anticipated backward doubly stochastic differential equations with non-Liphschitz coefficients. Appl Math Nonlinear Sci. 2019;4:9–20.10.2478/AMNS.2019.1.00002Suche in Google Scholar
[41] Chen S, Hassanzadeh-Aghdam MK, Ansari R. An analytical model for elastic modulus calculation of SiC whisker-reinforced hybrid metal matrix nanocomposite containing SiC nanoparticles. J Alloy Compd. 2018;767:632–41.10.1016/j.jallcom.2018.07.102Suche in Google Scholar
[42] Nizami AR, Perveen A, Nazeer W, Baqir M. Walk polynomial: a new graph invariant. Appl Math Nonlinear Sci. 2018;3:321–30.10.21042/AMNS.2018.1.00025Suche in Google Scholar
[43] Pandey PK, Jaboob SSA. A finite difference method for a numerical solution of elliptic boundary value problems. Appl Math Nonlinear Sci. 2018;3:311–20.10.21042/AMNS.2018.1.00024Suche in Google Scholar
[44] Shvets A, Makaseyev A. Deterministic chaos in pendulum systems with delay. Appl Math Nonlinear Sci. 2019;4:1–8.10.2478/AMNS.2019.1.00001Suche in Google Scholar
© 2020 Taiyong Zhao et al., published by De Gruyter
This work is licensed under the Creative Commons Attribution 4.0 International License.
Artikel in diesem Heft
- Regular Articles
- Model of electric charge distribution in the trap of a close-contact TENG system
- Dynamics of Online Collective Attention as Hawkes Self-exciting Process
- Enhanced Entanglement in Hybrid Cavity Mediated by a Two-way Coupled Quantum Dot
- The nonlinear integro-differential Ito dynamical equation via three modified mathematical methods and its analytical solutions
- Diagnostic model of low visibility events based on C4.5 algorithm
- Electronic temperature characteristics of laser-induced Fe plasma in fruits
- Comparative study of heat transfer enhancement on liquid-vapor separation plate condenser
- Characterization of the effects of a plasma injector driven by AC dielectric barrier discharge on ethylene-air diffusion flame structure
- Impact of double-diffusive convection and motile gyrotactic microorganisms on magnetohydrodynamics bioconvection tangent hyperbolic nanofluid
- Dependence of the crossover zone on the regularization method in the two-flavor Nambu–Jona-Lasinio model
- Novel numerical analysis for nonlinear advection–reaction–diffusion systems
- Heuristic decision of planned shop visit products based on similar reasoning method: From the perspective of organizational quality-specific immune
- Two-dimensional flow field distribution characteristics of flocking drainage pipes in tunnel
- Dynamic triaxial constitutive model for rock subjected to initial stress
- Automatic target recognition method for multitemporal remote sensing image
- Gaussons: optical solitons with log-law nonlinearity by Laplace–Adomian decomposition method
- Adaptive magnetic suspension anti-rolling device based on frequency modulation
- Dynamic response characteristics of 93W alloy with a spherical structure
- The heuristic model of energy propagation in free space, based on the detection of a current induced in a conductor inside a continuously covered conducting enclosure by an external radio frequency source
- Microchannel filter for air purification
- An explicit representation for the axisymmetric solutions of the free Maxwell equations
- Floquet analysis of linear dynamic RLC circuits
- Subpixel matching method for remote sensing image of ground features based on geographic information
- K-band luminosity–density relation at fixed parameters or for different galaxy families
- Effect of forward expansion angle on film cooling characteristics of shaped holes
- Analysis of the overvoltage cooperative control strategy for the small hydropower distribution network
- Stable walking of biped robot based on center of mass trajectory control
- Modeling and simulation of dynamic recrystallization behavior for Q890 steel plate based on plane strain compression tests
- Edge effect of multi-degree-of-freedom oscillatory actuator driven by vector control
- The effect of guide vane type on performance of multistage energy recovery hydraulic turbine (MERHT)
- Development of a generic framework for lumped parameter modeling
- Optimal control for generating excited state expansion in ring potential
- The phase inversion mechanism of the pH-sensitive reversible invert emulsion from w/o to o/w
- 3D bending simulation and mechanical properties of the OLED bending area
- Resonance overvoltage control algorithms in long cable frequency conversion drive based on discrete mathematics
- The measure of irregularities of nanosheets
- The predicted load balancing algorithm based on the dynamic exponential smoothing
- Influence of different seismic motion input modes on the performance of isolated structures with different seismic measures
- A comparative study of cohesive zone models for predicting delamination fracture behaviors of arterial wall
- Analysis on dynamic feature of cross arm light weighting for photovoltaic panel cleaning device in power station based on power correlation
- Some probability effects in the classical context
- Thermosoluted Marangoni convective flow towards a permeable Riga surface
- Simultaneous measurement of ionizing radiation and heart rate using a smartphone camera
- On the relations between some well-known methods and the projective Riccati equations
- Application of energy dissipation and damping structure in the reinforcement of shear wall in concrete engineering
- On-line detection algorithm of ore grade change in grinding grading system
- Testing algorithm for heat transfer performance of nanofluid-filled heat pipe based on neural network
- New optical solitons of conformable resonant nonlinear Schrödinger’s equation
- Numerical investigations of a new singular second-order nonlinear coupled functional Lane–Emden model
- Circularly symmetric algorithm for UWB RF signal receiving channel based on noise cancellation
- CH4 dissociation on the Pd/Cu(111) surface alloy: A DFT study
- On some novel exact solutions to the time fractional (2 + 1) dimensional Konopelchenko–Dubrovsky system arising in physical science
- An optimal system of group-invariant solutions and conserved quantities of a nonlinear fifth-order integrable equation
- Mining reasonable distance of horizontal concave slope based on variable scale chaotic algorithms
- Mathematical models for information classification and recognition of multi-target optical remote sensing images
- Hopkinson rod test results and constitutive description of TRIP780 steel resistance spot welding material
- Computational exploration for radiative flow of Sutterby nanofluid with variable temperature-dependent thermal conductivity and diffusion coefficient
- Analytical solution of one-dimensional Pennes’ bioheat equation
- MHD squeezed Darcy–Forchheimer nanofluid flow between two h–distance apart horizontal plates
- Analysis of irregularity measures of zigzag, rhombic, and honeycomb benzenoid systems
- A clustering algorithm based on nonuniform partition for WSNs
- An extension of Gronwall inequality in the theory of bodies with voids
- Rheological properties of oil–water Pickering emulsion stabilized by Fe3O4 solid nanoparticles
- Review Article
- Sine Topp-Leone-G family of distributions: Theory and applications
- Review of research, development and application of photovoltaic/thermal water systems
- Special Issue on Fundamental Physics of Thermal Transports and Energy Conversions
- Numerical analysis of sulfur dioxide absorption in water droplets
- Special Issue on Transport phenomena and thermal analysis in micro/nano-scale structure surfaces - Part I
- Random pore structure and REV scale flow analysis of engine particulate filter based on LBM
- Prediction of capillary suction in porous media based on micro-CT technology and B–C model
- Energy equilibrium analysis in the effervescent atomization
- Experimental investigation on steam/nitrogen condensation characteristics inside horizontal enhanced condensation channels
- Experimental analysis and ANN prediction on performances of finned oval-tube heat exchanger under different air inlet angles with limited experimental data
- Investigation on thermal-hydraulic performance prediction of a new parallel-flow shell and tube heat exchanger with different surrogate models
- Comparative study of the thermal performance of four different parallel flow shell and tube heat exchangers with different performance indicators
- Optimization of SCR inflow uniformity based on CFD simulation
- Kinetics and thermodynamics of SO2 adsorption on metal-loaded multiwalled carbon nanotubes
- Effect of the inner-surface baffles on the tangential acoustic mode in the cylindrical combustor
- Special Issue on Future challenges of advanced computational modeling on nonlinear physical phenomena - Part I
- Conserved vectors with conformable derivative for certain systems of partial differential equations with physical applications
- Some new extensions for fractional integral operator having exponential in the kernel and their applications in physical systems
- Exact optical solitons of the perturbed nonlinear Schrödinger–Hirota equation with Kerr law nonlinearity in nonlinear fiber optics
- Analytical mathematical schemes: Circular rod grounded via transverse Poisson’s effect and extensive wave propagation on the surface of water
- Closed-form wave structures of the space-time fractional Hirota–Satsuma coupled KdV equation with nonlinear physical phenomena
- Some misinterpretations and lack of understanding in differential operators with no singular kernels
- Stable solutions to the nonlinear RLC transmission line equation and the Sinh–Poisson equation arising in mathematical physics
- Calculation of focal values for first-order non-autonomous equation with algebraic and trigonometric coefficients
- Influence of interfacial electrokinetic on MHD radiative nanofluid flow in a permeable microchannel with Brownian motion and thermophoresis effects
- Standard routine techniques of modeling of tick-borne encephalitis
- Fractional residual power series method for the analytical and approximate studies of fractional physical phenomena
- Exact solutions of space–time fractional KdV–MKdV equation and Konopelchenko–Dubrovsky equation
- Approximate analytical fractional view of convection–diffusion equations
- Heat and mass transport investigation in radiative and chemically reacting fluid over a differentially heated surface and internal heating
- On solitary wave solutions of a peptide group system with higher order saturable nonlinearity
- Extension of optimal homotopy asymptotic method with use of Daftardar–Jeffery polynomials to Hirota–Satsuma coupled system of Korteweg–de Vries equations
- Unsteady nano-bioconvective channel flow with effect of nth order chemical reaction
- On the flow of MHD generalized maxwell fluid via porous rectangular duct
- Study on the applications of two analytical methods for the construction of traveling wave solutions of the modified equal width equation
- Numerical solution of two-term time-fractional PDE models arising in mathematical physics using local meshless method
- A powerful numerical technique for treating twelfth-order boundary value problems
- Fundamental solutions for the long–short-wave interaction system
- Role of fractal-fractional operators in modeling of rubella epidemic with optimized orders
- Exact solutions of the Laplace fractional boundary value problems via natural decomposition method
- Special Issue on 19th International Symposium on Electromagnetic Fields in Mechatronics, Electrical and Electronic Engineering
- Joint use of eddy current imaging and fuzzy similarities to assess the integrity of steel plates
- Uncertainty quantification in the design of wireless power transfer systems
- Influence of unequal stator tooth width on the performance of outer-rotor permanent magnet machines
- New elements within finite element modeling of magnetostriction phenomenon in BLDC motor
- Evaluation of localized heat transfer coefficient for induction heating apparatus by thermal fluid analysis based on the HSMAC method
- Experimental set up for magnetomechanical measurements with a closed flux path sample
- Influence of the earth connections of the PWM drive on the voltage constraints endured by the motor insulation
- High temperature machine: Characterization of materials for the electrical insulation
- Architecture choices for high-temperature synchronous machines
- Analytical study of air-gap surface force – application to electrical machines
- High-power density induction machines with increased windings temperature
- Influence of modern magnetic and insulation materials on dimensions and losses of large induction machines
- New emotional model environment for navigation in a virtual reality
- Performance comparison of axial-flux switched reluctance machines with non-oriented and grain-oriented electrical steel rotors
- Erratum
- Erratum to “Conserved vectors with conformable derivative for certain systems of partial differential equations with physical applications”