Modeling and simulation of dynamic recrystallization behavior for Q890 steel plate based on plane strain compression tests
-
 and
and

Abstract
In view that the traditional dynamic recrystallization (DRX) model cannot effectively predict the DRX process in the hot deformation process of sheet metal, DRX behavior modeling and simulation of q890 steel plate based on the plane strain compression test are designed. The plane strain thermal simulation tests were performed at 1,223–1,373 K and the strain rates of 1–50−1 on Gleeble-3500 thermal–mechanical simulator. The flow stress curves were well smoothed. The stress–strain data were investigated for the analysis of the dynamic recrystallization in the process of thermal deformation. The activation energy of DRX was calculated as Q = 394.53 kJ/mol by the simulation data. The equation of peak strain was developed with the flow stress data by the Zener–Hollomon parameter. The DRX transformation fraction of Q890 steel was studied, and the DRX kinetics equation was developed by the Avrami equation. The experimental data are in good agreement with the calculated values, which proves the reliability of the DRX model and can be widely used in real life.
1 Introduction
Continuous heat processing of metallic materials requires the evaluation of product quality with a given technology. Therefore, the predictions of the heat processing results are important for online process or off-line process. During hot deformation, dynamic recovery (DRV) and dynamic recrystallization (DRX) are the main mechanism to balance the work hardening. The model of the thermomechanical processing of steels is established by the thermomechanical parameters such as temperatures and strains. The major influence on microstructure evolution is the dynamic recrystallization that occurred under given conditions. Some methods for modeling the progress of dynamic recrystallization were introduced to describe the softening. The procedure was established through the analysis of stress–strain curves. McQueen and Ryan [1] discussed the dynamic recrystallizaion of different metallic materials including micro-alloyed steels and stainless steels. Based on the research of the critical strain, the initiation of dynamic recrystallization is to be determined. Many authors also made contribution for the development of models, such as Jonas et al. [2], Rossi and Sellars [3], and Khoddam and Hodgson [4]. Most of the models are established by torsion tests or cylinder specimen compression tests [5,6,7]. Compared with the cylindrical compression test, there is no bulging phenomenon in the process of plane strain compression, and the frictional force of plane strain compression contact surface is smaller. In addition, the stress state of the plane strain experiment is closer to that of the hot rolling plate process. The DRX is a complex thermomechanical process, and the aim to this study is to determine the critical strain and the critical stress in the DRX, which can be disposed in many ways [8,9,10]. The hardening and recrystallization behaviors vary for different materials [11,12]. Therefore, it is necessary to study the parameters of DRX for specific materials.
The main aim of this study is to analyze the hot deformation behavior of Q890 micro-alloyed steels, which can be used for die materials. Based on the plane strain compression tests, the effects of the critical strain, deformation temperature, and strain rate were investigated, which are used for developing the kinetics model of dynamic recrystallization for Q890 micro-alloyed steels. The integrated equations are proposed to predict the softening behaviors induced by dynamic recrystallization in the studied material.
2 Experiments
The chemical compositions of Q890 steel are as follows (wt%): C, 0.16; Si, 0.29; Mn, 1.27; Cr, 0.35; Mo, 0.51; Ni, 0.38; Fe, balance. The simulated sample with the length of 20 mm, the width of 15 mm, and the height of 10 mm was machined from the hot rolling plate. To reduce friction and to guarantee the parallel degree, which could produce an effect on experiment precision of stress–strain curves, the sample was carefully polished. The plane strain compression tests, which are used to simulate flat rolling as shown in Figure 1, were conducted on Gleeble 3500 testing machine. The deformation forces, stain, and the metal flow direction of the plane strain simulation are all in the same direction as those found in the flat rolling. In the process of plane strain experimental, the conditions of stress–strain state are closer to flat rolling than that of the cylindrical compression test. Compared with the cylindrical compression test, the bulging and the high friction can be minimized in the plane strain compression test. By using high resistance anvils, less than 1% thermal gradient from anvil to anvil can be obtained with the sample size used in this experiment. Test process diagram is shown in Figure 2. The specimens were first heated at a heating rate of 5 K/s to a soaking temperature of 1,473 K and held for 5 min, thus making the austenitic microstructure homogenizing treated. Then, the temperature of sample was decreased to a certain temperature at a rate of 5 K/s, holding 30 s at uniform temperature before deformation. The compression tests carried out at a height reduction of 60%. The simulation temperatures were 1,223, 1,273, 1,332, and 1,373 K. The test parameters of strain rates were 1 s−1, 5 s−1, 10−1, and 50−1. GLEEBLE-3500 automatically collects the real stress, true strain, pressure, temperature, displacement, time, and other experimental data and then draws the true stress–true strain curve by Origin software.

Schematic diagram of plane strain simulation.

Experimental process of plane strain simulation.
3 Results and discussion
3.1 Flow stress behavior strain and strain rate
The true stress–strain curves of Q890 steel under different deformation conditions are shown in Figure 3. According to the data of stress–strain curves, it is need to separate the part of DRV and DRX. It is also found that the flow stress decreases rapidly with the lower deformation temperature for a certain strain rate. In the process of DRV, it is an ascending trend that the stress increases with strain. However, while the DRX occurred in a certain compression test, the flow stress decreased in critical condition. From the curves show in Figure 3, it has three distinct stages obviously. In the first stage, the flow stress increases rapidly to a critical value because of work hardening behavior in the deformed steel. In the second stage, the dynamic recrystallizaion is initiated at a critical strain, which results in more softening to balance the work hardening. A maximum value of stress can be found in the stress–strain curves. In the third stage, in the continuing dynamic recrystallizaion, the curves have a steady state. The main factor is that the temperature and strain rate affected the DRX. The DRX occurs more rapidly in a certain strain rate, while the deformation temperature increases. Therefore, a typical curve of the dynamic recrystallizaion softening includes a peak stress value and a steady-state process. At constant strain rate, the higher the temperature is, the more likely it is to induce grain boundary migration of DRX. In contrast, under the condition of the lower strain rate, the dynamic recrystallizaion would be more likely to happen [13,14,15].

Flow stress curves of plane strain simulation under temperatures of (a) 1,223 K, (b) 1,273 K, (c) 1,323 K, and (d) 1,373 K.
During DRX, the main influencing factors are the temperature and strain rate, which are used in the hot deformation process of the plane strain experimental. When the parameter of the strain rate is constant, the higher the hot deformation temperature is, the faster the DRX occurs. Therefore, once DRX occurs, there must be a peak stress in the flow stress curve. The stress value tends to be stable. DRX usually occurs at the boundary of the original deformed particles. Normally, lower strain rate and higher deformation temperature are considered to contribute to the initiation of DRX in hot deformation.
3.2 The initiation of DRX
In the early stage of high temperature deformation, the specimen is in elastic deformation, which should be removed before processing the data. The starting point of fitting data was at the 2% of the total strain, which was considered that the stress value on sample was over the yield stress. As shown in Figure 4(a), an example of an experimental curve was given. The experimental parameters of compression were at 1,273 K and a strain rate of 10 s−1. The ninth-order polynomial fitting curve starts from σ, which was decided by the yield principle mentioned earlier. The fitting curve was precise within about 1% as shown in Figure 4(b). The reasons of experimental errors were due to temperature fluctuations and load measurement, as well as nonlinear plastic deformation process.
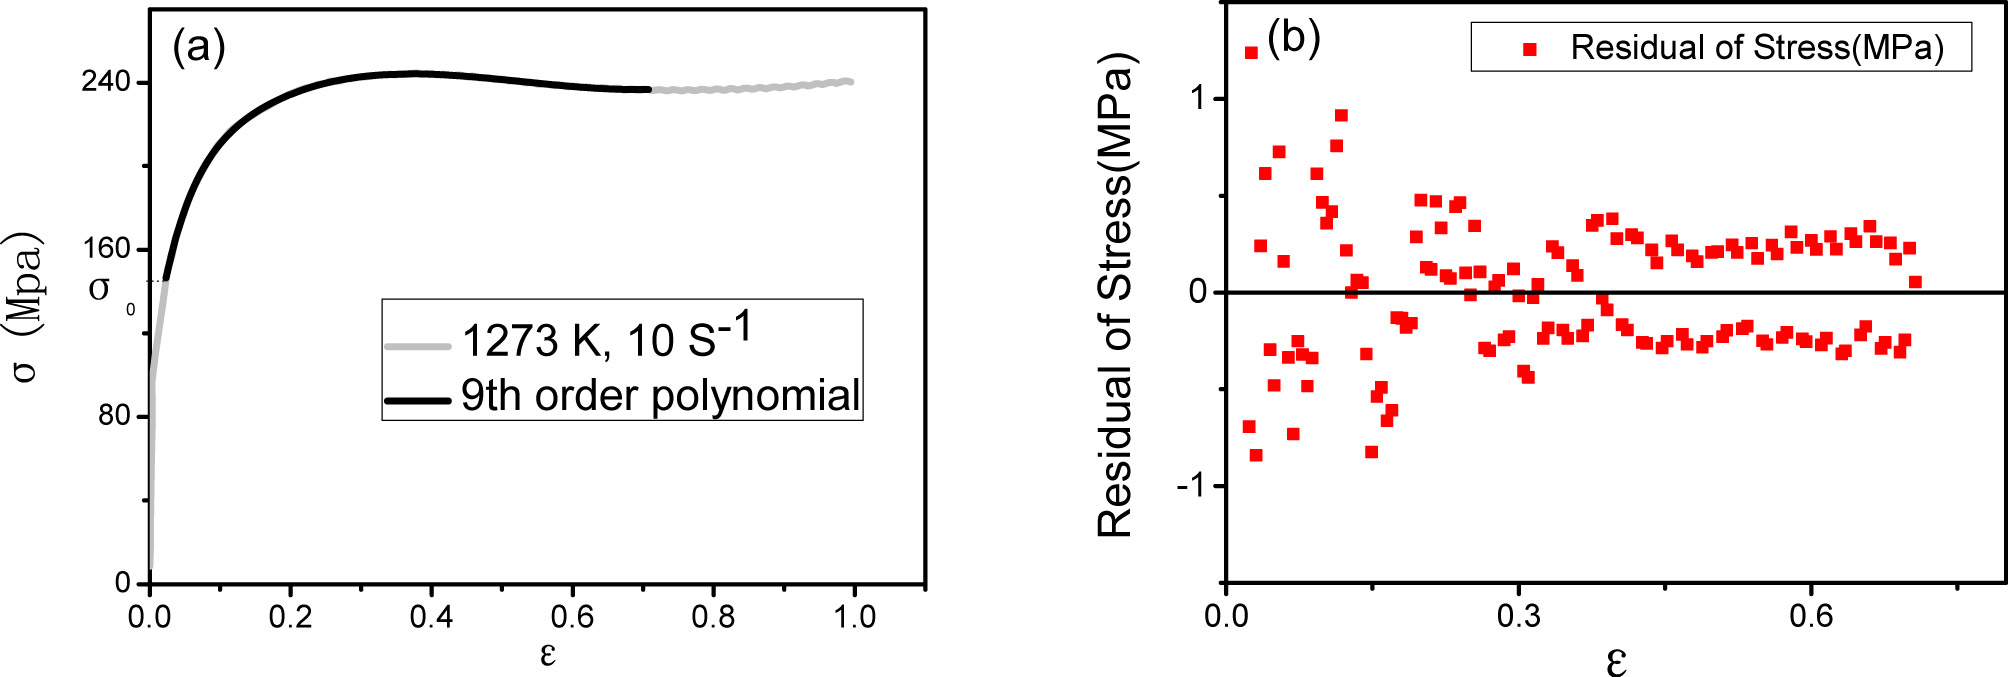
Fitting of the experimental flow stress curve at 1,273 K and a strain rate 10 S−1. (a) The curve was fitted with a ninth-order polynomial. (b) The errors of the fitting values.
In the DRX, the stress corresponding to the critical strain is the critical stress. To determine the values of the critical stress, the strain hardening rate (θ = dσ/dε) was calculated from the flow curves. This method was employed to define the critical stress as shown in Figure 5. If DRX occurs, the rate of reduction of hardening rate will decrease. The critical value of the hardening curve is defined as the critical stress. When the value of ∂2 θ/∂σ 2 is zero, the critical stress σ c could be found under the condition of θ = 0. Once the strain on the specimen is over the critical strain ε c corresponding to the critical stress, the DRX will be initiated, which causes more softening. The peak stress σ p is the maximum stress in the experiment. The value of the peak stress can be defined by the hardening rate θ falling to zero. By using this method, 16 flow curves were analyzed to identify the initiation of the critical stress. According to the critical stress, the corresponding critical strain could be obtained from the flow stress curves. The values of the critical stress and peak stress were presented in Table 1. The ratio between the critical stress and peak stress is linear, depending on the temperature and the strain rate. Therefore, the trends were determined as σ c = 0.94σ p as shown in Figure 6. There is a linear relationship between the critical stress σ c and the peak stress σ p.

Hardening exponent θ versus flow stress.
Values of ε p, σ p, ε c, and σ c under different plane strain experimental conditions
| Strain rate (s−1) | Temperature (K) | ε p | σ p (Mpa) | ε c | σ c (Mpa) |
|---|---|---|---|---|---|
| 1 | 1,373 | 0.375 | 115.16 | 0.270 | 109.76 |
| 1,323 | 0.490 | 160.64 | 0.366 | 155.37 | |
| 1,273 | 0.522 | 181.28 | 0.401 | 179.28 | |
| 1,223 | 0.512 | 202.82 | 0.344 | 198.67 | |
| 5 | 1,373 | 0.414 | 139.50 | 0.362 | 138.46 |
| 1,323 | 0.354 | 187.76 | 0.273 | 180.48 | |
| 1,273 | 0.445 | 204.26 | 0.362 | 201.30 | |
| 1,223 | 0.476 | 233.31 | 0.384 | 229.62 | |
| 10 | 1,373 | 0.327 | 162.68 | 0.221 | 156.30 |
| 1,323 | 0.461 | 211.29 | 0.372 | 207.05 | |
| 1,273 | 0.355 | 244.24 | 0.245 | 239.30 | |
| 1,223 | 0.309 | 267.94 | 0.217 | 262.00 | |
| 50 | 1,373 | 0.225 | 185.68 | 0.151 | 177.31 |
| 1,323 | 0.253 | 247.89 | 0.180 | 238.59 | |
| 1,273 | 0.218 | 282.23 | 0.157 | 268.12 | |
| 1,223 | 0.213 | 312.69 | 0.178 | 290.62 |

The critical stress versus the peak stress.
Figure 7a and b shows variation of the critical stress σ
c with 1/T for different strain rates and with

Variation of (a) the critical stress σ
c with 1/T for different strain rates and (b) with
3.3 Arrhenius equation for flow behavior with DRX
In the hot working process of steel plate, the occurrence of DRX is due to the accumulation of distortion energy in metal caused by work hardening during thermal deformation. While the accumulated energy exceeds the critical value required for DRX, DRX occurs in the deformed grain boundary. The activation energy of DRX, which is the important parameter for the initiation of DRX, could be calculated from the stress–strain curves. The Arrhenius equation is mostly used to study the thermal deformation behavior and deformation activation energy in thermal simulation process [16,17]. In this study, the method is also used to discuss the thermal simulation of plane strain and to establish the DRX constitutive equation of Q890 hot rolled plate during hot deformation. To construct DRX equation, the most important Zener–Hollomon (Z) parameter is introduced, which is expressed in equation (1). The Z parameter is considered as the function of temperature and strain rate on DRX during hot deformation [18]. With the increase of Z parameter, the grain size after DRX decreased, but when the strain rate exceeded the critical value, the grain size increased [19]. The DRX behavior in the process of high temperature deformation can be studied by Z-parameters in both compression and tension states [20]. The Arrhenius equation shown in equation (2) is used to calculate the activation energy of DRX. The gas constant R is 8.31 J/mol K, and the stress factor is 0.012 MPa−1.
When the strain rate is constant and 1/T is a variable, the derivation of the equation (2) is obtained to construct the DRX activation energy equation expressed as

The relationship between
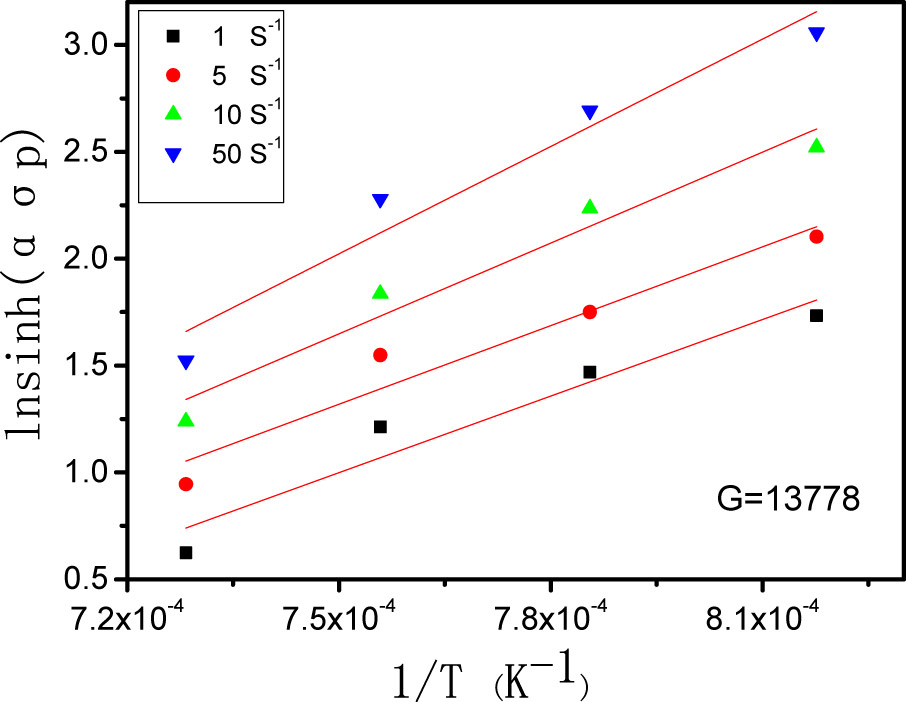
The relationships between lnsinh(ασp) parameter and 1/T.
The parameters Z and {sinh(ασ)} n were calculated by the data of 16 flow stress curves, combing equations (1) and (2). The result is shown in Figure 10, and thus, A 1 value is 9.75 × 10¹³.

The relationship between Z parameter and
With the data of 16 flow stress curves, the process of DRX could be considered with the thermal parameter Z that is combined with the stress, the strain rate, and the temperature. When the strain rate and temperature are constant, the occurrence state of DRX can be judged under different strain conditions.
3.4 DRX kinetic model
When the strain rate is constant, the DRX fraction can be constructed by the Avrami equation, as shown in equation (3).
The value of the peak stress is mainly related to the strain rate and the temperature [21]. So the value of the peak stress can be expressed as

The relationship between ln(ε p) and ln(Z/A 1).
During hot deformation, when DRX occurs, the relationship between the DRX fraction and the stress can be expressed as

The relationship between
The DRX kinetics model can be obtained by the determined m value as shown in equation (4).
To verify the accuracy of the model, the strain rate of 1 S−1 was compared with the simulated values shown in Figure 13. The computed results are in good agreement with the actual values, which shows that the DRX model constructed in this article can effectively predict the DRX evolution process of Q890 steel during the plate hot deformation [26,27].

Comparison of calculated value with experimental ones
The deformation process of plane strain experiments is closer to the deformation process of plate hot rolling when compared with the compression process of cylindrical specimen [28]. Therefore, the dynamic model constructed in this article is more suitable for predicting the DRX process of plate hot deformation. Through the GLEEBLE-3500 testing machine, the true stress–strain curves under different deformation conditions were obtained by isothermal compression of q890 steel plate. It was found that the alloy is prone to DRX under the condition of low strain rate, and the stress–strain curve is of DRX type. When the strain rate is high, the alloy is prone to DRV, and the stress–strain curve is of DRV type; the alloy has positive strain rate sensitivity.
4 Conclusions
In this article, DRX behavior modeling and simulation of q890 steel plate based on the plane strain compression test are proposed. Plane strain hot compression tests of Q890 hot rolled steel plate was carried out under different strain rates and deformation temperatures. In the process of the plane strain thermal simulation experiment, the main factors affecting DRX are strain rate and deformation temperature during hot deformation. Normally, the lower the strain rate and the higher the deformation temperature, the more likely it is to happen DRX. The trend chart between hardening exponent and stress was established by analyzing the data of the stress curves. Thus, the relationship between the critical stress and the peak stress is determined as
The DRX occurs when the accumulated energy of thermal deformation exceeds the activation energy of DRX. The effect of strain rate and temperature on DRX during hot deformation can be studied by the parameter Z. The activation energy of DRX of Q890 steel plate is Q = 394.53 kJ/mol. The DRX kinetics model of Q890 hot rolled steel plate during plane strain thermal simulation was established by using the Avrami equation. By comparing the simulated data with the actual data, the results are in good agreement. The model can effectively predict the DRX process in the hot deformation process of plate metal. Also, SEM and TEM can also be used to study the phase transformation and the second-phase particles in the process of thermal deformation and to further reveal the evolution rule of microstructure.
Acknowledgments
This work was supported by the Natural Science Foundation of Anhui Provincial Education Department (No. KJ2017A068).
References
[1] Mcqueen HJ, Ryan ND. Constitutive analysis in hot working. Mater Sci Eng A. 2002;322(1–2):43–63.10.1016/S0921-5093(01)01117-0Search in Google Scholar
[2] Jonas JJ, Quelennec X, Jiang L, Martin É. The Avrami kinetics of dynamic recrystallization. Acta Mater. 2009;57(9):2748–56.10.1016/j.actamat.2009.02.033Search in Google Scholar
[3] Rossi PLO, Sellars CM. Quantitative metallography of recrystallization. Acta Mater. 1997;45(1):137–48.10.1016/S1359-6454(96)00167-XSearch in Google Scholar
[4] Khoddam S, Hodgson PD. The need to revise the current methods to measure and assess static recrystallization behavior. Mech Mater. 2015;89:85–97.10.1016/j.mechmat.2015.06.008Search in Google Scholar
[5] Quan GZ, Li GS, Chen T, Wang YX, Zhang YW, Zhou J. Dynamic recrystallization kinetics of 42CrMo steel during compression atdifferent temperatures and strain rates. Mater Sci Eng A. 2011;528:4643–51.10.1016/j.msea.2011.02.090Search in Google Scholar
[6] Xu Y, Tang D, Song Y, Pan X. Dynamic recrystallization kinetics model of X70 pipeline steel. Mater Des. 2012;39:168–74.10.1016/j.matdes.2012.02.034Search in Google Scholar
[7] Santosh K, Aashranth B, Dipti S, Davinci MA, Borah U, Bhaduri AK. Influence of nitrogen on kinetics of dynamic recrystallization in Fe–Cr–Ni–Mo steel. Vacuum. 2018;156:20–9.10.1016/j.vacuum.2018.07.010Search in Google Scholar
[8] Soheil S. Determination of flow stress and the critical strain for the onset of dynamic recrystallization using a hyperbolic tangent function. Mater Des. 2014;54:390–3.10.1016/j.matdes.2013.08.055Search in Google Scholar
[9] Aranas C, Foul A, Guo B, Fall A, Jahazi M, Jonas J. Determination of the critical stress for the initiation of dynamic transformation in commercially pure titanium. Scr Mater. 2017;133:83–5.10.1016/j.scriptamat.2017.02.022Search in Google Scholar
[10] Wang J, Yang HT, Wang XG, Xiao H. A new mathematical model for predicting flow stress up to the critical strain during hot deformation. Mater Des. 2015;65:637–43.10.1016/j.matdes.2014.09.072Search in Google Scholar
[11] Zhang D, Liu YZ, Zhou LY, Han Q, Jiang B, Li ZZ. Dynamic recrystallization behavior of GCr15SiMn bearing steel during hot deformation. J Iron Steel Res Int. 2014;21:1042–8.10.1016/S1006-706X(14)60181-3Search in Google Scholar
[12] Luo J, Wang LF, Liu SF, Li MQ. The correlation between the flow behavior and the microstructure evolution during hot working of TC18 alloy. Mater Sci Eng A. 2016;654:213–20.10.1016/j.msea.2015.12.040Search in Google Scholar
[13] Chen MS, Yuan WQ, Li HB, Zou ZH. New insights on the relationship between flow stress softening and dynamic recrystallization behavior of magnesium alloy AZ31B. Mater Charact. 2019;147:173–83.10.1016/j.matchar.2018.10.031Search in Google Scholar
[14] Zhao B, Zhao T, Li G, Lu Q. The kinetics of dynamic recrystallization of a low carbon vanadium-nitride microalloyed steel. Mater Sci Eng A. 2014;604:117–21.10.1016/j.msea.2014.03.019Search in Google Scholar
[15] Zhang C, Zhang L, Xu Q, Xia Y, Shen W. The kinetics and cellular automaton modeling of dynamic recrystallization behavior of a medium carbon Cr–Ni–Mo alloyed steel in hot working process. Mater Sci Eng. 2016;678:33–43.10.1016/j.msea.2016.09.056Search in Google Scholar
[16] Chen L, Sun W, Lin J, Zhao J. Modelling of constitutive relationship, dynamic recrystallization and grain size of 40Cr steel during hot deformation process. Res Phys. 2019;12:784–92.10.1016/j.rinp.2018.12.046Search in Google Scholar
[17] Yan X, Chen C, Zhang XX, Dai HH, Jia JB, Bai ZH. Dynamic recrystallization kinetics and microstructure evolution of an AZ91D magnesium alloy during hot compression. Mater Charact. 2018;145:39–52.10.1016/j.matchar.2018.08.028Search in Google Scholar
[18] Nie X, Dong S, Wang F, Jin L, Dong J. Effects of holding time and Zener–Hollomon parameters on deformation behavior of cast Mg–8Gd–3Y alloy during double-pass hot compression. J Mater Sci Technol. 2018;34(11):69–75.10.1016/j.jmst.2018.03.001Search in Google Scholar
[19] Razmpoosh MH, Zarei-Hanzaki A, Imandoust A. Effect of the Zener–Hollomon parameter on the microstructure evolution of dual phase TWIP steel subjected to friction stir processing. Mater Sci Eng. 2015;638:15–9.10.1016/j.msea.2015.04.022Search in Google Scholar
[20] Shang XQ, Cui ZS, Fu MW. A ductile fracture model considering stress state and Zener–Hollomon parameter for hot deformation of metallic materials. Int J Mech Sci. 2018;144:800–12.10.1016/j.ijmecsci.2018.06.030Search in Google Scholar
[21] Qin FM, Zhu H, Wang ZX, Zhao XD, He WW, Chen HQ. Dislocation and twinning mechanisms for dynamic recrystallization of as-cast Mn18Cr18N steel. Mater Sci Eng A. 2017;684:634–44.10.1016/j.msea.2016.12.095Search in Google Scholar
[22] Souza PM, Mendiguren J, Chao Q, Beladi H, Hodgson PD, Rolfe B. A microstructural based constitutive approach for simulating hot deformation of Ti6Al4V alloy in the α + β phase region. Mater Sci Eng A. 2019;748:30–7.10.1016/j.msea.2019.01.081Search in Google Scholar
[23] Butanda JA, Málaga C, Plaza RG. On the stabilizing effect of chemotaxis on bacterial aggregation patterns. Appl Math Nonlinear Sci. 2017;2(1):157–72.10.21042/AMNS.2017.1.00013Search in Google Scholar
[24] Esteban M, Núñez EP, Torres F. Bifurcation analysis of hysteretic systems with saddle dynamics. Appl Math Nonlinear Sci. 2017;2(2):449–64.10.21042/AMNS.2017.2.00036Search in Google Scholar
[25] Gao W, Wang W. A tight neighborhood union condition on fractional (g, f, n′, m)-critical deleted graphs. Colloq Math. 2017;149:291–8.10.4064/cm6959-8-2016Search in Google Scholar
[26] Gao W, Wang W. New isolated toughness condition for fractional $(g, f, n)$-critical graph. Colloq Math. 2017;147:55–65.10.4064/cm6713-8-2016Search in Google Scholar
[27] Sudhakar S, Francis S, Balaji V. Odd mean labeling for two star graph. Appl Math Nonlinear Sci. 2017;2(1):195–200.10.21042/AMNS.2017.1.00016Search in Google Scholar
[28] Zead I, Saad M, Sanad M, Bhary MM, Gadallah K, Shokry A. Photometric and spectroscopic studies of the intermediate-polar cataclysmic system DQ her. Appl Math Nonlinear Sci. 2017;2(1):181–94.10.21042/AMNS.2017.1.00015Search in Google Scholar
© 2020 Lei Yang and Yi-Zhu He, published by De Gruyter
This work is licensed under the Creative Commons Attribution 4.0 International License.
Articles in the same Issue
- Regular Articles
- Model of electric charge distribution in the trap of a close-contact TENG system
- Dynamics of Online Collective Attention as Hawkes Self-exciting Process
- Enhanced Entanglement in Hybrid Cavity Mediated by a Two-way Coupled Quantum Dot
- The nonlinear integro-differential Ito dynamical equation via three modified mathematical methods and its analytical solutions
- Diagnostic model of low visibility events based on C4.5 algorithm
- Electronic temperature characteristics of laser-induced Fe plasma in fruits
- Comparative study of heat transfer enhancement on liquid-vapor separation plate condenser
- Characterization of the effects of a plasma injector driven by AC dielectric barrier discharge on ethylene-air diffusion flame structure
- Impact of double-diffusive convection and motile gyrotactic microorganisms on magnetohydrodynamics bioconvection tangent hyperbolic nanofluid
- Dependence of the crossover zone on the regularization method in the two-flavor Nambu–Jona-Lasinio model
- Novel numerical analysis for nonlinear advection–reaction–diffusion systems
- Heuristic decision of planned shop visit products based on similar reasoning method: From the perspective of organizational quality-specific immune
- Two-dimensional flow field distribution characteristics of flocking drainage pipes in tunnel
- Dynamic triaxial constitutive model for rock subjected to initial stress
- Automatic target recognition method for multitemporal remote sensing image
- Gaussons: optical solitons with log-law nonlinearity by Laplace–Adomian decomposition method
- Adaptive magnetic suspension anti-rolling device based on frequency modulation
- Dynamic response characteristics of 93W alloy with a spherical structure
- The heuristic model of energy propagation in free space, based on the detection of a current induced in a conductor inside a continuously covered conducting enclosure by an external radio frequency source
- Microchannel filter for air purification
- An explicit representation for the axisymmetric solutions of the free Maxwell equations
- Floquet analysis of linear dynamic RLC circuits
- Subpixel matching method for remote sensing image of ground features based on geographic information
- K-band luminosity–density relation at fixed parameters or for different galaxy families
- Effect of forward expansion angle on film cooling characteristics of shaped holes
- Analysis of the overvoltage cooperative control strategy for the small hydropower distribution network
- Stable walking of biped robot based on center of mass trajectory control
- Modeling and simulation of dynamic recrystallization behavior for Q890 steel plate based on plane strain compression tests
- Edge effect of multi-degree-of-freedom oscillatory actuator driven by vector control
- The effect of guide vane type on performance of multistage energy recovery hydraulic turbine (MERHT)
- Development of a generic framework for lumped parameter modeling
- Optimal control for generating excited state expansion in ring potential
- The phase inversion mechanism of the pH-sensitive reversible invert emulsion from w/o to o/w
- 3D bending simulation and mechanical properties of the OLED bending area
- Resonance overvoltage control algorithms in long cable frequency conversion drive based on discrete mathematics
- The measure of irregularities of nanosheets
- The predicted load balancing algorithm based on the dynamic exponential smoothing
- Influence of different seismic motion input modes on the performance of isolated structures with different seismic measures
- A comparative study of cohesive zone models for predicting delamination fracture behaviors of arterial wall
- Analysis on dynamic feature of cross arm light weighting for photovoltaic panel cleaning device in power station based on power correlation
- Some probability effects in the classical context
- Thermosoluted Marangoni convective flow towards a permeable Riga surface
- Simultaneous measurement of ionizing radiation and heart rate using a smartphone camera
- On the relations between some well-known methods and the projective Riccati equations
- Application of energy dissipation and damping structure in the reinforcement of shear wall in concrete engineering
- On-line detection algorithm of ore grade change in grinding grading system
- Testing algorithm for heat transfer performance of nanofluid-filled heat pipe based on neural network
- New optical solitons of conformable resonant nonlinear Schrödinger’s equation
- Numerical investigations of a new singular second-order nonlinear coupled functional Lane–Emden model
- Circularly symmetric algorithm for UWB RF signal receiving channel based on noise cancellation
- CH4 dissociation on the Pd/Cu(111) surface alloy: A DFT study
- On some novel exact solutions to the time fractional (2 + 1) dimensional Konopelchenko–Dubrovsky system arising in physical science
- An optimal system of group-invariant solutions and conserved quantities of a nonlinear fifth-order integrable equation
- Mining reasonable distance of horizontal concave slope based on variable scale chaotic algorithms
- Mathematical models for information classification and recognition of multi-target optical remote sensing images
- Hopkinson rod test results and constitutive description of TRIP780 steel resistance spot welding material
- Computational exploration for radiative flow of Sutterby nanofluid with variable temperature-dependent thermal conductivity and diffusion coefficient
- Analytical solution of one-dimensional Pennes’ bioheat equation
- MHD squeezed Darcy–Forchheimer nanofluid flow between two h–distance apart horizontal plates
- Analysis of irregularity measures of zigzag, rhombic, and honeycomb benzenoid systems
- A clustering algorithm based on nonuniform partition for WSNs
- An extension of Gronwall inequality in the theory of bodies with voids
- Rheological properties of oil–water Pickering emulsion stabilized by Fe3O4 solid nanoparticles
- Review Article
- Sine Topp-Leone-G family of distributions: Theory and applications
- Review of research, development and application of photovoltaic/thermal water systems
- Special Issue on Fundamental Physics of Thermal Transports and Energy Conversions
- Numerical analysis of sulfur dioxide absorption in water droplets
- Special Issue on Transport phenomena and thermal analysis in micro/nano-scale structure surfaces - Part I
- Random pore structure and REV scale flow analysis of engine particulate filter based on LBM
- Prediction of capillary suction in porous media based on micro-CT technology and B–C model
- Energy equilibrium analysis in the effervescent atomization
- Experimental investigation on steam/nitrogen condensation characteristics inside horizontal enhanced condensation channels
- Experimental analysis and ANN prediction on performances of finned oval-tube heat exchanger under different air inlet angles with limited experimental data
- Investigation on thermal-hydraulic performance prediction of a new parallel-flow shell and tube heat exchanger with different surrogate models
- Comparative study of the thermal performance of four different parallel flow shell and tube heat exchangers with different performance indicators
- Optimization of SCR inflow uniformity based on CFD simulation
- Kinetics and thermodynamics of SO2 adsorption on metal-loaded multiwalled carbon nanotubes
- Effect of the inner-surface baffles on the tangential acoustic mode in the cylindrical combustor
- Special Issue on Future challenges of advanced computational modeling on nonlinear physical phenomena - Part I
- Conserved vectors with conformable derivative for certain systems of partial differential equations with physical applications
- Some new extensions for fractional integral operator having exponential in the kernel and their applications in physical systems
- Exact optical solitons of the perturbed nonlinear Schrödinger–Hirota equation with Kerr law nonlinearity in nonlinear fiber optics
- Analytical mathematical schemes: Circular rod grounded via transverse Poisson’s effect and extensive wave propagation on the surface of water
- Closed-form wave structures of the space-time fractional Hirota–Satsuma coupled KdV equation with nonlinear physical phenomena
- Some misinterpretations and lack of understanding in differential operators with no singular kernels
- Stable solutions to the nonlinear RLC transmission line equation and the Sinh–Poisson equation arising in mathematical physics
- Calculation of focal values for first-order non-autonomous equation with algebraic and trigonometric coefficients
- Influence of interfacial electrokinetic on MHD radiative nanofluid flow in a permeable microchannel with Brownian motion and thermophoresis effects
- Standard routine techniques of modeling of tick-borne encephalitis
- Fractional residual power series method for the analytical and approximate studies of fractional physical phenomena
- Exact solutions of space–time fractional KdV–MKdV equation and Konopelchenko–Dubrovsky equation
- Approximate analytical fractional view of convection–diffusion equations
- Heat and mass transport investigation in radiative and chemically reacting fluid over a differentially heated surface and internal heating
- On solitary wave solutions of a peptide group system with higher order saturable nonlinearity
- Extension of optimal homotopy asymptotic method with use of Daftardar–Jeffery polynomials to Hirota–Satsuma coupled system of Korteweg–de Vries equations
- Unsteady nano-bioconvective channel flow with effect of nth order chemical reaction
- On the flow of MHD generalized maxwell fluid via porous rectangular duct
- Study on the applications of two analytical methods for the construction of traveling wave solutions of the modified equal width equation
- Numerical solution of two-term time-fractional PDE models arising in mathematical physics using local meshless method
- A powerful numerical technique for treating twelfth-order boundary value problems
- Fundamental solutions for the long–short-wave interaction system
- Role of fractal-fractional operators in modeling of rubella epidemic with optimized orders
- Exact solutions of the Laplace fractional boundary value problems via natural decomposition method
- Special Issue on 19th International Symposium on Electromagnetic Fields in Mechatronics, Electrical and Electronic Engineering
- Joint use of eddy current imaging and fuzzy similarities to assess the integrity of steel plates
- Uncertainty quantification in the design of wireless power transfer systems
- Influence of unequal stator tooth width on the performance of outer-rotor permanent magnet machines
- New elements within finite element modeling of magnetostriction phenomenon in BLDC motor
- Evaluation of localized heat transfer coefficient for induction heating apparatus by thermal fluid analysis based on the HSMAC method
- Experimental set up for magnetomechanical measurements with a closed flux path sample
- Influence of the earth connections of the PWM drive on the voltage constraints endured by the motor insulation
- High temperature machine: Characterization of materials for the electrical insulation
- Architecture choices for high-temperature synchronous machines
- Analytical study of air-gap surface force – application to electrical machines
- High-power density induction machines with increased windings temperature
- Influence of modern magnetic and insulation materials on dimensions and losses of large induction machines
- New emotional model environment for navigation in a virtual reality
- Performance comparison of axial-flux switched reluctance machines with non-oriented and grain-oriented electrical steel rotors
- Erratum
- Erratum to “Conserved vectors with conformable derivative for certain systems of partial differential equations with physical applications”