Analysis on dynamic feature of cross arm light weighting for photovoltaic panel cleaning device in power station based on power correlation
-
Yuqing Hou
 ,
Yu Fu
,
Yu Fu

Abstract
The surface cleanliness of photovoltaic (PV) panel has an important impact on the efficiency of power generation. The excessive mass of cross arm has always affected the use of cleaning device. Based on the power correlation analysis, the dynamic characteristics of cross arm lightweight of PV panel cleaning device in the power station are proposed. Using the theory of information fusion to weigh it as a comprehensive influence factor, the power prediction value of the model output is transmitted to the cleaning device in real time: design the cleaning device of PV panel and optimize the topology of the mechanical cross arm. The experimental results show that the PV power is related to many meteorological factors, and the lightweight design of the cross arm is more conducive to the natural frequency and mode shape analysis of each mode of the cross arm structure.
1 Introduction
The power generation efficiency of the solar PV system is seriously reduced due to the surface ash problem [1]. The ash deposition effect of PV panel is one of the biggest problems encountered in the large-scale application of PV power generation [2]. It is of great practical significance to realize the efficient operation of cleaning devices [3]. A large-scale cleaning device is generally composed of mobile device, mechanical arm device and end executive part (usually disc brush or roller brush), etc. [4]. Due to the size and structure of the mechanical arm, the performance of cleaning device is greatly affected [5]; how to realize lightweight design and ensure its sufficient mechanical properties through structural optimization is of great significance to mechanical structure design. With the development of computer and the improvement of analysis efficiency, the feedback mechanism of topology optimization is introduced to directly apply the analyzed information to guide design and improve design efficiency.
Chen et al. [6] used the topological optimization method to optimize the machine tool table, obtained the vibration mode by establishing the finite element model, analyzed it with the MEscope software and further improved the natural frequency of the machine tool table; Zhang et al. [7] analyzed and optimized the robot arm, using ANSYS Workbench carries on the finite element analysis to the manipulator, and carries on the hollow design to the manipulator, realizes the arm mass reduction; Zhao et al. [8] optimized the configuration of 9-DOF super-redundant series manipulator, obtained the flexibility algorithm by numerical simulation, analyzed the configuration design scheme of the manipulator and selected the optimal scheme for the refinement of the manipulator joint to achieve the accuracy of the workspace of the manipulator; Li and Hou [9] carried out topology optimization design for the two degree-of-freedom ammunition transmission manipulator, established its dynamic model and joint simulation system, used the topology optimization technology of variable density method to reduce the mass of the left and right arms of the manipulator, and realized the lightweight of the manipulator; Sun et al. (2018): The topological optimization method is adopted to carry out the lightweight design of the ram components of the electrochemical machining machine tool, and the stress and deformation of the modified components are analyzed. Using the topological optimization method to establish optimization model, the layout and structure size of stiffeners are reasonable, and the mass of this part is reduced. Zhang et al. [10] optimized the vibration suppression of the parameters of the series manipulator under the impact of the hinge and the heavy excitation of the arm. According to the calculation of the accuracy at the joints of the manipulator, get the different joint positions of the manipulator, analyze the corresponding mechanical characteristics and achieve the vibration suppression effect of the dynamic operation of the multihinge clearance manipulator; Zhang et al. [11] optimized the accuracy of the articulated synchronous belt deceleration manipulator, established its accuracy model and obtained its uncertain parameters and used the first-order second moment method to analyze the reliability of the model, so as to reduce the error of the manipulator. In the design of Boeing 787, Boeing carried out topology, size and shape optimization for its wing leading edge structure. First, the material distribution was obtained through topology optimization; second, the structure close to the requirements was obtained through size and shape optimization; finally, the safety margin of the wing leading edge structure was calculated by traditional methods, and 50 unique rib designs were obtained through optimization, realizing the aircraft’s lightweight design of the wing leading edge structure. Airbus uses the finite element simulation analysis of A320 and A321, and the fuselage structure designed by using the analysis results is very stable, which greatly increases the reliability of the aircraft structure. Eads used finite element analysis technology to optimize the landing system parameters of the Mars probe, which reduced the acceleration load of the Mars probe by 93% and the stress of the air bag by 44%, which could not be completed by the physical test. Finite element analysis can effectively solve this problem.
In this paper, based on the analysis of the power-related cleaning principle of the PV panel cleaning device in the power station, the topology optimization of the cross arm of the PV panel cleaning device in the power station is carried out to solve the problem of the overmass of the cross arm, and the modal analysis of the optimized cross arm is carried out and its mechanical properties are analyzed.
2 Materials and methods
In the process of optimization of cross arm of PV panel cleaning device in the power station, it is necessary to analyze the correlation of PV power based on the theory of information fusion, predict the model power through back propagation (BP) neural network, design the cleaning scheme of PV panel cleaning device, reduce its mass, optimize the topological structure of cross arm and improve the efficiency of PV panel power generation. The specific process is shown in Figure 1.

Flow chart of the photovoltaic cleaning device optimization system.
2.1 Theory of photovoltaic power information fusion
2.1.1 Correlation analysis of photovoltaic power
For the PV power generation system composed of solar panels, if the angle of panels is fixed, the output power
where η is the photoelectric conversion efficiency of PV cell (W m−2), S is the total area of PV cell (m2), I is the light radiation intensity (W/m2) and T
0 is the environment temperature (K). When the PV structure is determined, the photoelectric conversion efficiency and area are constant, so the PV output power is related to the light radiation intensity and environmental temperature. In fact, the PV output power is not only dependent on the light radiation intensity and environment temperature but also related to some meteorological factors [12]. Some scholars analyzed the correlation of PV power by the distance analysis method of Pearson (Pearson correlation coefficient) similarity and concluded that the hourly power generation G of the PV output is related to temperature T
a, air pressure
Correlation between photovoltaic power and meteorological factors
| Meteorological parameters | Related characteristics |
|---|---|
|
|
0.516 |
|
|
−0.367 |
|
|
−0.546 |
|
|
0.300 |
|
|
−0.306 |
|
|
−0.193 |
|
|
0.920 |
|
|
0.999 |
From Table 1, we can see that the greatest impact on PV power is the total solar radiation
2.1.2 Theory of information fusion
The information fusion was originally known as data fusion. It was originated from the sonar signal processing system funded by the United States Department of Defense in 1973 [13]. The information fusion is an information processing process that the data and information obtained from single and multiple information sources are correlated and integrated to obtain accurate location and identity estimates, while the situation and threat are comprehensively and timely assessed. It is also a continuous refining process of evaluation for information source demand [14]. In this article, many meteorological factors affecting PV power are treated as information sources, and then these data are fused into the reference information in a certain relationship [15]. The comprehensive information is regarded as the input of network model. Then, it is trained to reduce the input variables of model, so as to reduce the complexity of model and fully consider the influence of meteorological factors on PV power. Based on the correlation analysis, low cloud amount C
1 is used as the reference magnification (−1); the proportion relationship among the variables
where
where
2.2 Design of BP neural network model
The development of neural network includes the determination of the number of neurons in the hidden layer, the data source of neural network, the data division and the data preprocessing. Some key problems, such as the initialization of the weight parameter and the principle. Through the above information fusion to obtain data, these channel data are divided into input and output, as the training data and test data of BP neural network [16].
In the process of cross arm optimization of PV panel cleaning device in the power station, submodels need to be established according to different weather conditions, but this modeling method is more complex. In this paper, BP neural network is used to train its data [17]. Because BP neural network has strong nonlinear mapping, learning and self-adaptive ability, this modeling method is different from previous submodels established according to weather division, such as sunny and rainy days, which do not need to classify its submodels. Its structure principle is shown in Figure 2.

Model of BP neural network.
In Figure 2, the number of input nodes is 13, including the average comprehensive influencing factors (
The PV power prediction model based on BP neural network can predict the power P of t + 1 and, thus, to get the optimal operation of PV panel with clean device. First, the historical power collected by the PV power generation system and meteorological factors are processed by information fusion, and then, the network model is trained by the processed data. Finally, the PV output is predicted by the trained network model [18]. The prediction method is short-term hourly prediction. The predicted power is applied to the optimal operation of PV panels.
This paper analyzes the correlation between the output power of PV power generation and meteorological factors and transmits the predicted value of BP neural network to the cleaning device in real time. This lays a foundation for the analysis of dynamic characteristics of the lightweight cross arm of PV panel cleaning device in the power station.
2.3 Photovoltaic panel cleaning device
In order to solve the problem about powder deposition on PV panel, a PV panel cleaning device is designed. The scheme of timely cleaning the powder on the surface of PV modules is shown in Figure 3.

Schematic diagram of the photovoltaic panel cleaning device.
The cleaning device is mainly divided into two parts: the cleaning head frame and the arm frame. In the figure, (1) is the cross arm, (2) is the support arm, (3) is the drive arm, and the above three parts constitute the arm frame. No. (4) is the support and No. (5) is the cleaning head frame. The cleaning head frame is the end actuator of the leaning device, which is installed at the end of the cross arm. The cleaning device is installed on the crawler mobile platform, which can realize the cleaning operation of continuous PV panels. The arm adopts the articulation parallelogram mechanism. The drive arm rotates and drives the cleaning head frame to extend and retract. The cleaning head frame always keeps a fixed position parallel to the PV panel. A water spray device and a rotary brush are installed on the cleaning head frame to clean the powder. In order to reduce the mass, the cleaning head frame is assembled with industrial aluminum profiles. The brush is driven by a motor.
In the design of arm frame, the lengths of the two sides of parallelogram mechanism are 903.8mm and 330 mm, respectively. The initial posture of the cleaning head frame is at an angle of 40 degrees with the horizontal plane, and it is consistent with the installation angle of PV panel along the length direction. There is an angle between the width direction and the PV panel, which can be adjusted slightly. The cleaning device is installed on the crawler hydraulic-driven mobile platform [19]. According to the field assembly and test results, the mass of the existing cleaning device is too large, and the load of the mobile platform is also large [20]. A cleaning head frame is installed on the front end of cross arm, which is a cantilever structure. The mass of cross arm is 65.02 kg, accounting for about half of the mass of arm frame. It is significant to improve the performance of cleaning head by optimizing the topological structure and reduce the mass.
2.4 Topology optimization of cross arm
The total mass of no. 45 steel material used in the arm frame is 123 kg, and the cross arm has a large mass (65.02 kg), which accounts for half of the mass of frame, so there is a large space for improvement. Therefore, shape optimization module of the finite element software ANSYS is used for topology optimization of structure.
The optimization scheme is shown as follows:
By analyzing the force on cross arm, we can see that the cleaning head load on both sides of the end of cross arm is about 1,200 N. The horizontal resistance which is opposite to the forward direction caused by the friction between brush and PV plate is about 300 N. In the cleaning work with normal fixed posture, two hinges at the back-end of cross arm are fixed. In the environment of Pro/Engineer, the model of cross arm is built. The finite element analysis software ANSYS system is imported. The material is No. 45 steel.
In ANSYS environment, it is necessary to fix the circular hole connection surface of constraining the cross arm. Then, we apply 600 N force along Z-direction on both sides of the end of cross arm, respectively, so as to simulate the gravity of the cleaning head. Meanwhile, we apply 300 N force along X-direction to simulate the brushing friction force when working. The constraint and load are shown in Figure 4.

Constraint and load.
In order to minimize the mass and power, the mass removal percentage is set as 35%. After the solution is completed, the topological structure and six main removable regions are obtained. See Figure 5:

Suggests removing the area.
In Figure 5, the shadow part is the removal area. Considering the industrial processing and stress concentration, the cross arm is optimized to directly remove No. 1 area and reduce the size of No. 2 area. In No. 3–No. 5 areas, a rectangular removal area with edge chamfering is designed. In No. 6 area, the smaller part is removed, and the removal areas on both sides are regarded as a support.
3 Results
3.1 Correlation of photovoltaic power
In order to prove the effectiveness of the proposed method, the prediction model used MATLAB to realize the iteration and calculation of the neural network. The actual PV power data are from the roof PV power generation system of a company. The meteorological data are from the local weather station. The generating power and comprehensive impact factors in the day before the forecasting date and the comprehensive impact factors in the forecasting date are taken as the input of model. The output of model is the predicted PV output power in the forecasting day. The actual power of typical weather type is compared with the predicted power, where the error allowed range is [−4, 4]; the results are shown in Figure 6.
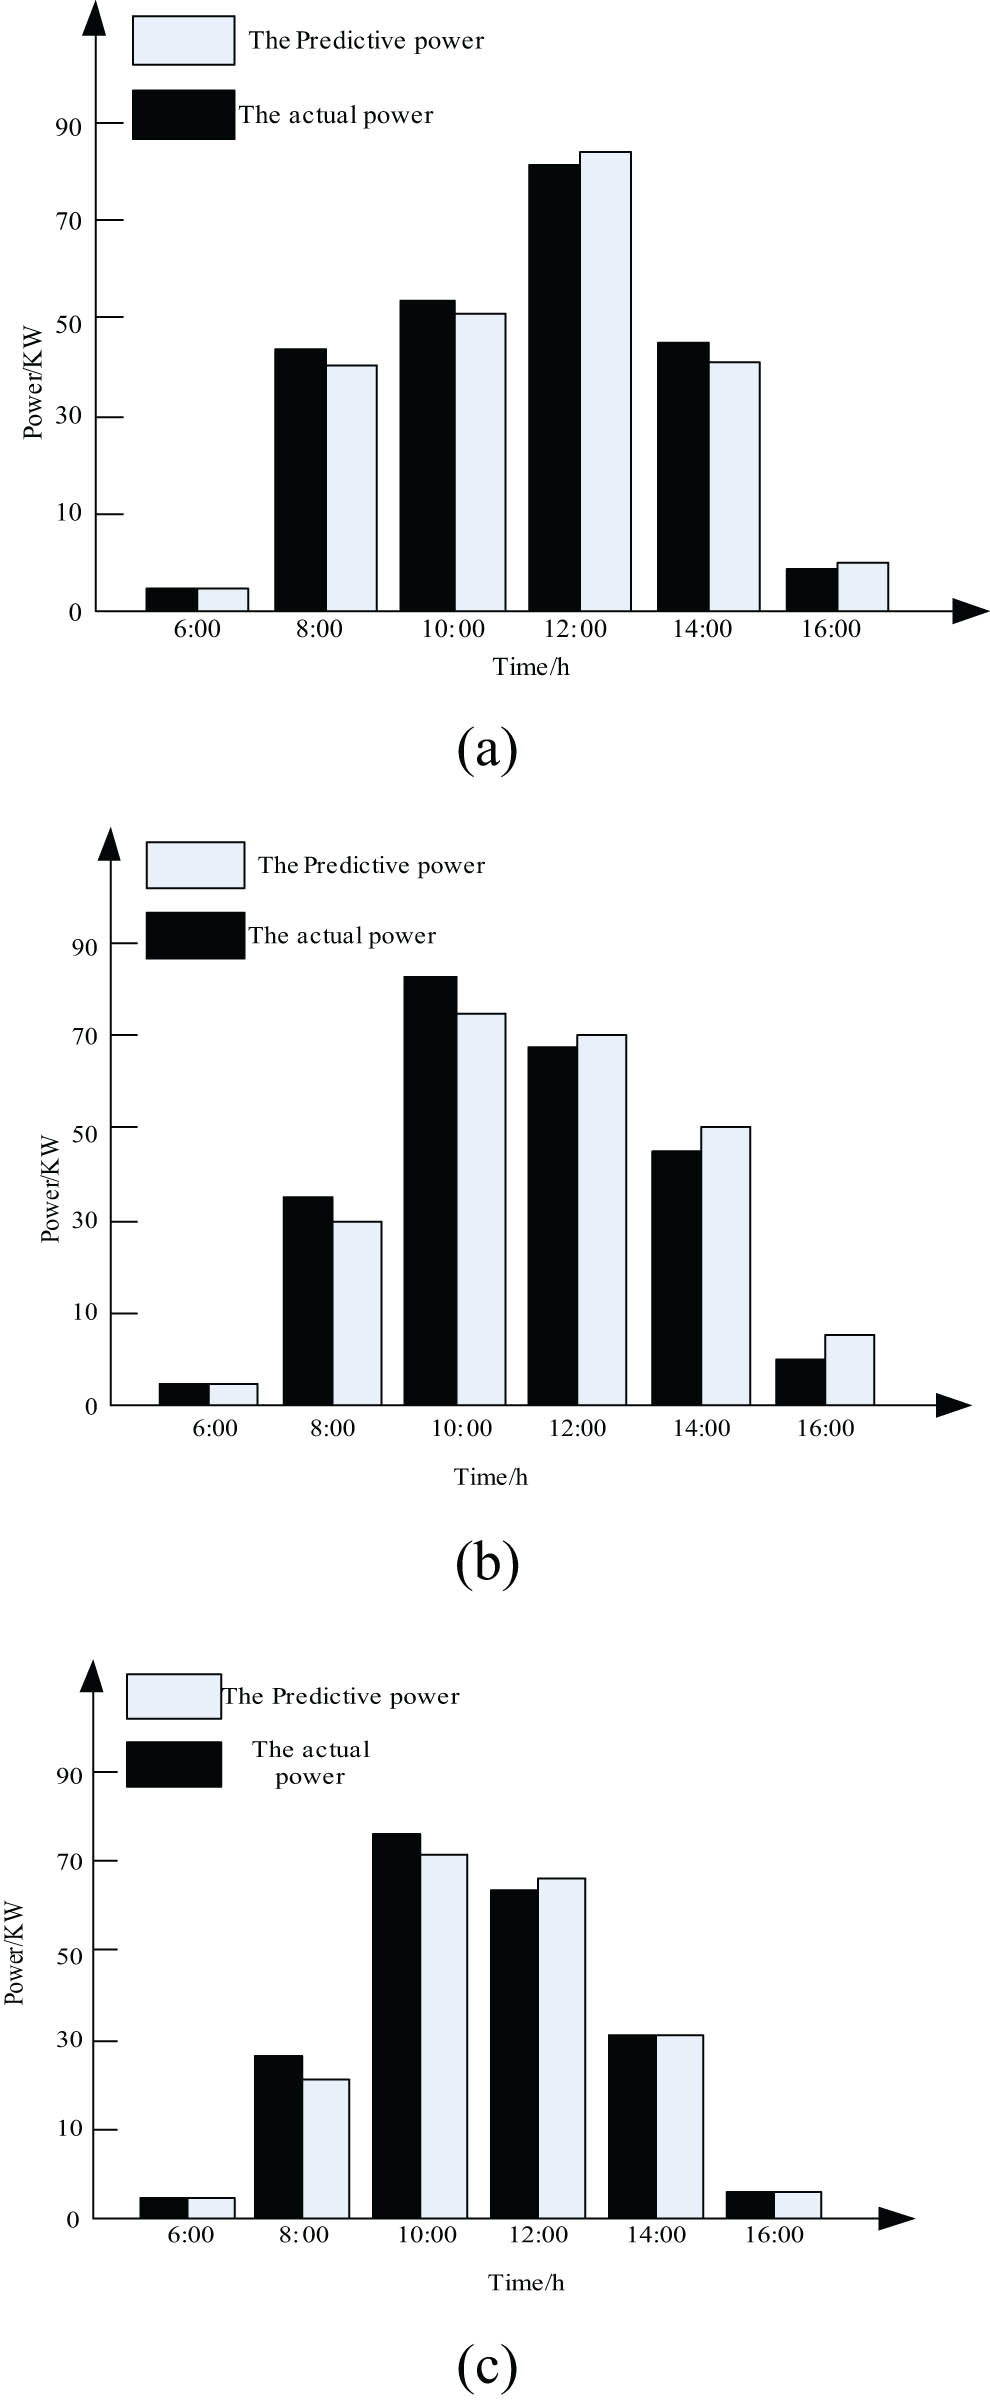
Comparison of predicted power and actual power: (a) sunny day, (b) rainy day and (c) cloudy day.
In Figure 6, panel (a) shows the prediction results of sunny days. The horizontal axis represents the time, from 6:00 a.m. to 16:00 p.m., respectively, with an interval of 1 h. The vertical axis is the output power. From Figure 6(a), it can be seen that the maximum error value of the model for sunny days is [− 2, 2], with high prediction accuracy. Figure 6(b) shows the forecast results for rainy days. The maximum error value is [−8,8]. Due to the complicated weather changes in rainy days and the large fluctuation of various meteorological data, there is a certain error between the predicted power and the actual power. Reducing this error can be obtained by more accurate obtaining of meteorological data. Figure 6(c) shows the cloudy prediction results. Because it is difficult to measure the cloud amount in cloudy weather, the maximum error value is [−4,4]. There is a certain error between the predicted power and the actual power, but the error is within the allowable range.
3.2 Dynamic characteristics analysis of lightweight cross arm of photovoltaic panel cleaning device
3.2.1 Modal analysis
Modal analysis is an important method of dynamic analysis on structure. It is the basis of dynamics analysis such as transient response analysis and harmonic response analysis to grasp the natural frequency and the mode of vibration of the mechanical structure through modal analysis. Four connecting holes of cross arm are set as the fixed constraints. In the environment of ANSYS, the modal analysis for original scheme and optimization scheme is carried out. The complete method is used to calculate natural frequencies and vibration modes of the first six orders. The effective modal masses in six directions are shown in Table 2.
Effective modal mass in each direction of beam of the original plan and optimization scheme
| Plan | Degree of freedom direction | X | Y | Z | R X | R Y | R Z |
|---|---|---|---|---|---|---|---|
| The original plan | 1 phase | 0.475090 | 2.55 × 10⁻⁷ | 3.74 × 10⁻⁶ | 0.693438 | 536.506 | 86150.1 |
| 2 phase | 3.39 × 10⁻⁶ | 3.12 × 10⁻⁸ | 0.453912 | 86076 | 92.0293 | 5.44602 | |
| 3 phase | 0.116479 | 1.20 × 10⁻² | 2.16 × 10⁻⁷ | 1.71 × 10⁻² | 646.368 | 4865.79 | |
| 4 phase | 9.31 × 10⁻⁸ | 2.95 × 10⁻¹⁰ | 0.143046 | 6245.16 | 29.2907 | 23.3094 | |
| 5 phase | 7.81 × 10⁻² | 3.07 × 10⁻⁶ | 6.98 × 10⁻⁷ | 2.04 × 10⁻² | 6.57672 | 1930.34 | |
| 6 phase | 4.21 × 10⁻⁷ | 2.73 × 10⁻³ | 5.70 × 10⁻² | 1466.97 | 11.5634 | 0.67238 | |
| Optimization scheme | 1 phase | 0.511987 | 1.19 × 10⁻⁸ | 1.99 × 10⁻⁵ | 2.95016 | 469.016 | 62490 |
| 2 phase | 2.33 × 10⁻⁵ | 9.55 × 10⁻⁵ | 0.443693 | 65831.5 | 75.0460 | 9.51522 | |
| 3 phase | 0.247503 | 0.247503 | 2.53 × 10⁻⁶ | 0.206445 | 415.685 | 7803.26 | |
| 4 phase | 6.64 × 10⁻⁶ | 6.64 × 10⁻⁶ | 0.155359 | 5299.83 | 24.596 | 16.5462 | |
| 5 phase | 5.92 × 10⁻² | 5.92 × 10⁻² | 1.18 × 10⁻³ | 24.722 | 8.77072 | 1437.82 | |
| 6 phase | 7.19 × 10⁻³ | 7.19 × 10⁻³ | 4.04 × 10⁻² | 780.465 | 0.853586 | 116.217 |
Compared with the original scheme, the effective modal mass of each order of free degree in optimized scheme is changed, but it is relatively small. The direction of free degrees of the first four orders has not changed basically. The maximum rotational degrees of freedom of the fifth order are R x . The order of R Z and R y is reversed. The maximum rotational degrees of freedom of the sixth order is still R x . The order of R y and R z is reversed. Combining with two schemes, it can be concluded that in the first mode, the values in X and R z directions are larger, which is presented as bending along X-direction around Z-axis. In the second mode, the values in Z and R x directions are larger, which is represented as bending in Z-direction around X axis. In the third mode, the values in R y , R z and X directions are larger, which is mainly represented by twisting around Y-axis, and the bending along X-axis around Z-axis. In the fourth-order mode, the values of Z and R x directions are larger, which is represented by bending along Z and Y directions around X axis. In the fifth-order mode, the values of R z , X and R y are larger, which are represented by the bending along X-direction around Z axis and the twisting around Y axis. In the optimization scheme, the values of R z , X and R x are larger, which are represented by the bending along X-direction around Z axis and the twisting around X axis. In the sixth-order mode, the values of R x , R y and Z are larger, which are represented by bending around Y-axis along Z-direction and twisting around X-axis. In the optimized scheme, the values of R x , R z and X are larger, which are represented by bending around Z-axis and twisting around X-axis.
3.2.2 Dynamic feature analysis
3.2.2.1 Dynamic response under sinusoidal wave load impact
The cross arm is subject to a static load of −300 N in X-direction, and the static load is constant. In Z-direction, a force of 400–200 × sin (7,200t) is applied to the end surfaces of cross arm.Four connection holes of cross arm are fixed, as shown in Figure 7(a). The number of load steps is 500, and the total time is 1 s. After the solution is completed, the maximum displacement node 4,378 and the maximum stress node 130 are extracted as the observation nodes. Figure 7(b) shows the positions of observation points. MATLAB (matrix and laboratory) is used to draw the time history trend of output results.

Load constraints and schemes for two important node locations: (a) schematic representation of load constraint and (b) two important node locations.
Figure 8 shows the displacement and velocity time history of node 4,378. Figure 8(a) shows that the displacement increases to 3.8 mm after 0–0.1 s, and it decreases to a peak value (3.5 mm) after 0.2 s. After that, it maintains a maximum peak value (3.5 mm) for stable sinusoidal vibration. According to the time history trend of node velocity in Figure 8(b), the appearance time of peak value is the same as the appearance time of maximum displacement. It is 325 mm/s in 0.1 s, and then, the speed is reduced to about 175 mm/s after about 0.2 s. After that, it becomes a stable sinusoidal vibration.
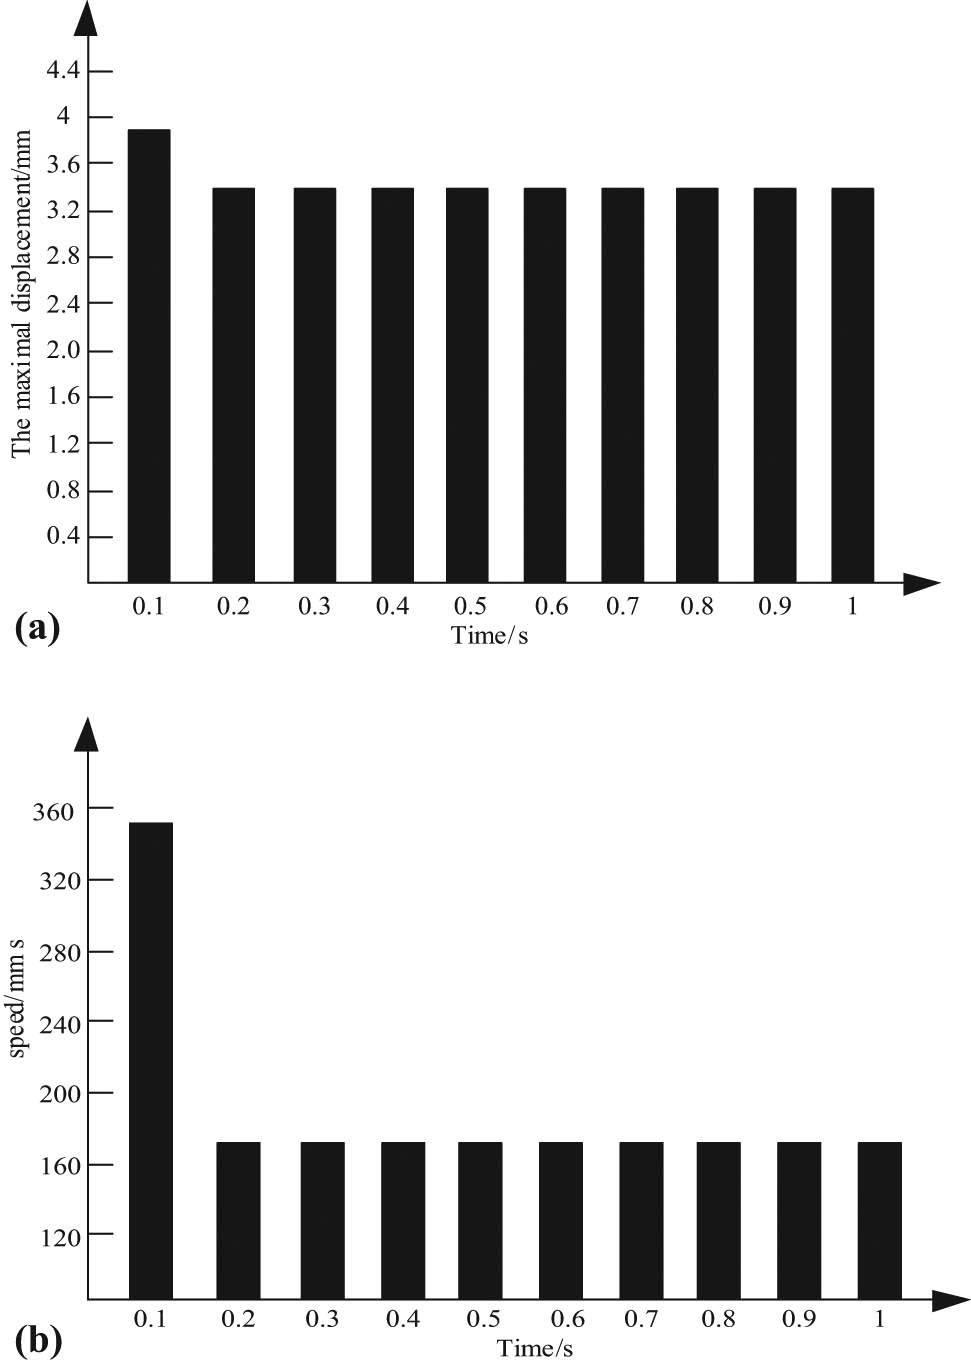
Displacement and velocity time history of node 7,378: (a) node 4,378 displacement time history curve and (b) node 4,378 speed time history curve.
Figure 9(a) shows the change trend of acceleration time history response of node 130. Figure 9(b) shows the change trend of stress time history response. Their change trends are basically the same. When the stress reaches the maximum value in 0.1 s, it is 52 MPa (megapascals), and then, the amplitude gradually decreases to 22 MPa (megapascals) after 0.3 s. After that, the curve is stable sinusoidal vibration. The maximum equivalent stress is 52 MPa (megapascals) in the process of dynamic incentive, which is less than the limit of yielding of material. The safety factor is relatively large.

Node 130 acceleration and stress time history curve: (a) node 130 acceleration time history and (b) node 130 stress time history curve.
3.2.2.2 Dynamic response of rectangular wave under impact load
The time history response of transverse arm is analyzed by applying the rectangular wave load to the cross arm. The cycle of rectangular wave is 0.28 s. It starts from 0.09 s. The time of duration is 0.1 s, and the peak value is 600 N. After three cycles, it is unloaded, and the cut-off time of simulation is 2 s. The constraint load is as shown in Figure 10(a). After the solution is completed in the ANSYS environment, the maximum displacement node 3,538 and the maximum stress node 130 are extracted as observation nodes. The location is shown in Figure 10(b).

Load constraints and schemed for two important node locations: (a) schematic diagram of the load constraint and (b) node 130 and node 3,538 create a graph.
From the displacement time history of node 3,538 in Figure 11(a), we can see that the displacement increases sharply to 4.1 mm at 0.1 s, and then it decreases. At 0.2 s, the second peak value appears, and the displacement is about 2.8 mm. After rapid vibration, it decreases to 0.4 s. In the next cycle response, it has a similar rule. According to the velocity time history in Figure 11(b), the first peak value appears in 0.1 s. The speed is 385 mm/s, which is consistent with the maximum time of displacement. After the sharp vibration, it decreases. Since 0.5 s, the speed increases suddenly after the force is removed, and then, the speed gradually decreases to the next cycle.

Displacement and velocity time history curve: (a) node 3,538 displacement time history and (b) node 3,538 speed time history curve.
Figure 12(a) shows the time history response trend of acceleration of node 130. After reaching the maximum at 0.1 s, the vibration decreases sharply between 0.1 and 0.2 s. After unloading, the force decays rapidly at 0.2 s. After that, it tends to be in a stable state after 0.5 s. Figure 12(b) shows the time history of maximum stress. At about 0.1 s, the stress reaches the maximum value (67.455 MPa (megapascals)), and then, the amplitude becomes smaller and smaller. At 0.2 s, the stress decays to 55 MPa (megapascals). After removing the force, the stress decreases sharply. After removing the force, it reaches a stable state after 0.5 s. The maximum equivalent stress is 67.55 MPa (megapascals). The safety factor is big.

Node 130 acceleration and stress time history curve: (a) node 130 acceleration time history and (b) node 130 stress time history curve.
4 Discussions
The photovoltaic panels exposed outdoors will be covered by powder particles. Powder has a great impact on the efficiency of power generation. In addition, it may cause damage to PV modules. Therefore, a PV panel cleaning device is designed, and the dynamic features of the lightweight cross arm are analyzed (Chen et al. 2017).
In order to achieve a better effect of the PV cleaning device, the correlation between PV power output and a variety of meteorological factors is analyzed, and a variety of meteorological factors are treated as multiple information sources. The experimental results show that the model has a high prediction accuracy for sunny days. There is an error between the predicted power and the actual power in rainy days, and there is a certain error between the predicted power and the actual power in cloudy days, but the error is within the allowable range. A short-term PV power prediction method based on information fusion theory is used to predict the PV output power. The model adopts BP neural network with the comprehensive influence factor λ as the input. Finally, the neural network prediction power combined with the cleaning technology is applied to the lightweight design of the cross arm of the PV panel cleaning device.
Based on the analysis of the layout characteristics of solar PV panel and the existing problems of the scheme, the lightweight scheme of the cross arm is designed, the lightweight design of the mechanical cross arm is carried out, and the pro-E model of the cleaning mechanism of the mechanical arm is established. In this paper, ANSYS topology optimization method is mainly used to optimize the cross arm of the largest component in the cleaning device (Giannaccini et al. 2017). The displacement of node 4,378 keeps the maximum peak value of 3.5 mm after 0.2 s under the impact of sine wave load, and the velocity time trend decreases from 0.2 s to about 175 mm/s, and then, the sine vibration is stable. Under the rectangular wave load, the displacement of the joint 3,538 increases sharply to 4.1 mm in 0.1 s, and then, the vibration decays. The second big peak appears in 0.5 s, and it enters the next peak after 0.9 s. The first peak appears when the velocity time trend is 0.1 s. The sharp vibration decreases until 0.5 s. After the force is removed, the velocity begins to increase abruptly, and then, the vibration gradually decreases to 0.
5 Conclusions
In this paper, the power correlation is used to transfer the PV output power to the cleaning device, so as to judge the cleaning principle of the cleaning device. Based on the analysis of the layout characteristics of PV panels, a PV panel cleaning device is designed and developed, and the design scheme is given. In view of the problems existing in the large-scale cleaning equipment, the structure of the cross arm of the mechanical arm is optimized. Combined with the topological calculation, the mechanical properties of the optimized scheme are analyzed. The sixth-order natural frequency and natural mode of the optimization scheme and the original scheme are analyzed. The transient response of the optimization scheme is analyzed. The simulation results show that the prediction accuracy of the model is better in sunny days, but there is a small error in the complex prediction of weather changes, which is within the acceptable range. The optimization scheme can meet the needs of the work, so as to realize the optimization design of the cross arm structure and provide a reference for the further optimization of the cleaning device. From the observation of the displacement time history diagram, it can be seen that the operation time of the equipment is 0.4 s, and the operation process is stable. The maximum equivalent stress in the dynamic excitation process of 130 node and 3,538 node is 52 and 67.55 MPa, respectively, which are less than the yield limit of the material. The safety factor is relatively large. To sum up, this paper effectively solves the problem of gray surface area of the solar PV system by lightening the cross arm of the PV panel cleaning device in the power station, and the optimized cross arm structure has strong safety and practicability, which provides reference for further optimization of the cleaning device. This paper analyzes the dynamic characteristics of the cross arm lightweight of the PV panel cleaning device in the power station, but there is a problem that the damping effect is not good enough. In the next stage of the experiment, the damping angle is optimized, the damping material and shape are selected, and the position arrangement is further studied.
References
[1] Li Q, Sun Y, Yu Y. Short-term photovoltaic power forecasting for photovoltaic power station based on EWT-KMPMR. Trans Chin Soc Agric Eng. 2017;33(4):265–73.Search in Google Scholar
[2] Liu S, Zhang J, Wang H. Two-stage reactive power and voltage coordinated control strategy for photovoltaic power station considering multiple reactive power sources. Autom Electr Power Syst. 2017;41(12):120–5 and 168.Search in Google Scholar
[3] Li S, Jiang C, Zhao Z. Study of transient voltage stability for distributed photovoltaic power plant integration into low voltage distribution network. Dianli Xitong Baohu yu Kongzhi/Power Syst Prot Control. 2017;45(16):67–72.Search in Google Scholar
[4] Wu F, Li W. Dynamic equivalence analysis of distribution network integrated with high-penetration distributed photovoltaic generation system. Dianli Xitong Zidonghua/Automation Electr Power Syst. 2017;41(5):65–70 and 181.Search in Google Scholar
[5] Chen H. First principles calculation of high pressure structure and superconductivity of Li3 S and Li2 S. J Jilin Univ (Sci Ed). 2016;54:374–7.Search in Google Scholar
[6] Chen D, Kang X, Yu W. Modal analysis and topology optimization of machine tool tabl. Mech Eng. 2020;41(2):23–5.10.3901/JME.2003.02.023Search in Google Scholar
[7] Zhang G, Liu Z, Sheng X. The invention relates to a mechanical arm design of a multi-arm rotary transporting robot. Manuf Autom. 2019;41(10):96–100.Search in Google Scholar
[8] Zhao Z, Xu Z, He J. Configuration optimization of nine degree of freedom super-redundant serial manipulator based on workspace analysis. J Mech Eng. 2019;55(21):51–63.Search in Google Scholar
[9] Li B, Hou B. Topology optimization design of certain 2-DOF ammunition auto-loading manipulator. Ordnance Ind Autom. 2018;37(9):57–60.Search in Google Scholar
[10] Sun L, Fu Z, Zhang X. Topology optimization design of ram structure for ECM machine tool. Mech Sci Technol Aerosp Eng. 2018;37(12):1908–13.Search in Google Scholar
[11] Zhang F, Zhang F, Song Y. Parameters optimization based on vibration suppression of manipulator undergoing internal collision of hinges and heavy vibration of arms. J Harbin Eng Univ. 2019;40(5):1000–5.Search in Google Scholar
[12] Xia L, Luo L, Xu Q. Accuracy analysis and optimization of articulated belt deceleration manipulator. Mech & Electr Eng Mag. 2019;35(12):1297–303.Search in Google Scholar
[13] Xi C, Yong G. Simulation analysis of effects of wind field and photovoltaic DC field allocation on aeolian-sand structure. J Beijing Forestry Univ. 2017;39(6):68–76.Search in Google Scholar
[14] Chen T, Sun G, Wei Z. Photovoltaic power generation forecasting based on similar day and CAPSO-SNN. Dianli Zidonghua Shebei/Electric Power Autom Equip. 2017;37(5):66–71.Search in Google Scholar
[15] Giannaccini M, Xiang C, Atyabi A. Novel design of a soft lightweight pneumatic continuum robot arm with decoupled variable stiffness and positioning. Soft Robot. 2017;22(5):54–70.10.1089/soro.2016.0066Search in Google Scholar PubMed PubMed Central
[16] Werner D, Ganguly S. An overview of fractal antenna engineering research. IEEE Antennas Propag. 2003;45:38–57.10.1109/MAP.2003.1189650Search in Google Scholar
[17] Guariglia E. Harmonic sierpinski gasket and applications. Entropy. 2018;20(9):714.10.3390/e20090714Search in Google Scholar PubMed PubMed Central
[18] Hwang K. Modified sierpinski fractal antenna for multiband application. IEEE Antennas Wirel Propag Lett. 2007;6(1):357–60.10.1109/LAWP.2007.902045Search in Google Scholar
[19] Guariglia E. Entropy and fractal antennas. Entropy. 2016;18(3):84.10.3390/e18030084Search in Google Scholar
[20] Robert G, Nathan C. Self-similarity and the geometric requirements for frequency independence in antennae. Fractals. 1999;7:79–84.10.1142/S0218348X99000098Search in Google Scholar
© 2020 Yuqing Hou et al., published by De Gruyter
This work is licensed under the Creative Commons Attribution 4.0 International License.
Articles in the same Issue
- Regular Articles
- Model of electric charge distribution in the trap of a close-contact TENG system
- Dynamics of Online Collective Attention as Hawkes Self-exciting Process
- Enhanced Entanglement in Hybrid Cavity Mediated by a Two-way Coupled Quantum Dot
- The nonlinear integro-differential Ito dynamical equation via three modified mathematical methods and its analytical solutions
- Diagnostic model of low visibility events based on C4.5 algorithm
- Electronic temperature characteristics of laser-induced Fe plasma in fruits
- Comparative study of heat transfer enhancement on liquid-vapor separation plate condenser
- Characterization of the effects of a plasma injector driven by AC dielectric barrier discharge on ethylene-air diffusion flame structure
- Impact of double-diffusive convection and motile gyrotactic microorganisms on magnetohydrodynamics bioconvection tangent hyperbolic nanofluid
- Dependence of the crossover zone on the regularization method in the two-flavor Nambu–Jona-Lasinio model
- Novel numerical analysis for nonlinear advection–reaction–diffusion systems
- Heuristic decision of planned shop visit products based on similar reasoning method: From the perspective of organizational quality-specific immune
- Two-dimensional flow field distribution characteristics of flocking drainage pipes in tunnel
- Dynamic triaxial constitutive model for rock subjected to initial stress
- Automatic target recognition method for multitemporal remote sensing image
- Gaussons: optical solitons with log-law nonlinearity by Laplace–Adomian decomposition method
- Adaptive magnetic suspension anti-rolling device based on frequency modulation
- Dynamic response characteristics of 93W alloy with a spherical structure
- The heuristic model of energy propagation in free space, based on the detection of a current induced in a conductor inside a continuously covered conducting enclosure by an external radio frequency source
- Microchannel filter for air purification
- An explicit representation for the axisymmetric solutions of the free Maxwell equations
- Floquet analysis of linear dynamic RLC circuits
- Subpixel matching method for remote sensing image of ground features based on geographic information
- K-band luminosity–density relation at fixed parameters or for different galaxy families
- Effect of forward expansion angle on film cooling characteristics of shaped holes
- Analysis of the overvoltage cooperative control strategy for the small hydropower distribution network
- Stable walking of biped robot based on center of mass trajectory control
- Modeling and simulation of dynamic recrystallization behavior for Q890 steel plate based on plane strain compression tests
- Edge effect of multi-degree-of-freedom oscillatory actuator driven by vector control
- The effect of guide vane type on performance of multistage energy recovery hydraulic turbine (MERHT)
- Development of a generic framework for lumped parameter modeling
- Optimal control for generating excited state expansion in ring potential
- The phase inversion mechanism of the pH-sensitive reversible invert emulsion from w/o to o/w
- 3D bending simulation and mechanical properties of the OLED bending area
- Resonance overvoltage control algorithms in long cable frequency conversion drive based on discrete mathematics
- The measure of irregularities of nanosheets
- The predicted load balancing algorithm based on the dynamic exponential smoothing
- Influence of different seismic motion input modes on the performance of isolated structures with different seismic measures
- A comparative study of cohesive zone models for predicting delamination fracture behaviors of arterial wall
- Analysis on dynamic feature of cross arm light weighting for photovoltaic panel cleaning device in power station based on power correlation
- Some probability effects in the classical context
- Thermosoluted Marangoni convective flow towards a permeable Riga surface
- Simultaneous measurement of ionizing radiation and heart rate using a smartphone camera
- On the relations between some well-known methods and the projective Riccati equations
- Application of energy dissipation and damping structure in the reinforcement of shear wall in concrete engineering
- On-line detection algorithm of ore grade change in grinding grading system
- Testing algorithm for heat transfer performance of nanofluid-filled heat pipe based on neural network
- New optical solitons of conformable resonant nonlinear Schrödinger’s equation
- Numerical investigations of a new singular second-order nonlinear coupled functional Lane–Emden model
- Circularly symmetric algorithm for UWB RF signal receiving channel based on noise cancellation
- CH4 dissociation on the Pd/Cu(111) surface alloy: A DFT study
- On some novel exact solutions to the time fractional (2 + 1) dimensional Konopelchenko–Dubrovsky system arising in physical science
- An optimal system of group-invariant solutions and conserved quantities of a nonlinear fifth-order integrable equation
- Mining reasonable distance of horizontal concave slope based on variable scale chaotic algorithms
- Mathematical models for information classification and recognition of multi-target optical remote sensing images
- Hopkinson rod test results and constitutive description of TRIP780 steel resistance spot welding material
- Computational exploration for radiative flow of Sutterby nanofluid with variable temperature-dependent thermal conductivity and diffusion coefficient
- Analytical solution of one-dimensional Pennes’ bioheat equation
- MHD squeezed Darcy–Forchheimer nanofluid flow between two h–distance apart horizontal plates
- Analysis of irregularity measures of zigzag, rhombic, and honeycomb benzenoid systems
- A clustering algorithm based on nonuniform partition for WSNs
- An extension of Gronwall inequality in the theory of bodies with voids
- Rheological properties of oil–water Pickering emulsion stabilized by Fe3O4 solid nanoparticles
- Review Article
- Sine Topp-Leone-G family of distributions: Theory and applications
- Review of research, development and application of photovoltaic/thermal water systems
- Special Issue on Fundamental Physics of Thermal Transports and Energy Conversions
- Numerical analysis of sulfur dioxide absorption in water droplets
- Special Issue on Transport phenomena and thermal analysis in micro/nano-scale structure surfaces - Part I
- Random pore structure and REV scale flow analysis of engine particulate filter based on LBM
- Prediction of capillary suction in porous media based on micro-CT technology and B–C model
- Energy equilibrium analysis in the effervescent atomization
- Experimental investigation on steam/nitrogen condensation characteristics inside horizontal enhanced condensation channels
- Experimental analysis and ANN prediction on performances of finned oval-tube heat exchanger under different air inlet angles with limited experimental data
- Investigation on thermal-hydraulic performance prediction of a new parallel-flow shell and tube heat exchanger with different surrogate models
- Comparative study of the thermal performance of four different parallel flow shell and tube heat exchangers with different performance indicators
- Optimization of SCR inflow uniformity based on CFD simulation
- Kinetics and thermodynamics of SO2 adsorption on metal-loaded multiwalled carbon nanotubes
- Effect of the inner-surface baffles on the tangential acoustic mode in the cylindrical combustor
- Special Issue on Future challenges of advanced computational modeling on nonlinear physical phenomena - Part I
- Conserved vectors with conformable derivative for certain systems of partial differential equations with physical applications
- Some new extensions for fractional integral operator having exponential in the kernel and their applications in physical systems
- Exact optical solitons of the perturbed nonlinear Schrödinger–Hirota equation with Kerr law nonlinearity in nonlinear fiber optics
- Analytical mathematical schemes: Circular rod grounded via transverse Poisson’s effect and extensive wave propagation on the surface of water
- Closed-form wave structures of the space-time fractional Hirota–Satsuma coupled KdV equation with nonlinear physical phenomena
- Some misinterpretations and lack of understanding in differential operators with no singular kernels
- Stable solutions to the nonlinear RLC transmission line equation and the Sinh–Poisson equation arising in mathematical physics
- Calculation of focal values for first-order non-autonomous equation with algebraic and trigonometric coefficients
- Influence of interfacial electrokinetic on MHD radiative nanofluid flow in a permeable microchannel with Brownian motion and thermophoresis effects
- Standard routine techniques of modeling of tick-borne encephalitis
- Fractional residual power series method for the analytical and approximate studies of fractional physical phenomena
- Exact solutions of space–time fractional KdV–MKdV equation and Konopelchenko–Dubrovsky equation
- Approximate analytical fractional view of convection–diffusion equations
- Heat and mass transport investigation in radiative and chemically reacting fluid over a differentially heated surface and internal heating
- On solitary wave solutions of a peptide group system with higher order saturable nonlinearity
- Extension of optimal homotopy asymptotic method with use of Daftardar–Jeffery polynomials to Hirota–Satsuma coupled system of Korteweg–de Vries equations
- Unsteady nano-bioconvective channel flow with effect of nth order chemical reaction
- On the flow of MHD generalized maxwell fluid via porous rectangular duct
- Study on the applications of two analytical methods for the construction of traveling wave solutions of the modified equal width equation
- Numerical solution of two-term time-fractional PDE models arising in mathematical physics using local meshless method
- A powerful numerical technique for treating twelfth-order boundary value problems
- Fundamental solutions for the long–short-wave interaction system
- Role of fractal-fractional operators in modeling of rubella epidemic with optimized orders
- Exact solutions of the Laplace fractional boundary value problems via natural decomposition method
- Special Issue on 19th International Symposium on Electromagnetic Fields in Mechatronics, Electrical and Electronic Engineering
- Joint use of eddy current imaging and fuzzy similarities to assess the integrity of steel plates
- Uncertainty quantification in the design of wireless power transfer systems
- Influence of unequal stator tooth width on the performance of outer-rotor permanent magnet machines
- New elements within finite element modeling of magnetostriction phenomenon in BLDC motor
- Evaluation of localized heat transfer coefficient for induction heating apparatus by thermal fluid analysis based on the HSMAC method
- Experimental set up for magnetomechanical measurements with a closed flux path sample
- Influence of the earth connections of the PWM drive on the voltage constraints endured by the motor insulation
- High temperature machine: Characterization of materials for the electrical insulation
- Architecture choices for high-temperature synchronous machines
- Analytical study of air-gap surface force – application to electrical machines
- High-power density induction machines with increased windings temperature
- Influence of modern magnetic and insulation materials on dimensions and losses of large induction machines
- New emotional model environment for navigation in a virtual reality
- Performance comparison of axial-flux switched reluctance machines with non-oriented and grain-oriented electrical steel rotors
- Erratum
- Erratum to “Conserved vectors with conformable derivative for certain systems of partial differential equations with physical applications”