Electronic temperature characteristics of laser-induced Fe plasma in fruits
-
Yuan-Xia Fu
 ,
Li Wang
,
Li Wang

Abstract
Fruit is not only delicious, but it also contains iron, potassium, magnesium, and other microelements necessary for the human body. Banana, pineapple and kiwifruit were selected as samples for testing. A laser with a wavelength of 532 nm was focused on the samples’ surface to generate a plasma. The emission spectrum of the atoms and ions in the plasma were collected by optical receivers, and the optimal condition was confirmed by analyzing the signal-to-noise ratio. The electronic temperature characteristics of the Fe plasma were studied under optimal experimental conditions. The maximum electron temperature of the Fe plasma occurred after a time delay of 300 ns in bananas, after 400 ns in pineapples and after 400 ns in kiwifruit. The electronic temperature of the Fe plasma increased with the time delay before the maximum point was reached. However, the temperature decreased after the maximum point was reached. At the beginning of the decline, the plasma decreased rapidly, but later decreased slowly. The range of the variation of the electron temperature of the Fe plasma in bananas, pineapples, and kiwifruits was 12388.29–19958.3 K, 11994.21–16856.4 K, and 13388.2–19607.32 K, respectively.
1 Introduction
Laser-induced plasma spectroscopy uses laser pulses as the energy sources and lenses to focus the laser on the surface of the sample [1]. The sample in the focus area undergoes multiphoton ionization to generate free electrons, and then avalanche ionization will occur to produce a large amount of plasma [1]. The specific manifestation is that sparks and noises are present on the surface of the sample. The sample is then analyzed according to the emission spectrum of the plasma. Solids, liquids, and gases, regardless of the shape of the object, can be analyzed by laser-induced plasma spectroscopy technology which can be operated in real time, online, and remotely and is convenient to operate. At present, this technology has been applied to the identification of historical and cultural artifacts, space exploration, industrial inspection, and chemical analysis. Numerous small online inspection systems based on this technology have also been developed [2, 3, 4, 5, 6, 7, 8].
In recent years, laser-induced plasma spectroscopy has been used to study trace elements, including qualitative and quantitative analyses of heavy metal elements, research of various processing algorithms, design of multi-functional experiments, and enhancement of experimental devices. Zhang et al. from the Institute of Modern Physics of Chinese Academy of Sciences analyzed the trace elements in apples, strawberries, and kiwifruit using laser-induced plasma spectroscopy [9]. Li (2011) of Jiangxi Agricultural University analyzed the metal elements in the pericarp and pulp of mandarin oranges and navel oranges through laser-induced plasma spectroscopy [10]. Zhang Xu et al. (2012) of Jiangxi Agricultural University used laser-induced plasma spectroscopy to quantitatively analyze the chromium content in apples quantitatively [11]. Kuoray et al. (2013) of Shanxi Agricultural University applied laser-induced plasma spectroscopy to determine the mineral content of three jujube species from different production areas [12]. Abdul Jabbar et al. (2019) of Milpur University of Science and Technology used laser-induced plasma spectroscopy to examine the elemental composition of roots, stems, seeds, and other parts of rice [13]. Given the inevitable interaction between a laser and matter, precise control cannot be carried out through the sample preparation. Consequently, the shock wave generated by the rapid collision between laser and plasma, plasma and plasma, and the interaction between plasma and ambient gas increased the signal uncertainty of the spectral measurement system and decreased the accuracy of repeatability. Under the influence of the matrix effect, the measurement error was relatively large. These factors have limited the large-scale commercial application of laser-induced plasma spectroscopy. In this paper, laser-induced plasma spectroscopy was used to study the electron temperature changes of the Fe plasma, with time delay, in three kinds of fruit, namely, banana, pineapple, and kiwi fruit are taken as research objects, and the electron temperature changes of Fe plasma in laser-induced fruits with time delay are studied. Plasma electron temperature is an important characteristic of plasma. The experimental results can help us to explore the mechanism and process of the interaction between the laser and matter. In addition, the results can also contribute to laser-induced plasma spectroscopy technology in the analysis of fruits and other crops.
2 Experimental setup
A Nd:YAG laser was focused on the surface of the sample through a lens, and plasma is formed on the sample. The emission spectrum of the plasma is received by an optical receiver and transmitted to a spectrometer through an optical fiber. The spectrometer splits the collected spectrum. Then, the ICCD (Intensified Charge-coupled Device) captures the spectrum and converts the collected optical signal into an electrical signal. Finally, it transmits the information to a computer for display. The experimental apparatus is shown in Figure 1. The exposure time was set to 0.2ms in the experiment, and each picture is obtained by averaging over 200 laser pulses.

Experimental setup
3 Spectral analysis
3.1 Spectra of fruits with changing gate width
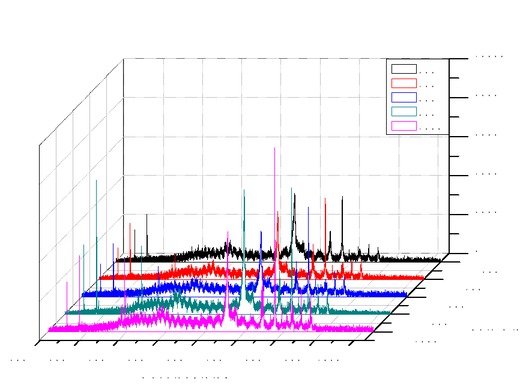
With a fixed delay and changing the acquisition gate width of ICCD, the 3D spectra of bananas, pineapples, and kiwifruit obtained are, shown in Figure 2, Figure 3, and Figure 4, respectively.
Spectra of a banana with changing gate width

Spectra of a pineapple with changing gate width

Spectra of a kiwifruit with changing gate width
3.2 Spectra of fruits with changing delay
With a fixed the acquisition gate width and changing acquisition delay of ICCD, the spectral 3D images of bananas, pineapples, and kiwifruit are shown in Figure 5, Figure 6, and Figure 7, respectively.

Spectra of a banana with changing delay

Spectra of a pineapple with changing delay

Spectra of a kiwifruit with changing delay
3.3 Signal to noise ratio analysis
To calculate the signal-to-noise ratio, the 696.6 nm spectral line is selected, and the best optimization conditions of the three fruits can be obtained by analyzing their SNR charts with different delays and gate widths. Firstly, Figure 8 and Figure 9 show that the optimal banana optimization conditions are a delay of 500 ns and a gate width of 800 ns. Secondly, Figure 10 and Figure 11 demonstrate that the optimal optimization conditions for pineapple are a delay of 400 ns and a gate width of 400 ns. Finally, Figure 12 and Figure 13 indicate that the best optimization conditions for the kiwifruit are a delay of 400 ns of delay and a gate width of 600 ns.

SNR of a banana with different delays

SNR of a banana with different gate widths

SNR of a pineapple with different delays

SNR of a pineapple with different gate widths

SNR of a kiwi fruit with different delays

SNR of a kiwi fruit with different gate widths
Given that the exposure delay of ICCD is constant, the time-resolved spectra of different ICCD gate widths are explored. If the gate width is too large despite numerous spectral line signals, several background signals are present. However, if the gate width is too small, the detected signal is weak [13].
When the plasma is initially formed by laser induction, the bremsstrahlung from inside the plasma produces a continuous strong background spectrum, and the characteristic spectral lines of the sample are masked. Later, the background spectral lines decline faster than atomic spectral lines and ion spectral lines. Thus, the emission spectral lines of elements are displayed, and the signal-to-noise ratio of the spectral lines increases. If the delay is too small, the spectral lines generated by the laser cannot be filtered out, thus affecting the experimental analysis. When the exposure delay is too large, numerous interference signals enter the spectrometer; thus, choosing the correct exposure delay for spectrogram analysis is especially important [13].
3.4 Optimum spectrogram
By analyzing the signal-to-noise ratio of the three different fruits, changing the fixed gate width and delay, and determining the best optimization conditions, the best spectrograms of bananas, pineapples, and kiwifruit can be obtained.

Optimum spectrogram of a banana

Optimum spectrogram of a pineapple

Optimum spectrogram of a kiwi fruit
4 Electron temperature analysis of the plasma
The Boltzmann oblique line method is used to calculate the electron temperature of the plasma.
In Eq. (1), Im is the intensity of the characteristic spectral line, Em is the energy of the upper level, Am is the transition probability of the corresponding spectral line, gm is the statistical weight of the upper levels, and kB is the Boltzmann constant. If Em is the abscissa and ln
4.1 Electron temperature of laser-induced Fe plasma in bananas
For the calculation of the electron temperature of the Fe plasma in fruits, four spectral lines of Fe with wavelengthsof 247.9nm, 279.6 nm, 393.3 nm, and 656.9 nmwere selected. Table 1 lists the relevant spectral constants of the four spectral lines.
Excitation energy, statistical weight of the upper levels of the Fe line, and the corresponding transition probability for the selected spectral lines
| Wavelength (nm) | Excitation energy (cm−1) | Excitation energy (eV) | gk | Ak(106s−1) |
|---|---|---|---|---|
| 247.9 | 48304.643 | 5.978 | 5 | 21 |
| 279.6 | 77861.650 | 9.636 | 10 | 20.00 |
| 393.3 | 50186.834 | 6.211 | 5 | 5.92 |
| 656.9 | 53393.673 | 6.608 | 9 | 6.00 |
The Boltzmann oblique lines (ln(Iλ/gA) ∼ Ek) of three spectral lines are calculated. Then, the electron temperature of Fe plasma can be obtained by slope.
The relationship between the electron temperature characteristics of the laser-induced Fe plasma in a banana and the time delay is shown in Figure 18. In the time delay range of 200-300ns, the electron temperature of the Fe plasma increases as the delay increases. In the delay range of 300-1000ns, the electron temperature of the Fe plasma decreases as the delay increases, reaching a maximum value at 300ns, and the electron temperature varies between 12388.29K and 19958.3K.

Boltzmann oblique lines of a banana with different delays

Temporal evolution of the electron temperature of the laser-induced Fe plasma in a banana
4.2 Electron temperature of laser-induced Fe plasma in pineapples
For the calculation of the electron temperature of the Fe plasma in pineapples, three spectral lines with Fe wave-lengths of 279.6 nm, 393.3nm, and 656.9 nm were selected. Table 1 lists the relevant spectral constants of the three spectral lines. The Boltzmann oblique lines (ln(Iλ/gA) ∼ Ek) of the three spectral lines were calculated. Then, the electron temperature of the Fe plasma was obtained from the slope.
The relationship between the electron temperature characteristics of the laser-induced Fe plasma in pineapples and the time delay is shown in Figure 20. In the time delay range of 200–400 ns, the electron temperature of the Fe plasma decreases as time delay increases. In the time delay range of 400–1000 ns, the electron temperature of the Fe plasma decreases as time delay increases after reaching the maximum value at 400 ns. The electron temperature varies between 11994.21 K and 16856.4 K.

Boltzmann oblique lines of a pineapple with different delays

Temporal evolution of the electron temperature of laser-induced Fe plasma in a pineapple
4.3 Electron temperature of laser-induced Fe plasma in kiwi fruit
For the calculation of the electron temperature of the Fe plasma in kiwifruit, three spectral lines with Fe wave-lengths of 247.9 nm, 279.6 nm, and 656.9 nm were selected. Table 1 lists the relevant spectral constants of the three spectral lines. The Boltzmann oblique lines (ln(Iλ/gA) ∼ Ek) of the three spectral lines are calculated. Then, the electron temperature of the Fe plasma was obtained from the slope.
The relationship between the electron temperature characteristics of the Fe plasma in a laser-induced kiwifruit and the time delay is shown in Figure 22. In the time delay range of 200-400 ns, the electron temperature of the Fe plasma decreases as time delay increases. In the time delay range of 400-1000 ns, the electron temperature decreases with the increase of the time delay after reaching the maximum value at 400 ns. Moreover, the electron temperature varies between 13388.2 K and 19607.54 K.

Boltzmann oblique lines of a kiwi fruit with different delays

Temporal evolution of the electron temperature of laser-induced Fe plasma in a kiwifruit
According to the analysis of the evolution characteristics of the plasma electron temperature of three fruits with time delay, the plasma electron temperature gradually increases. After rising to the maximum value, the plasma electron temperature then decreases with increasing time delay, and the speed decelerates. The plasma diffuses outward after it is formed, and its diffused kinetic energy is converted from thermal energy. Thus, the plasma electron temperature decreases with the expansion of volume. When the plasma electron temperature falls to a lower range, the efficiency of thermal energy conversion to kinetic energy decreases, and the downward trend of the plasma electron temperature slows down.
The time evolution trends are similar, but the electron temperatures are different at the same time delay. The highest electron temperatures are different, and the delay corresponding to the maximum value are also different.
5 Conclusion
In this paper, the spectra of bananas, pineapples, and kiwifruits are measured for a series of experiments, and the electron temperature characteristics of the Fe plasma induced by a laser are analyzed with time delay. The range of the electron temperatures of the Fe plasma in bananas, pineapples, and kiwi fruits was 12388.29–19958.3 K, 11994.21–16856.4 K, and 13388.2–19607.32 K, respectively.Laser-induced plasma spectroscopy has attracted much attention due to its unique advantages. For example, samples can be liquid, solid, or gaseous and it allows for long-range monitoring, especially under special circumstances. In addition, the analysis time is short, and the process can simultaneously detect multiple elements on line. It is possible to combine laser-induced plasma technology, Raman spectrum technology, and fluorescence spectrum technology to obtain comprehensive material composition information. Although certain problems in the practical application of laser-induced plasma spectroscopy still exist, the field of application of this technology is expected to expand and become popular in the future along with the development of science.
Acknowledgement
The National Natural Science Foundation of China(11604003), the Key Program of Natural Science Foundation of Anhui Province (KJ2019A085) and the Anhui Province Key Laboratory of Optoelectronic Materials Science and Technology (OMST201703)
References
[1] Lu TX. Principle and application of laser spectroscopy. Hefei: China University of Science and Technology Press; 2009. pp. 201–5.Search in Google Scholar
[2] Xu XB, Du CW, Ma F, Shen Y, Wu K, Liang D, et al. Detection of soil organic matter from laser-induced breakdown spectroscopy (LIBS) and mid-infrared spectroscopy (FTIR-ATR) coupled with multivariate techniques. Geoderma. 2019;355(1):113905.10.1016/j.geoderma.2019.113905Search in Google Scholar
[3] Tang HJ, Hao XJ, Hu XY, et al. Study on spectral time evolution of laser induced Cu plasma. Laser and Infrared. 2018;48(11):1341–5.Search in Google Scholar
[4] Ye TB. Experimental study on laser plasma shielding. Nanjing: Nanjing University of Technology; 2007.Search in Google Scholar
[5] Giorgio S. Recent advances and future trends in LIBS applications to agricultural materials and their food derivatives: an overview of developments in the last decade (2010–2019). Part II. Crop plants and their food derivatives. Trends Analyt Chem. 2019;118:453–69.10.1016/j.trac.2019.05.052Search in Google Scholar
[6] Hou GY, Wang P, Tong CZ. Progress in laser-induced breakdown spectroscopy and its applications. China Optics. 2013;6(4):491–2.Search in Google Scholar
[7] Zhang GY, Ji H, Li ST, Zheng HM. Characterization of plasma induced by laser effect on coal sample. Guang Pu Xue Yu Guang Pu Fen Xi. 2016 May;36(5):1323–7.Search in Google Scholar
[8] Meng DS, Zhao NJ,Ma MJ, Gu YH, Yu Y, Fang L, et al. Rapid soil classification with laser induced breakdown spectroscopy. Guang Pu Xue Yu Guang Pu Fen Xi. 2017 Jan;37(1):241–6.Search in Google Scholar
[9] Zhang DC, Ma XW, Zhu XL, et al. Application of laser-induced breakdown spectroscopy in analyzing microelements in three kinds of fruit samples. Wuli Xuebao. 2008;57(10):6348–9.Search in Google Scholar
[10] Li QL. Analysis and research on laser induced breakdown spectroscopy applied to determination of metal elements in citrus and soil. Nanchang: Jiangxi Agricultural University; 2011.Search in Google Scholar
[11] Zhang X, Yao MY, Liu MH, et al. Quantitative analysis of chromium in apples by laser-induced breakdown spectroscopy. Laser and Infrared. 2012;4(5):495–6.Search in Google Scholar
[12] Guo R, Wang XY. Determination of mineral elements in red jujube with laser-induced breakdown spectroscopy. Shanxi Nongye Daxue Xuebao. 2013;33(6):498–9.Search in Google Scholar
[13] Jabbar A, Akhtar M, Ali A, Mehmood S, Iftikhar S, Baig MA. Elemental composition of rice using calibration free laser induced breakdown spectroscopy. Optoelectron Lett. 2019;15(1):53–63.10.1007/s11801-019-8099-0Search in Google Scholar
[14] Fu YX, Tang YQ, Xu L, et al. Measurement on trace element composition of Chinese medicinal materials by laser induced breakdown spectroscopy. Journal of Bengbu University. 2017;6(3):20–4.Search in Google Scholar
[15] Wang L, Fu YX, Xu L, et al. The Effect of Sample temperature on characteristic parameters of the nanosecond laser-induced Cu Plasma. spectroscopy and spectral analysis. 2019; 39(4): 1247-1251.Search in Google Scholar
[16] Fu YX, Wang L, Ma LY, et al. An investigation on the laser - induced Cu plasma characteristics. Journal of Atomic and Molecular Physics. 2019;36(02):263–7.Search in Google Scholar
[17] Wang L, Zhou Y, Fu YX, Xu L, Gong H, Cheng R. Effect of sample temperature on radiation characteristics of nanosecond lase-induced soil plasma. Chin J Chem Phys. 2019;32(06):760–4.10.1063/1674-0068/cjcp1901015Search in Google Scholar
[18] Yu JL, Li C, Yao GX, et al. Spatial Evolution Characteristics of Laser-induced Plasma in Liquid Matrix. Chin J Lasers. 2019;46(8):0802001.10.3788/CJL201946.0802001Search in Google Scholar
© 2020 Y.-X. Fu et al., published by De Gruyter
This work is licensed under the Creative Commons Attribution 4.0 International License.
Articles in the same Issue
- Regular Articles
- Model of electric charge distribution in the trap of a close-contact TENG system
- Dynamics of Online Collective Attention as Hawkes Self-exciting Process
- Enhanced Entanglement in Hybrid Cavity Mediated by a Two-way Coupled Quantum Dot
- The nonlinear integro-differential Ito dynamical equation via three modified mathematical methods and its analytical solutions
- Diagnostic model of low visibility events based on C4.5 algorithm
- Electronic temperature characteristics of laser-induced Fe plasma in fruits
- Comparative study of heat transfer enhancement on liquid-vapor separation plate condenser
- Characterization of the effects of a plasma injector driven by AC dielectric barrier discharge on ethylene-air diffusion flame structure
- Impact of double-diffusive convection and motile gyrotactic microorganisms on magnetohydrodynamics bioconvection tangent hyperbolic nanofluid
- Dependence of the crossover zone on the regularization method in the two-flavor Nambu–Jona-Lasinio model
- Novel numerical analysis for nonlinear advection–reaction–diffusion systems
- Heuristic decision of planned shop visit products based on similar reasoning method: From the perspective of organizational quality-specific immune
- Two-dimensional flow field distribution characteristics of flocking drainage pipes in tunnel
- Dynamic triaxial constitutive model for rock subjected to initial stress
- Automatic target recognition method for multitemporal remote sensing image
- Gaussons: optical solitons with log-law nonlinearity by Laplace–Adomian decomposition method
- Adaptive magnetic suspension anti-rolling device based on frequency modulation
- Dynamic response characteristics of 93W alloy with a spherical structure
- The heuristic model of energy propagation in free space, based on the detection of a current induced in a conductor inside a continuously covered conducting enclosure by an external radio frequency source
- Microchannel filter for air purification
- An explicit representation for the axisymmetric solutions of the free Maxwell equations
- Floquet analysis of linear dynamic RLC circuits
- Subpixel matching method for remote sensing image of ground features based on geographic information
- K-band luminosity–density relation at fixed parameters or for different galaxy families
- Effect of forward expansion angle on film cooling characteristics of shaped holes
- Analysis of the overvoltage cooperative control strategy for the small hydropower distribution network
- Stable walking of biped robot based on center of mass trajectory control
- Modeling and simulation of dynamic recrystallization behavior for Q890 steel plate based on plane strain compression tests
- Edge effect of multi-degree-of-freedom oscillatory actuator driven by vector control
- The effect of guide vane type on performance of multistage energy recovery hydraulic turbine (MERHT)
- Development of a generic framework for lumped parameter modeling
- Optimal control for generating excited state expansion in ring potential
- The phase inversion mechanism of the pH-sensitive reversible invert emulsion from w/o to o/w
- 3D bending simulation and mechanical properties of the OLED bending area
- Resonance overvoltage control algorithms in long cable frequency conversion drive based on discrete mathematics
- The measure of irregularities of nanosheets
- The predicted load balancing algorithm based on the dynamic exponential smoothing
- Influence of different seismic motion input modes on the performance of isolated structures with different seismic measures
- A comparative study of cohesive zone models for predicting delamination fracture behaviors of arterial wall
- Analysis on dynamic feature of cross arm light weighting for photovoltaic panel cleaning device in power station based on power correlation
- Some probability effects in the classical context
- Thermosoluted Marangoni convective flow towards a permeable Riga surface
- Simultaneous measurement of ionizing radiation and heart rate using a smartphone camera
- On the relations between some well-known methods and the projective Riccati equations
- Application of energy dissipation and damping structure in the reinforcement of shear wall in concrete engineering
- On-line detection algorithm of ore grade change in grinding grading system
- Testing algorithm for heat transfer performance of nanofluid-filled heat pipe based on neural network
- New optical solitons of conformable resonant nonlinear Schrödinger’s equation
- Numerical investigations of a new singular second-order nonlinear coupled functional Lane–Emden model
- Circularly symmetric algorithm for UWB RF signal receiving channel based on noise cancellation
- CH4 dissociation on the Pd/Cu(111) surface alloy: A DFT study
- On some novel exact solutions to the time fractional (2 + 1) dimensional Konopelchenko–Dubrovsky system arising in physical science
- An optimal system of group-invariant solutions and conserved quantities of a nonlinear fifth-order integrable equation
- Mining reasonable distance of horizontal concave slope based on variable scale chaotic algorithms
- Mathematical models for information classification and recognition of multi-target optical remote sensing images
- Hopkinson rod test results and constitutive description of TRIP780 steel resistance spot welding material
- Computational exploration for radiative flow of Sutterby nanofluid with variable temperature-dependent thermal conductivity and diffusion coefficient
- Analytical solution of one-dimensional Pennes’ bioheat equation
- MHD squeezed Darcy–Forchheimer nanofluid flow between two h–distance apart horizontal plates
- Analysis of irregularity measures of zigzag, rhombic, and honeycomb benzenoid systems
- A clustering algorithm based on nonuniform partition for WSNs
- An extension of Gronwall inequality in the theory of bodies with voids
- Rheological properties of oil–water Pickering emulsion stabilized by Fe3O4 solid nanoparticles
- Review Article
- Sine Topp-Leone-G family of distributions: Theory and applications
- Review of research, development and application of photovoltaic/thermal water systems
- Special Issue on Fundamental Physics of Thermal Transports and Energy Conversions
- Numerical analysis of sulfur dioxide absorption in water droplets
- Special Issue on Transport phenomena and thermal analysis in micro/nano-scale structure surfaces - Part I
- Random pore structure and REV scale flow analysis of engine particulate filter based on LBM
- Prediction of capillary suction in porous media based on micro-CT technology and B–C model
- Energy equilibrium analysis in the effervescent atomization
- Experimental investigation on steam/nitrogen condensation characteristics inside horizontal enhanced condensation channels
- Experimental analysis and ANN prediction on performances of finned oval-tube heat exchanger under different air inlet angles with limited experimental data
- Investigation on thermal-hydraulic performance prediction of a new parallel-flow shell and tube heat exchanger with different surrogate models
- Comparative study of the thermal performance of four different parallel flow shell and tube heat exchangers with different performance indicators
- Optimization of SCR inflow uniformity based on CFD simulation
- Kinetics and thermodynamics of SO2 adsorption on metal-loaded multiwalled carbon nanotubes
- Effect of the inner-surface baffles on the tangential acoustic mode in the cylindrical combustor
- Special Issue on Future challenges of advanced computational modeling on nonlinear physical phenomena - Part I
- Conserved vectors with conformable derivative for certain systems of partial differential equations with physical applications
- Some new extensions for fractional integral operator having exponential in the kernel and their applications in physical systems
- Exact optical solitons of the perturbed nonlinear Schrödinger–Hirota equation with Kerr law nonlinearity in nonlinear fiber optics
- Analytical mathematical schemes: Circular rod grounded via transverse Poisson’s effect and extensive wave propagation on the surface of water
- Closed-form wave structures of the space-time fractional Hirota–Satsuma coupled KdV equation with nonlinear physical phenomena
- Some misinterpretations and lack of understanding in differential operators with no singular kernels
- Stable solutions to the nonlinear RLC transmission line equation and the Sinh–Poisson equation arising in mathematical physics
- Calculation of focal values for first-order non-autonomous equation with algebraic and trigonometric coefficients
- Influence of interfacial electrokinetic on MHD radiative nanofluid flow in a permeable microchannel with Brownian motion and thermophoresis effects
- Standard routine techniques of modeling of tick-borne encephalitis
- Fractional residual power series method for the analytical and approximate studies of fractional physical phenomena
- Exact solutions of space–time fractional KdV–MKdV equation and Konopelchenko–Dubrovsky equation
- Approximate analytical fractional view of convection–diffusion equations
- Heat and mass transport investigation in radiative and chemically reacting fluid over a differentially heated surface and internal heating
- On solitary wave solutions of a peptide group system with higher order saturable nonlinearity
- Extension of optimal homotopy asymptotic method with use of Daftardar–Jeffery polynomials to Hirota–Satsuma coupled system of Korteweg–de Vries equations
- Unsteady nano-bioconvective channel flow with effect of nth order chemical reaction
- On the flow of MHD generalized maxwell fluid via porous rectangular duct
- Study on the applications of two analytical methods for the construction of traveling wave solutions of the modified equal width equation
- Numerical solution of two-term time-fractional PDE models arising in mathematical physics using local meshless method
- A powerful numerical technique for treating twelfth-order boundary value problems
- Fundamental solutions for the long–short-wave interaction system
- Role of fractal-fractional operators in modeling of rubella epidemic with optimized orders
- Exact solutions of the Laplace fractional boundary value problems via natural decomposition method
- Special Issue on 19th International Symposium on Electromagnetic Fields in Mechatronics, Electrical and Electronic Engineering
- Joint use of eddy current imaging and fuzzy similarities to assess the integrity of steel plates
- Uncertainty quantification in the design of wireless power transfer systems
- Influence of unequal stator tooth width on the performance of outer-rotor permanent magnet machines
- New elements within finite element modeling of magnetostriction phenomenon in BLDC motor
- Evaluation of localized heat transfer coefficient for induction heating apparatus by thermal fluid analysis based on the HSMAC method
- Experimental set up for magnetomechanical measurements with a closed flux path sample
- Influence of the earth connections of the PWM drive on the voltage constraints endured by the motor insulation
- High temperature machine: Characterization of materials for the electrical insulation
- Architecture choices for high-temperature synchronous machines
- Analytical study of air-gap surface force – application to electrical machines
- High-power density induction machines with increased windings temperature
- Influence of modern magnetic and insulation materials on dimensions and losses of large induction machines
- New emotional model environment for navigation in a virtual reality
- Performance comparison of axial-flux switched reluctance machines with non-oriented and grain-oriented electrical steel rotors
- Erratum
- Erratum to “Conserved vectors with conformable derivative for certain systems of partial differential equations with physical applications”