Water resources utilization and tourism environment assessment based on water footprint
-
Juanjuan Su


Abstract
Purpose
With population growth and economic development, global Water Resources (WR) are becoming increasingly scarce. As an important consumer sector, the tourism industry is increasingly consuming and polluting WR. How to reasonably utilize WR and protect the water environment has become an important issue for the sustainable development of the current tourism industry.
Methods
Based on the Water Footprint of WR utilization and tourism environment assessment, this article used four different WR management schemes in different tourist areas to compare with the traditional scheme.
Result
According to the experimental results, it could be concluded that the wastewater discharge and environmental risk index under low Water Consumption technology in a certain mountainous tourist attraction were approximately 90,000 m3 and 0.25, respectively; the wastewater discharge and environmental risk index of a certain tourist city using renewable water technology were approximately 600,000 m3 and 0.5, respectively. The impact of adopting different WR management schemes in different regions has also varied.
Conclusion
This also indicated that when formulating WR management plans for various tourist areas, it was necessary to fully consider the impact of the tourism environment and develop scientific and reasonable management measures. The research in this article has broad application prospects in practice, which helped to promote sustainable economic development and progress in social civilization.
1 Introduction
With the increase of population and the acceleration of urbanization, the contradiction between the supply and demand of Water Resources (WR) has become increasingly prominent. As a comprehensive WR evaluation index, Water Footprint (WF) has gradually become a widely used term in the research field. The shortage of resources and pollution have become important issues that constrain the sustainable development of human society. The traditional WR assessment mainly focuses on the supply side, while the WF pays more attention to the use side, which can more comprehensively reflect the human use of WR. WF can provide a reference for WR management by considering production, consumption, international trade, and other factors to evaluate the utilization efficiency of WR as a whole. In addition, tourism, as one of the important pillars of China’s economy, has also become an important field of WR utilization. The tourism industry not only requires a large amount of WR to support its development, but also has a certain impact on the local water environment. The evaluation of WR utilization based on WF can be analyzed as a whole at the macro level, to improve the utilization efficiency of WR and maximize profit. The concept of WF fully considers the recycling of WR and can provide reasonable WR utilization strategies for relevant departments. The rapid development of the tourism industry is also increasing the demand for WR, but the development of the tourism industry also faces problems such as environmental pollution and ecological damage. In this context, tourism environmental impact assessment based on WF plays a very positive role in the green transformation of tourism and the popularization of environmental awareness. By calculating and comparing the WF of different types of tourism, the utilization of local WR by tourism can be more comprehensively understood, to adjust the development direction of tourism and further promote the sustainable development of tourism. The WR utilization and tourism environment assessment based on WF can grasp the utilization efficiency and profit of WR as a whole and provide a reference for WR management and the green development of tourism.
Through the assessment of the WF of the tourism industry, the consumption and pollution of WR by the tourism industry can be found, and more reasonable WR utilization strategies and environmental protection measures can be formulated to promote the sustainable development of the tourism industry. Yang used the data envelopment analysis Tobit two-stage model to evaluate the efficiency of WR utilization, and analyzed the regional differences and influencing factors of WR utilization [1]. Tibet is China’s province with the largest international river and WR reserves. Considering the negative output of WR utilization, Xie used a super-efficiency relaxation measure model to measure the WR utilization efficiency of Tibet and the Tibetan region from 2006 to 2016 [2]. Wang established a quantitative model based on system dynamics theory to reflect the coupled system of “socio-economic water environment.” He chose Hubei Province, China, to validate the model. The results indicated that the water supply and demand and pollution pressure under the sustainable development scenario were lower than those under the other two scenarios. This meant that the role of industrial structure adjustment in alleviating water supply and demand pressure was relatively weak [3]. The evaluation of WR utilization and tourism environment based on WF has important background significance.
WF is an indicator to measure the utilization of WR. It can comprehensively consider the consumption and pollution of water and more comprehensively evaluate the utilization of WR. The United States is the world’s largest producer of goods and services. Rainfall, surface water supply, and groundwater aquifers are basic inputs for economic production. Marston Landon calculated the WF of more than 500 food, energy, mining, services, manufacturing, and commodities in the United States. A data-intensive method was adopted to integrate WF and input-output technology into a new methodology framework. This method could help to understand the WR in the United States economy, to enable supply chain managers to assess direct and indirect water dependence [4]. The concept of WF is considered very valuable in raising people’s awareness of the large amount of WR needed to produce and consume food. Vanham Davy provided three major European countries (Britain, France, and Germany) with a geographically detailed national WF related to food consumption. Using socio-economic data, national food survey, and international food consumption and WF databases, the national WF data could be refined to the smallest possible administrative boundary within a country [5]. However, they did not provide corresponding rectification suggestions for the shortcomings of these plans.
To enhance the utilization efficiency of WR and improve the ecological environment of tourism, this article focused on the analysis of WR utilization and tourism environment assessment based on WF and analyzed different tourism and different WR management schemes. According to the experimental results, it could be concluded that different WR management schemes had different effects in different tourism industries. Some were better than traditional solutions, while others were not as good as traditional solutions. The innovation of this article was to use the theory of WF, comprehensively consider Water Consumption (WC) and pollution, and more comprehensively evaluate the WR utilization of tourism. When proposing improvement suggestions, full consideration should be given to the sustainable development of the tourism industry and environmental protection, which could ensure the efficiency of WR utilization and reduce WR consumption and pollution.
2 Calculation algorithm of WF
The WF refers to the amount of freshwater used by a person, a community, or a country in the production and consumption process. WF is a comprehensive indicator, which is used to measure the amount of WR used by a country, region, or individual in the production and consumption process. According to different types of WF, it can be divided into blue WF, green WF, and gray WF. The process framework for WR utilization and tourism environment evaluation is shown in Figure 1.

Framework diagram of WR utilization and tourism environment evaluation.
2.1 Calculation and evaluation of gray WF
With the rapid development of China’s tourism industry, the demand for WR in the tourism industry is increasing, which also brings about the problem of gray water discharge. Gray water refers to living sewage other than toilet sewage, including sewage generated from laundry, bathing, and dishwashing. Grey water can be purified through simple physical and biological treatment processes, and can then be used for irrigating plants, flushing toilets, cleaning floors, and other nondrinking water purposes, thereby achieving WR conservation and recycling.
With the continuous development of the tourism industry, the discharge of gray water has been increasing year by year. According to statistics, the overall gray water discharge from China’s tourism industry reached approximately 50.89 billion cubic meters in 2018. Among them, gray water discharge from hotels and tourist attractions accounts for the largest proportion [6,7]. At present, the gray water discharge standards for China’s tourism industry are relatively lagging, and some regions have not even formulated the corresponding gray water discharge standards. This has led to non-standard discharge standards for gray water in the tourism industry, making it difficult to unify management and supervision, which has had a certain impact on the environment. Especially in the peak tourist season, the capacity of gray water treatment facilities in some tourist attractions and hotels is insufficient, which makes it difficult to effectively treat the gray water discharge and has a certain impact on the surrounding environment. The treatment of gray water discharge in the tourism industry faces certain difficulties and challenges [8,9]. On the one hand, the discharge of gray water from the tourism industry involves multiple departments and fields, making governance difficult. On the other hand, some tourist attractions and hotels have problems such as irregular gray water discharge, lack of treatment facilities, and high treatment costs [10,11].
2.1.1 Agricultural gray WF
This article selected the value of nitrogen element as the evaluation standard and used the surface pollution source formula for calculation. The formula is as follows:
Among them,
2.1.2 Industrial ash WF
The key pollutants in industrial sewage are chemical oxygen demand and ammonia nitrogen, so the above two are selected as indicators to calculate industrial ash WF:
Among them,
2.1.3 Living ash WF
Living sewage and industrial sewage are both point source pollution, and their key pollutants are the same as industrial sewage. Therefore, the calculation formulas of living ash WF are as follows:
2.1.4 Regional total gray WF
The total ash WF can be obtained by summing the agricultural, industrial, and living ash WF. The calculation formula is as follows:
Among them,
2.2 China gray WF rectification suggestions
The current situation of China’s tourism gray WF cannot be ignored. In order to achieve the sustainable development of tourism, it is necessary to strengthen the management and supervision of graywater discharge in tourism and formulate the corresponding graywater discharge standards, to strengthen the construction, operation, and maintenance of graywater treatment facilities in tourist attractions and hotels. It also needs to promote cleaner production, water-saving technology, and other means, and reduce the waste and pollution of WR, to jointly achieve the sustainable development of tourism [12,13].
2.2.1 Improved regional balance
To improve the gray WF in China’s economy, it is necessary to adjust the traditional industrial structure, increase the independent research and development of wastewater treatment technology, and formulate a set of scientific and practical wastewater treatment schemes. At the same time, it is also necessary to carry out discharge permission and water environment monitoring for wastewater, to gradually improve the utilization efficiency of WR, minimize the gray WF of each region, and improve the environmental fairness of WR [14,15]. Scientific and feasible wastewater treatment schemes include biological treatment, chemical treatment, physical treatment, plant treatment, and so on. The eastern region should focus on the remediation of water pollution in provinces and cities with high internal gray WF and conduct a comprehensive investigation of pollution sources, to promote the innovation of sewage treatment technology and improve the urban drainage network and the normalized urban and rural water quality monitoring system. Reducing the gray WF in the central and western regions is the key to improving the balance of China’s gray WF and improving the equity of the water environment. Therefore, it is necessary to do the following work: On the basis of promoting efficient farmland irrigation technology, it is necessary to reduce the loss of pesticides and fertilizers, develop ecological agriculture, and gradually replace fertilizers; it is necessary to strengthen the management of high pollution industries, complete rectification within the specified time, and vigorously develop “green” industries; while implementing sewage treatment projects, the construction of sewage treatment projects should be strengthened to fully utilize their functions; on this basis, further research and development would be carried out on a water quality purification system suitable for the local area.
2.2.2 Improved structural balance
Improving the balance degree of agricultural gray WF: Improving the balance degree of China’s economic aggregate gray WF and controlling water pollution are the key work of each major agricultural pollution province. In the planting industry, various effective irrigation methods are adopted based on the local situation, and soil testing and fertilization formulas are applied. Biopesticide technology is developed, and economic subsidies are provided to farmers developing ecological agriculture. In the aquaculture industry, reasonable scale control has been implemented for livestock and poultry farming. Feed quality has been adjusted, and dry and fecal cleaning technologies have been promoted to minimize pollution emissions. On this basis, people have proposed a sustainable development model with livestock and poultry breeding, biogas production, and composting as the main goals. Livestock and poultry breeding biogas production composting is a production mode that comprehensively utilizes livestock and poultry manure. Specifically, the feces generated during livestock and poultry farming can be fermented to produce biogas and compost, which can be used for energy and fertilizer production, thus achieving waste resource utilization and environmental protection. Improving the balance of industrial sewage footprint: Heat energy and process water should be saved, and the reuse of industrial water should be improved by using technologies such as sewage closed-circuit reuse; by diverting clean and dirty water from drainage pipelines, the sewage treatment and standard discharge rate can be improved; for enterprises with severe pollution, rectification can be carried out within the specified time to meet the requirements. Improving the level-by-level balance of living wastewater: The resource utilization of living wastewater should be promoted, and public ecological awareness should be raised. Water prices and sewage treatment costs should be adjusted, and the scope of collection should be expanded. Collection standards should be raised, and the popularization of living wastewater treatment facilities and water-saving equipment in underdeveloped areas should be accelerated, thereby improving the fairness of the water environment. Before the sewage enters the sewage treatment plant, pretreatment facilities such as grids, sand settling tanks, and regulating tanks can be set up to pretreat the wastewater and remove suspended and sediment particles of large particles, to reduce the burden on the sewage treatment plant.
3 Experimental evaluation of WR utilization and tourism environment assessment based on WF
3.1 Experimental design
Background and significance of the experiment: With the development of the tourism industry, the increase in WC and wastewater discharge has become one of the important issues in WR management and environmental protection [16]. The increase in WC and wastewater discharge in the tourism industry may have an impact on the sustainability of the tourism industry. If the tourism industry causes damage to the local WR and environment, it may affect the long-term development of the local tourism industry. Traditional WR management methods are no longer able to meet the sustainable development needs of the tourism industry. Therefore, researching and developing new WR management technologies is crucial for the sustainable development of the tourism industry. This article aims to evaluate the impact of different WR management technologies on the WC, wastewater discharge, WR utilization efficiency, and environmental risk index of the tourism industry, and provide sustainable WR management solutions for the tourism industry.
The WF algorithm is a method to assess the consumption of WRs by human activities. It quantifies the impact of human activities on WRs and expresses it as WF. In the experimental analysis of WRs utilization and tourism environment assessment based on WF, this article can integrate the WF algorithm into it to better analyze the utilization and protection of WRs [17].
In terms of WRs utilization, this article can use the WF algorithm to measure the use of WRs by various human activities. For example, in the tourism industry, the WF algorithm can be used to assess the consumption of local WRs by tourism activities. This way, this article can better understand the WR needs of different tourism activities and develop reasonable tourism planning and management measures to minimize WR waste and pollution [18].
For the experimental analysis of tourism environmental assessment, this article can use the WF algorithm to assess the status of local WRs. By measuring the WF, we can understand the impact of various human activities on WRs, to help us assess the local WRs utilization and protection. When evaluating the tourism environment, WF can be used as an important evaluation indicator to better understand the impact of tourism activities on local WRs, to better develop tourism planning and management measures to minimize waste and pollution of WRs.
Integrating the WF algorithm into the experimental analysis of WRs utilization and tourism environment assessment based on WF can help people better understand the consumption of WRs by human activities, assess the impact of tourism activities on WRs, and develop better tourism planning and management measures to protect local WRs [19,20].
Experimental Area: This article selects different types of tourist areas, including mountainous tourist attractions, tourist cities, lake scenic areas, and coastal tourist areas.
Experimental group and control group: This article would use WR management schemes of low WC technology, renewable water utilization technology, ecological restoration technology, and rainwater collection technology as the experimental group. This article would use traditional WR management schemes as the control group.
3.2 Experimental steps
Step 1: Determining the experimental area, experimental group, and control group.
First, different types of tourist areas were selected, including mountainous tourist attractions, tourist cities, lake scenic areas, and coastal tourist areas (as shown in Figure 2). The experimental area was divided into an experimental group and a control group. The experimental group adopted a WR management plan consisting of low WC technology, renewable water utilization technology, ecological restoration technology, and rainwater collection technology, while the control group used traditional WR management plans as the control group.
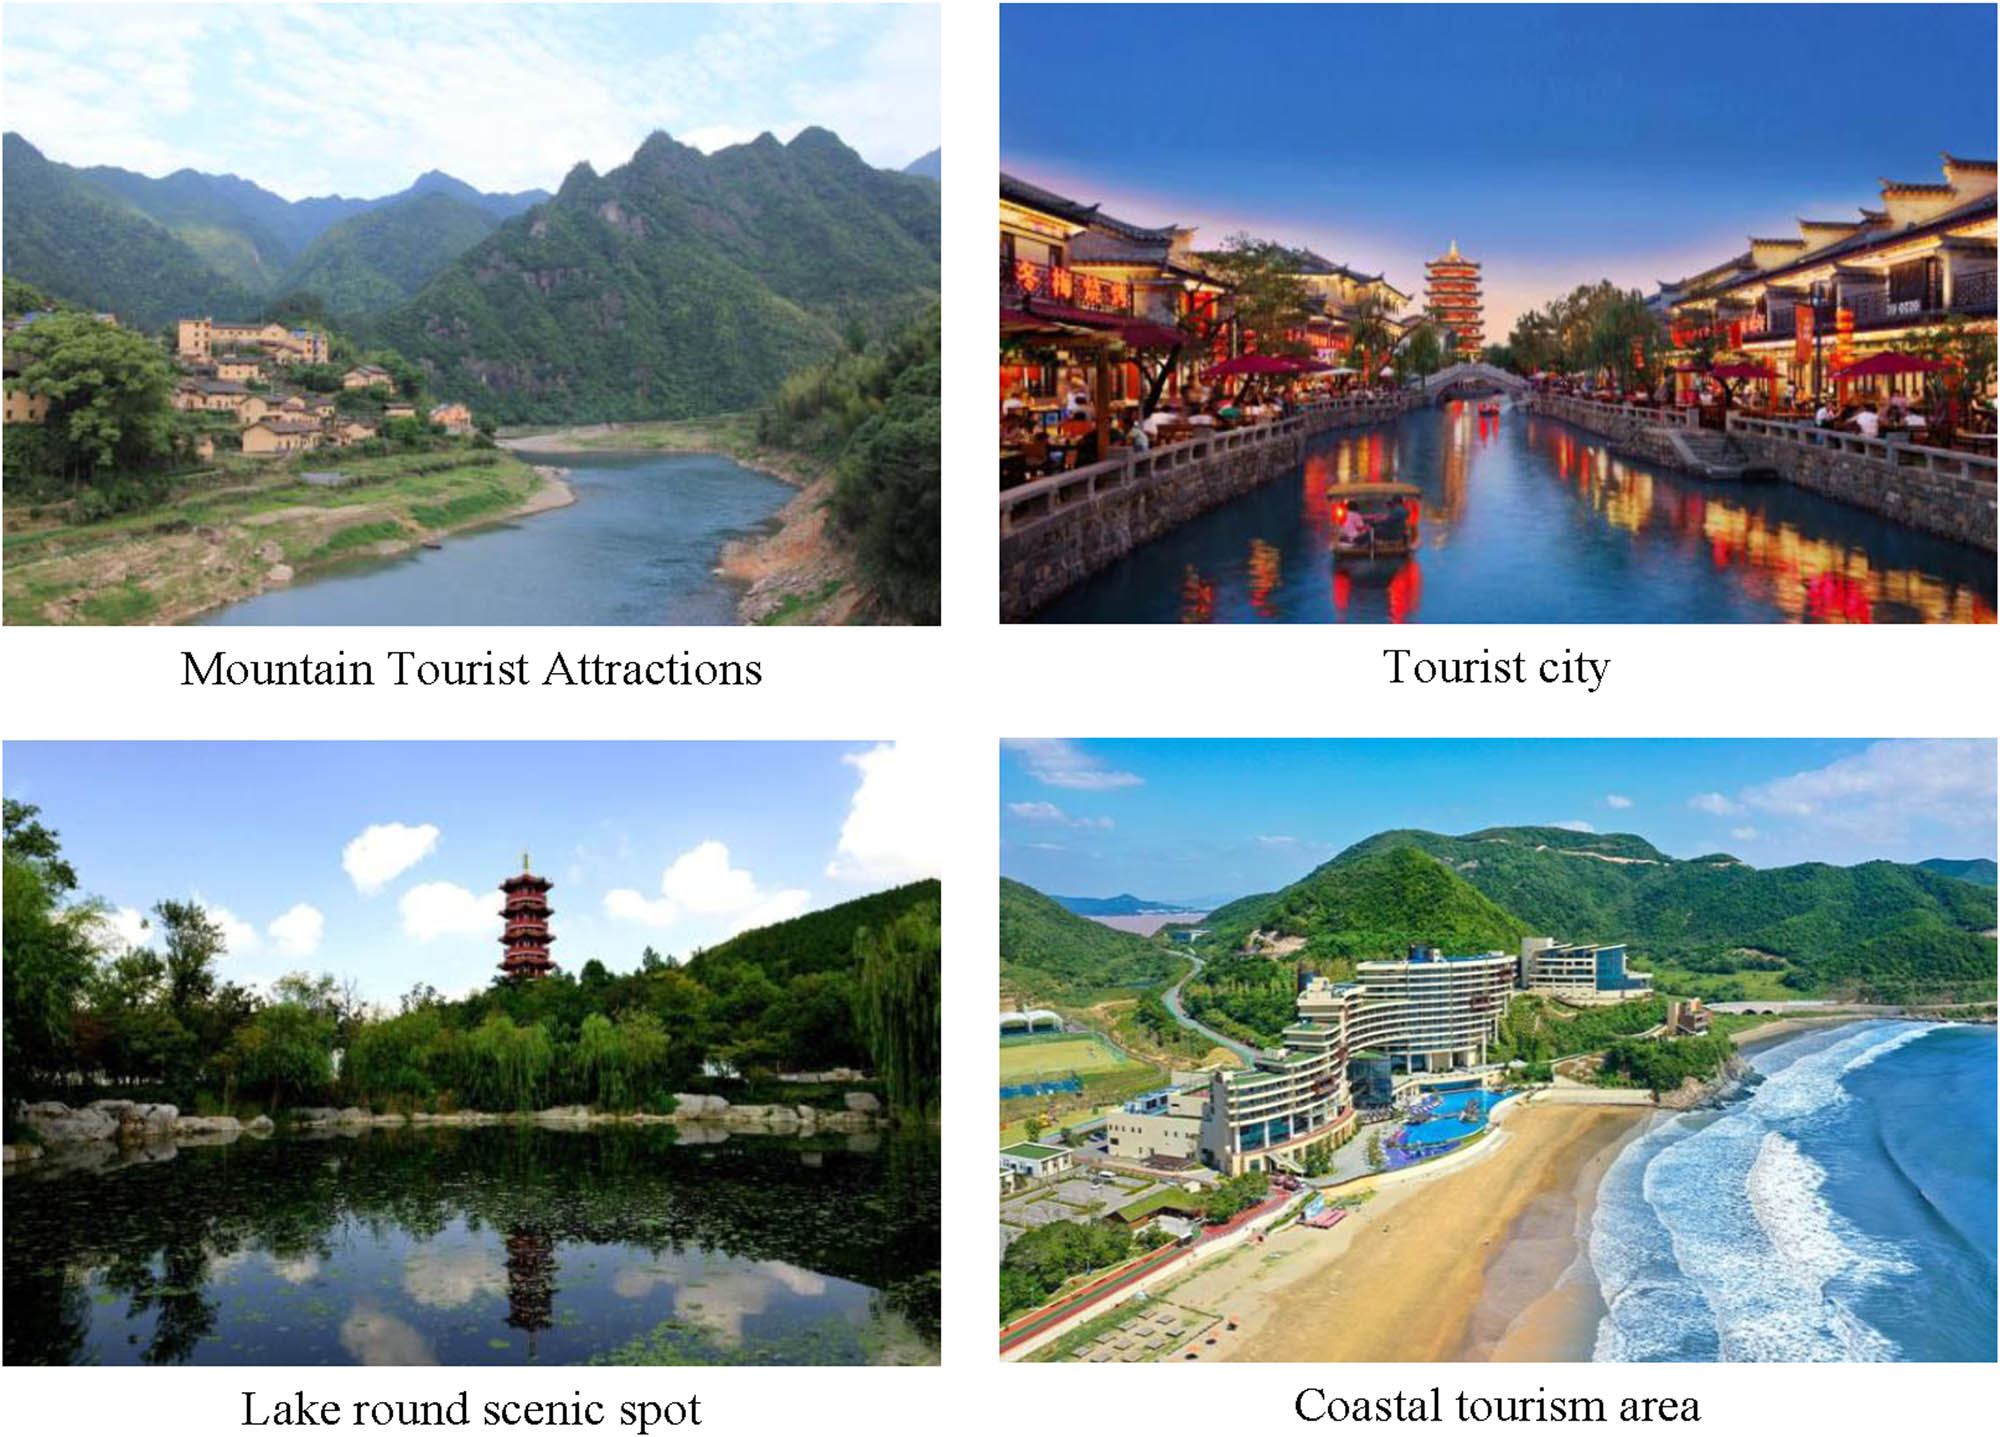
Study area map.
Step 2: Collecting data on tourism WC and wastewater discharge in the experimental area, and calculating WR utilization efficiency and environmental risk index
The calculation formula for WC in the tourism industry is WC in the tourism industry = number of tourists × WC coefficient of tourism industry;
The calculation formula for wastewater discharge is wastewater discharge = tourism WC × wastewater discharge coefficient.
The calculation formula for WR utilization efficiency is WR utilization efficiency = tourism WC/total WR × 100%;
The calculation formula for the environmental risk index is environmental risk index = wastewater discharge/water environment capacity × 100%.
In the experimental group, different WR management technologies were used to control and manage the WC and wastewater discharge of the tourism industry.
Step 3: The experimental group adopted a WR management plan consisting of low WC technology, renewable water utilization technology, ecological restoration technology, and rainwater collection technology to control and manage the WC and wastewater discharge of the tourism industry.
Low WC technology includes measures such as improving equipment, adjusting equipment, adjusting water quality, and controlling water flow;
Renewable water utilization technology includes measures such as irrigation, flushing, and recycled water circulation;
Ecological restoration technologies include measures such as wetland restoration, vegetation restoration, and soil restoration;
Rainwater collection technology includes measures such as rainwater collection and utilization.
Step 4: The data of the experimental group and the control group were compared. The impact of different WR management technologies on tourism WC, wastewater discharge, WR utilization efficiency, and environmental risk index was analyzed.
Using statistical methods, data were analyzed and processed using software such as SPSS (Statistical Product and Service Solutions) to obtain experimental results.
3.3 Experimental data processing and evaluation
The WR utilization and tourism environment assessment based on the WF has important research significance to different types of tourism regions, which helps to promote the sustainable development of tourism, improve the efficiency of WR utilization, and promote the improvement of WR management theory. This article selects different types of tourist areas, including mountainous tourist attractions, tourist cities, lake scenic areas, and coastal tourist areas. Different tourist attractions and enterprises were selected from different tourist regions, and data on WC and wastewater discharge in the tourism industry were collected. At the same time, data on the total amount of WR and water environmental capacity in various tourist areas were also collected. After data processing, data on tourism WC, wastewater discharge, WR utilization efficiency, and environmental risk index were obtained. This article used software such as SPSS to analyze the data. First, descriptive statistical analysis was conducted on the WC, wastewater discharge, WR utilization efficiency, and environmental risk index of the tourism industry to obtain statistical indicators such as average and standard deviation of each indicator. Methods such as analysis of variance were used to compare the data of the experimental group and the control group and to obtain the effects of different WR management technologies on tourism WC, wastewater discharge, WR utilization efficiency, and environmental risk index.
The blue WF and green WF are two different types of WF, which refer to the amount of fresh water and rainwater used by human beings, respectively. The blue WF and green WF of the tourist attraction can be calculated according to the WC and water use mode of the tourist attraction. At the same time, the gray WF of the scenic spot can be calculated according to the sewage discharge of the scenic spot. According to the calculation results, the influencing factors were analyzed, such as the development level of the tourism industry and the scarcity of WR. The results are shown in Table 1.
Data of WC and WF of four tourist attractions
| Tourist attraction | WC | Blue WF | Green WF | Gray WF |
|---|---|---|---|---|
| Mountain tourist attractions | 500 | 250 | 100 | 50 |
| Tourist city | 800 | 400 | 150 | 100 |
| Lake scenic area | 1,000 | 500 | 200 | 150 |
| Coastal tourism area | 1,200 | 600 | 250 | 200 |
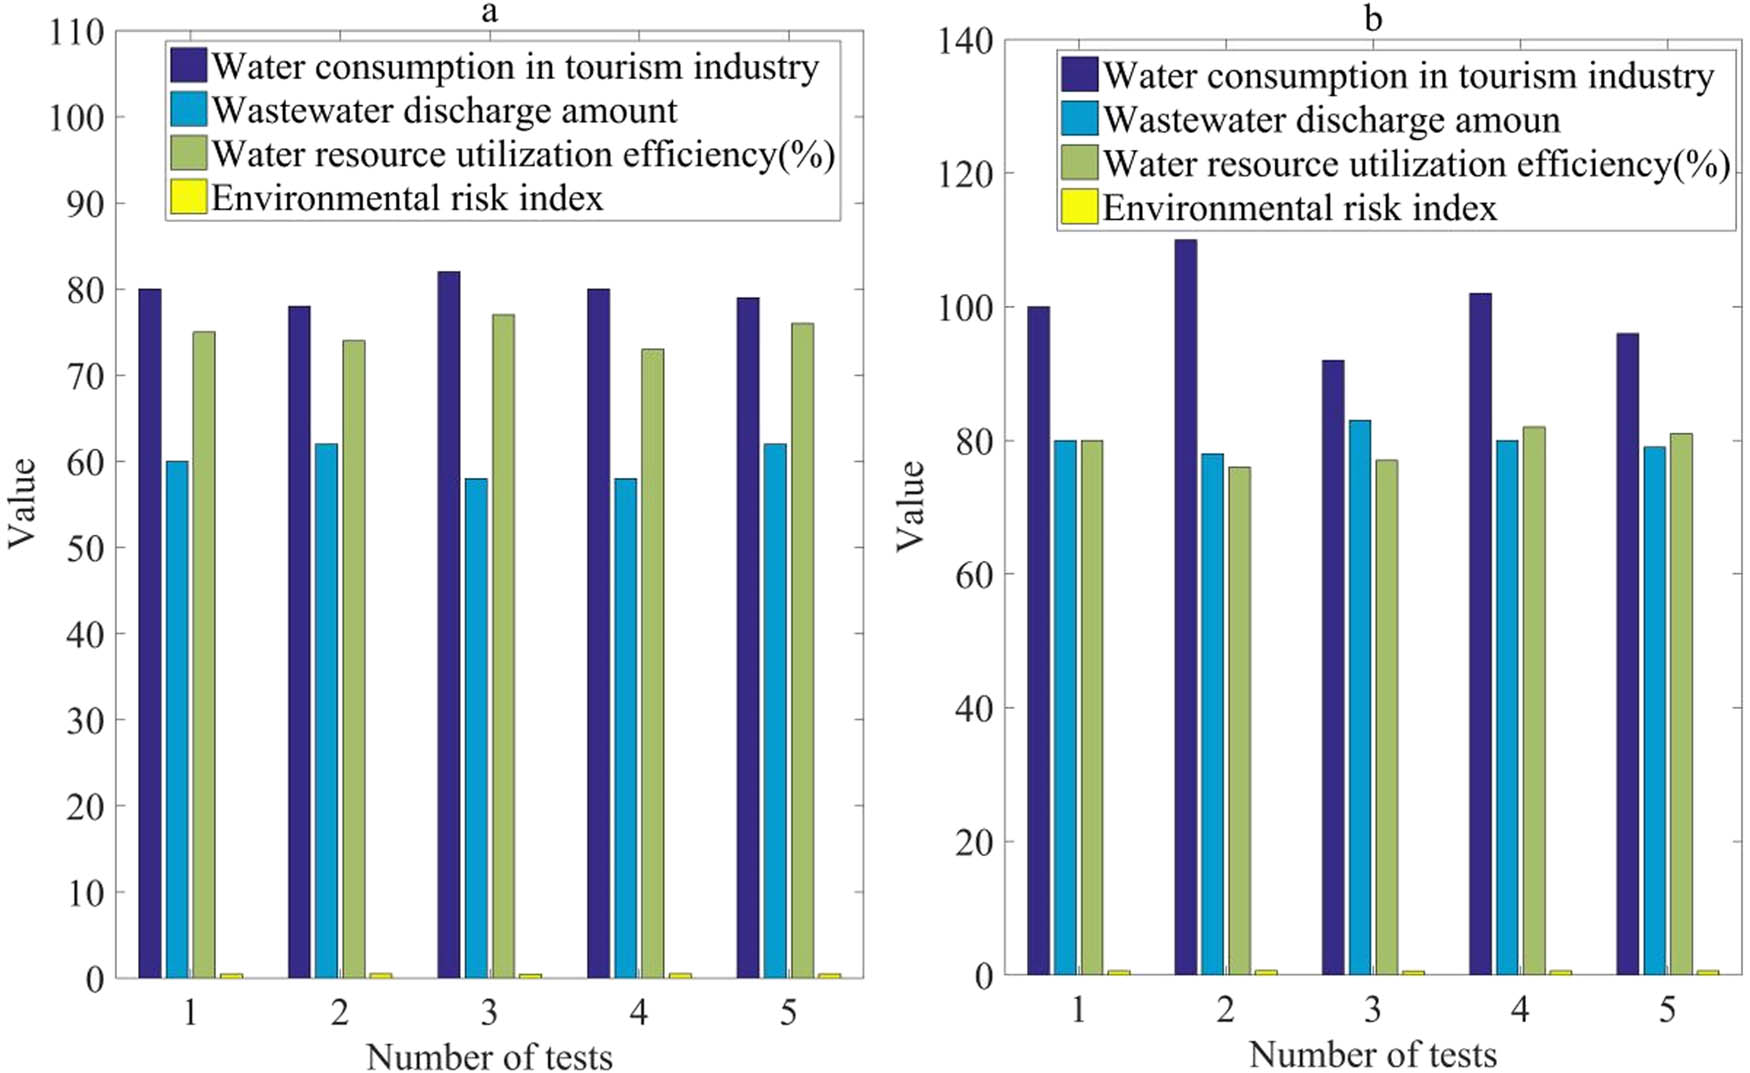
This article conducted a comparative experiment on WR management in a mountainous tourist attraction using low WC technology. The experimental group adopted low WC technology for WR management in tourist attractions, while the control group adopted traditional WR management in tourist attractions. Figure 3 shows the experimental results. The units of WC and wastewater discharge in the tourism industry in the following text were both 10,000 m3.
WR management scheme for low WC technology.
Figure 3(a) shows the WR management plan for mountainous tourist attractions in the experimental group, and Figure 3(b) shows the WR management plan for mountainous tourist attractions in the control group. In Figure 3, the WC of the tourism industry using low WC technology in a certain mountainous tourist attraction was approximately 150,000 m3, and the wastewater discharge was approximately 90,000 m3. The efficiency of WR utilization was approximately 68%, and the environmental risk index was approximately 0.25. The tourism industry using traditional WR management schemes consumes approximately 270,000 m3 of water and discharges approximately 200,000 m3 of wastewater. The efficiency of WR utilization was approximately 57%, and the environmental risk index was approximately 0.45. Therefore, it could be concluded that the use of low WC technology in mountainous tourist attractions was more effective than traditional solutions.
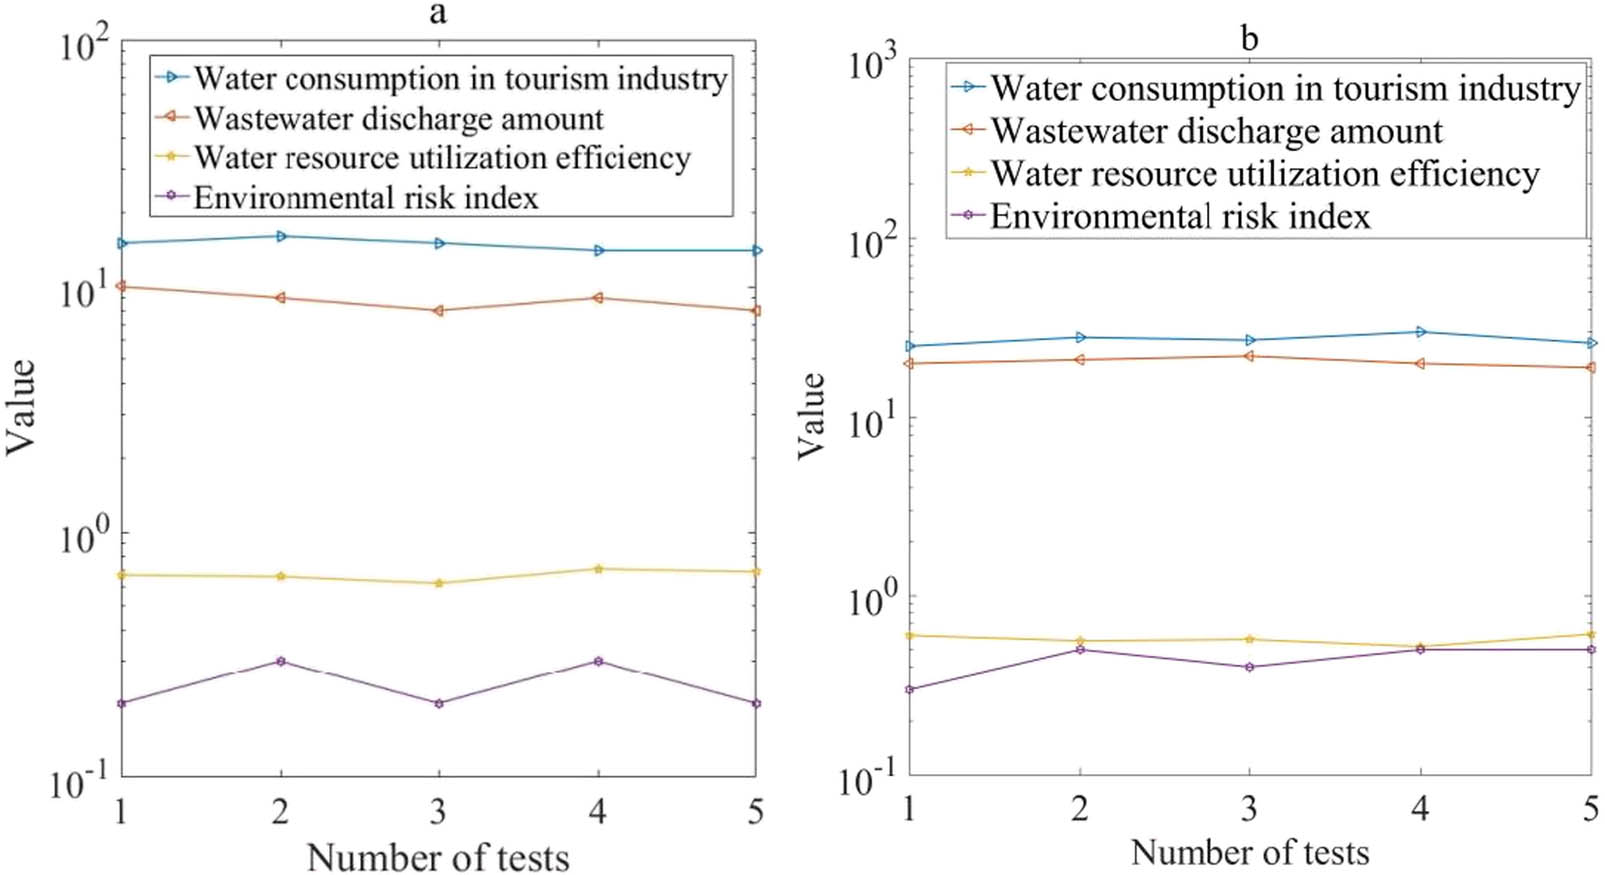
This article presents a comparative experiment on WR management in a tourist city using renewable water technology. The experimental group adopted renewable water utilization technology for WR management in tourist cities, while the control group adopted traditional WR management in tourist cities. Figure 4 shows the experimental results.
WR management plan for renewable water utilization technology.
In Figure 4, Figure 4(a) shows the WR management scheme of renewable water utilization technology, and Figure 4(b) shows the traditional WR management scheme. In Figure 4, the WC of the tourism industry under the use of renewable water technology in a certain tourist city was approximately 800,000 m3, and the wastewater discharge was approximately 600,000 m3. The efficiency of WR utilization was approximately 75%, and the environmental risk index was approximately 0.5. The tourism industry using traditional WR management schemes consumes approximately 1 million m3 of water and discharges approximately 800,000 m3 of wastewater. The efficiency of WR utilization was approximately 80%, and the environmental risk index was approximately 0.6. Although the use of renewable water technology in tourist cities was more effective than traditional schemes, the utilization rate of WR was still not as good as traditional schemes, so rectification was needed.
This article presents a comparative experiment on WR management in a lake scenic area using ecological restoration technology. The experimental group adopted ecological restoration technology for WR management in lake scenic areas, while the control group adopted traditional WR management in lake scenic areas. Tables 2 and 3 show the experimental results.
WR management plans for ecological restoration technology
| WC in tourism industry | Wastewater discharge amount | WR utilization efficiency (%) | Environmental risk index | |
|---|---|---|---|---|
| 1 | 35 | 25 | 71 | 0.4 |
| 2 | 36 | 26 | 72 | 0.38 |
| 3 | 38 | 23 | 77 | 0.42 |
| 4 | 32 | 28 | 68 | 0.4 |
| 5 | 33 | 23 | 68 | 0.4 |
WR Management solutions for traditional technologies
| WC in tourism industry | Wastewater discharge amount | WR utilization efficiency (%) | Environmental risk index | |
|---|---|---|---|---|
| 1 | 50 | 40 | 80 | 0.3 |
| 2 | 48 | 38 | 80 | 0.28 |
| 3 | 50 | 38 | 78 | 0.28 |
| 4 | 51 | 40 | 80 | 0.3 |
| 5 | 49 | 42 | 83 | 0.32 |
In Tables 2 and 3, the tourism industry’s WC and wastewater discharge under the ecological restoration technology in a certain lake scenic area were approximately 350,000 and 250,000 m3, respectively. The efficiency of WR utilization was approximately 71%, and the environmental risk index was approximately 0.4. The tourism industry using traditional WR management schemes consumes approximately 500,000 m3 of water and discharges approximately 400,000 m3 of wastewater. The efficiency of WR utilization was approximately 80%, and the environmental risk index was approximately 0.3. Traditional solutions were more effective in tourist cities.
This article presents a comparative experiment on WR management in a coastal tourism area using rainwater harvesting technology. The experimental group adopted rainwater harvesting technology for WR management in coastal tourism areas, while the control group adopted traditional WR management in coastal tourism areas. Figure 5 shows the experimental results.
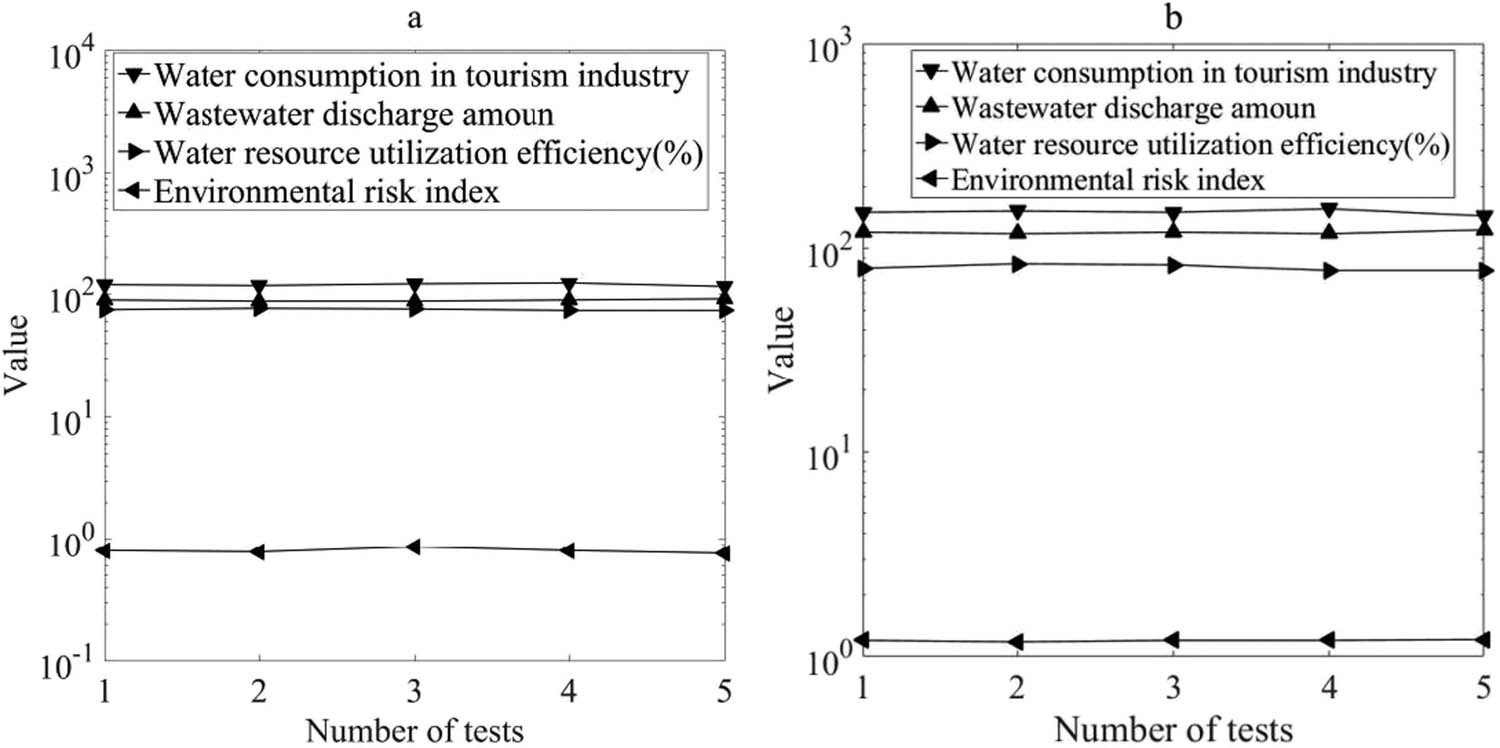
WR management plan for rainwater harvesting technology.
In Figure 5, Figure 5(a) shows a WR management scheme using rainwater harvesting technology, and Figure 5(b) shows a traditional WR management scheme. In Figure 5, the WC of the tourism industry using rainwater harvesting technology in a certain coastal tourism area was approximately 1.2 million m3, and the wastewater discharge was approximately 900,000 m3. The efficiency of WR utilization was approximately 75%, and the environmental risk index was approximately 0.8. The tourism industry using traditional WR management schemes consumes approximately 1.5 million m3 of water and discharges approximately 1.2 million m3 of wastewater. The efficiency of WR utilization was approximately 80%, and the environmental risk index was approximately 1.2. From this, it could be concluded that the environmental pollution risks of using both traditional schemes and rainwater harvesting techniques in coastal tourist areas were very high, so they could not be adopted.
3.4 Rectification opinions
For the four experiments designed for WR utilization and tourism environment assessment based on WF, the following rectification opinions are adopted in this article:
Experiment 1: comparative experiments on WR management in tourist attractions using low WC technology
For tourist attractions with high WC, WC can be reduced by introducing water-saving equipment and improving facilities. For scenic spots with low WR utilization efficiency, it is possible to strengthen the management and protection of WR, promote water-saving measures, and improve the utilization efficiency of WR. The scenic spot management department should strengthen education and guidance for tourists, enhance their environmental and water-saving awareness, and further reduce the waste and loss of WR.
Experiment 2: comparative experiment of water pollution control technologies in tourist attractions
For scenic spots with poor water quality, the construction and operation of sewage treatment facilities should be strengthened to ensure that the effective treatment and discharge of sewage meet the standards. For scenic spots with good water quality, source control should be carried out, the management and guidance of tourists should be strengthened, illegal pollution discharge and littering should be reduced, and the quality of WR should be protected. For scenic areas with poor sewage treatment efficiency, technical transformation and equipment updates should be strengthened to improve sewage treatment efficiency and quality.
Experiment 3: comparative experiment of WR management planning in tourist attractions
For scenic spots with sufficient WR utilization, it is necessary to strengthen the protection and management of WR, establish WR management plans, and develop scientific and reasonable WR utilization plans. For scenic areas with water scarcity, scientific and reasonable WR utilization measures should be taken, and the promotion and application of water-saving measures should be strengthened to improve the efficiency of WR utilization. The scenic area management department should establish a reasonable WR management system based on the actual situation of the scenic area and strengthen the supervision and protection of WR.
Experiment 4: comparative experiment of water energy consumption in tourist attractions
For scenic areas with high energy consumption, clean energy and energy-saving technologies should be adopted to reduce energy consumption and environmental impact. For scenic areas with low energy utilization efficiency, energy management and regulation should be strengthened, advanced technologies and management models of energy management should be promoted, and energy utilization efficiency should be improved. The scenic area management department should strengthen education and guidance for tourists, enhance their awareness of environmental protection and energy conservation, and reduce energy waste and loss.
This article should strengthen the scientific and reasonable planning and management in WR management and environmental protection of tourist attractions, and actively promote water-saving, energy-saving, and other technical means, to strengthen the education and guidance of tourists, thus improving the environmental awareness and water-saving awareness of tourists and jointly achieving the sustainable development of tourist attraction.
4 Conclusion
This article aimed to evaluate the WR utilization and tourism environment of tourist attractions based on the WF method. Through the WF assessment of different tourist attractions, it is found that there are obvious differences in the WR utilization efficiency of different tourist attractions. Some scenic spots have successfully reduced WC and improved WR utilization efficiency by adopting low WC technology and improving WR management; however, some scenic spots face problems such as WR waste and poor management, leading to waste and loss of WR. When formulating WR management plans for scenic spots, it is necessary to fully consider the impact of the tourism environment and develop scientific and reasonable management measures. The experimental design of WR utilization and tourism environment assessment based on WF can provide a scientific basis for the WR management of tourist attractions, find problems and improve them, and promote the sustainable development of tourist attractions. It is suggested that the WF method should be widely used in the WR management of tourist attractions to strengthen the management and protection of WR and improve the utilization efficiency of WR, to achieve sustainable development. This article only provided evaluation and improvement suggestions for WR utilization and environmental protection and did not involve other factors that affect the sustainable development of the tourism industry, such as cultural, social, and economic factors.
-
Funding information: This work was supported by Project No. XP201811S, 2018 Wuyi University Scientific Research Platform project, subject name: Research on Tourism Experience Marketing of World Heritage Sites; Project No. YJ202312, 2023 Wuyi University talent introduction research start-up funding project, subject name: Research on the Spatio temporal Evolution and Driving Mechanism of Mount Wuyi Recreational Space, a World Double Heritage Site.
-
Conflict of interest: There is no potential conflict of interest in our article, and all authors have seen the manuscript and approved it to submit to your journal. We confirm that the content of the manuscript has not been published or submitted for publication elsewhere.
References
[1] Yang Y. Evaluation of China’s water-resource utilization efficiency based on a DEA-Tobit two-stage model. Water Supply. 2021;21(4):1764–77.10.2166/ws.2020.349Search in Google Scholar
[2] Xie Q, Ma H, Zheng X, Wang X, Wang FY. Evaluation and spatial–temporal difference analysis of Urban water resource utilization efficiency based on two-stage DEA model. IEEE Trans Comput Soc Syst. 2021;9(5):1282–96.10.1109/TCSS.2021.3116043Search in Google Scholar
[3] Wang H, Huang J, Cheng X, Zhou H, Yuan Y. Scenario simulation of water resources development and utilization based on a system dynamics model. Int J Water Resour Dev. 2022;38(3):447–63.10.1080/07900627.2021.1908235Search in Google Scholar
[4] Marston L, Ao Y, Konar M, Mekonnen MM, Hoekstra AY. High‐resolution water footprints of production of the United States. Water Resour Res. 2018;54(3):2288–316.10.1002/2017WR021923Search in Google Scholar
[5] Vanham D, Comero S, Gawlik BM, Bidoglio G. The water footprint of different diets within European sub-national geographical entities. Nat Sustain. 2018;1(9):518–25.10.1038/s41893-018-0133-xSearch in Google Scholar
[6] Tian C, Peng J, Zhang W, Zhang S, Wang J. Tourism environmental impact assessment based on improved AHP and picture fuzzy Promethee II methods. Technol Econ Dev Econ. 2020;26(2):355–78.10.3846/tede.2019.11413Search in Google Scholar
[7] Giddy JK, Webb NL. The influence of the environment on adventure tourism: From motivations to experiences. Curr Issues Tour. 2018;21(18):2124–38.10.1080/13683500.2016.1245715Search in Google Scholar
[8] Zhang W, Qin Q. Decoupling analysis on water resources utilization of planting industry and economic development in Shaanxi Province from the perspective of water footprint. Zhongguo Shengtai Nongye Xuebao/Chin J Eco-Agric. 2019;27(1):153–62.Search in Google Scholar
[9] Wang Z, Jiang Q, Fu Q, Jiang X, Mo K. Eco-environmental effects of water resources development and utilization in the Sanjiang Plain, Northeast China. Water Sci Technol: Water Supply. 2018;18(3):1051–61.10.2166/ws.2017.177Search in Google Scholar
[10] Chu S. Study on comprehensive utilization of water resource environment in water-saving design of buildings. Acad J Environ Earth Sci. 2021;3(3):47–50.10.25236/AJEE.2021.030310Search in Google Scholar
[11] Fan J, Liu X, Wang D. Study on ecosystem services and spatial and temporal evolution of water resources development and utilization in Gansu Province. Ekoloji. 2018;27(106):1029–39.Search in Google Scholar
[12] Zhang Y. Research on ecological environmental protection and utilization of water resource—Investigation and data analysis on ecological practice of five villages in Jiangsu, Jiangxi, Hubei, Hunan and Gansu. J Coast Res. 2020;115(SI):522–5.10.2112/JCR-SI115-143.1Search in Google Scholar
[13] Li Z, Xu X, Sheng X, Lin P, Tang J, Pan L, et al. Solar-powered sustainable water production: state-of-the-art technologies for sunlight–energy–water nexus. ACS Nano. 2021;15(8):12535–66.10.1021/acsnano.1c01590Search in Google Scholar PubMed
[14] Jani KA, Chaubey NK. A novel model for optimization of resource utilization in smart agriculture system using IoT (SMAIoT). IEEE Internet Things J. 2021;9(13):11275–82.10.1109/JIOT.2021.3128161Search in Google Scholar
[15] Apriani M, Hadi W, Masduqi A. Physicochemical properties of sea water and bittern in Indonesia: Quality improvement and potential resources utilization for marine environmental sustainability. J Ecol Eng. 2018;19(3):1–10.10.12911/22998993/86150Search in Google Scholar
[16] Harris F, Moss C, Joy EJ, Quinn R, Scheelbeek PF, Dangour AD, et al. The water footprint of diets: a global systematic review and meta-analysis. Adv Nutr. 2020;11(2):375–86.10.1093/advances/nmz091Search in Google Scholar PubMed PubMed Central
[17] Dazhi X, Yuan Y, Xiao X. Evaluation of water resources carrying capacity based on ecological footprint. Acad J Environ Biol. 2021;2(2):12–20.10.38007/AJEB.2021.020202Search in Google Scholar
[18] Ankite S. Water resources ecological footprint based on ARIMA model. Acad J Environ Biol. 2022;3(4):37–44.10.38007/AJEB.2022.030405Search in Google Scholar
[19] Ginty A. Evaluation technology of tourism environmental capacity of nature reserves based on big data. Nat Environ Prot. 2021;2(3):40–9.10.38007/NEP.2021.020305Search in Google Scholar
[20] Olga D. Natural environment and sustainable development of rural tourism based on deep learning. Nat Environ Prot. 2021;2(4):28–37.10.38007/NEP.2021.020404Search in Google Scholar
© 2023 the author(s), published by De Gruyter
This work is licensed under the Creative Commons Attribution 4.0 International License.
Articles in the same Issue
- Regular Articles
- Diagenesis and evolution of deep tight reservoirs: A case study of the fourth member of Shahejie Formation (cg: 50.4-42 Ma) in Bozhong Sag
- Petrography and mineralogy of the Oligocene flysch in Ionian Zone, Albania: Implications for the evolution of sediment provenance and paleoenvironment
- Biostratigraphy of the Late Campanian–Maastrichtian of the Duwi Basin, Red Sea, Egypt
- Structural deformation and its implication for hydrocarbon accumulation in the Wuxia fault belt, northwestern Junggar basin, China
- Carbonate texture identification using multi-layer perceptron neural network
- Metallogenic model of the Hongqiling Cu–Ni sulfide intrusions, Central Asian Orogenic Belt: Insight from long-period magnetotellurics
- Assessments of recent Global Geopotential Models based on GPS/levelling and gravity data along coastal zones of Egypt
- Accuracy assessment and improvement of SRTM, ASTER, FABDEM, and MERIT DEMs by polynomial and optimization algorithm: A case study (Khuzestan Province, Iran)
- Uncertainty assessment of 3D geological models based on spatial diffusion and merging model
- Evaluation of dynamic behavior of varved clays from the Warsaw ice-dammed lake, Poland
- Impact of AMSU-A and MHS radiances assimilation on Typhoon Megi (2016) forecasting
- Contribution to the building of a weather information service for solar panel cleaning operations at Diass plant (Senegal, Western Sahel)
- Measuring spatiotemporal accessibility to healthcare with multimodal transport modes in the dynamic traffic environment
- Mathematical model for conversion of groundwater flow from confined to unconfined aquifers with power law processes
- NSP variation on SWAT with high-resolution data: A case study
- Reconstruction of paleoglacial equilibrium-line altitudes during the Last Glacial Maximum in the Diancang Massif, Northwest Yunnan Province, China
- A prediction model for Xiangyang Neolithic sites based on a random forest algorithm
- Determining the long-term impact area of coastal thermal discharge based on a harmonic model of sea surface temperature
- Origin of block accumulations based on the near-surface geophysics
- Investigating the limestone quarries as geoheritage sites: Case of Mardin ancient quarry
- Population genetics and pedigree geography of Trionychia japonica in the four mountains of Henan Province and the Taihang Mountains
- Performance audit evaluation of marine development projects based on SPA and BP neural network model
- Study on the Early Cretaceous fluvial-desert sedimentary paleogeography in the Northwest of Ordos Basin
- Detecting window line using an improved stacked hourglass network based on new real-world building façade dataset
- Automated identification and mapping of geological folds in cross sections
- Silicate and carbonate mixed shelf formation and its controlling factors, a case study from the Cambrian Canglangpu formation in Sichuan basin, China
- Ground penetrating radar and magnetic gradient distribution approach for subsurface investigation of solution pipes in post-glacial settings
- Research on pore structures of fine-grained carbonate reservoirs and their influence on waterflood development
- Risk assessment of rain-induced debris flow in the lower reaches of Yajiang River based on GIS and CF coupling models
- Multifractal analysis of temporal and spatial characteristics of earthquakes in Eurasian seismic belt
- Surface deformation and damage of 2022 (M 6.8) Luding earthquake in China and its tectonic implications
- Differential analysis of landscape patterns of land cover products in tropical marine climate zones – A case study in Malaysia
- DEM-based analysis of tectonic geomorphologic characteristics and tectonic activity intensity of the Dabanghe River Basin in South China Karst
- Distribution, pollution levels, and health risk assessment of heavy metals in groundwater in the main pepper production area of China
- Study on soil quality effect of reconstructing by Pisha sandstone and sand soil
- Understanding the characteristics of loess strata and quaternary climate changes in Luochuan, Shaanxi Province, China, through core analysis
- Dynamic variation of groundwater level and its influencing factors in typical oasis irrigated areas in Northwest China
- Creating digital maps for geotechnical characteristics of soil based on GIS technology and remote sensing
- Changes in the course of constant loading consolidation in soil with modeled granulometric composition contaminated with petroleum substances
- Correlation between the deformation of mineral crystal structures and fault activity: A case study of the Yingxiu-Beichuan fault and the Milin fault
- Cognitive characteristics of the Qiang religious culture and its influencing factors in Southwest China
- Spatiotemporal variation characteristics analysis of infrastructure iron stock in China based on nighttime light data
- Interpretation of aeromagnetic and remote sensing data of Auchi and Idah sheets of the Benin-arm Anambra basin: Implication of mineral resources
- Building element recognition with MTL-AINet considering view perspectives
- Characteristics of the present crustal deformation in the Tibetan Plateau and its relationship with strong earthquakes
- Influence of fractures in tight sandstone oil reservoir on hydrocarbon accumulation: A case study of Yanchang Formation in southeastern Ordos Basin
- Nutrient assessment and land reclamation in the Loess hills and Gulch region in the context of gully control
- Handling imbalanced data in supervised machine learning for lithological mapping using remote sensing and airborne geophysical data
- Spatial variation of soil nutrients and evaluation of cultivated land quality based on field scale
- Lignin analysis of sediments from around 2,000 to 1,000 years ago (Jiulong River estuary, southeast China)
- Assessing OpenStreetMap roads fitness-for-use for disaster risk assessment in developing countries: The case of Burundi
- Transforming text into knowledge graph: Extracting and structuring information from spatial development plans
- A symmetrical exponential model of soil temperature in temperate steppe regions of China
- A landslide susceptibility assessment method based on auto-encoder improved deep belief network
- Numerical simulation analysis of ecological monitoring of small reservoir dam based on maximum entropy algorithm
- Morphometry of the cold-climate Bory Stobrawskie Dune Field (SW Poland): Evidence for multi-phase Lateglacial aeolian activity within the European Sand Belt
- Adopting a new approach for finding missing people using GIS techniques: A case study in Saudi Arabia’s desert area
- Geological earthquake simulations generated by kinematic heterogeneous energy-based method: Self-arrested ruptures and asperity criterion
- Semi-automated classification of layered rock slopes using digital elevation model and geological map
- Geochemical characteristics of arc fractionated I-type granitoids of eastern Tak Batholith, Thailand
- Lithology classification of igneous rocks using C-band and L-band dual-polarization SAR data
- Analysis of artificial intelligence approaches to predict the wall deflection induced by deep excavation
- Evaluation of the current in situ stress in the middle Permian Maokou Formation in the Longnüsi area of the central Sichuan Basin, China
- Utilizing microresistivity image logs to recognize conglomeratic channel architectural elements of Baikouquan Formation in slope of Mahu Sag
- Resistivity cutoff of low-resistivity and low-contrast pays in sandstone reservoirs from conventional well logs: A case of Paleogene Enping Formation in A-Oilfield, Pearl River Mouth Basin, South China Sea
- Examining the evacuation routes of the sister village program by using the ant colony optimization algorithm
- Spatial objects classification using machine learning and spatial walk algorithm
- Study on the stabilization mechanism of aeolian sandy soil formation by adding a natural soft rock
- Bump feature detection of the road surface based on the Bi-LSTM
- The origin and evolution of the ore-forming fluids at the Manondo-Choma gold prospect, Kirk range, southern Malawi
- A retrieval model of surface geochemistry composition based on remotely sensed data
- Exploring the spatial dynamics of cultural facilities based on multi-source data: A case study of Nanjing’s art institutions
- Study of pore-throat structure characteristics and fluid mobility of Chang 7 tight sandstone reservoir in Jiyuan area, Ordos Basin
- Study of fracturing fluid re-discharge based on percolation experiments and sampling tests – An example of Fuling shale gas Jiangdong block, China
- Impacts of marine cloud brightening scheme on climatic extremes in the Tibetan Plateau
- Ecological protection on the West Coast of Taiwan Strait under economic zone construction: A case study of land use in Yueqing
- The time-dependent deformation and damage constitutive model of rock based on dynamic disturbance tests
- Evaluation of spatial form of rural ecological landscape and vulnerability of water ecological environment based on analytic hierarchy process
- Fingerprint of magma mixture in the leucogranites: Spectroscopic and petrochemical approach, Kalebalta-Central Anatolia, Türkiye
- Principles of self-calibration and visual effects for digital camera distortion
- UAV-based doline mapping in Brazilian karst: A cave heritage protection reconnaissance
- Evaluation and low carbon ecological urban–rural planning and construction based on energy planning mechanism
- Modified non-local means: A novel denoising approach to process gravity field data
- A novel travel route planning method based on an ant colony optimization algorithm
- Effect of time-variant NDVI on landside susceptibility: A case study in Quang Ngai province, Vietnam
- Regional tectonic uplift indicated by geomorphological parameters in the Bahe River Basin, central China
- Computer information technology-based green excavation of tunnels in complex strata and technical decision of deformation control
- Spatial evolution of coastal environmental enterprises: An exploration of driving factors in Jiangsu Province
- A comparative assessment and geospatial simulation of three hydrological models in urban basins
- Aquaculture industry under the blue transformation in Jiangsu, China: Structure evolution and spatial agglomeration
- Quantitative and qualitative interpretation of community partitions by map overlaying and calculating the distribution of related geographical features
- Numerical investigation of gravity-grouted soil-nail pullout capacity in sand
- Analysis of heavy pollution weather in Shenyang City and numerical simulation of main pollutants
- Road cut slope stability analysis for static and dynamic (pseudo-static analysis) loading conditions
- Forest biomass assessment combining field inventorying and remote sensing data
- Late Jurassic Haobugao granites from the southern Great Xing’an Range, NE China: Implications for postcollision extension of the Mongol–Okhotsk Ocean
- Petrogenesis of the Sukadana Basalt based on petrology and whole rock geochemistry, Lampung, Indonesia: Geodynamic significances
- Numerical study on the group wall effect of nodular diaphragm wall foundation in high-rise buildings
- Water resources utilization and tourism environment assessment based on water footprint
- Geochemical evaluation of the carbonaceous shale associated with the Permian Mikambeni Formation of the Tuli Basin for potential gas generation, South Africa
- Detection and characterization of lineaments using gravity data in the south-west Cameroon zone: Hydrogeological implications
- Study on spatial pattern of tourism landscape resources in county cities of Yangtze River Economic Belt
- The effect of weathering on drillability of dolomites
- Noise masking of near-surface scattering (heterogeneities) on subsurface seismic reflectivity
- Query optimization-oriented lateral expansion method of distributed geological borehole database
- Petrogenesis of the Morobe Granodiorite and their shoshonitic mafic microgranular enclaves in Maramuni arc, Papua New Guinea
- Environmental health risk assessment of urban water sources based on fuzzy set theory
- Spatial distribution of urban basic education resources in Shanghai: Accessibility and supply-demand matching evaluation
- Spatiotemporal changes in land use and residential satisfaction in the Huai River-Gaoyou Lake Rim area
- Walkaway vertical seismic profiling first-arrival traveltime tomography with velocity structure constraints
- Study on the evaluation system and risk factor traceability of receiving water body
- Predicting copper-polymetallic deposits in Kalatag using the weight of evidence model and novel data sources
- Temporal dynamics of green urban areas in Romania. A comparison between spatial and statistical data
- Passenger flow forecast of tourist attraction based on MACBL in LBS big data environment
- Varying particle size selectivity of soil erosion along a cultivated catena
- Relationship between annual soil erosion and surface runoff in Wadi Hanifa sub-basins
- Influence of nappe structure on the Carboniferous volcanic reservoir in the middle of the Hongche Fault Zone, Junggar Basin, China
- Dynamic analysis of MSE wall subjected to surface vibration loading
- Pre-collisional architecture of the European distal margin: Inferences from the high-pressure continental units of central Corsica (France)
- The interrelation of natural diversity with tourism in Kosovo
- Assessment of geosites as a basis for geotourism development: A case study of the Toplica District, Serbia
- IG-YOLOv5-based underwater biological recognition and detection for marine protection
- Monitoring drought dynamics using remote sensing-based combined drought index in Ergene Basin, Türkiye
- Review Articles
- The actual state of the geodetic and cartographic resources and legislation in Poland
- Evaluation studies of the new mining projects
- Comparison and significance of grain size parameters of the Menyuan loess calculated using different methods
- Scientometric analysis of flood forecasting for Asia region and discussion on machine learning methods
- Rainfall-induced transportation embankment failure: A review
- Rapid Communication
- Branch fault discovered in Tangshan fault zone on the Kaiping-Guye boundary, North China
- Technical Note
- Introducing an intelligent multi-level retrieval method for mineral resource potential evaluation result data
- Erratum
- Erratum to “Forest cover assessment using remote-sensing techniques in Crete Island, Greece”
- Addendum
- The relationship between heat flow and seismicity in global tectonically active zones
- Commentary
- Improved entropy weight methods and their comparisons in evaluating the high-quality development of Qinghai, China
- Special Issue: Geoethics 2022 - Part II
- Loess and geotourism potential of the Braničevo District (NE Serbia): From overexploitation to paleoclimate interpretation