
Petrogenesis of the Morobe Granodiorite and their shoshonitic mafic microgranular enclaves in Maramuni arc, Papua New Guinea
-
Takashi Hoshide
 ,
Angela Bokuik
,
Angela Bokuik

Abstract
The Miocene tectonics of Papua New Guinea, where subduction, arc-continent collision, and changes in subduction direction are considered to have occurred, is very complex and various tectonic models have been proposed. The Maramuni arc, active in the Miocene, is composed of a chain of granitoid bodies. As the chain-like distribution indicates the generation of igneous activities in a wide range of the same tectonic settings, the study of the Maramuni arc magmatism is important for elucidating the geologic events of the time. We provide data on the petrological and geochemical characteristics of the Morobe Granodiorite that form part of the Maramuni arc. The Morobe Granodiorite consists of metaluminous I-type granitoids, belonging to the medium-K to high-K series. The whole-rock major element variations in the granitoids can be explained by the fractionation of hornblende and plagioclase. They are generally within the composition range of experimental partial melts of amphibolites, and the whole-rock trace element compositions have characteristics of slab failure magma rather than arc. This suggests that the granitoids were generated by partial melting of the torn slab after slab failure. The mafic microgranular enclaves (MMEs) in the granitoids are classified as shoshonite, and their trace element compositions suggest that they were formed by partial melting of phlogopite-bearing mantle. The occurrences of native gold and barite within the MME show that MMEs transport Au from the mantle metasomatized by slab-derived sediment melt and/or fluid to the crustal magma chamber.
1 Introduction
Granitoids and calc-alkaline volcanic rocks of the Miocene Maramuni arc occur in the New Guinea Mobile Belt in Papua New Guinea. Magmatism in the Middle Miocene in Papua New Guinea is generally considered to be subduction related (e.g., Davies et al. [1]). However, different plate subduction directions have been proposed by various researchers (southwest dipping: [2,3,4], north dipping: [5,6]). Some studies also suggest that the igneous activities of the Maramuni arc are not subduction-related but associated with arc-continental collision and crustal thickening (e.g., Johnson et al. [7]; Johnson and Jaques [8]). Thus, there is still much debate and disagreement regarding the polarity of subduction and the petrogenesis of the Maramuni arc magmatism.
As has been suggested by various researchers, petrologic or geochemical characteristics of igneous rocks can be useful in determining the tectonic setting in which the igneous activity occurred (e.g., Chappell and White [9]; White [10]; Pearce et al. [11]; Maniar and Piccoli [12]; Bonin [13]; Barbarin [14]). However, not many studies have yet examined the tectonic setting of the Maramuni magmatism based on detailed petrological and geochemical studies of igneous rocks, including granitoids in the Maramuni arc (e.g., Holm et al. [6]; Ӧsterle et al. [15]; Webb et al. [16]). In addition, the granitoids of the Maramuni arc are associated with large porphyry deposits such as Ok Tedi and Hidden Valley, and the role of the granitoids in the formation of the deposits needs to be examined.
In this study, we will clarify the petrological and geochemical characteristics of the host granitoid and mafic microgranular enclave (MME) in the Morobe Granodiorite, one of the large batholiths in the Maramuni arc, near large porphyry Cu–Au deposits such as Hidden Valley and Wafi-Golpu, and discuss the tectonic setting of the batholith formation and the relationship to the formation of the ore deposits.
2 Geological background
2.1 Tectonic setting
The geotectonic setting and emplacement of the Morobe Granodiorite is the result of the convergence between the continental Australian and oceanic Pacific Plates at the Melanesian Trench (locally known as the Manus-Kilinailau Trench) in the Upper Oligocene that brought the Ontong Java Plateau to the subduction zone. The Ontong Java Plateau could not be subducted which lead to the blocking of the Melanesian Trench (i.e., choking of subduction along the Manus-Kilinailau Trench) between 26 and 20 Ma [17,18]. To accommodate continued convergence between the Australian and Pacific Plates, north-dipping subduction of the Australian Plate commenced beneath New Guinea at the Pocklington trough resulting in the widespread magmatic activity of the Maramuni Arc along the New Guinea Orogen [6,19,20,21] including emplacement of the Morobe Granodiorite in the Middle Miocene [22]. Alternatively, other views theorize the magmatic activity of the Maramumi Arc to have been the result of south-dipping subduction at the Trobiand Trough to the north of New Guinea [1,4,17,19].
Miocene igneous rocks including high-K volcanics and granite, granodiorite, and diorite intrusives are broadly distributed to the south of the Owen-Stanley and Ramu-Markham faults (Figure 1a) [23]. One of them, the Morobe Granodiorite [24] is located at the eastern New Guinea Orogen within the northern region of the Owen Stanley Terrane [25,26,27]. The Owen Stanley Metamorphics constitutes the bulk unit of this area and is the oldest rock of Cretaceous age (Figure 1b). The Morobe Granodiorite intrudes the Owen Stanley Metamorphics as two main batholiths outcropping in the Ekuti and Kuper Ranges exceeding 600 km2 and as some smaller bodies in the Bulolo and Watut Valley. Several Pliocene plug-dome complexes, stocks, sills, and dykes collectively termed the Edie Porphyry intrude the Morobe Granodiorite and Owen Stanley Metamorphics, which are variably overlain by the Bulolo Volcanics and sedimentary rocks of the Otibanda Formation, both of Pliocene age [22,28].
![Figure 1
(a) Distributions of the Mid-Miocene granitoids and mineral deposits in the Maramuni arc, Papua New Guinea. The red square in the figure indicates the area of the map in Figure 1b. RMFZ: Ramu Markham Fault Zone. OSFZ: Owen Stanley Fault Zone. Modified from Holm et al. [6]. (b) Geologic map of the Morobe Granodiorite. Yellow triangles show sample localities for the study. Dashed lines represent inferred faults. Modified from Bain et al. [35].](/document/doi/10.1515/geo-2022-0547/asset/graphic/j_geo-2022-0547_fig_001.jpg)
(a) Distributions of the Mid-Miocene granitoids and mineral deposits in the Maramuni arc, Papua New Guinea. The red square in the figure indicates the area of the map in Figure 1b. RMFZ: Ramu Markham Fault Zone. OSFZ: Owen Stanley Fault Zone. Modified from Holm et al. [6]. (b) Geologic map of the Morobe Granodiorite. Yellow triangles show sample localities for the study. Dashed lines represent inferred faults. Modified from Bain et al. [35].
2.2 Previous studies of the Morobe Granodiorite
The Morobe Granodiorite comprises predominantly of granodiorite with mafic to felsic variants occurring around the intrusion margins and includes monzonite, diorite, tonalite, hornblendite, gabbro, and pegmatite [24,29,30]. Rebek [31] identified stock-like bodies and sills of granodiorite in the Wau–Edie Creek area and classified them into three types: a medium-grained hornblende diorite to diorite; a coarse-grained hornblende granodiorite; and fine-grained granodiorite. Recent Mapping by Saroa et al. [32] observed granodiorite exposures along the Baiune Road to contain inclusions of three types: mafic inclusions with feldspar macrocrysts, elongated metamorphic inclusions of the Owen Stanley Metamorphics and inclusions of chlorite-altered mafic rock. A net vein complex of mafic and felsic rock compositions along the Watut Road was documented as well as dolerite dykes with epidote veins and nodules that were also observed by Cussen [22] as an appinitic swarm of dykes [32].
The granodioritic intrusions crop out primarily as texturally and mineralogically homogeneous, massive, medium- to coarse-grained phases, but locally the phases range from porphyritic to equigranular. Petrography studies indicate that the granodiorite is holocrystalline and medium- to coarse-grained with a hypidomorphic granular texture and is composed primarily of plagioclase, quartz, biotite, and hornblende, with an accessory mineral assemblage of titanite, apatite, magnetite, and pyrite; chlorite, epidote, and clinozoisite and clay minerals are common in hydrothermally altered phases [22].
The crystallization age of the Morobe Granodiorite is stated in three reports. The first dating was done by Page [33] using both K–Ar and Rb–Sr methods. Biotite and hornblende K–Ar ages from the granodioritic intrusions in the Ekuti and Kuper Ranges yielded an age of 14–13 Ma, which is 2 million years younger than the smaller intrusions in the Bulolo and Watut Valleys. Rb–Sr results for three biotite and whole-rock samples confirmed the K–Ar ages. These results indicated a Middle Miocene age of emplacement for the Morobe Granodiorite [33]. The second dating, done by Cussen [22] using the K–Ar method on fresh biotite and hornblende from samples of the Morobe Granodiorite, comprises age range of 15.1–10.5 ± 0.3 Ma (i.e., Early-Middle Miocene). The most recent age dating by Bodorkos et al. [34] using the new Sensitive High-Resolution Ion Micro Probe U–Pb method on zircons from the granodiorite hosting mafic inclusions along the Baiune Road yielded a magmatic crystallization age of 13.62 ± 0.13 Ma.
Whole-rock chemistries from 16 samples of the Morobe Granodiorite, including a suite of appinitic rocks from the more mafic intrusions-dolerite dyke have been already obtained by Cussen [22]. The results indicate a mafic to felsic composition with 41.6–65.7 wt% SiO2. The data from this suite of rocks plotted on an AFM diagram follow the well-defined magmatic fractionation curve of a calc-alkaline intrusive complex. The appinitic assemblages display low major element-oxide vs silica correlation trends and are characterized by high total iron, CaO, MgO, Sr/Rb ratios, and a Fe2O3/FeO ratio greater than one. Geochemical studies indicated that the appinitic suite contains at least some cumulate phases and they were interpreted as a fractionation product of the Morobe Granodiorite [22].
3 Methods
3.1 Field mapping and sampling
Two field programs were carried out for this project. Before each field program was conducted, the desktop study of the area was done, and a literature review was compiled. Based on the literature review, selected strategic field mapping targets were proposed to carry out as much area as possible due to the large extent of the granodiorite and the ruggedness of the terrain.
The first field program was conducted in September 2012 using helicopter support provided by the then Morobe Mining Joint Venture now known as Harmony Gold Exploration. This field program covered the interior of the granodiorite in the Kuper Range (sample No. 1000xx series in Figure 1b) whereas, the second field trip conducted in March 2017, targeted the intrusion margins (sample No. 1028xx series in Figure 1b). Over 50 rock samples were collected by chipping off preferably fresh and unaltered samples from the outcrops with rock hammers, depending on the granularity, texture, and composition of the granodiorite. Metasediments of the Owen Stanley Metamorphics were also sampled at the intrusion margins. Appropriate measurements were recorded for structural data such as fault planes, joint sets, contact trends, and mineral lineations.
3.2 Petrography
A total of 37 thin sections were prepared for petrography at the Department of International Resource Science, Akita University, Japan. Petrography was performed using a Nikon Eclipse LV 100 N polarising microscope + CCD color camera CS5270B for reflective and transmitted light observations for the 37 thin sections. The mineral modal composition was determined using a James Swift automatic point counter by attaching its stage to the polarising microscope. Between 1,000 and 2,000 points (maximum count) were counted on the point counter at stage intervals of 1 and 2. The results were plotted on Quartz-Alkali Feldspar-Plagioclase (QAP) ternary diagram.
Observation of microtextures and identification of accessory minerals for the MME and surrounding granodiorite are conducted using the JEOL JSM-IT 300 scanning electron microscope with the Oxford EDS detector (SEM-EDS) at the Department of International Resource Science, Akita University, Japan.
3.3 Whole-rock chemistry
Major and minor elemental compositions of 23 samples from the Morobe Granodiorite and surrounding metamorphics were measured by X-ray fluorescence (XRF) analysis using a Rigaku ZSX Primus II (Rh X-ray tube, 50 kV, 60 mA) at the Graduate School of International Resources, Akita University. The analyzed samples consist of 19 from the Morobe granodiorite and 4 from the Owen Stanley Metamorphics near the granodiorite body. Calibration curves of elements were prepared by analyzing 15 standard samples of GSJ geochemical reference samples.
Before crushing the rock samples, they were checked as much as possible to be fresh, unaltered, and free of any veins. The glass beads for the XRF analysis were prepared by fusing the mixture of 0.8 g sample powder with 4.0 g lithium borate flux (Li2B4O7:LiBO2 = 3.0 g:1.0 g) [36]. Each mixture was fused at 1,200°C for 8 min using a bead sampler.
3.4 Mineral chemistry
Mineral chemical compositions of hornblende, plagioclase, and biotite from the MME and surrounding granodiorite were measured using an electron probe microanalysis (EPMA: JXA-8800) combined with wavelength dispersive X-ray spectrometry installed at the Graduate School of International Resources, Akita University. The analyses were performed at an accelerating voltage of 15 kV and a beam current of 20 nA.
4 Field occurrence
The Morobe Granodiorite is equigranular, medium- to coarse-grained, and in some phases coarse granular displaying a porphyry texture (Figure 2). It appears fresh and competent to highly weathered and oxidized, jointed, and fractured in some areas and is observed to be completely homogenous in the field with no significant contacts between the felsic and intermediate phases. The quartz-monzonite or quartz-monzodiorite dykes intrude the host granitoids (Figure 2a). They range from 50 cm to 2 m in width and appear medium-grained to sub-porphyritic in texture. At the west part of the Morobe Granodiorite near the Sunshine Fault, the gabbro occurs on a small scale as a massive dark-colored fine-grained dyke intruding the granodiorite body (Figure 2c). The contact between the gabbro and granodiorite is transitional with plagioclase-rich veins intruding the gabbro from the granodiorite. The gabbro is mainly dark-colored with plagioclase-rich portions.
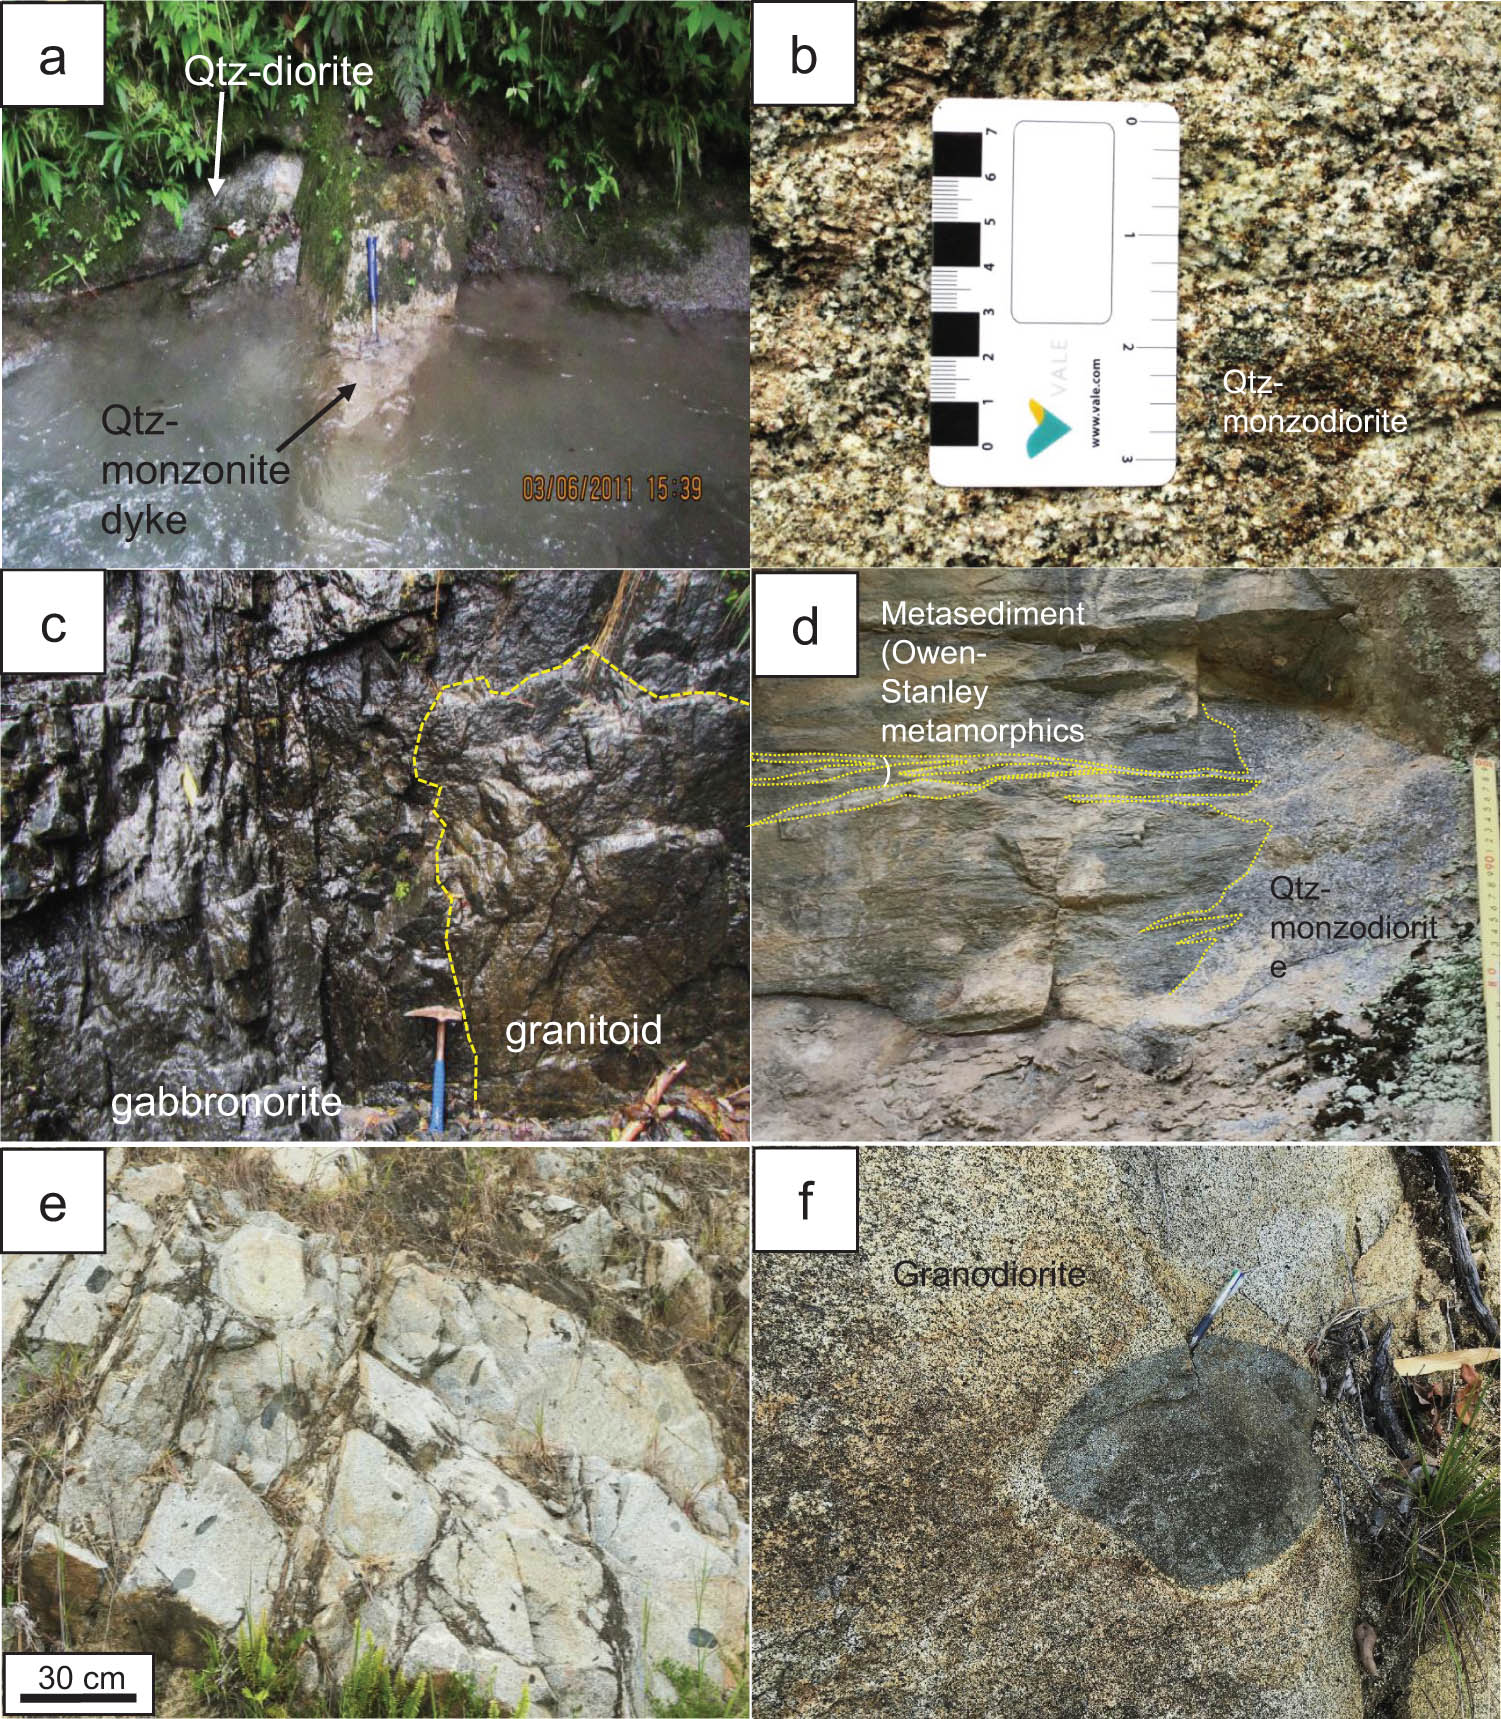
Outcrop photos of the Morobe Granodiorite. (a) A quartz monzonite dyke intruding into the quartz diorite (sample No. 100070). (b) The close-up of the quartz monzodiorite (sample No. 100034). (c) The contact between the gabbronorite (sample No. 102818) and the host granitoid. (d) The contact between the quartz monzodiorite (sample No. 102805) and country rocks (Owen Stanley Metamorphics). The veinlets of quartz monzodiorite occur along the foliations of the country rocks. (e) MMEs in the Morobe Granodiorite. (f) MME in the host granodiorite (sample No. 102812).
Generally, the contact between the Morobe Granodiorite and Owen Stanley Metamorphics is irregular and characterized as follows (Figure 2d): (1) the granodiorite cuts the foliation in the metasediments; (2) the inclusions and dykes of granite intrude along foliation planes in the metasediments; and (3) xenoliths of metasediments (Owen Stanley Metamorphics; Figure 1) are included in the Morobe Granodiorite near the contact. Similar foliated xenoliths are also found within the granodiorite body apart from the contact. The margin of the granodiorite (3–5 mm width) is slightly finer-grained than the interior.
MMEs are common and unevenly distributed throughout the Morobe Granodiorite. The shape of the MMEs varies widely from rounded to sub-rounded, irregular-shaped and pointed to wispy projections (Figure 2e). They range in size from 1 to 10 cm with a few between 20 and 40 cm (Figure 2f). Contacts with the host granodiorite body are sharp but commonly are lobate to crenulated and even have diffuse margins.
5 Petrography
5.1 Granitoids
The Morobe Granodiorite is mainly composed of holocrystalline, medium- to coarse-grained granitoids. The rocks comprise mainly hornblende, biotite, plagioclase, alkali feldspar, and quartz with accessory minerals of titanite, apatite, magnetite, and ilmenite.
Hornblende occurs as a euhedral to subhedral, straight-edged, hexagonal to rectangular medium-grained (0.3–1 mm in diameter) crystal (Figure 3a and d). Biotite commonly occurs as euhedral to subhedral medium-grained (0.5–1.5 mm) crystals (Figure 3e) but also as interstitial phases in cumulus-textured granitoids poor in alkali-feldspar (Figure 3f). Chlorite partly replaces biotite. Plagioclase occurs as euhedral to subhedral, medium- to coarse-grained (0.5–2 mm in diameter) crystals (Figure 3a). Plagioclase commonly shows oscillatory zoning, and some crystals exhibit wavy zoning boundaries (Figure 3b). Alkali feldspar occurs as anhedral coarse-grained (2–7 mm) crystals surrounding finer-grained euhedral crystals of plagioclase, hornblende, and biotite-forming poikilitic texture (Figure 3c and e) or as an interstitial mineral in cumulate phases. The intergrowth texture of micro-perthite is common with fewer amounts of microcline. Myrmekite occurs between alkali feldspar and plagioclase. Quartz occurs as anhedral to subhedral, medium- to coarse-grained (0.5–3 mm) crystals (Figure 3e). Larger crystals display undulose extinction. Titanite is generally anhedral to subhedral; however, there are some euhedral diamond-shaped crystals of fine to medium grain size (Figure 3c). Titanite occurs either as a discreet mineral in association with hornblende and opaque minerals or as an interstitial mineral to hornblende. Apatite is euhedral, hexagonal, prismatic, very fine-grained and commonly occurs as inclusions in hornblende and biotite (Figure 3d). Magnetite is the dominant opaque oxide mineral which commonly occurs as a medium-grained mineral in association with hornblende and titanate or as fine-grained inclusions in plagioclase (Figure 3d). Ilmenite is rare and fine-grained. According to the mineral modal compositions, the granitoids from the Morobe Granodiorite are classified into Quartz diorite, Quartz Monzodiorite, Granodiorite, and Quartz Monzonite (Figure 4).
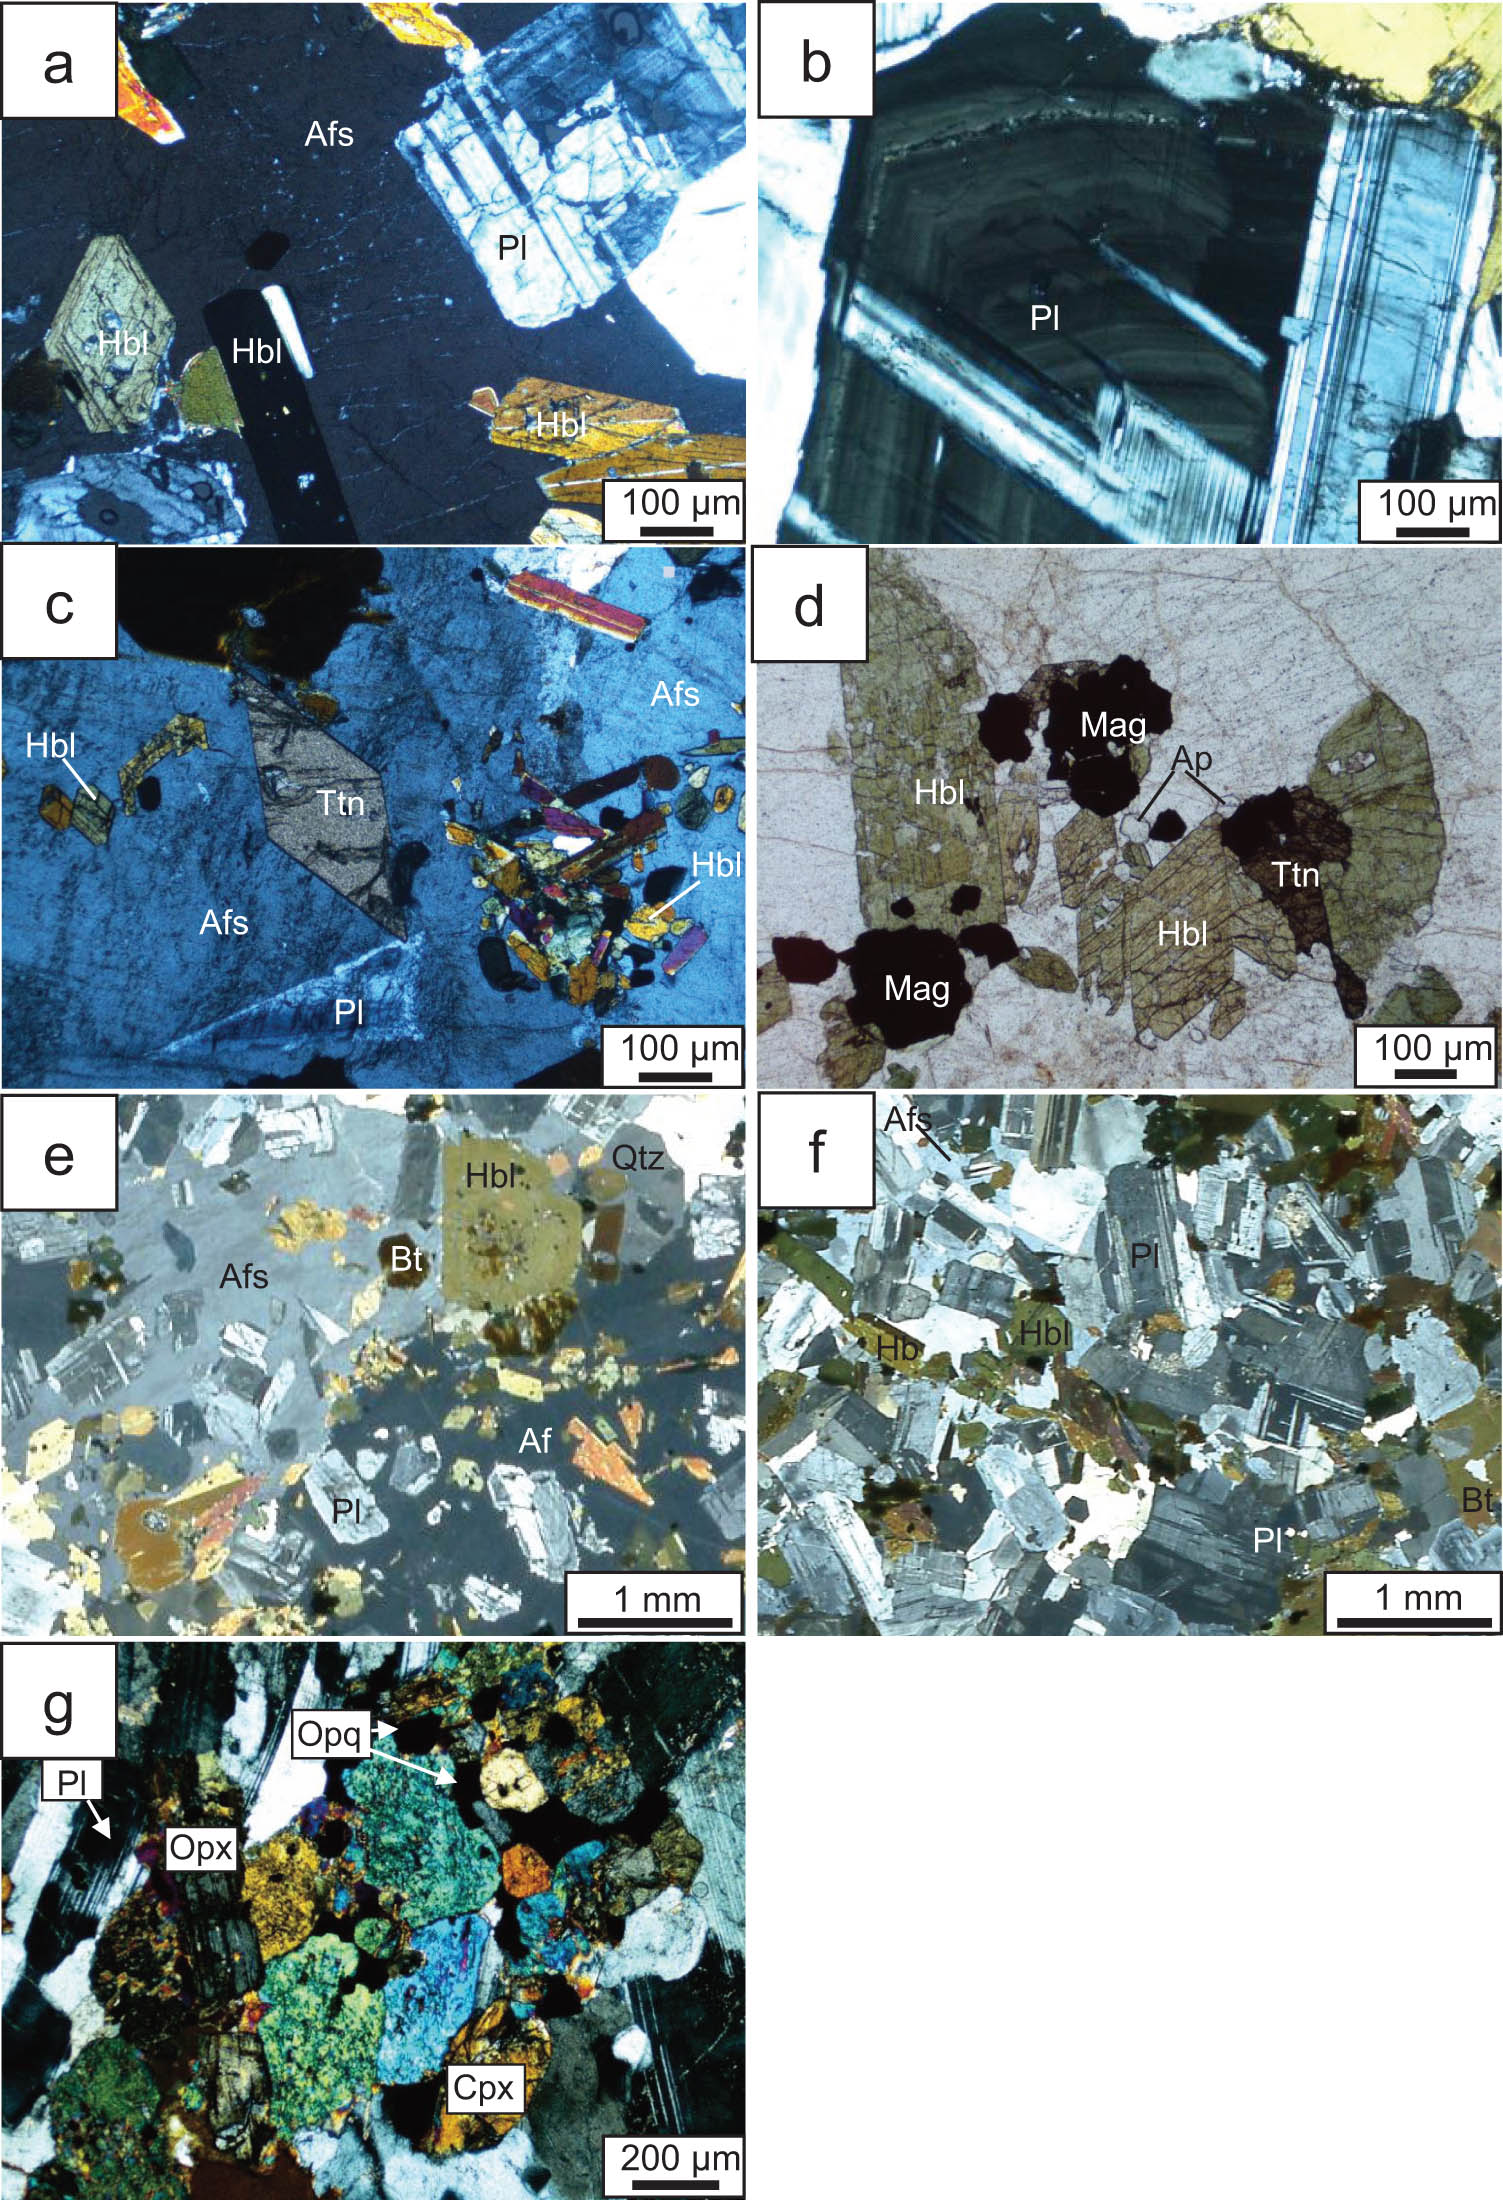
Photomicrographs of the Morobe Granodiorite. (a) Quartz monzodiorite (sample No. 100034). Euhedral plagioclase and hornblende are included in a large anhedral alkali feldspar. (b) Quartz diorite (sample No. 100070). Large plagioclase shows distinct oscillatory zoning. (c) A euhedral titanite crystal in a quartz monzodiorite (sample No. 100034). (d) Accessory apatite and titanite occur with magnetite and hornblende in a granodiorite (sample No. 100017). (e) Poikilitic texture with large alkali feldspar containing hornblende, plagioclase, biotite, and opaque minerals (sample No. 100034). (f) Cumulus texture mainly consists of hornblende and plagioclase. Anhedral alkali feldspar and biotite occur as interstitial phases (sample No. 100070). (g) Gabbronorite is composed of two pyroxenes, plagioclase and opaque minerals (sample No. 102817). Pl: plagioclase, Afs: alkali feldspar, Hbl: hornblende, Ttn: titanite, Mag: magnetite, Ap: apatite, Bt: biotite, Opx: orthopyroxene, Cpx: clinopyroxene, Opq: opaque minerals.
![Figure 4
Modal composition of granitoids from the Morobe Granodiorite in the QAP diagram [37]. Numbers for representative samples with poikilitic (sample No. 100034) and cumulus textures (sample No. 100070) are shown in the diagram.](/document/doi/10.1515/geo-2022-0547/asset/graphic/j_geo-2022-0547_fig_004.jpg)
Modal composition of granitoids from the Morobe Granodiorite in the QAP diagram [37]. Numbers for representative samples with poikilitic (sample No. 100034) and cumulus textures (sample No. 100070) are shown in the diagram.
Based on the textural relationship and the difference in grain size among main constituent minerals, we can divide the textures of granitoids into two types as follows: (1) poikilitic texture, in which euhedral crystals (mainly hornblende and plagioclase) are included in an anhedral large alkali feldspar (Figure 3e), and (2) cumulate texture, in which euhedral crystals (mainly hornblende and plagioclase) are tightly packed and form frameworks each other (Figure 3f). The poikilitic-textured rocks are rich in modal alkali feldspar and have more monzonitic compositions (e.g. Sample no. 100034 in Figure 4). The cumulate-textured rocks are poor in alkali feldspar and have more dioritic compositions (e.g. Sample no. 100070 in Figure 4). Modes of quartz and alkali feldspar roughly increase and those of plagioclase and hornblende roughly decrease with increasing elevation. The texture also varies from poikilitic to cumulus roughly with decreasing elevation.
The marginal parts of the Morobe Granodiorite show fine-grained equigranular to porphyritic textures. The rocks are mainly composed of biotite, plagioclase, alkali feldspar, and quartz and do not contain hornblende.
5.2 Gabbro
We found two types of gabbros in the outcrops, the main dark-colored and plagioclase-rich parts. The dark-colored part has a mineral assemblage of clinopyroxene, orthopyroxene, and smaller amounts of hornblende classifying it as a hornblende pyroxenite. The plagioclase-rich part comprises clinopyroxene, orthopyroxene, plagioclase, and minor amounts of hornblende and biotite classifying it as hornblende-bearing gabbronorite (Figure 3g). Opaque minerals commonly exist in both parts.
5.3 MMEs
The MME constitutes of hornblende, biotite, plagioclase, alkali feldspar, magnetite, and ilmenite, with minor amounts of quartz, pyrite, chalcopyrite, apatite, titanite, zircon, and barite. Subhedral hornblende, biotite, and plagioclase occur as 50–200 µm-sized grains throughout the MME (Figure 5). Anhedral alkali feldspar and quartz commonly occur as interstitial phases. Small amounts of 1–2 mm-sized hornblende and plagioclase crystals are also found in the MME (Figure 5a and b). The mm-sized euhedral hornblende contains many biotite and plagioclase inclusions. Pyrite and chalcopyrite occur in association with magnetite. Near the boundary with host granodiorite, large alkali feldspar poikilitically encloses fine-grained subhedral hornblende, biotite, and plagioclase (Figure 5c). Away from the boundary, the mode of alkali feldspar decreases.
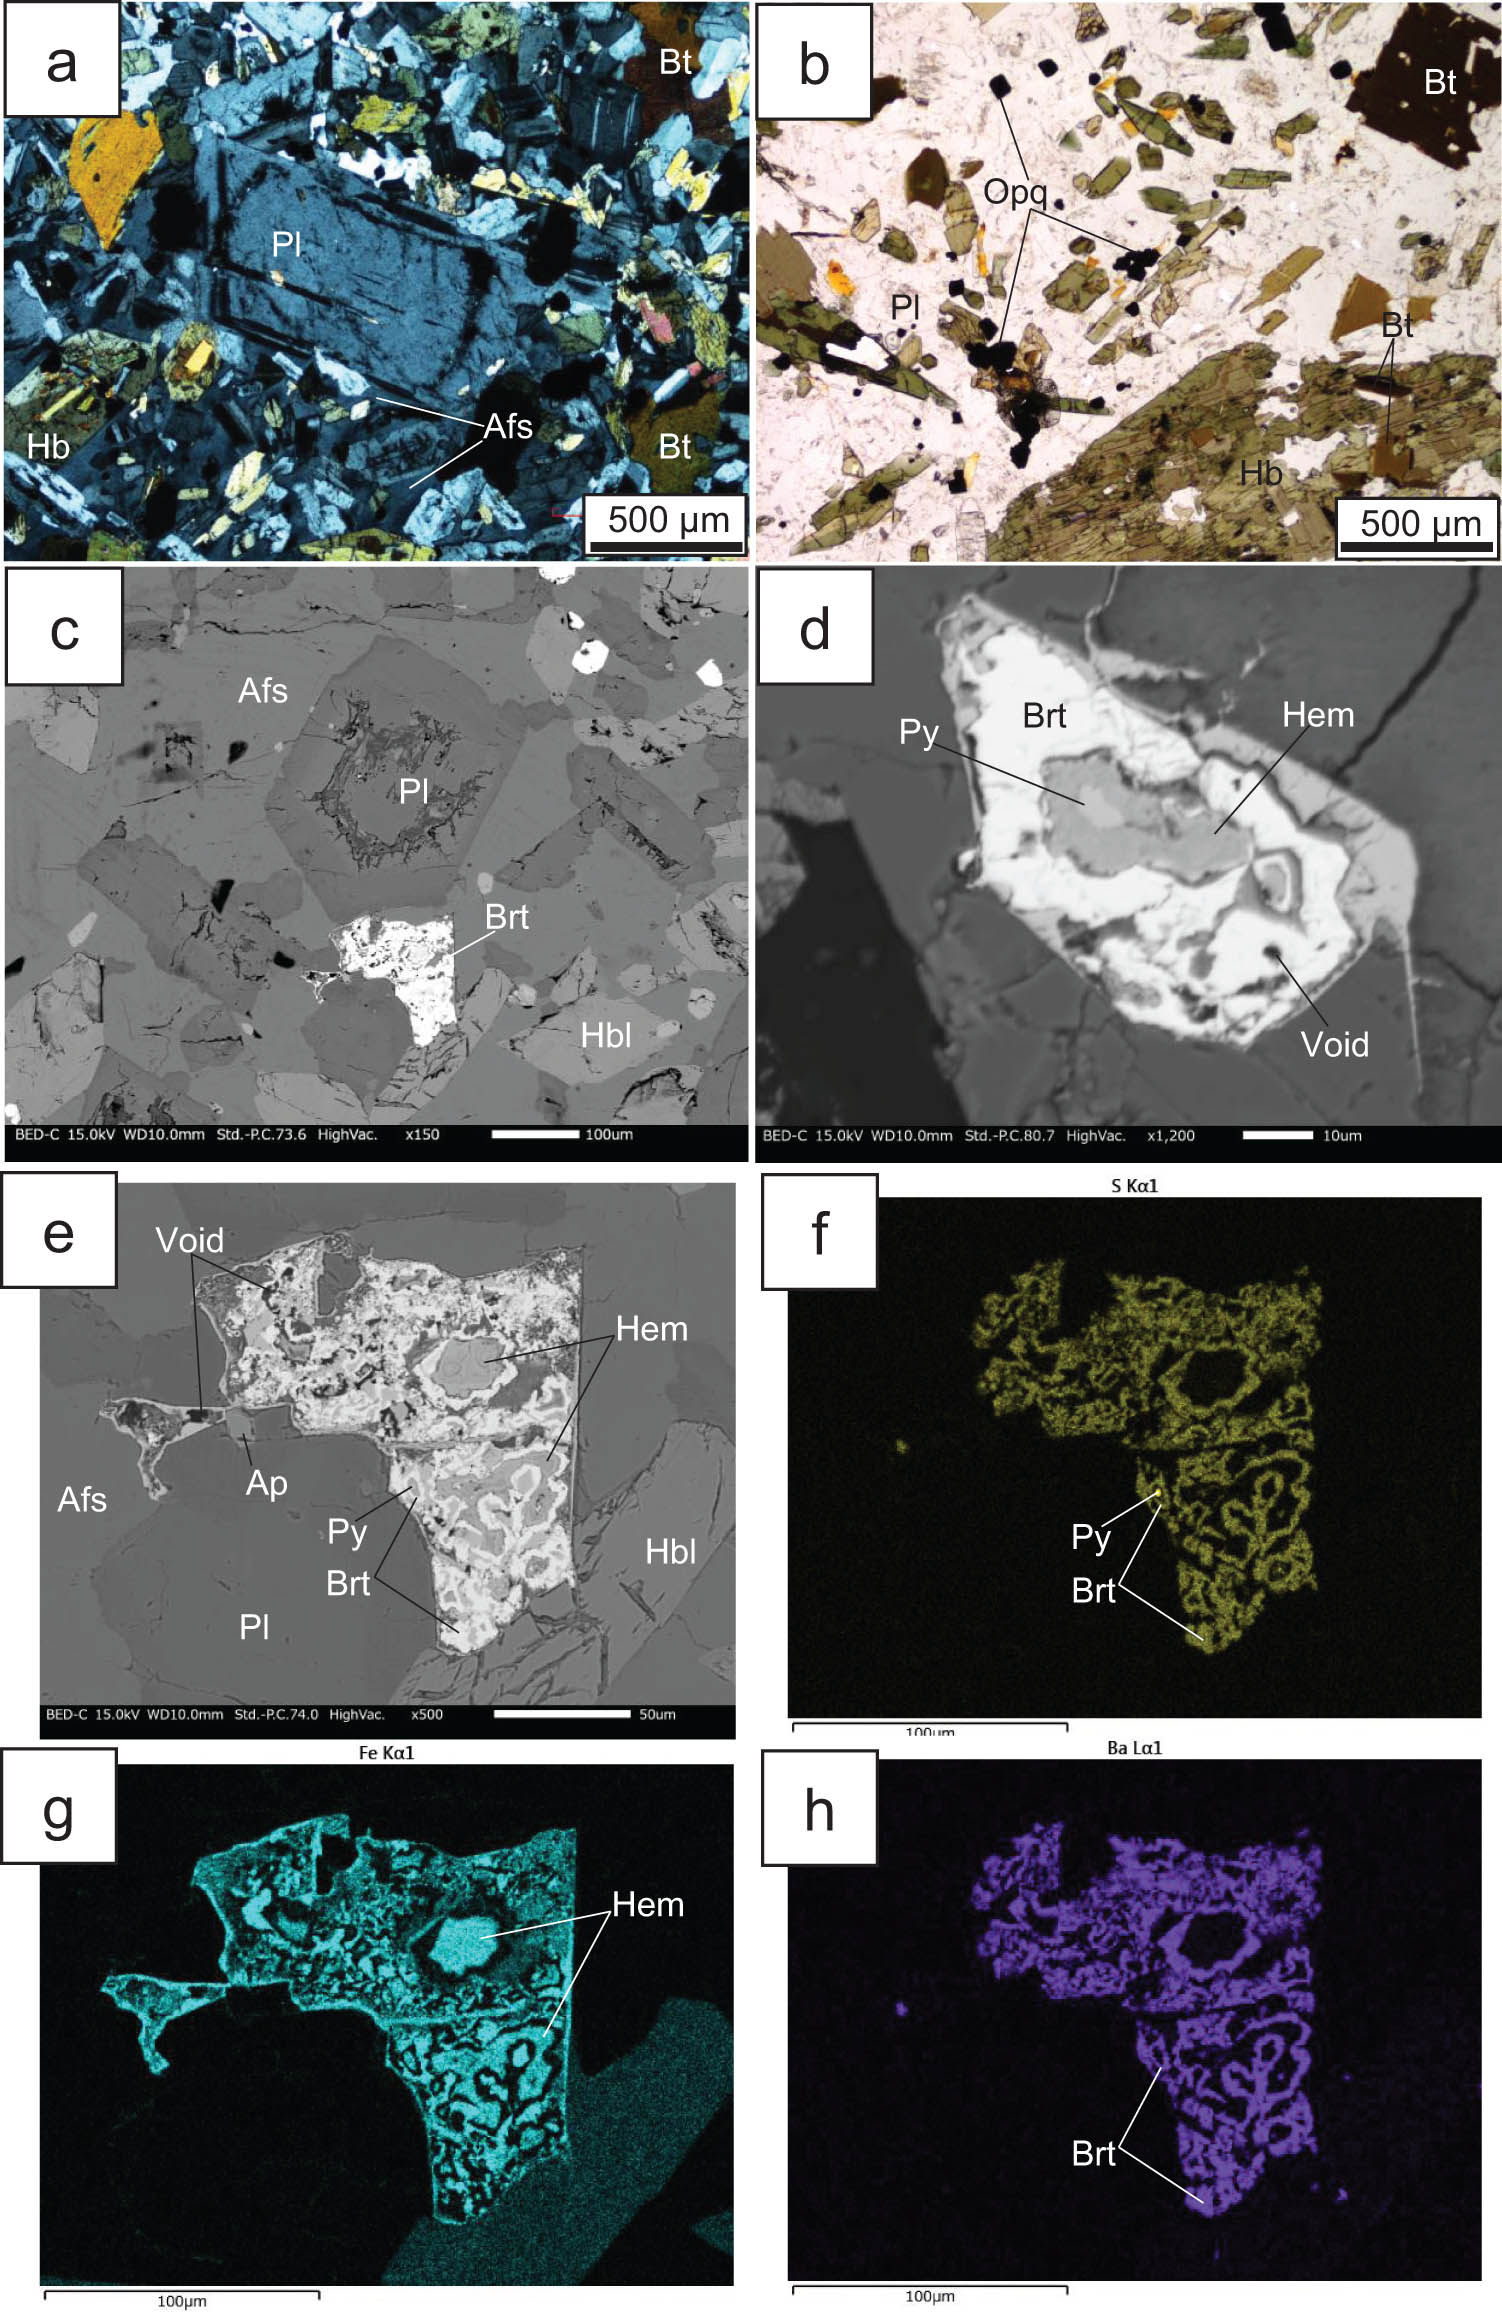
Representative textures of the MME (sample No. 102812b). (a) A 1 mm-size euhedral plagioclase in the fine-grained matrix (cross-polarized light). Alkali feldspar occurs as an interstitial phase. (b) Large euhedral hornblende (lower right) and biotite (upper right) occur in the fine-grained matrix (plane-polarized light). Many small biotite crystals are contained in the large hornblende. (c) Backscatter electron image of poikilitic texture in the MME. Euhedral plagioclase and hornblende are in contact with the barite-bearing domain. (d) Barite occurs with hematite, voids, and a small amount of pyrite. (e) Backscatter electron image and corresponding elemental maps of (f) S, (g) Fe, and (h) Ba of the barite-bearing domain in Figure 5c. Py: pyrite, Brt: barite, Hem: hematite.
There are two types of barite occurrences in the MME. The first type of barite is coexistent with hematite and voids, within a certain area (Figure 5d and e). A very small amount of pyrite is also found within this area. Pyrite commonly occurs surrounded by hematite and is not in direct contact with barite. Another type of barite is usually found as inclusions in hornblende or biotite (Figure 6a–c). Barite may occur solitarily in hornblende or biotite (Figure 6c), or in voids in hornblende or biotite (Figure 6a and b). Barite in negative-crystal-shaped voids is commonly prismatic with a grain size of 2–5 µm (Figure 6b). It is accompanied by Cl-bearing chlorite.

Occurrence of barite and native gold in the MME (sample No. 102812b). (a) Barite inclusions in hornblende. (b) Close-up image of barite inclusions in Figure 6a. Prismatic barite crystals occur in the void in hornblende. Note the negative-crystal shape of the void. (c) Barite is included in biotite in hornblende. (d) A native gold grain in hornblende. (e) A native gold grain in plagioclase. The barite-bearing domain at the bottom of the photo is the same as in Figure 5e. (f) Close-up of the yellow rectangle area in Figure 6e. Native gold occurs in the void associated with altered plagioclase.
In addition, we found native gold grains in plagioclase and hornblende crystals (Figure 6d–f). Most gold grains occur in the voids or along the crack in plagioclase and hornblende. The grain size of gold is about 1–2 µm. We found 18 grains of gold in a 3 cm2 of MME. A very small number of gold grains may also be found in the host granodiorite near the MME.
6 Whole rock chemistry
Major element discrimination diagrams [38] were used to classify the samples from the Morobe Granodiorite employing the whole-rock major element compositions given in Table 1. The samples from the Morobe Granodiorite have SiO2 = 50.4–71.5 wt% and Na2O + K2O = 0.7–7.5 wt% and can be classified as granite, quartz monzonite, granodiorite, monzonite, diorite, monzo-diorite, gabbro-diorite, and gabbro (Figure 7a). The majority of granitoids fall in the medium-K calc-alkaline to high-K calc-alkaline series on the K2O-SiO2 diagram, but three samples from the marginal parts belong to a low-K to medium-K calc-alkaline series (Figure 7b) [39]. The A/CNK (Al2O3/(CaO + NaO + K2O), molar ratios) values of the samples from the Morobe Granodiorite are 0.60–1.08, showing metaluminous to slightly peraluminous compositions (Figure 7c). Also, these rocks have low FeOT/(FeOT + MgO) ratios and are of the magnesium type with high Mg# (Figure 7d) [41].
Whole-rock compositions of the Morobe Granodiorite
| Sample | 100073 | 100059 | 100034 | 100075 | 102815 | 102823 | 102838 | 100092 | 100017 | 102812a | 102812b | 102845b | 102805 | 102828 | 100070 | 102833 | 102817 | 102841 | 102816 | 102805 | 102806 | 10284 |
|---|---|---|---|---|---|---|---|---|---|---|---|---|---|---|---|---|---|---|---|---|---|---|
| Lithologya | QM-d | QM-d | QMD | QMD | QMD | QMD | QMD | GD | GD | GD | SSN-mme | GD-m | GD-m | T-m | QD | D | GBN | GBN | HbP | P-cr | P-cr | P-cr |
| SiO2 | 71.54 | 63.92 | 63.67 | 61.25 | 64.59 | 57.88 | 63.82 | 64.51 | 60.44 | 66.05 | 53.74 | 65.77 | 70.63 | 66.84 | 58.05 | 54.52 | 50.37 | 55.13 | 50.72 | 67.63 | 68.20 | 49.61 |
| TiO2 | 0.21 | 0.46 | 0.48 | 0.59 | 0.52 | 0.97 | 0.44 | 0.56 | 0.81 | 0.49 | 1.05 | 0.40 | 0.30 | 0.37 | 0.68 | 0.82 | 0.67 | 0.86 | 0.67 | 0.53 | 0.56 | 1.46 |
| Al2O3 | 14.75 | 16.15 | 16.31 | 16.08 | 16.05 | 18.11 | 17.73 | 16.77 | 16.58 | 15.53 | 17.08 | 17.13 | 15.58 | 17.52 | 17.93 | 19.88 | 15.07 | 17.25 | 2.30 | 15.13 | 14.34 | 15.18 |
| Fe2O3 | 1.79 | 4.87 | 5.19 | 5.80 | 4.63 | 7.44 | 3.93 | 4.43 | 6.96 | 4.35 | 9.47 | 3.63 | 2.53 | 2.48 | 6.64 | 6.70 | 10.38 | 7.39 | 11.72 | 4.80 | 5.39 | 9.75 |
| MnO | 0.03 | 0.11 | 0.11 | 0.12 | 0.09 | 0.14 | 0.13 | 0.14 | 0.14 | 0.09 | 0.17 | 0.09 | 0.04 | 0.06 | 0.14 | 0.19 | 0.19 | 0.15 | 0.31 | 0.06 | 0.07 | 0.31 |
| MgO | 0.75 | 2.04 | 2.18 | 3.13 | 2.36 | 3.89 | 1.26 | 2.18 | 3.49 | 2.06 | 3.74 | 1.13 | 0.91 | 1.07 | 2.95 | 3.28 | 7.93 | 4.79 | 15.76 | 1.74 | 2.04 | 9.18 |
| CaO | 2.74 | 4.75 | 4.33 | 4.82 | 4.66 | 5.38 | 4.26 | 4.38 | 6.17 | 4.24 | 6.47 | 4.55 | 2.88 | 4.55 | 6.75 | 8.09 | 10.91 | 7.91 | 17.52 | 1.68 | 1.85 | 10.93 |
| Na2O | 3.00 | 3.54 | 3.27 | 3.23 | 3.64 | 3.59 | 3.93 | 3.90 | 3.05 | 3.57 | 3.43 | 4.62 | 4.35 | 5.53 | 3.71 | 4.87 | 2.86 | 4.71 | 0.34 | 3.31 | 2.46 | 2.68 |
| K2O | 4.47 | 3.06 | 3.48 | 4.04 | 2.21 | 1.60 | 3.17 | 2.11 | 1.72 | 2.78 | 3.19 | 1.69 | 1.84 | 0.85 | 2.03 | 0.77 | 0.43 | 0.46 | 0.33 | 4.16 | 3.80 | 0.18 |
| P2O5 | 0.09 | 0.21 | 0.20 | 0.21 | 0.18 | 0.27 | 0.19 | 0.20 | 0.27 | 0.17 | 0.34 | 0.16 | 0.10 | 0.20 | 0.29 | 0.28 | 0.31 | 0.26 | 0.03 | 0.09 | 0.09 | 0.11 |
| Total | 99.36 | 99.11 | 99.21 | 99.26 | 98.92 | 99.27 | 98.87 | 99.18 | 99.63 | 99.32 | 98.69 | 99.15 | 99.17 | 99.47 | 99.15 | 99.39 | 99.11 | 98.90 | 99.69 | 99.14 | 98.81 | 99.38 |
| Mg#b | 45 | 45 | 45 | 52 | 50 | 51 | 39 | 49 | 50 | 48 | 44 | 38 | 42 | 46 | 47 | 49 | 60 | 56 | 73 | 42 | 43 | 65 |
| A/CNKc | 1.00 | 0.91 | 0.96 | 0.87 | 0.95 | 1.04 | 1.00 | 1.01 | 0.92 | 0.94 | 0.82 | 0.97 | 1.08 | 0.96 | 0.87 | 0.84 | 0.60 | 0.76 | 0.07 | 1.16 | 1.24 | 0.62 |
| A/NKd | 1.51 | 1.77 | 1.79 | 1.66 | 1.92 | 2.37 | 1.79 | 1.93 | 2.41 | 1.75 | 1.88 | 1.82 | 1.70 | 1.75 | 2.16 | 2.25 | 2.92 | 2.09 | 2.50 | 1.52 | 1.76 | 3.30 |
| Trace elements (ppm) | ||||||||||||||||||||||
| V | 38 | 112 | 115 | 128 | 116 | 250 | 90 | 90 | 171 | 104 | 278 | 76 | 56 | 64 | 162 | 283 | 265 | 242 | 259 | 102 | 111 | 265 |
| Cr | 16 | 21 | 30 | 80 | 67 | 51 | 19 | 61 | 57 | 38 | 11 | 12 | 14 | 17 | 19 | 19 | 234 | 106 | 473 | 75 | 87 | 305 |
| Ni | 8 | 6 | 11 | 21 | 15 | 23 | 12 | 29 | 18 | 12 | 5 | 8 | 7 | 13 | 8 | 9 | 78 | 14 | 171 | 13 | 23 | 129 |
| Rb | 122 | 92 | 101 | 112 | 67 | 51 | 101 | 86 | 60 | 93 | 94 | 40 | 66 | 20 | 54 | 16 | 5 | 11 | 12 | 140 | 152 | 5 |
| Sr | 522 | 688 | 659 | 645 | 643 | 547 | 762 | 796 | 680 | 624 | 647 | 743 | 646 | 983 | 981 | 937 | 1038 | 738 | 54 | 530 | 323 | 459 |
| Y | 10 | 16 | 19 | 26 | 16 | 20 | 24 | 11 | 31 | 17 | 31 | 14 | 11 | 8 | 23 | 36 | 17 | 25 | 41 | 22 | 22 | 32 |
| Zr | 92 | 144 | 114 | 144 | 124 | 169 | 157 | 135 | 163 | 123 | 149 | 109 | 98 | 142 | 122 | 184 | 14 | 107 | 61 | 169 | 182 | 97 |
| Nb | 22 | 24 | 30 | 27 | 21 | 29 | 35 | 28 | 26 | 30 | 28 | 20 | 23 | 25 | 34 | 45 | 28 | 20 | 25 | 25 | 30 | 35 |
| Ba | 870 | 632 | 825 | 967 | 588 | 290 | 688 | 633 | 492 | 625 | 1161 | 711 | 752 | 437 | 585 | 226 | 297 | 154 | 168 | 1177 | 692 | 50 |
| Nb/Y | 2.2 | 1.5 | 1.6 | 1.0 | 1.3 | 1.5 | 1.5 | 2.5 | 0.8 | 1.8 | 0.9 | 1.4 | 2.1 | 3.1 | 1.5 | 1.3 | 1.6 | 0.8 | 0.6 | 1.1 | 1.4 | 1.1 |
| Nb+Y | 32 | 40 | 49 | 53 | 37 | 49 | 59 | 39 | 57 | 47 | 59 | 34 | 34 | 33 | 57 | 81 | 45 | 45 | 66 | 47 | 52 | 67 |
| Sr/Y | 52 | 43 | 35 | 25 | 40 | 27 | 32 | 72 | 22 | 37 | 21 | 53 | 59 | 123 | 43 | 26 | 61 | 30 | 1 | 24 | 15 | 14 |
aQM, quartz monzonite; QMD, quartz monzodiorite; GD, granodiorite; SSN, D-diorite; GBN, gabbronorite; HbP, hornblende pyroxenite; P, phyllite; d, dyke; mme, maficmicrogranularenclave; m, Marginal part; cr, country rock.
bMg# = Mg/(Mg + Fe2+) × 100.
cA/CNK = molar Al2O3/(CaO + NaO + K2O).
dA/NK = molar Al2O3/(NaO+ K2O).
![Figure 7
(a) Major element discrimination diagram [38] and (b) K2O vs SiO2 diagram [39] of the Morobe Granodiorite. (c) A/CNK vs A/NK diagram (I-type and S-type boundary: [9]; peraluminous and metaluminous fields: [40]). (d) FeO*/(MgO + FeO*) vs SiO2 diagram. The ferroan-magnesian boundary of Frost et al. [41] (dashed line) with the revised boundary as proposed by Frost and Frost [42]. All the samples from the Morobe Granodiorite plot in the magnesian field.](/document/doi/10.1515/geo-2022-0547/asset/graphic/j_geo-2022-0547_fig_007.jpg)
(a) Major element discrimination diagram [38] and (b) K2O vs SiO2 diagram [39] of the Morobe Granodiorite. (c) A/CNK vs A/NK diagram (I-type and S-type boundary: [9]; peraluminous and metaluminous fields: [40]). (d) FeO*/(MgO + FeO*) vs SiO2 diagram. The ferroan-magnesian boundary of Frost et al. [41] (dashed line) with the revised boundary as proposed by Frost and Frost [42]. All the samples from the Morobe Granodiorite plot in the magnesian field.
The MME is classified into basaltic trachyandesite on the total alkali-SiO2 diagram (Figure 7a), which is subdivided into shoshonite as Na2O – 2.0 is less than K2O [43]. The MME plots in the shoshonite series field on the K2O-SiO2 diagram of Peccerillo and Taylor [39] (Figure 7b).
7 Mineral chemistry
Representative chemical compositions of hornblende from the MMEs and the host granodiorite are shown in Table 2. The hornblende was analyzed for core and rim, respectively. Most amphiboles analyzed are classified as hornblende according to the classification of Deer et al. [46] (Figure 8a). However, some amphibole cores from MME have higher (Na + K)A and lower Si contents. They are classified as pargasite and tschermakite.
Major element compositions of amphibole
| Sample | 102812b | 102812b | 102812b | 102812b | 102812b | 102812b | 102812b | 102812b | 102812b | 102812b | 102812b | 102812b | 102812b | 102812b | 102812b | 102812b | 102812b | 102812b | 102812b | 102812b | 102812b | 102812b | 102812b | 102812b | 102812b | 102812b | 102812b | 102812a | 102812a | 102812a | 102812a | 102812a | 102812a | 10281 |
|---|---|---|---|---|---|---|---|---|---|---|---|---|---|---|---|---|---|---|---|---|---|---|---|---|---|---|---|---|---|---|---|---|---|---|
| Lithology | MME | MME | MME | MME | MME | MME | MME | MME | MME | MME | MME | MME | MME | MME | MME | MME | MME | MME | MME | MME | MME | MME | MME | MME | MME | MME | MME | H ost-Gtd | Host-Gtd | Host-Gtd | Host-Gtd | Host-Gtd | Host-Gtd | Host-G |
| Position | Core | Rim | Core | Core | Rim | Core | Rim | Core | Rim | Core | Core | Rim | Core | Core | Rim | Rim | Core | Rim | Core | Rim | Rim | Core | Core | Rim | Rim | Core | Rim | Core | Rim | Core | Core | Core | Core | Rim |
| wt % | ||||||||||||||||||||||||||||||||||
| SiO2 | 47.11 | 46.88 | 47.83 | 47.30 | 46.85 | 43.79 | 47.78 | 46.97 | 48.06 | 46.72 | 43.58 | 47.72 | 45.94 | 42.48 | 45.97 | 47.97 | 49.08 | 46.98 | 46.77 | 46.99 | 46.05 | 47.33 | 44.68 | 47.63 | 46.19 | 47.47 | 50.56 | 51.61 | 49.03 | 46.91 | 47.27 | 50.17 | 47.04 | 49.94 |
| TiO2 | 1.18 | 1.26 | 1.21 | 1.21 | 1.27 | 1.62 | 1.12 | 1.34 | 1.14 | 1.33 | 2.01 | 1.28 | 1.37 | 1.92 | 1.34 | 1.15 | 0.80 | 1.15 | 1.22 | 1.29 | 1.32 | 1.29 | 1.62 | 1.24 | 1.24 | 1.27 | 0.67 | 0.54 | 1.07 | 1.44 | 1.32 | 0.72 | 1.29 | 0.75 |
| Al2O3 | 7.41 | 7.87 | 7.62 | 7.93 | 7.69 | 10.85 | 7.36 | 8.44 | 7.30 | 8.65 | 11.23 | 7.84 | 8.60 | 12.25 | 8.20 | 7.62 | 5.62 | 7.38 | 8.06 | 7.91 | 8.48 | 7.80 | 9.65 | 7.40 | 7.48 | 7.91 | 5.62 | 4.13 | 6.71 | 8.49 | 8.03 | 5.59 | 7.87 | 5.47 |
| Cr2O3 | 0.03 | 0.03 | 0.01 | 0.02 | 0.06 | 0.05 | 0.03 | 0.06 | b.d.l. | 0.02 | 0.08 | 0.05 | b.d.l. | b.d.l. | 0.01 | b.d.l. | 0.02 | b.d.l. | b.d.l. | 0.02 | b.d.l. | b.d.l. | 0.06 | 0.04 | 0.05 | b.d.l. | 0.03 | b.d.l. | b.d.l. | 0.01 | 0.04 | 0.10 | 0.04 | b.d.l. |
| FeO | 15.32 | 15.20 | 14.35 | 14.78 | 15.10 | 15.52 | 14.97 | 14.25 | 15.10 | 15.47 | 16.54 | 15.16 | 15.17 | 15.75 | 15.30 | 14.66 | 14.26 | 15.10 | 14.17 | 14.93 | 15.99 | 14.58 | 15.75 | 14.67 | 15.84 | 14.67 | 14.14 | 13.51 | 14.43 | 14.45 | 14.15 | 13.68 | 14.63 | 14.13 |
| MnO | 0.59 | 0.57 | 0.50 | 0.47 | 0.56 | 0.49 | 0.50 | 0.52 | 0.63 | 0.51 | 0.59 | 0.50 | 0.48 | 0.56 | 0.54 | 0.42 | 0.60 | 0.50 | 0.55 | 0.65 | 0.60 | 0.58 | 0.52 | 0.54 | 0.51 | 0.62 | 0.60 | 0.62 | 0.58 | 0.53 | 0.49 | 0.63 | 0.45 | 0.71 |
| MgO | 12.75 | 12.54 | 13.60 | 13.15 | 12.83 | 11.57 | 12.78 | 13.01 | 12.90 | 12.15 | 10.46 | 12.54 | 12.33 | 10.68 | 12.12 | 12.85 | 14.09 | 12.87 | 13.24 | 12.88 | 11.89 | 13.24 | 11.83 | 13.20 | 12.46 | 12.59 | 13.97 | 14.73 | 13.51 | 12.93 | 13.28 | 14.20 | 12.93 | 14.13 |
| CaO | 11.43 | 11.53 | 11.63 | 11.62 | 11.47 | 11.50 | 11.50 | 11.44 | 11.49 | 11.61 | 11.47 | 11.43 | 11.62 | 11.45 | 11.42 | 11.52 | 11.77 | 11.58 | 11.60 | 11.72 | 11.77 | 11.33 | 11.56 | 11.70 | 11.61 | 11.38 | 11.68 | 11.52 | 11.22 | 11.20 | 11.27 | 11.56 | 11.29 | 11.25 |
| Na2O | 1.28 | 1.34 | 1.41 | 1.44 | 1.32 | 1.56 | 1.46 | 1.62 | 1.34 | 1.58 | 1.92 | 1.37 | 1.73 | 2.02 | 1.57 | 1.49 | 1.16 | 1.41 | 1.39 | 1.47 | 1.44 | 1.61 | 1.74 | 1.36 | 1.43 | 1.52 | 1.27 | 0.87 | 1.36 | 1.58 | 1.56 | 1.00 | 1.60 | 1.13 |
| K2O | 0.63 | 0.66 | 0.60 | 0.63 | 0.63 | 1.00 | 0.75 | 0.66 | 0.64 | 0.72 | 0.94 | 0.61 | 0.77 | 1.21 | 0.71 | 0.58 | 0.49 | 0.58 | 0.65 | 0.68 | 0.78 | 0.59 | 0.88 | 0.55 | 0.81 | 0.64 | 0.48 | 0.32 | 0.57 | 0.58 | 0.70 | 0.49 | 0.79 | 0.48 |
| Total | 97.72 | 97.87 | 98.76 | 98.55 | 97.79 | 97.95 | 98.24 | 98.31 | 98.60 | 98.75 | 98.81 | 98.50 | 98.01 | 98.33 | 97.18 | 98.26 | 97.88 | 97.55 | 97.66 | 98.55 | 98.32 | 98.35 | 98.27 | 98.34 | 97.62 | 98.07 | 99.01 | 97.84 | 98.49 | 98.12 | 98.10 | 98.14 | 97.93 | 97.99 |
| Formula based on 23 oxygen atoms and assuming a total of 13 cations exclusive of Ca, Na, and K | ||||||||||||||||||||||||||||||||||
| Si | 6.876 | 6.848 | 6.876 | 6.838 | 6.832 | 6.434 | 6.955 | 6.805 | 6.949 | 6.793 | 6.415 | 6.911 | 6.742 | 6.281 | 6.793 | 6.961 | 7.109 | 6.879 | 6.812 | 6.822 | 6.754 | 6.843 | 6.559 | 6.900 | 6.805 | 6.910 | 7.234 | 7.401 | 7.048 | 6.789 | 6.843 | 7.205 | 6.854 | 7.179 |
| Ti | 0.129 | 0.138 | 0.131 | 0.131 | 0.140 | 0.179 | 0.123 | 0.146 | 0.123 | 0.145 | 0.223 | 0.140 | 0.151 | 0.213 | 0.149 | 0.126 | 0.087 | 0.127 | 0.134 | 0.140 | 0.146 | 0.140 | 0.178 | 0.135 | 0.138 | 0.139 | 0.072 | 0.058 | 0.115 | 0.156 | 0.144 | 0.078 | 0.142 | 0.081 |
| Al | 1.274 | 1.354 | 1.291 | 1.351 | 1.322 | 1.878 | 1.263 | 1.441 | 1.244 | 1.482 | 1.948 | 1.339 | 1.488 | 2.134 | 1.428 | 1.303 | 0.959 | 1.274 | 1.384 | 1.354 | 1.466 | 1.330 | 1.670 | 1.264 | 1.298 | 1.357 | 0.948 | 0.698 | 1.137 | 1.448 | 1.370 | 0.946 | 1.352 | 0.927 |
| Cr | 0.003 | 0.003 | 0.001 | 0.002 | 0.007 | 0.006 | 0.003 | 0.007 | b.d.l. | 0.002 | 0.009 | 0.006 | b.d.l. | b.d.l. | 0.001 | b.d.l. | 0.002 | b.d.l. | b.d.l. | 0.002 | b.d.l. | b.d.l. | 0.007 | 0.005 | 0.006 | b.d.l. | 0.003 | b.d.l. | b.d.l. | 0.001 | 0.004 | 0.011 | 0.004 | b.d.l. |
| Fe+3 | 0.656 | 0.559 | 0.608 | 0.587 | 0.651 | 0.633 | 0.442 | 0.523 | 0.555 | 0.444 | 0.423 | 0.508 | 0.433 | 0.441 | 0.485 | 0.415 | 0.576 | 0.574 | 0.588 | 0.530 | 0.483 | 0.635 | 0.553 | 0.541 | 0.583 | 0.450 | 0.417 | 0.543 | 0.596 | 0.634 | 0.587 | 0.550 | 0.529 | 0.684 |
| Fe+2 | 1.214 | 1.297 | 1.117 | 1.199 | 1.190 | 1.274 | 1.380 | 1.205 | 1.270 | 1.437 | 1.614 | 1.328 | 1.429 | 1.507 | 1.407 | 1.364 | 1.151 | 1.275 | 1.138 | 1.283 | 1.478 | 1.128 | 1.380 | 1.236 | 1.369 | 1.336 | 1.275 | 1.076 | 1.139 | 1.115 | 1.126 | 1.093 | 1.255 | 1.014 |
| Mn | 0.073 | 0.071 | 0.061 | 0.057 | 0.069 | 0.061 | 0.061 | 0.064 | 0.077 | 0.063 | 0.074 | 0.061 | 0.060 | 0.070 | 0.068 | 0.051 | 0.074 | 0.062 | 0.068 | 0.080 | 0.074 | 0.071 | 0.065 | 0.066 | 0.063 | 0.076 | 0.072 | 0.075 | 0.070 | 0.065 | 0.060 | 0.076 | 0.055 | 0.086 |
| Mg | 2.775 | 2.730 | 2.915 | 2.834 | 2.789 | 2.534 | 2.773 | 2.810 | 2.781 | 2.634 | 2.295 | 2.707 | 2.697 | 2.354 | 2.670 | 2.781 | 3.042 | 2.809 | 2.876 | 2.788 | 2.599 | 2.853 | 2.588 | 2.852 | 2.737 | 2.732 | 2.979 | 3.148 | 2.894 | 2.791 | 2.866 | 3.040 | 2.809 | 3.027 |
| Ca | 1.788 | 1.805 | 1.791 | 1.800 | 1.793 | 1.810 | 1.793 | 1.775 | 1.780 | 1.808 | 1.810 | 1.774 | 1.827 | 1.814 | 1.809 | 1.791 | 1.827 | 1.817 | 1.811 | 1.824 | 1.849 | 1.755 | 1.818 | 1.817 | 1.833 | 1.774 | 1.790 | 1.770 | 1.728 | 1.738 | 1.748 | 1.779 | 1.762 | 1.732 |
| Na | 0.363 | 0.379 | 0.393 | 0.404 | 0.374 | 0.446 | 0.412 | 0.455 | 0.375 | 0.445 | 0.549 | 0.385 | 0.493 | 0.580 | 0.450 | 0.420 | 0.326 | 0.399 | 0.393 | 0.415 | 0.409 | 0.450 | 0.496 | 0.383 | 0.409 | 0.428 | 0.353 | 0.242 | 0.379 | 0.444 | 0.438 | 0.278 | 0.451 | 0.315 |
| K | 0.118 | 0.123 | 0.110 | 0.117 | 0.117 | 0.188 | 0.139 | 0.122 | 0.119 | 0.133 | 0.176 | 0.113 | 0.145 | 0.229 | 0.134 | 0.107 | 0.091 | 0.107 | 0.121 | 0.127 | 0.146 | 0.108 | 0.164 | 0.102 | 0.152 | 0.119 | 0.087 | 0.059 | 0.105 | 0.107 | 0.130 | 0.089 | 0.148 | 0.088 |
| Total | 15.268 | 15.307 | 15.294 | 15.321 | 15.284 | 15.444 | 15.343 | 15.352 | 15.275 | 15.386 | 15.535 | 15.272 | 15.465 | 15.623 | 15.393 | 15.318 | 15.244 | 15.323 | 15.324 | 15.365 | 15.404 | 15.314 | 15.478 | 15.302 | 15.393 | 15.322 | 15.230 | 15.071 | 15.212 | 15.288 | 15.316 | 15.146 | 15.361 | 15.13 |
| (Na + K)A | 0.27 | 0.31 | 0.29 | 0.32 | 0.28 | 0.44 | 0.34 | 0.35 | 0.27 | 0.39 | 0.53 | 0.27 | 0.46 | 0.62 | 0.39 | 0.32 | 0.24 | 0.32 | 0.32 | 0.37 | 0.40 | 0.31 | 0.48 | 0.30 | 0.39 | 0.32 | 0.23 | 0.07 | 0.21 | 0.29 | 0.32 | 0.15 | 0.36 | 0.14 |
| Mg/(Mg + Fe2+) | 0.70 | 0.68 | 0.72 | 0.70 | 0.70 | 0.67 | 0.67 | 0.70 | 0.69 | 0.65 | 0.59 | 0.67 | 0.65 | 0.61 | 0.65 | 0.67 | 0.73 | 0.69 | 0.72 | 0.68 | 0.64 | 0.72 | 0.65 | 0.70 | 0.67 | 0.67 | 0.70 | 0.75 | 0.72 | 0.71 | 0.72 | 0.74 | 0.69 | 0.75 |
| Thermobarometry (Rid olfi, 2021) | ||||||||||||||||||||||||||||||||||
| T (°C) | 795 | 800 | 798 | 796 | 806 | 854 | 779 | 823 | 790 | 804 | 875 | 792 | 809 | 894 | 806 | 776 | 762 | 787 | 810 | 814 | 803 | 816 | 842 | 797 | 791 | 806 | 751 | 727 | 782 | 825 | 812 | 765 | 799 | 769 |
| Error (°C) | 22 | 22 | 22 | 22 | 22 | 22 | 22 | 22 | 22 | 22 | 22 | 22 | 22 | 22 | 22 | 22 | 22 | 22 | 22 | 22 | 22 | 22 | 22 | 22 | 22 | 22 | 22 | 22 | 22 | 22 | 22 | 22 | 22 | 22 |
| P (MPa) | 130 | 142 | 133 | 139 | 140 | 277 | 123 | 164 | 126 | 159 | 295 | 139 | 157 | 414 | 150 | 126 | 87 | 123 | 151 | 145 | 155 | 143 | 207 | 127 | 126 | 146 | 86 | 140 | 113 | 168 | 151 | 92 | 141 | 91 |
| Error (MPa) | 16 | 17 | 16 | 17 | 17 | 33 | 15 | 20 | 15 | 19 | 35 | 17 | 19 | 50 | 18 | 15 | 10 | 15 | 18 | 17 | 19 | 17 | 25 | 15 | 15 | 17 | 10 | 8 | 14 | 20 | 18 | 11 | 17 | 11 |
b.d.l., below detection limit; MME, mafic microgranular enclave; Host-Gtd, host granitoid.
![Figure 8
(a) Classification diagram of amphibole [44] from the Morobe Granodiorite. (b) Results of the geothermobarometry [45] calculations for the host granitoid and MME in the Morobe Granodiorite.](/document/doi/10.1515/geo-2022-0547/asset/graphic/j_geo-2022-0547_fig_008.jpg)
Representative chemical compositions of biotite and plagioclase from the MMEs and the host granodiorite are listed in Table 3. The chemical composition of biotite is not significantly different between MME and the host granodiorite (Figure 9a). Plagioclase in the host granodiorite is An36–51 in the core but decreases to about An20 in the rim (Figure 9b). Plagioclase in MME is more An-rich, reaching An73 (Figure 9c).
Major element compositions of plagioclase and biotite
| Sample | 102812b | 102812b | 102812b | 102812b | 102812b | 102812a | 102812a | 102812a | 102812a | 102812a | 102812a | 102812a | 102812b | 102812b | 102812b | 102812b | 102812b | 102812b | 102812b | 102812b | 102812a | 102812a | 102812a | 102812a | 102812a | 102812a | 102812a | 102812a |
|---|---|---|---|---|---|---|---|---|---|---|---|---|---|---|---|---|---|---|---|---|---|---|---|---|---|---|---|---|
| Lithology | MME | MME | MME | MME | MME | Host-Gtd | Host-Gtd | Host-Gtd | Host-Gtd | Hot-Gt | Host-Gtd | Host-Gtd | MME | MME | MME | MME | MME | MME | MME | MME | Host-Gtd | Host-Gtd | Host-Gtd | Host-Gtd | Host-Gtd | Host-Gtd | Host-Gtd | Host-Gtd |
| Mineral | Pl | Pl | Pl | Pl | Pl | P1 | P l | Pl | Pl | Pl | Pl | Pl | Bt | Bt | Bt | Bt | Bt | Bt | Bt | Bt | Bt | Bt | Bt | Btc | Bt | Bt | Bt | Bt |
| Position | Core | Core | Rim | Core | Core | Core | Core | Core | Rim | Core | Core | Rim | Core | Core | Core | Core | Core | Core | Core | Core | Core | Rim | Core | ore | Core | Core | Core | Core |
| wt% | ||||||||||||||||||||||||||||
| SiO2 | 50.18 | 52.62 | 64.74 | 52.35 | 58.76 | 58.68 | 56.54 | 64.14 | 63.96 | 58.17 | 59.67 | 64.94 | 37.37 | 37.41 | 37.96 | 37.74 | 37.57 | 37.93 | 37.04 | 37.73 | 38.18 | 37.98 | 36.29 | 37.25 | 38.43 | 37.78 | 37.14 | 37.88 |
| TiO2 | 0.02 | 0.01 | 0.02 | b.d.l. | 0.01 | b.d.l. | 0.02 | 0.03 | b.d.l. | 0.02 | 0.01 | 0.02 | 4.12 | 3.58 | 3.67 | 3.96 | 4.04 | 4.14 | 4.80 | 3.96 | 4.15 | 3.17 | 3.20 | 3.91 | 3.42 | 3.90 | 3.76 | 3.99 |
| Al2O3 | 32.02 | 30.50 | 22.88 | 30.61 | 26.98 | 26.65 | 28.16 | 22.91 | 22.51 | 27.39 | 26.33 | 22.79 | 13.77 | 13.95 | 13.93 | 14.10 | 14.02 | 14.00 | 13.67 | 14.12 | 13.87 | 14.15 | 14.91 | 14.23 | 14.11 | 14.13 | 13.86 | 14.15 |
| Cr2O3 | b.d.l. | b.d.l. | 0.03 | 0.03 | 0.02 | 0.06 | b.d.l. | 0.02 | b.d.l. | 0.04 | b.d.l. | 0.02 | 0.02 | b.d.l. | 0.04 | b.d.l. | b.d.l. | 0.03 | b.d.l. | 0.01 | b.d.l. | 0.03 | 0.01 | 0.02 | 0.06 | 0.01 | 0.02 | b.d.l. |
| FeO | 0.28 | 0.15 | 0.24 | 0.18 | 0.10 | 0.13 | 0.12 | 0.20 | 0.18 | 0.18 | 0.15 | 0.15 | 17.85 | 18.76 | 18.62 | 18.870 | 18.51 | 18.31 | 18.44 | 17.40 | 18.20 | 17.95 | 17.46 | 18.27 | 18.62 | 18.22 | 18.51 | 18. 64 |
| MnO | b.d.l | b.d.l. | b.d.l. | b.d.l. | 0.02 | b.d.l. | 0.03 | b.d.l. | 0.02 | b.d.l. | b.d.l. | 0.02 | 0.34 | 0.39 | 0.37 | 0.34 | 0.32 | 0.38 | 0.34 | 0.35 | 0.39 | 0.33 | 0.29 | 0.30 | 0.48 | 0.47 | 0.43 | 0.29 |
| MgO | b.d.l | b.d.l. | b.d.l. | b.d.l. | b.d.l. | b.d.l. | b.d.l. | b.d.l. | 0.01 | 0.01 | b.d.l. | b.d.l. | 12.44 | 12.41 | 12.47 | 12.52 | 12.48 | 12.33 | 11.68 | 13.12 | 12.02 | 13.12 | 13.42 | 11.82 | 12.44 | 12.34 | 12.27 | 11.98 |
| CaO | 14.81 | 13.30 | 4.14 | 13.38 | 8.62 | 8.51 | 10.30 | 4.32 | 3.94 | 9.14 | 7.93 | 4.04 | 0.16 | 0.08 | 0.03 | b.d.l. | b.d.l. | 0.06 | 0.08 | 0.07 | 0.02 | 0.10 | 0.28 | 0.11 | 0.01 | b.d.l. | 0.02 | 0.03 |
| Na2O | 2.98 | 4.03 | 9.26 | 4.04 | 6.58 | 6.54 | 5.56 | 8.91 | 8.96 | 6.19 | 6.88 | 9.26 | 0.51 | 0.15 | 0.12 | 0.15 | 0.14 | 0.10 | 0.22 | 0.16 | 0.15 | 0.13 | 0.09 | 0.16 | 0.07 | 0.18 | 0.23 | 0.10 |
| K2O | 0.06 | 0.08 | 0.56 | 0.09 | 0.18 | 0.18 | 0.15 | 0.40 | 0.27 | 0.20 | 0.23 | 0.39 | 8.74 | 9.04 | 9.12 | 9.53 | 9.49 | 9.22 | 8.95 | 9.12 | 9.26 | 9.10 | 7.30 | 9. | 9.39 | 9.36 | 9.00 | 9.09 |
| 100.35 | 100.70 | 101.86 | 100.68 | 101.26 | 100.76 | 100.87 | 100.92 | 99.84 | 101.32 | 101.21 | 101.60 | 95.30 | 95.77 | 96.32 | 97.22 | 96.55 | 96.52 | 95.21 | 96.05 | 96.24 | 96.05 | 93.24 | 95.24 | 97.03 | 96.39 | 95.23 | 96.13 | |
| Oxygen | 8 | 8 | 8 | 8 | 8 | 8 | 8 | 8 | 8 | 8 | 8 | 8 | 22 | 22 | 22 | 22 | 22 | 22 | 22 | 22 | 22 | 22 | 22 | 22 | 22 | 22 | 22 | 22 |
| Si | 2.281 | 2.371 | 2.816 | 2.362 | 2.596 | 2.605 | 2.520 | 2.811 | 2.827 | 2.572 | 2.632 | 2.825 | 5.659 | 5.662 | 5.699 | 5.636 | 5.641 | 5.678 | 5.635 | 5.653 | 5.727 | 5.697 | 5.558 | 5.658 | 5.72 | 5.670 | 5.652 | 5.693 |
| Ti | 0.001 | 0.000 | 0.001 | b.d.l. | 0.000 | b.d.l. | 0.001 | 0.001 | b.d.l. | 0.000 | 0.000 | 0.001 | 0.469 | 0.408 | 0.415 | 0.445 | 0.456 | 0.467 | 0.550 | 0.447 | 0.468 | 0.357 | 0.368 | 0.447 | 0.383 | 0.440 | 0.430 | 0.451 |
| Al | 1.715 | 1.620 | 1.173 | 1.628 | 1.405 | 1.394 | 1.479 | 1.183 | 1.173 | 1.427 | 1.369 | 1.168 | 2.457 | 2.487 | 2.464 | 2.482 | 2.480 | 2.471 | 2.452 | 2.493 | 2.453 | 2.501 | 2.690 | 2.548 | 2.479 | 2.499 | 2.486 | 2.506 |
| Cr | b.d.l. | b.d.l. | 0.001 | 0.001 | 0.001 | 0.002 | b.d.l. | 0.001 | b.d.l. | 0.001 | b.d.l. | 0.001 | 0.002 | b.d.l. | 0.004 | b.d.l. | b.d.l. | 0.004 | b.d.l. | 0.001 | b.d.l. | 0.003 | 0.001 | 0.003 | 0.007 | 0.002 | 0.003 | b.d.l. |
| Fe | 0.010 | 0.006 | 0.009 | 0.007 | 0.004 | 0.005 | 0.004 | 0.007 | 0.007 | 0.007 | 0.005 | 0.005 | 2.260 | 2.373 | 2.338 | 2.356 | 2.323 | 2.293 | 2.347 | 2.180 | 2.283 | 2.252 | 2.235 | 2.320 | 2.320 | 2.286 | 2.355 | 2.342 |
| Mn | b.d.l. | b.d.l. | b.d.l. | b.d.l. | 0.001 | b.d.l. | 0.001 | b.d.l. | 0.001 | b.d.l. | b.d.l. | 0.001 | 0.044 | 0.050 | 0.047 | 0.043 | 0.041 | 0.048 | 0.043 | 0.044 | 0.049 | 0.042 | 0.038 | 0.039 | 0.061 | 0.060 | 0.055 | 0.037 |
| Mg | b.d.l. | b.d.l. | b.d.l. | b.d.l. | b.d.l. | b.d.l. | b.d.l. | b.d.l. | 0.001 | 0.001 | b.d.l. | b.d.l. | 2.807 | 2.799 | 2.790 | 2.787 | 2.793 | 2.752 | 2.650 | 2.931 | 2.687 | 2.935 | 3.064 | 2.676 | 2.763 | 2.761 | 2.782 | 2.684 |
| Ca | 0.721 | 0.642 | 0.193 | 0.647 | 0.408 | 0.405 | 0.491 | 0.203 | 0.186 | 0.433 | 0.375 | 0.188 | 0.025 | 0.013 | 0.005 | b.d.l. | b.d.l. | 0.010 | 0.013 | 0.011 | 0.003 | 0.016 | 0.045 | 0.018 | 0.002 | b.d.l. | 0.003 | 0.004 |
| Na | 0.262 | 0.352 | 0.780 | 0.353 | 0.564 | 0.563 | 0.480 | 0.757 | 0.768 | 0.531 | 0.588 | 0.781 | 0.151 | 0.044 | 0.035 | 0.044 | 0.040 | 0.030 | 0.063 | 0.047 | 0.044 | 0.037 | 0.027 | 0.047 | 0.021 | 0.051 | 0.068 | 0.030 |
| K | 0.004 | 0.005 | 0.031 | 0.005 | 0.010 | 0.010 | 0.008 | 0.022 | 0.015 | 0.011 | 0.013 | 0.021 | 1.688 | 1.746 | 1.747 | 1.815 | 1.818 | 1.761 | 1.736 | 1.744 | 1.773 | 1.742 | 1.427 | 1.776 | 1.786 | 1.791 | 1.746 | 1.742 |
| Total | 4.994 | 4.996 | 5.003 | 5.003 | 4.988 | 4.984 | 4.985 | 4.986 | 4.978 | 4.984 | 4.984 | 4.991 | 15.562 | 15.582 | 15.543 | 15.608 | 15.592 | 15.513 | 15.489 | 15.549 | 15.487 | 15.583 | 15.454 | 15.532 | 15.550 | 15.560 | 15.580 | 15.489 |
| An# or Mg# | 73.1 | 64.3 | 19.2 | 64.3 | 41.6 | 41.4 | 50.2 | 20.7 | 19.2 | 44.4 | 38.4 | 19.0 | 55.4 | 54.1 | 54.4 | 54.2 | 54.6 | 54.6 | 53.0 | 57.3 | 54.1 | 56.6 | 57.8 | 53.6 | 54.4 | 54.7 | 54.2 | 53.4 |
b.d.l., below detection limit; Pl, plagioclase; Bt, biotite.
![Figure 9
(a) Compositional plot of biotite from the host granitoid and MME in the Morobe Granodiorite (After Speer [47]). (b) Composition of plagioclase from the host granitoid. (c) Composition of plagioclase from the MME.](/document/doi/10.1515/geo-2022-0547/asset/graphic/j_geo-2022-0547_fig_009.jpg)
(a) Compositional plot of biotite from the host granitoid and MME in the Morobe Granodiorite (After Speer [47]). (b) Composition of plagioclase from the host granitoid. (c) Composition of plagioclase from the MME.
Barite inclusions in hornblende and biotite in MME contain up to about 4 wt% SrO (Figure 10a). On the other hand, barite coexisting with hematite contains very little SrO. Native gold in the MME contains 80–85 atm% Au and 15–20 atm% Ag (Figure 10b).
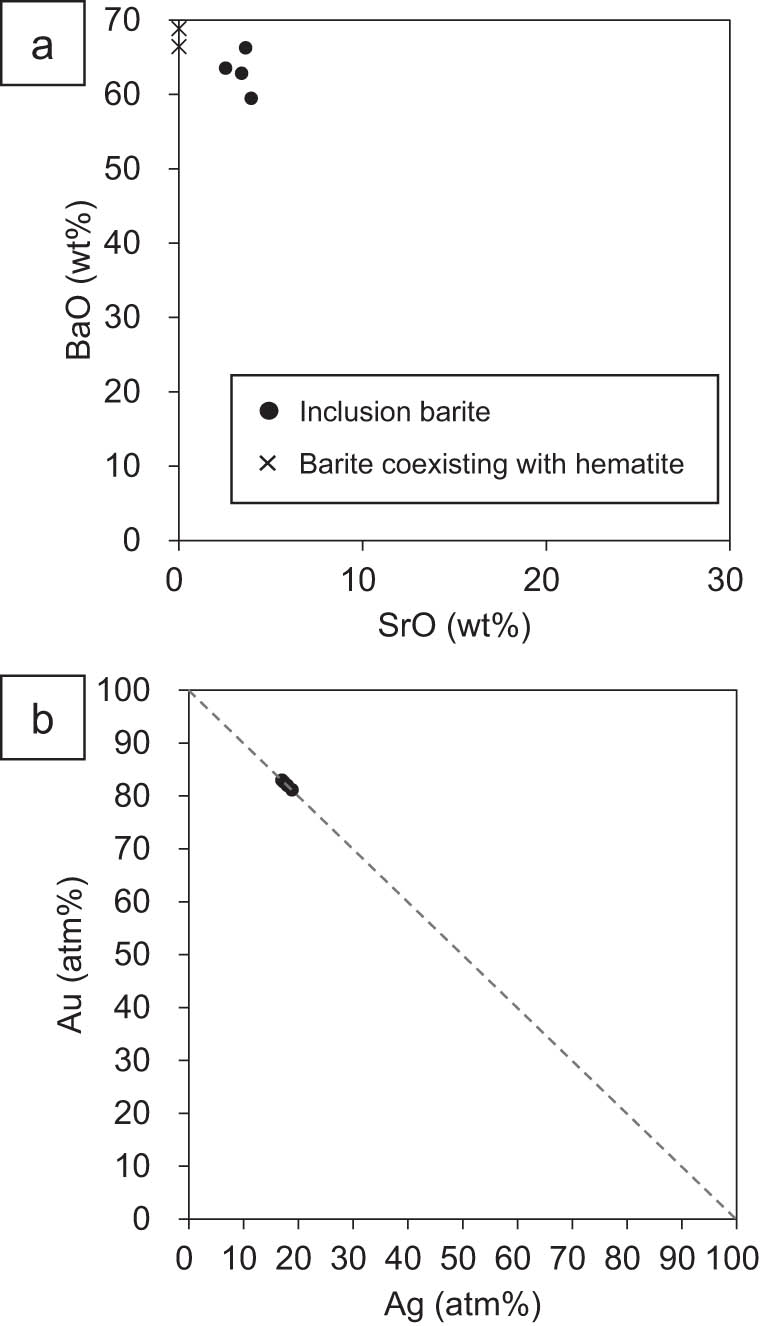
(a) Covariation diagram between BaO and SrO for two types of barite in the MME. (b) Composition of native gold in the MME. Au displays a negative correlation with Ag.
8 Geothermobarometry
All described samples except for the marginal parts of the Morobe Granodiorite contain mineral assemblages with a significant amount of amphiboles, which can be used as good pressure and temperature indicators in igneous rocks. Regardless of mafic, intermediate, or felsic compositions, amphiboles are the most useable minerals for geothermobarometry in calc-alkaline igneous rocks. For this study, the single-phase geothermobarometry valid for Mg-rich calcic amphiboles in equilibrium with calc-alkaline or alkaline melts developed by Ridolfi [45] was used to calculate the crystallization temperature and pressure of amphibole from the MME and the host granitoids. The temperature and pressure obtained from the hornblende rims are concentrated in the narrow range of 770–810°C and 90–150 MPa for both the MME and the host granitoids (Figure 8b). The temperature and pressure ranges of the hornblende cores overlap with those of the rims in both the MME and the host granitoids, although some of the hornblende cores of the MME show higher temperatures and pressures (>850°C, >200 MPa).
9 Discussion
9.1 Crystal fractionation in the Morobe Granodiorite
In the Harker diagrams of whole-rock chemical compositions, the compositional variations in granitoids from the inner parts of the Morobe Granodiorite display a series of linear trends (Figure 11). However, the composition of MME deviates from the linear trends in the Harker diagrams for K2O and Ba. Therefore, it is difficult to explain the linear compositional trends of the granitoids by mixing between the MME and a more silicic magma. The whole-rock compositional variations in granitoids correlate with textural variations associated with modal variations in the major cumulus phases, hornblende, and plagioclase. For example, samples showing cumulus textures are poor in SiO2 and K2O and rich in MgO (e.g., sample 100070 in Figure 3f). On the other hand, samples exhibiting poikilitic textures are rich in SiO2 and K2O and poor in MgO (e.g., sample 100034 in Figure 3e). Thus, the linear compositional trends of granitoids in the Harker diagram for Na2O, MgO, Al2O3, K2O, etc., can be explained by both hornblende and plagioclase fractionation. Compositional variations in Y and Zr in granitoids also represent the fractionation of hornblende with large partition coefficients for these elements. The increase in Ba with increasing SiO2 suggests that biotite fractionation is not important.
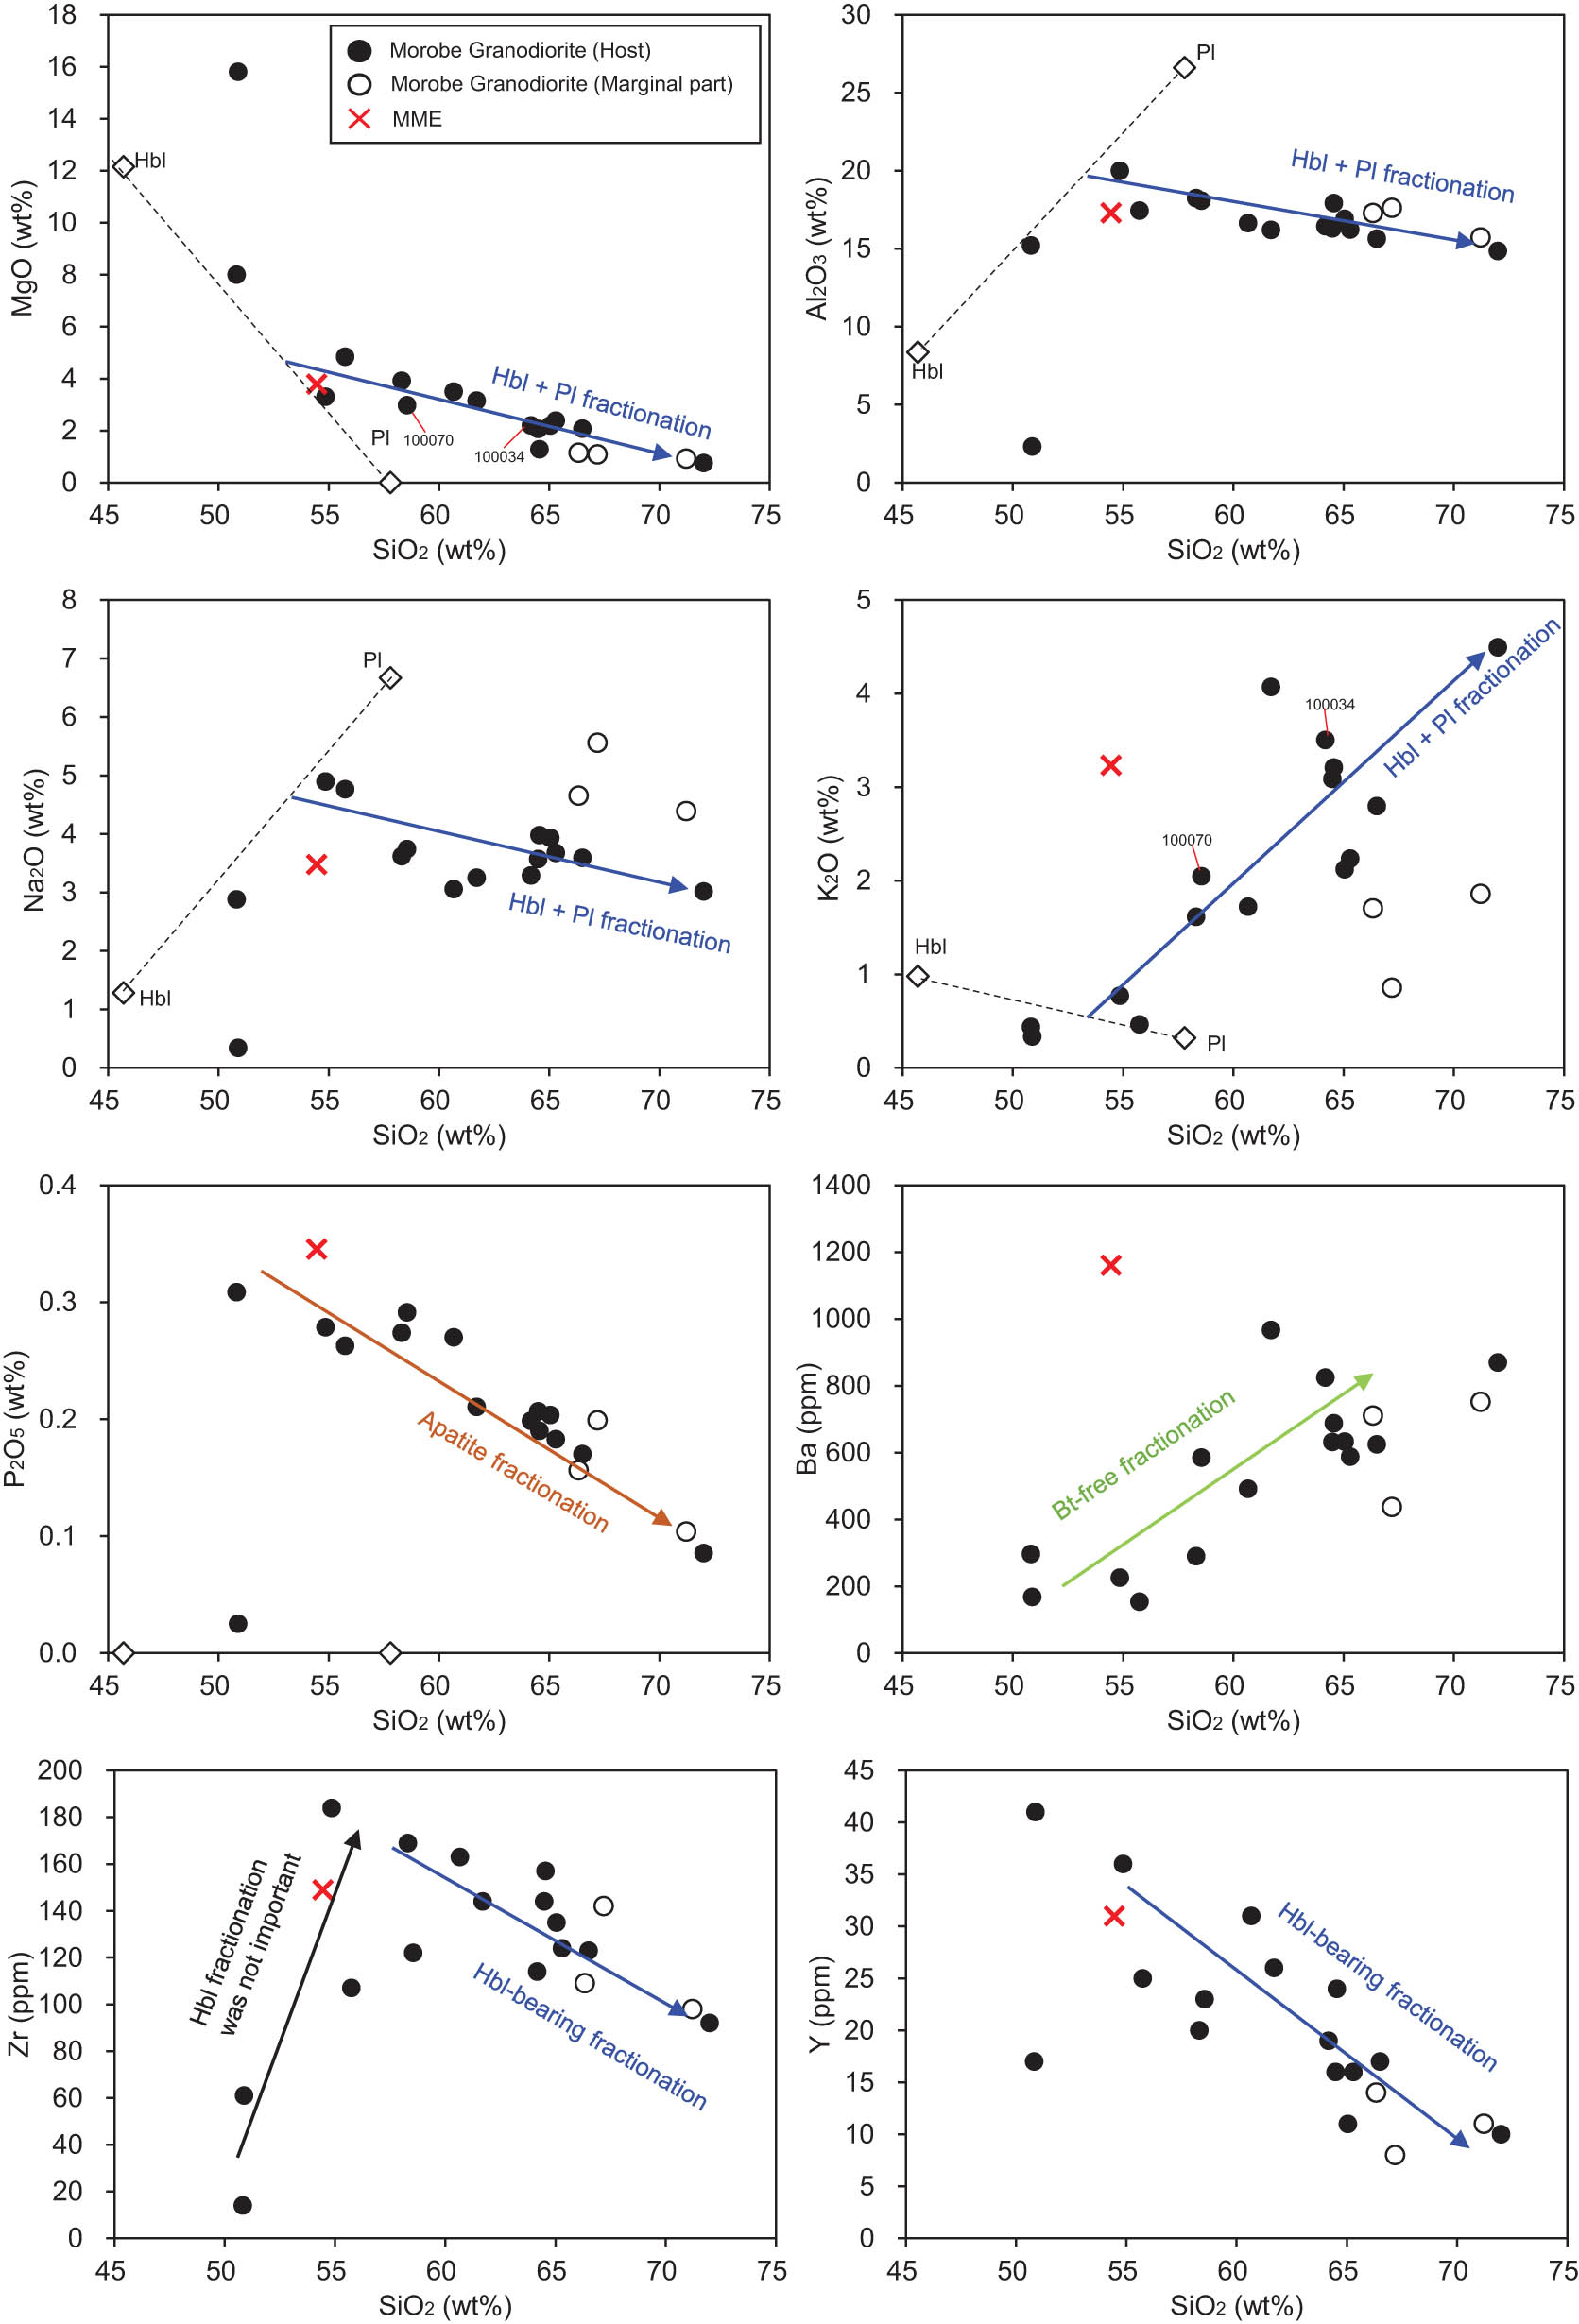
Whole-rock Harker diagrams of major and trace elements for the host granitoids and MME.
Samples from the marginal parts deviate toward higher and lower, respectively, from the trend of the inner parts for Na2O and K2O. The reason for this is currently unclear, but mixing between the magma represented by the marginal composition and the MME may have occurred.
9.2 Magma genesis of the Morobe Granodiorite
The whole-rock compositions of granitoids from the Morobe Granodiorite are mostly plotted within the compositional range of partial melts of amphibolites among the compositions of partial melts of various rocks obtained in the partial melting experiments by Patiño Douce [48] (Figure 12). The Magnesian characteristics of granitoids also suggest that the source materials of granitoids are mafic rocks (Figure 7d). Whalen and Hildebrand [49] recently proposed new geochemical discrimination diagrams for magmas that occur at destructive plate margins based on the study of granitoids in the North American Cordillera. They used Nb/Y-Nb + Y diagrams and others to distinguish between arc magmas generated by volatiles streaming from a subducting slab and slab failure magmas derived through deep mantle processes, including partial melting of the metabasaltic/metagabbroic upper portions of torn slab (Figure 13). Based on the discrimination diagrams, the most samples from the Morobe Granodiorite are classified as slab failure, not arc. The geochemical signature of slab failure magmatism of the Morobe Granodiorite refutes the conventional idea that igneous activity around 15 Ma in the Maramuni Arc occurred in association with subduction (e.g., Holm et al. [6], Ӧsterle et al. [15]). Hall [17], Hill and Hall [20], and Webb et al. [16] argued that the arc-continent collision at about 25 Ma had ended the northward subduction of the Solomon Sea Plate that continued until the Late Oligocene and the southwestward oblique subduction had initiated in the Early Miocene. Since the continental collision causes the slab failure (e.g., Wortel and Spakman [50]; Davies and von Blanckenburg [51]; Hildebrand and Bowring [52]; Garzanti et al. [53]), it is quite possible that the old slab of the Solomon Sea Plate was torn in the Miocene age after the cessation of subduction followed by the arc-continent collision (Figure 14a). The Morobe Granodiorite may have been derived from magma generated by the partial melting of the metabasaltic/metagabbroic upper portions of the torn slab.
![Figure 12
Whole-rock composition of the Morobe Granodiorite in major element diagrams after Patiño Douce [48]. Colored areas show compositional fields of experimental melts produced by the partial melting of felsic pelites, graywackes, and amphibolites.](/document/doi/10.1515/geo-2022-0547/asset/graphic/j_geo-2022-0547_fig_012.jpg)
Whole-rock composition of the Morobe Granodiorite in major element diagrams after Patiño Douce [48]. Colored areas show compositional fields of experimental melts produced by the partial melting of felsic pelites, graywackes, and amphibolites.
![Figure 13
Geochemical diagrams to discriminate arc, slab failure, and A-type magmatism (after Whalen and Hildebrand [49]) for the Morobe Granodiorite.](/document/doi/10.1515/geo-2022-0547/asset/graphic/j_geo-2022-0547_fig_013.jpg)
Geochemical diagrams to discriminate arc, slab failure, and A-type magmatism (after Whalen and Hildebrand [49]) for the Morobe Granodiorite.
![Figure 14
(a) Cross-sectional tectonic model showing the formation mechanism of Morobe Granodiorite and MME in the Middle Miocene. The direction of subducting plate motion and distribution of metamorphic rocks during this period are derived from Hill and Hall [20]. (b) Rb/Sr versus Ba/Rb diagram [64] shows the presence of phlogopite in the mantle for the MME in the Morobe Granodiorite. SCLM: subcontinental lithospheric mantle, PM: primitive mantle [74].](/document/doi/10.1515/geo-2022-0547/asset/graphic/j_geo-2022-0547_fig_014.jpg)
(a) Cross-sectional tectonic model showing the formation mechanism of Morobe Granodiorite and MME in the Middle Miocene. The direction of subducting plate motion and distribution of metamorphic rocks during this period are derived from Hill and Hall [20]. (b) Rb/Sr versus Ba/Rb diagram [64] shows the presence of phlogopite in the mantle for the MME in the Morobe Granodiorite. SCLM: subcontinental lithospheric mantle, PM: primitive mantle [74].
9.3 Petrogenesis of the MMEs
Previous studies of MMEs in granitoids have led to the following models for origins of MMEs: (1) melting remnants (restites) of source material for the host granitoid magma [54], (2) xenoliths or fragments of country rocks [55], (3) cognate mafic cumulates crystallized from the magma that produced the host granitoids [56,58], and (4) the mingled products of magmas of different origins from the host granitoids [59,62,].
The MMEs do not have any metamorphic- or sedimentary-rock fabrics which should be found in restites or xenoliths originating from the country rocks. Therefore, the hypotheses that the MMEs are restites and xenoliths of country rocks are not suitable as explanations for the petrogenesis of MMEs in the Morobe Granodiorite.
Poikilitic and porphyritic textures and zoned structures of plagioclase in the MMEs from the Morobe Granodiorite indicate that the MMEs are crystallized from magma. The rounded shape suggests that the MME existed as magma in unconsolidated granodiorite. The MMEs do not exhibit cumulus textures but poikilitic or porphyritic textures. This also contradicts the cognate hypothesis. In addition, as mentioned earlier, the composition of the MME deviates significantly from the linear trend of the host granitoids in the Ba- and K2O-SiO2 Harker diagrams of the whole-rock compositions (Figure 11). Furthermore, while the crystallization pressures of hornblende rims in the MME and host granitoids should indicate the emplacement depth of the granitoids, some hornblende cores in the MME show higher pressures (Figure 8b). This suggests that the MME was derived from a depth deeper than the emplacement depth of the granitoids. These textural, geochemical, and mineralogical characteristics are not consistent with the hypothesis that the MMEs are cognate mafic cumulates from the granitoid-forming magma. Therefore, the MMEs are likely to be mingled products of magmas of different origins from the magma that produced the host granitoids.
Altherr et al. [63] pointed out that extremely high temperatures (≥1,100°C) and geothermal gradients are needed to produce mafic metaluminous low-silica (<56 wt%) melts by dehydration melting of metabasaltic compositions. They also suggested that such high temperatures and geothermal gradients are unlikely since they would imply almost complete melting of the lower and middle crusts. Therefore, the MME (SiO2 = ∼54 wt%) in the Morobe granodiorite likely did not originate from the melting of mafic crust but from the mantle. In addition, it has a higher Rb/Sr ratio than the primitive mantle (Figure 14b). This indicates that the MME is derived from the partial melting of phlogopite-rich mantle sources [64]. Experiments at 1 GPa have also confirmed that the partial melting of phlogopite-bearing peridotites produces shoshonitic mafic magma [65].
Phlogopite-bearing peridotites are generally regarded as the products of interaction between peridotite and slab-derived sediment melts and/or fluids (e.g., Kepezhinskas et al. [66]; Brandon et al. [67]; Zanetti et al. [68]; Mallik et al. [69]; Shaarschmidt et al. [70]). The occurrence of barite inclusions in euhedral hornblende and biotite, early-formed phases in the MME, suggests that the barite crystallized in the fluid inclusion trapped by them. This means that the MME-forming magma was originally rich in Ba, Sr, and SO4 2− and that these elements were partitioned into the fluid phase, which was saturated in the early stage of crystallization of the magma. Considering that barite is found primarily in seawater and seafloor sediments on modern Earth [71], the crystallization of barite in the MME suggests that the mantle that produced the shoshonitic MME-forming magma has been metasomatized by slab-derived sediments. The metasomatism by slab-derived sediments is also consistent with the hypothesis of the granitoid magma genesis by slab failure since it is entirely possible that partial melting of detached slab or release of fluids from the slab can occur in the mantle after slab failure (e.g. Freeburn et al. [72]) (Figure 14a).
The domains in which hematite, barite, and a small amount of pyrite coexist form frameworks with euhedral hornblende and plagioclase (Figures 5e and 6e), suggesting that the domains were produced by the decomposition of magmatic primary minerals. Since hematite forms at higher oxygen fugacities than pyrite (e.g., Hodkiewicz et al. [73]), it is unlikely that they formed at the same time. Therefore, a small amount of pyrite in the domains must be the reactant mineral. The formation of hematite and barite may be explained by the oxidation reaction as follows:
Pyrite can form barite and hematite when reacting with Ba-bearing oxidizing fluids. The aforementioned Ba-bearing fluid which was saturated in MME-forming magma would have been the reacting fluid. The abundant native gold grains in the MME indicate that the MME-forming magma was rich in Au. They are unlikely to have crystallized directly from the magma, and most Au in the magma should have been partitioned into sulfides. Native gold grains in cracks and voids in hornblende and plagioclase may have been formed by the release of Au from pyrite that decomposed in the oxidation reaction. MMEs in the granitoids may have played an important role in transporting Au from the mantle to the crust (Figure 14a).
10 Conclusions
The Morobe Granodiorite is a composite batholith consisting of monzodiorite, monzonite, quartz monzonite, granite, granodiorite, diorite, and gabbro. The geochemical signature of the granitoids represents a calc-alkaline and metaluminous nature typical of I-type granitoids. They mainly belong to the medium-K to high-K series, but the MMEs in the granitoids are classified into shoshonite series. The geochemical and textural variations in granitoids can be mainly explained by the fractional crystallization of hornblende and plagioclase.
The granitoids from the Morobe Granodiorite are comparable to the compositions of partial melt of amphibolites and have geochemical characters of slab failure magma defined by Whalen and Hildebrand [49]. Therefore, the granitoid-forming magma may be generated by the partial melting of the metabasaltic/metagabbroic upper portions of the torn slab in the slab failure.
The higher Rb/Sr ratio of the MME indicates that the MME is derived from the partial melting of phlogopite-rich mantle sources. Barite crystallization in the MME suggests that the source mantle of the MME has been metasomatized by the slab-derived sediment melt and/or fluids.
Native gold grains were first found from the MME in the granitoids. MMEs in the granitoids may have played an important role in transporting Au from the mantle to the crust.
Acknowledgments
The authors are grateful to the Japan International Cooperation Agency (JICA), the KIZUNA program, for financial support for the fieldwork. We also thank Prof. Tsukasa Ohba (Akita University) for his support in our daily discussions and on various occasions. Constructive comments from Prof. Hossein Azizi and two anonymous reviewers and Editor Jan Barabach are greatly acknowledged.
-
Funding information: This research was supported in part by JSPS KAKENHI Grant Number 22K03750.
-
Author contributions: T.H. and A.B. conceived and planned all the workflow of the research. A.B. and T.H. carried out the fieldwork and sampling. T.H. and T.I. contributed to the EPMA and SEM-EDS analyses. A.B. contributed to the whole-rock geochemical analysis. T.H. and A.B. contributed to the thin section description. T.H. contributed to the interpretation of the results. T.H. and A.B. took the lead in writing the manuscript.
-
Conflict of interest: Authors state no conflict of interest.
References
[1] Davies HL, Perembo RC, Winn RD, Ken Gemar P. Terranes of the New Guinea Orogen. Proceedings of the Geology Exploration and Mining Conference, Madang. Melbourne: Australasian Institute of Mining and Metallurgy; 1997.Search in Google Scholar
[2] Hamilton WB. Tectonics of the Indonesian region. Vol. 1078. Washington: US Government Printing Office; 1979. 10.3133/PP1078.Search in Google Scholar
[3] Cullen AB, Pigott JD. Post-Jurassic tectonic evolution of Papua New Guinea. Tectonophysics. 1989;162(3–4):291–302. 10.1016/0040-1951(89)90250-3.Search in Google Scholar
[4] Hill KC, Raza A. Arc-continent collision in Papua Guinea: Constraints from fission track thermochronology. Tectonics. 1999;18(6):950–66. 10.1029/1999TC900043.Search in Google Scholar
[5] Abbott LD. Neogene tectonic reconstruction of the Adelbert-Finisterre-New Britain collision, northern Papua New Guinea. J Southeast Asian Earth Sci. 1995;11(1):33–51. 10.1016/0743-9547(94)00032-A.Search in Google Scholar
[6] Holm RJ, Spandler C, Richards SW. Continental collision, orogenesis and arc magmatism of the Miocene Maramuni arc, Papua New Guinea. Gondwana Res. 2015;28(3):1117–36. 10.1016/J.GR.2014.09.011.Search in Google Scholar
[7] Johnson RW, Mackenzie DE, Smith IEM. Delayed partial melting of subduction-modified mantle in papua new guinea. Tectonophysics. 1978;46(1–2):197–216. 10.1016/0040-1951(78)90114-2.Search in Google Scholar
[8] Johnson RW, Jaques AL. Continent—arc collision and reversal of arc polarity: New interpretations from a critical area. Tectonophysics. 1980;63(1–4):111–24. 10.1016/0040-1951(80)90110-9.Search in Google Scholar
[9] Chappell BW, White AJR. Two contrasting granite types. Pac Geol. 1974;8(2):173–4.Search in Google Scholar
[10] White AJR. Sources of granite magmas. Boulder, Colorado, USA: Geological Society of America Abstracts with Programs. Vol. 11; 1979.Search in Google Scholar
[11] Pearce JA, Harris NBW, Tindle AG. Trace Element Discrimination Diagrams for the Tectonic Interpretation of Granitic Rocks. J Petrol. 1984;25(4):956–83. 10.1093/PETROLOGY/25.4.956.Search in Google Scholar
[12] Maniar PD, Piccoli PM. Tectonic discrimination of granitoids. Geol Soc Am Bull. 1989;101(5):635–43.10.1130/0016-7606(1989)101<0635:TDOG>2.3.CO;2Search in Google Scholar
[13] Bonin B. From orogenic to anorogenic settings: Evolution of granitoid suites after a major orogenesis. Geol J. 1990;25(3–4):261–70. 10.1002/GJ.3350250309.Search in Google Scholar
[14] Barbarin B. A review of the relationships between granitoid types, their origins and their geodynamic environments. Lithos. 1999;46(3):605–26. 10.1016/S0024-4937(98)00085-1.Search in Google Scholar
[15] Ӧsterle JE, Little TA, Seward D, Stockli DF, Gamble J. The petrology, geochronology and tectono-magmatic setting of igneous rocks in the Suckling-Dayman metamorphic core complex, Papua New Guinea. Gondwana Res. 2020;83:390–414. 10.1016/J.GR.2020.01.014.Search in Google Scholar
[16] Webb M, White LT, Jost BM, Tiranda H, BouDagher-Fadel M. The history of Cenozoic magmatism and collision in NW New Guinea – New insights into the tectonic evolution of the northernmost margin of the Australian Plate. Gondwana Res. 2020;82:12–38. 10.1016/J.GR.2019.12.010.Search in Google Scholar
[17] Hall R. Cenozoic geological and plate tectonic evolution of SE Asia and the SW Pacific: computer-based reconstructions, model and animations. J Asian Earth Sci. 2002;20(4):353–431. 10.1016/S1367-9120(01)00069-4.Search in Google Scholar
[18] Holm RJ, Spandler C, Richards SW. Melanesian arc far-field response to collision of the Ontong Java Plateau: Geochronology and petrogenesis of the Simuku Igneous Complex, New Britain, Papua New Guinea. Tectonophysics. 2013;603:189–212. 10.1016/J.TECTO.2013.05.029.Search in Google Scholar
[19] Dow DB. A geological synthesis of Papua New Guinea. Canberra: Australian Government Publishing Service; 1977.Search in Google Scholar
[20] Hill KC, Hall R. Mesozoic-Cenozoic evolution of Australia’s New Guinea margin in a west Pacific context. Geol Soc Am Spec. 2003;372:265–90. 10.1130/0-8137-2372-8.265.Search in Google Scholar
[21] Cloos M, Sapiie B, Van Ufford AQ, Weiland RJ, Warren PQ, McMahon TP. Collisional delamination in New Guinea: The geotectonics of subducting slab breakoff. Geol Soc Am Spec. 2005;400:1–51. 10.1130/2005.2400.Search in Google Scholar
[22] Cussen MJ. Geology and mineralisation of the Wau Area, Papua New Guinea. Geological Survey of Papua New Guinea, Report, 86/16; 1986.Search in Google Scholar
[23] Baldwin SL, Fitzgerald PG, Webb LE. Tectonics of the New Guinea Region. Annu Rev Earth Planet Sci. 2012;40:495–520. 10.1146/ANNUREV-EARTH-040809-152540.Search in Google Scholar
[24] Fisher NH. Outline of the geology of the morobe goldfields. Proceedings of the Royal Society of Queensland. Vol. 55. 1944.10.5962/p.351691Search in Google Scholar
[25] Pigram CJ, Davies HL. Terranes and the accretion history of the New Guinea orogen. BMR J Aust Geol Geophys. 1987;10:193–211. https://ecat.ga.gov.au/geonetwork/srv/api/records/fae9173a-709e-71e4-e044-00144fdd4fa6.Search in Google Scholar
[26] Williamson A, Hancock G. The geology and mineral potential of Papua New Guinea. In: Williamson A, Hancock G, editors. Compiled by Corbett G. Papua New Guinea: Department of Mining, 2005.Search in Google Scholar
[27] Sheppard S, Cranfield LC. Geological framework and mineralization of Papua New Guinea — an update. Papua New Guinea: Mineral Resources Authority; 2012.Search in Google Scholar
[28] Dow DB, Smit JAJ, Page RW. Wau, Papua New Guinea: Bureau of Mineral Resources, Geology and Geophysics, 1:250,000 Geological Series Explanatory Notes; 1974. https://cir.nii.ac.jp/crid/1130000796084158848.Search in Google Scholar
[29] Noakes L. Geological Report on the Upper Bitoi Black Cat Area; Geological Section, Territory of New Guinea, Report 529; 1940. p. 36. (unpublished; MRA Archive Number 38/003).Search in Google Scholar
[30] Mackay N. Geological report on a reconnaissance of the Markham and Upper Ramu drainage systems, New Guinea. Canberra: Australian Government Publishing Service; 1955. https://ecat.ga.gov.au/geonetwork/srv/api/records/a05f7892-ff5d-7506-e044-00144fdd4fa6.Search in Google Scholar
[31] Rebek RJ. Edie Creek and Wau gold lodes. M Economic Geology of Australia and Papua New Guinea. 1975;1:867–72.Search in Google Scholar
[32] Saroa D, Tsiperau CU, Abiari I, Bokuik AL, Kuman N, Lahan MM, et al. A preliminary re-examination of the geology of the Wau–Bulolo area. Mineral Resources Authority, Papua New Guinea. Technical Note. 2012.Search in Google Scholar
[33] Page RW. Geochronology of igneous and metamorphic rocks in the New Guinea highlands. Canberra: Australian Government Publishing Service. 1976.Search in Google Scholar
[34] Bodorkos S, Sheppard S, Saroa D, Tsiperau CU, Sircombe KN. New SHRIMP U-Pb zircon ages from the Wau-Bulolo region, Papua New Guinea. Geoscience Australia. Record 2013/25. Mineral Resources Authority, Papua New Guinea. Technical Note; 2013.10.11636/Record.2013.025Search in Google Scholar
[35] Bain JHC, Davies HL, Hohnen PD, Ryburn RJ, Smith IE, Grainger R, et al. Geology of Papua New Guinea – Geological Map 1:1,000,000 scale. Australia: Bureau of Mineral Resources; 1972.Search in Google Scholar
[36] Goto A, Horie T, Ohba T, Fujimaki H. XRF analysis of major and trace elements for wide compositional ranges from silicate rocks to carbonate rocks using low dilution glass beads. Japanese Mag Mineral Petrol Sci. 2002;33:162–73. 10.2465/gkk.31.162 (in Japanese with English abstract).Search in Google Scholar
[37] Le Maitre RW, Streckeisen A, Zanettin B, Le Bas MJ, Bonin B, Bateman P, et al. Igneous rocks. A Classification and Glossary of Terms: Recommendations of the International Union of Geological Sciences Subcommission on the Systematics of Igneous Rocks. Cambridge: Cambridge University Press; 2002.10.1017/CBO9780511535581Search in Google Scholar
[38] Middlemost EAK. Naming materials in the magma/igneous rock system. Earth-Sci Rev. 1994;37(3–4):215–24. 10.1016/0012-8252(94)90029-9.Search in Google Scholar
[39] Peccerillo A, Taylor SR. Geochemistry of eocene calc-alkaline volcanic rocks from the Kastamonu area, Northern Turkey. Contrib Mineral Petrol. 1976;58(1):63–81. 10.1007/BF00384745/METRICS.Search in Google Scholar
[40] Shand SJ. Eruptive rocks: genesis, composition, classification and relation to ore deposits, with a chapter on meteorites. 3rd edn. London: Thomas Murby & Co; 1947.Search in Google Scholar
[41] Frost BR, Barnes CG, Collins WJ, Arculus RJ, Ellis DJ, Frost CD. A geochemical classification for granitic rocks. J Petrol. 2001;42(11):2033–48. 10.1093/PETROLOGY/42.11.2033.Search in Google Scholar
[42] Frost BR, Frost CD. A Geochemical Classification for Feldspathic Igneous Rocks. J Petrol. 2008;49(11):1955–69. 10.1093/PETROLOGY/EGN054.Search in Google Scholar
[43] Le Bas MJ, Le Maitre RW, Woolley AR. The construction of the Total Alkali-Silica chemical classification of volcanic rocks. Mineral Petrol. 1992;46(1):1–22. 10.1007/BF01160698/METRICS.Search in Google Scholar
[44] Leake BE, Woolley AR, Arps CE, Birch WD, Gilbert MC, Grice JD, et al. Nomenclature of Amphiboles; Report of the subcommittee on amphiboles of the international mineralogical association commission on new minerals and mineral names. Mineral Mag. 1997;61(405):295–310. 10.1180/MINMAG.1997.061.405.13.Search in Google Scholar
[45] Ridolfi F. Amp-TB2: An Updated Model for Calcic Amphibole Thermobarometry. Minerals. 2021;11(3):324. 10.3390/MIN11030324.Search in Google Scholar
[46] Deer WA, Howie RA, Zussman J. An Introduction to the Rock-Forming Minerals. London: Mineralogical Society of Great Britain and Ireland; 2013. 10.1180/DHZ.Search in Google Scholar
[47] Speer JA. Micas in igneous rocks. Rev Mineral Geochem. 1984;13(1):299–356.10.1515/9781501508820-013Search in Google Scholar
[48] Patiño Douce AE. What do experiments tell us about the relative contributions of crust and mantle to the origin of granitic magmas. Geol Soc Spec Publ. 1999;168:55–75. 10.1144/GSL.SP.1999.168.01.05.Search in Google Scholar
[49] Whalen JB, Hildebrand RS. Trace element discrimination of arc, slab failure, and A-type granitic rocks. Lithos. 2019;348:105179. 10.1016/J.LITHOS.2019.105179.Search in Google Scholar
[50] Wortel MJR, Spakman W. Structure and dynamics of subducted lithosphere in the Mediterranean region. Proc K Ned Akad Wet. 1992;95(3):325–47.Search in Google Scholar
[51] Davies JH, von Blanckenburg F. Slab breakoff: A model of lithosphere detachment and its test in the magmatism and deformation of collisional orogens. Earth Planet Sci Lett. 1995;129(1–4):85–102. 10.1016/0012-821X(94)00237-S.Search in Google Scholar
[52] Hildebrand RS, Bowring SA. Crustal recycling by slab failure. Geology. 1999;27(1):11–4. https://pubs.geoscienceworld.org/gsa/geology/article-abstract/27/1/11/206949/Crustal-recycling-by-slab-failure.10.1130/0091-7613(1999)027<0011:CRBSF>2.3.CO;2Search in Google Scholar
[53] Garzanti E, Radeff G, Malusà MG. Slab breakoff: A critical appraisal of a geological theory as applied in space and time. Earth-Sci Rev. 2018;177:303–19. 10.1016/J.EARSCIREV.2017.11.012.Search in Google Scholar
[54] Collins WJ, Huang HQ, Jiang X. Water-fluxed crustal melting produces Cordilleran batholiths. Geology. 2016;44(2):143–6. 10.1130/G37398.1.Search in Google Scholar
[55] Maas R, Nicholls IA, Legg C. Igneous and metamorphic enclaves in the S-type Deddick Granodiorite, Lachlan Fold Belt, SE Australia: Petrographic, geochemical and Nd-Sr isotopic evidence for crustal melting and magma mixing. J Petrol. 1997;38(7):815–41. 10.1093/PETROJ/38.7.815.Search in Google Scholar
[56] Fershtater GB, Borodina NS. Petrology of autoliths in granitic rocks. Int Geol Rev. 1977;19(4):458–68. 10.1080/00206817709471040.Search in Google Scholar
[57] Shellnutt JG, Jahn BM, Dostal J. Elemental and Sr–Nd isotope geochemistry of microgranular enclaves from peralkaline A-type granitic plutons of the Emeishan large igneous province, SW China. Lithos. 2010;119(1–2):34–46. 10.1016/J.LITHOS.2010.07.011.Search in Google Scholar
[58] Esna-Ashari A, Hassanzadeh J, Valizadeh MV. Geochemistry of microgranular enclaves in Aligoodarz Jurassic arc Pluton, Western Iran: Implications for enclave generation by rapid crystallization of cogenetic granitoid magma. Mineral Petrol. 2011;101(3–4):195–216. 10.1007/S00710-011-0149-7/FIGURES/10.Search in Google Scholar
[59] Vernon RH. Microgranitoid enclaves in granites—globules of hybrid magma quenched in a plutonic environment. Nature. 1984;309(5967):438–9. 10.1038/309438a0.Search in Google Scholar
[60] Vernon RH. Crystallization and hybridism in microgranitoid enclave magmas: Microstructural evidence. J Geophys Res Solid Earth. 1990;95(B11):17849–59. 10.1029/JB095IB11P17849.Search in Google Scholar
[61] Wiebe RA, Smith D, Sturm M, King EM, Seckler MS. Enclaves in the cadillac mountain granite (Coastal Maine): Samples of hybrid magma from the base of the chamber. J Petrol. 1997;38(3):393–423. 10.1093/PETROJ/38.3.393.Search in Google Scholar
[62] Barbarin B. Mafic magmatic enclaves and mafic rocks associated with some granitoids of the central Sierra Nevada batholith, California: nature, origin, and relations with the hosts. Lithos. 2005;80(1–4):155–77. 10.1016/J.LITHOS.2004.05.010.Search in Google Scholar
[63] Altherr R, Henjes-Kunst F, Langer C, Otto J. Interaction between crustal-derived felsic and mantle-derived mafic magmas in the Oberkirch pluton (European Variscides, Schwarzwald, Germany). Contrib Mineral Petrol. 1999;137(4):304–22. 10.1007/S004100050552/METRICS.Search in Google Scholar
[64] Furman T, Graham D. Erosion of lithospheric mantle beneath the East African Rift system: geochemical evidence from the Kivu volcanic province. Lithos. 1999;48(1–4):237–62. 10.1016/S0024-4937(99)00031-6.Search in Google Scholar
[65] Condamine P, Médard E. Experimental melting of phlogopite-bearing mantle at 1 GPa: Implications for potassic magmatism. Earth Planet Sci Lett. 2014;397:80–92. 10.1016/J.EPSL.2014.04.027.Search in Google Scholar
[66] Kepezhinskas P, Defant MJ, Drummond MS. Progressive enrichment of island arc mantle by melt-peridotite interaction inferred from Kamchatka xenoliths. Geochim Cosmochim Acta. 1996;60(7):1217–29. 10.1016/0016-7037(96)00001-4.Search in Google Scholar
[67] Brandon AD, Becker H, Carlson RW, Shirey SB. Isotopic constraints on time scales and mechanisms of slab material transport in the mantle wedge: evidence from the Simcoe mantle xenoliths, Washington, USA. Chem Geol. 1999;160(4):387–407. 10.1016/S0009-2541(99)00109-6.Search in Google Scholar
[68] Zanetti A, Mazzucchelli M, Rivalenti G, Vannucci R. The Finero phlogopite-peridotite massif: An example of subduction-related metasomatism. Contrib Mineral Petrol. 1999;134(2–3):107–22. 10.1007/S004100050472/METRICS.Search in Google Scholar
[69] Mallik A, Dasgupta R, Tsuno K, Nelson J. Effects of water, depth and temperature on partial melting of mantle-wedge fluxed by hydrous sediment-melt in subduction zones. Geochim Cosmochim Acta. 2016;195:226–43. 10.1016/J.GCA.2016.08.018.Search in Google Scholar
[70] Schaarschmidt A, Klemd R, Regelous M, Voudouris PC, Melfos V, Haase KM. The formation of shoshonitic magma and its relationship to porphyry-type mineralisation: the Maronia pluton in NE Greece. Lithos. 2021;380:105911. 10.1016/j.lithos.2020.105911.Search in Google Scholar
[71] Hanor JS. Barite–Celestine Geochemistry and Environments of Formation. Rev Mineral Geochem. 2000;40(1):193–275. 10.2138/RMG.2000.40.4.Search in Google Scholar
[72] Freeburn R, Bouilhol P, Maunder B, Magni V, van Hunen J. Numerical models of the magmatic processes induced by slab breakoff. Earth Planet Sci Lett. 2017;478:203–13. 10.1016/J.EPSL.2017.09.008.Search in Google Scholar
[73] Hodkiewicz PF, Groves DI, Davidson GJ, Weinberg RF, Hagemann SG. Influence of structural setting on sulphur isotopes in Archean orogenic gold deposits, Eastern Goldfields Province, Yilgarn, Western Australia. Miner Deposita. 2009;44(2):129–50. 10.1007/S00126-008-0211-5/FIGURES/11.Search in Google Scholar
[74] Sun SS, McDonough WF. Chemical and isotopic systematics of oceanic basalts: Implications for mantle composition and processes. Geol Soc Spec Publ. 1989;42(1):313–45. 10.1144/GSL.SP.1989.042.01.19.Search in Google Scholar
© 2023 the author(s), published by De Gruyter
This work is licensed under the Creative Commons Attribution 4.0 International License.
Articles in the same Issue
- Regular Articles
- Diagenesis and evolution of deep tight reservoirs: A case study of the fourth member of Shahejie Formation (cg: 50.4-42 Ma) in Bozhong Sag
- Petrography and mineralogy of the Oligocene flysch in Ionian Zone, Albania: Implications for the evolution of sediment provenance and paleoenvironment
- Biostratigraphy of the Late Campanian–Maastrichtian of the Duwi Basin, Red Sea, Egypt
- Structural deformation and its implication for hydrocarbon accumulation in the Wuxia fault belt, northwestern Junggar basin, China
- Carbonate texture identification using multi-layer perceptron neural network
- Metallogenic model of the Hongqiling Cu–Ni sulfide intrusions, Central Asian Orogenic Belt: Insight from long-period magnetotellurics
- Assessments of recent Global Geopotential Models based on GPS/levelling and gravity data along coastal zones of Egypt
- Accuracy assessment and improvement of SRTM, ASTER, FABDEM, and MERIT DEMs by polynomial and optimization algorithm: A case study (Khuzestan Province, Iran)
- Uncertainty assessment of 3D geological models based on spatial diffusion and merging model
- Evaluation of dynamic behavior of varved clays from the Warsaw ice-dammed lake, Poland
- Impact of AMSU-A and MHS radiances assimilation on Typhoon Megi (2016) forecasting
- Contribution to the building of a weather information service for solar panel cleaning operations at Diass plant (Senegal, Western Sahel)
- Measuring spatiotemporal accessibility to healthcare with multimodal transport modes in the dynamic traffic environment
- Mathematical model for conversion of groundwater flow from confined to unconfined aquifers with power law processes
- NSP variation on SWAT with high-resolution data: A case study
- Reconstruction of paleoglacial equilibrium-line altitudes during the Last Glacial Maximum in the Diancang Massif, Northwest Yunnan Province, China
- A prediction model for Xiangyang Neolithic sites based on a random forest algorithm
- Determining the long-term impact area of coastal thermal discharge based on a harmonic model of sea surface temperature
- Origin of block accumulations based on the near-surface geophysics
- Investigating the limestone quarries as geoheritage sites: Case of Mardin ancient quarry
- Population genetics and pedigree geography of Trionychia japonica in the four mountains of Henan Province and the Taihang Mountains
- Performance audit evaluation of marine development projects based on SPA and BP neural network model
- Study on the Early Cretaceous fluvial-desert sedimentary paleogeography in the Northwest of Ordos Basin
- Detecting window line using an improved stacked hourglass network based on new real-world building façade dataset
- Automated identification and mapping of geological folds in cross sections
- Silicate and carbonate mixed shelf formation and its controlling factors, a case study from the Cambrian Canglangpu formation in Sichuan basin, China
- Ground penetrating radar and magnetic gradient distribution approach for subsurface investigation of solution pipes in post-glacial settings
- Research on pore structures of fine-grained carbonate reservoirs and their influence on waterflood development
- Risk assessment of rain-induced debris flow in the lower reaches of Yajiang River based on GIS and CF coupling models
- Multifractal analysis of temporal and spatial characteristics of earthquakes in Eurasian seismic belt
- Surface deformation and damage of 2022 (M 6.8) Luding earthquake in China and its tectonic implications
- Differential analysis of landscape patterns of land cover products in tropical marine climate zones – A case study in Malaysia
- DEM-based analysis of tectonic geomorphologic characteristics and tectonic activity intensity of the Dabanghe River Basin in South China Karst
- Distribution, pollution levels, and health risk assessment of heavy metals in groundwater in the main pepper production area of China
- Study on soil quality effect of reconstructing by Pisha sandstone and sand soil
- Understanding the characteristics of loess strata and quaternary climate changes in Luochuan, Shaanxi Province, China, through core analysis
- Dynamic variation of groundwater level and its influencing factors in typical oasis irrigated areas in Northwest China
- Creating digital maps for geotechnical characteristics of soil based on GIS technology and remote sensing
- Changes in the course of constant loading consolidation in soil with modeled granulometric composition contaminated with petroleum substances
- Correlation between the deformation of mineral crystal structures and fault activity: A case study of the Yingxiu-Beichuan fault and the Milin fault
- Cognitive characteristics of the Qiang religious culture and its influencing factors in Southwest China
- Spatiotemporal variation characteristics analysis of infrastructure iron stock in China based on nighttime light data
- Interpretation of aeromagnetic and remote sensing data of Auchi and Idah sheets of the Benin-arm Anambra basin: Implication of mineral resources
- Building element recognition with MTL-AINet considering view perspectives
- Characteristics of the present crustal deformation in the Tibetan Plateau and its relationship with strong earthquakes
- Influence of fractures in tight sandstone oil reservoir on hydrocarbon accumulation: A case study of Yanchang Formation in southeastern Ordos Basin
- Nutrient assessment and land reclamation in the Loess hills and Gulch region in the context of gully control
- Handling imbalanced data in supervised machine learning for lithological mapping using remote sensing and airborne geophysical data
- Spatial variation of soil nutrients and evaluation of cultivated land quality based on field scale
- Lignin analysis of sediments from around 2,000 to 1,000 years ago (Jiulong River estuary, southeast China)
- Assessing OpenStreetMap roads fitness-for-use for disaster risk assessment in developing countries: The case of Burundi
- Transforming text into knowledge graph: Extracting and structuring information from spatial development plans
- A symmetrical exponential model of soil temperature in temperate steppe regions of China
- A landslide susceptibility assessment method based on auto-encoder improved deep belief network
- Numerical simulation analysis of ecological monitoring of small reservoir dam based on maximum entropy algorithm
- Morphometry of the cold-climate Bory Stobrawskie Dune Field (SW Poland): Evidence for multi-phase Lateglacial aeolian activity within the European Sand Belt
- Adopting a new approach for finding missing people using GIS techniques: A case study in Saudi Arabia’s desert area
- Geological earthquake simulations generated by kinematic heterogeneous energy-based method: Self-arrested ruptures and asperity criterion
- Semi-automated classification of layered rock slopes using digital elevation model and geological map
- Geochemical characteristics of arc fractionated I-type granitoids of eastern Tak Batholith, Thailand
- Lithology classification of igneous rocks using C-band and L-band dual-polarization SAR data
- Analysis of artificial intelligence approaches to predict the wall deflection induced by deep excavation
- Evaluation of the current in situ stress in the middle Permian Maokou Formation in the Longnüsi area of the central Sichuan Basin, China
- Utilizing microresistivity image logs to recognize conglomeratic channel architectural elements of Baikouquan Formation in slope of Mahu Sag
- Resistivity cutoff of low-resistivity and low-contrast pays in sandstone reservoirs from conventional well logs: A case of Paleogene Enping Formation in A-Oilfield, Pearl River Mouth Basin, South China Sea
- Examining the evacuation routes of the sister village program by using the ant colony optimization algorithm
- Spatial objects classification using machine learning and spatial walk algorithm
- Study on the stabilization mechanism of aeolian sandy soil formation by adding a natural soft rock
- Bump feature detection of the road surface based on the Bi-LSTM
- The origin and evolution of the ore-forming fluids at the Manondo-Choma gold prospect, Kirk range, southern Malawi
- A retrieval model of surface geochemistry composition based on remotely sensed data
- Exploring the spatial dynamics of cultural facilities based on multi-source data: A case study of Nanjing’s art institutions
- Study of pore-throat structure characteristics and fluid mobility of Chang 7 tight sandstone reservoir in Jiyuan area, Ordos Basin
- Study of fracturing fluid re-discharge based on percolation experiments and sampling tests – An example of Fuling shale gas Jiangdong block, China
- Impacts of marine cloud brightening scheme on climatic extremes in the Tibetan Plateau
- Ecological protection on the West Coast of Taiwan Strait under economic zone construction: A case study of land use in Yueqing
- The time-dependent deformation and damage constitutive model of rock based on dynamic disturbance tests
- Evaluation of spatial form of rural ecological landscape and vulnerability of water ecological environment based on analytic hierarchy process
- Fingerprint of magma mixture in the leucogranites: Spectroscopic and petrochemical approach, Kalebalta-Central Anatolia, Türkiye
- Principles of self-calibration and visual effects for digital camera distortion
- UAV-based doline mapping in Brazilian karst: A cave heritage protection reconnaissance
- Evaluation and low carbon ecological urban–rural planning and construction based on energy planning mechanism
- Modified non-local means: A novel denoising approach to process gravity field data
- A novel travel route planning method based on an ant colony optimization algorithm
- Effect of time-variant NDVI on landside susceptibility: A case study in Quang Ngai province, Vietnam
- Regional tectonic uplift indicated by geomorphological parameters in the Bahe River Basin, central China
- Computer information technology-based green excavation of tunnels in complex strata and technical decision of deformation control
- Spatial evolution of coastal environmental enterprises: An exploration of driving factors in Jiangsu Province
- A comparative assessment and geospatial simulation of three hydrological models in urban basins
- Aquaculture industry under the blue transformation in Jiangsu, China: Structure evolution and spatial agglomeration
- Quantitative and qualitative interpretation of community partitions by map overlaying and calculating the distribution of related geographical features
- Numerical investigation of gravity-grouted soil-nail pullout capacity in sand
- Analysis of heavy pollution weather in Shenyang City and numerical simulation of main pollutants
- Road cut slope stability analysis for static and dynamic (pseudo-static analysis) loading conditions
- Forest biomass assessment combining field inventorying and remote sensing data
- Late Jurassic Haobugao granites from the southern Great Xing’an Range, NE China: Implications for postcollision extension of the Mongol–Okhotsk Ocean
- Petrogenesis of the Sukadana Basalt based on petrology and whole rock geochemistry, Lampung, Indonesia: Geodynamic significances
- Numerical study on the group wall effect of nodular diaphragm wall foundation in high-rise buildings
- Water resources utilization and tourism environment assessment based on water footprint
- Geochemical evaluation of the carbonaceous shale associated with the Permian Mikambeni Formation of the Tuli Basin for potential gas generation, South Africa
- Detection and characterization of lineaments using gravity data in the south-west Cameroon zone: Hydrogeological implications
- Study on spatial pattern of tourism landscape resources in county cities of Yangtze River Economic Belt
- The effect of weathering on drillability of dolomites
- Noise masking of near-surface scattering (heterogeneities) on subsurface seismic reflectivity
- Query optimization-oriented lateral expansion method of distributed geological borehole database
- Petrogenesis of the Morobe Granodiorite and their shoshonitic mafic microgranular enclaves in Maramuni arc, Papua New Guinea
- Environmental health risk assessment of urban water sources based on fuzzy set theory
- Spatial distribution of urban basic education resources in Shanghai: Accessibility and supply-demand matching evaluation
- Spatiotemporal changes in land use and residential satisfaction in the Huai River-Gaoyou Lake Rim area
- Walkaway vertical seismic profiling first-arrival traveltime tomography with velocity structure constraints
- Study on the evaluation system and risk factor traceability of receiving water body
- Predicting copper-polymetallic deposits in Kalatag using the weight of evidence model and novel data sources
- Temporal dynamics of green urban areas in Romania. A comparison between spatial and statistical data
- Passenger flow forecast of tourist attraction based on MACBL in LBS big data environment
- Varying particle size selectivity of soil erosion along a cultivated catena
- Relationship between annual soil erosion and surface runoff in Wadi Hanifa sub-basins
- Influence of nappe structure on the Carboniferous volcanic reservoir in the middle of the Hongche Fault Zone, Junggar Basin, China
- Dynamic analysis of MSE wall subjected to surface vibration loading
- Pre-collisional architecture of the European distal margin: Inferences from the high-pressure continental units of central Corsica (France)
- The interrelation of natural diversity with tourism in Kosovo
- Assessment of geosites as a basis for geotourism development: A case study of the Toplica District, Serbia
- IG-YOLOv5-based underwater biological recognition and detection for marine protection
- Monitoring drought dynamics using remote sensing-based combined drought index in Ergene Basin, Türkiye
- Review Articles
- The actual state of the geodetic and cartographic resources and legislation in Poland
- Evaluation studies of the new mining projects
- Comparison and significance of grain size parameters of the Menyuan loess calculated using different methods
- Scientometric analysis of flood forecasting for Asia region and discussion on machine learning methods
- Rainfall-induced transportation embankment failure: A review
- Rapid Communication
- Branch fault discovered in Tangshan fault zone on the Kaiping-Guye boundary, North China
- Technical Note
- Introducing an intelligent multi-level retrieval method for mineral resource potential evaluation result data
- Erratum
- Erratum to “Forest cover assessment using remote-sensing techniques in Crete Island, Greece”
- Addendum
- The relationship between heat flow and seismicity in global tectonically active zones
- Commentary
- Improved entropy weight methods and their comparisons in evaluating the high-quality development of Qinghai, China
- Special Issue: Geoethics 2022 - Part II
- Loess and geotourism potential of the Braničevo District (NE Serbia): From overexploitation to paleoclimate interpretation