
Stability studies of titanium–carboxylate complexes: A multi-method computational approach
-
Abdalazeem A. Omar


Abstract
Understanding the stability of metal–ligand complexes is essential for advancing applications in environmental, industrial, and biomedical chemistry; however, titanium coordination systems remain underexplored, particularly with organic ligands of chelating properties. This study aims to evaluate and compare the stability constants of titanium (iv) complexes with propanoic acid and citric acid to better understand their coordination behavior. A multi-method computational approach was employed, integrating point-wise calculation, half-integral, linear plot, and least-squares methods to enhance the accuracy and reproducibility of proton–ligand dissociation constants (pK a) and metal–ligand formation constants (log K). The titanium–propanoate complexes showed moderate stability (log K 2 = 4.7564, log K 3 = 4.1015), influenced by steric and electronic factors, while the titanium–citrate complex exhibited a higher binding affinity (log K 1 = 7.8351), indicating strong chelation capacity. The consistency across all computational and graphical methods validates the reliability of the findings. These insights provide a dependable framework for evaluating titanium-based coordination compounds and may guide future research into their potential applications in environmental and biomedical fields.
1 Introduction
The interaction between metal ions and ligands is a key factor in coordination chemistry, affecting various biological, industrial, and environmental fields [1]. Researchers can predict the behavior of metal–ligand systems by examining stepwise stability constants, allowing them to design new coordination compounds with tailored properties and investigate the intricate interactions that control chemical reactivity and stability [2]. Among metal ions, titanium is particularly significant due to its unique properties, such as high reactivity, low toxicity, and exceptional strength-to-weight ratio [3]. Titanium (iv) is known to exhibit a strong preference for octahedral coordination, often forming stable complexes with oxygen-donor ligands such as carboxylic acids [4]. The structure and stability of these complexes are influenced by the denticity and spatial arrangement of the ligands [5].
This study investigates the proton–ligand dissociation constants (pK a) and metal–ligand stability constants (log K) of titanium (iv) complexes with propanoic and citric acids through a combination of computational techniques based on formation functions (n A, n⁻, and pL). The chosen ligands represent structurally distinct coordination modes: propanoic acid, as a monocarboxylic acid, serves as a model for simple monodentate binding, whereas citric acid, with three carboxyl groups and a hydroxyl function, acts as a multidentate ligand capable of forming stable chelate rings [5]. This comparative analysis highlights the influence of ligand structure, donor atom availability, and acidity on the stoichiometry and stability of titanium complexes [6].
The determination of stability constants often involves spectroscopic and potentiometric methods, with potentiometric measurement of hydrogen ion concentration being among the most accurate and reliable. Bjerrum’s method, as employed by Calvin and Wilson, uses pH changes during titration to calculate stability constants, making it a cornerstone of such studies [7,8]. By applying multiple computational approaches, including pointwise, half-integral, and linear plot methods, the study ensures cross-validated and robust evaluation of complex formation constants [9,10]. The results not only address a critical gap in titanium coordination chemistry but also provide a practical framework for extending such methodologies to other metal–ligand systems relevant to catalysis, environmental remediation, and bioinorganic applications.
2 Materials and methods
2.1 Chemicals and materials
All chemicals utilized in this study were of analytical grade and were used without additional purification. The solutions employed in the experiments were prepared using double-distilled water.
2.2 Instrumentation
All measurements were performed using a Denver Instrument Ultra Basic pH/mV meter (GmbH Gottingen, Germany) with a combined electrode maintained at a controlled temperature of 29 ± 1°C. The pH meter has a sensitivity of 0.01 units and is capable of measuring pH levels within a range of 0.00–14.00, offering precision to the nearest 0.01. The instrument was warmed up for 30 min prior to titration, and it was calibrated before each titration session using buffer solutions of pH 4 and 10. The electrode was rinsed in distilled water and dried with tissue paper between readings. Measurements were recorded only after the instrument displayed a stable reading for at least 1 min.
2.3 Preparation of stock solutions and experimental conditions
Three sets of solutions were prepared, each with a total volume (V) of 200 cm3, were prepared for titration against a free carbonate sodium hydroxide solution.
The pH changes of each were monitored with successive alkali additions. These measurements were used to calculate the values of the formation functions n A, n −, pL, where n A represents the average number of proton associated with ligand, n − denotes the average number of ligands attached to the metal ion, and pL is the free ligand exponential function [11].
To evaluate the proton–ligand and metal–ligand complexation equilibria, three distinct titration systems were prepared and analyzed:
(Free acid, A): A solution containing only acid (HNO3) in distilled water, which was used to determine the dissociation constants of the acid alone.
(Acid + Ligand): A mixture of acid and ligand (citric acid or propanoic acid), which was used to study the ligand deprotonation behavior.
(Acid + Ligand + Metal): A ternary solution containing acid, ligand, and titanium (iv) ions, which was used to assess the formation of titanium complexes.
The concentrations and experimental conditions used for these systems are summarized in Table 1.
Experimental conditions used in the potentiometric titration of titanium–ligand systems
| Parameter | Value | Description |
|---|---|---|
| N 0 | 0.522 M | Titrant concentration NaOH |
| E 0 | 5 × 10⁻3 M | Free acid concentration |
| T cl | 1.5 × 10⁻3 M | Ligand mixture concentration |
| T cm | 5 × 10⁻4 M | Metal–ligand mixture concentration |
| V 0 | 200 cm3 | Total solution volume |
| u 0 | 5 × 10⁻3 | Ionic strength |
| T | 22.5°C | Temperature |
All solutions were diluted to a final volume of 200 cm3, following the addition of 1 cm3 of potassium nitrate to maintain a constant ionic strength. The titrations were conducted in a 250 cm3 beaker equipped with a magnetic stirring bar to ensure the mixing of the solution.
The observed pH was plotted against the volume of alkali added, revealing distinct trends. The acid curve (A) served as a baseline, while the ligand curve (A + L) lies below it, indicating ligand dissociation in the reaction medium. The metal complex curve (A + L + M) lies below the ligand curve, signifying complex formation.
A MATLAB program was developed to plot the volume of alkali versus pH of the three solution sets (acid, acid + ligand, and acid + ligand + metal ion) and to determine the alkali volume needed to bring each solution to the same pH. Calvin and Wilson demonstrated that pH measurements during alkali titration of ligands, in the presence or absence of metal ions, can be used to calculate the formation functions n A, n −, and pL.
An Excel program was used to calculate the values of formation functions according to equations (1)–(3) [12]:
where y is the number of dissociable protons, N
0 is the concentration of alkali, E
0 is the concentration of free acid,
The average ligand to metal ratio or metal–ligand formation number at varying pH levels was calculated according to Irving and Rossotti using the following equation:
where V 2 is the volume of alkali added to the acid to reach a specific pH, V 3 is the volume of alkali added to the acid–ligand mixture to reach the same pH, T cm is the total concentration of the metal ion, and other parameters follow the same definitions as in equation (1).
A free ligand exponent function (pL) was calculated using the following equation (3): [13,14,15]
where V 3 is the volume of alkali required to bring the solution of the complex to the same pH in the titration curve.
3 Results and discussion
3.1 Proton ligand stability constant (dissociation constant)
3.1.1 Pointwise calculation method (propanoic acid and citric acid)
The calculation of the free ligand exponent function (pL) for metal complexes requires prior knowledge of the proton–ligand stability constant obtained experimentally [16] (equation (3)). Using Excel, the values of n A at various pH levels (B) were derived from the titration curves of the acid and the ligand. For propanoic acid, the ligand titration curve diverges notably from the free acid titration curve at pH 2.9, as highlighted in Table 2. Calculations were performed using the pointwise calculation method, and the value of the dissociation constant was taken as an average of pK a1 in the range of n A = 0.2–0.8, that is pK a1 = 4.8259. The intersection point between the ligand and complex titration curves occurs at approximately pH 2.4, indicating the onset of complex formation.
Determination of the proton–ligand stability constant pK a1 for propanoic acid
| B* | v 1 | v 2 | n A |
|
pK a1 |
|---|---|---|---|---|---|
| 2.9 | 1.1833 | 1.2000 | 0.9708 | 1.5223 | 4.4223 |
| 3.0 | 1.2500 | 1.2714 | 0.9626 | 1.4111 | 4.4111 |
| 3.1 | 1.3074 | 1.3300 | 0.9606 | 1.3866 | 4.4866 |
| 3.2 | 1.3444 | 1.3800 | 0.9379 | 1.1789 | 4.3789 |
| 3.3 | 1.3815 | 1.4188 | 0.9349 | 1.1574 | 4.4574 |
| 3.4 | 1.4056 | 1.4500 | 0.9225 | 1.0760 | 4.4760 |
| 3.5 | 1.4169 | 1.4813 | 0.8877 | 0.8977 | 4.3977 |
| 3.6 | 1.4281 | 1.5078 | 0.8610 | 0.7919 | 4.3919 |
| 3.7 | 1.4393 | 1.5275 | 0.8462 | 0.7404 | 4.4404 |
| 3.8 | 1.4506 | 1.5471 | 0.8317 | 0.6939 | 4.4939 |
| 3.9 | 1.4618 | 1.5567 | 0.8345 | 0.7026 | 4.6026 |
| 4.0 | 1.4730 | 1.5863 | 0.8024 | 0.6087 | 4.6087 |
| 4.1 | 1.4843 | 1.6071 | 0.7859 | 0.5647 | 4.6647 |
| 4.2 | 1.4955 | 1.6310 | 0.7637 | 0.5096 | 4.7096 |
| 4.3 | 1.5011 | 1.6548 | 0.7320 | 0.4364 | 4.7364 |
| 4.4 | 1.5028 | 1.6786 | 0.6935 | 0.3546 | 4.7546 |
| 4.5 | 1.5046 | 1.7029 | 0.6543 | 0.2770 | 4.7770 |
| 4.6 | 1.5063 | 1.7314 | 0.6075 | 0.1898 | 4.7898 |
| 4.7 | 1.5081 | 1.7600 | 0.5608 | 0.1062 | 4.8062 |
| 4.8 | 1.5098 | 1.7886 | 0.5139 | 0.0242 | 4.8242 |
| 4.9 | 1.5116 | 1.8172 | 0.4672 | −0.0571 | 4.8429 |
| 5.0 | 1.5134 | 1.8457 | 0.4206 | −0.1390 | 4.8610 |
| 5.1 | 1.5151 | 1.8743 | 0.3737 | −0.2242 | 4.8758 |
| 5.2 | 1.5169 | 1.9019 | 0.3288 | −0.3100 | 4.8900 |
| 5.4 | 1.5204 | 1.9404 | 0.2678 | −0.4369 | 4.9631 |
| 5.5 | 1.5221 | 1.9596 | 0.2373 | −0.5071 | 4.9929 |
*B is the pH-meter reading, and V 1 and V 2 are the volumes of the alkali employed to bring the solutions of acid, acid + ligand, and acid + ligand + metal ion, respectively, to the same pH value.
Citric acid, a triprotic (tribasic) ligand, displays a titration curve distinctly separated from the free acid curve at pH = 2.5 (Table 3), indicating ligand dissociation in the medium as illustrated in Figure 1.
Determination of pK a1 values of citric acid using the pointwise method
| B | n A |
|
pK a1 | pH | n A |
|
pK a1 |
|---|---|---|---|---|---|---|---|
| 2.5 | 2.8833 | 0.8789 | 3.3789 | 3.1 | 2.5201 | 0.0349 | 3.1349 |
| 2.6 | 2.8426 | 0.7287 | 3.3287 | 3.2 | 2.4525 | −0.0828 | 3.1172 |
| 2.7 | 2.7587 | 0.4975 | 3.1975 | 3.3 | 2.3850 | −0.2034 | 3.0966 |
| 2.8 | 2.6978 | 0.3635 | 3.1635 | 3.4 | 2.3429 | −0.2825 | 3.1175 |
| 2.9 | 2.6370 | 0.2443 | 3.1443 | 3.5 | 2.2838 | −0.4021 | 3.0979 |
| 3.0 | 2.5772 | 0.1353 | 3.1353 | 3.6 | 2.2164 | −0.5587 | 3.0413 |
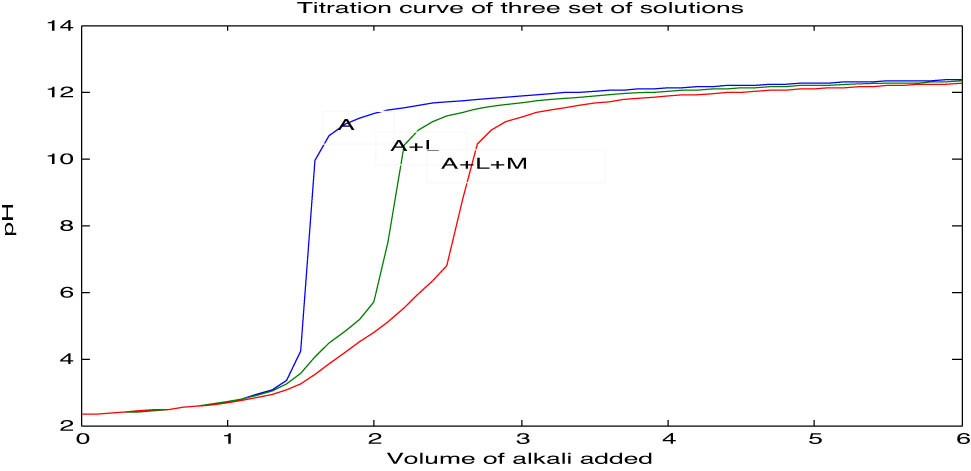
Titration curve of the three sets of solutions: A – free acid (HNO3), L – ligand (citric acid), and M –metal ion (titanium chloride).
The n A values range from 0.4384 to 2.8833 due to the triprotic nature of the ligand. The dissociation constants (pK a1, pK a2, pK a3) were calculated as averages in the following n A ranges [17]:
| Parameter | Range of n A | Calculated pK a |
|---|---|---|
| pK a1 | 0.2–0.8 | 3.1459 |
| pK a2 | 1.2–1.8 | 4.8270 |
| pK a3 | 2.2–2.8 | 8.3813 |
These values confirm the stepwise dissociation behavior of citric acid in solution. These values are summarized in Tables 3–5.
Determination of pK a2 values of citric acid using the pointwise method
| B | n A |
|
pKa2 | pH | n A |
|
pK a2 |
|---|---|---|---|---|---|---|---|
| 4.3 | 1.8275 | 0.5389 | 4.8389 | 5.1 | 1.4364 | −0.1865 | 4.9135 |
| 4.4 | 1.7757 | 0.4191 | 4.8191 | 5.2 | 1.3943 | −0.2722 | 4.9278 |
| 4.5 | 1.7241 | 0.3105 | 4.8105 | 5.3 | 1.3483 | −0.3633 | 4.9367 |
| 4.6 | 1.6715 | 0.2086 | 4.8086 | 5.4 | 1.3023 | −0.4624 | 4.9376 |
| 4.7 | 1.6178 | 0.1120 | 4.8120 | 5.5 | 1.2564 | −0.5867 | 4.9133 |
| 4.8 | 1.5641 | 0.0330 | 4.8330 | 5.6 | 1.2057 | −0.7365 | 4.8635 |
| 4.9 | 1.5190 | −0.0388 | 4.8612 | 5.7 | 1.1550 | −0.9340 | 4.7660 |
| 5.0 | 1.4777 | −0.1111 | 4.8889 | 5.8 | 1.1043 | −1.2472 | 4.5528 |
Determination of pK a3 values of citric acid using the pointwise method
| B | n A |
|
pK a3 | pH | n A |
|
pK a3 |
|---|---|---|---|---|---|---|---|
| 6.4 | 0.8159 | 0.6465 | 7.0465 | 8.3 | 0.5630 | 0.1101 | 8.4101 |
| 6.5 | 0.7714 | 0.5279 | 7.0279 | 8.4 | 0.5592 | 0.1034 | 8.5034 |
| 6.6 | 0.7362 | 0.4458 | 7.0458 | 8.5 | 0.5556 | 0.0970 | 8.5970 |
| 6.7 | 0.7012 | 0.3705 | 7.0705 | 8.6 | 0.5518 | 0.0903 | 8.6903 |
| 6.8 | 0.6662 | 0.3001 | 7.1001 | 8.7 | 0.5480 | 0.0836 | 8.7836 |
| 6.9 | 0.6314 | 0.2337 | 7.1337 | 8.8 | 0.5442 | 0.0769 | 8.8769 |
| 7.0 | 0.6119 | 0.1977 | 7.1977 | 8.9 | 0.5405 | 0.0706 | 8.9706 |
| 7.1 | 0.6082 | 0.1910 | 7.2910 | 9.0 | 0.5367 | 0.0639 | 9.0639 |
| 7.2 | 0.6044 | 0.1841 | 7.3841 | 9.1 | 0.5329 | 0.0573 | 9.1573 |
| 7.3 | 0.6006 | 0.1772 | 7.4772 | 9.2 | 0.5291 | 0.0506 | 9.2506 |
| 7.4 | 0.5968 | 0.1703 | 7.5703 | 9.3 | 0.5223 | 0.0388 | 9.3388 |
| 7.5 | 0.5932 | 0.1638 | 7.6638 | 9.4 | 0.5107 | 0.0186 | 9.4186 |
| 7.6 | 0.5895 | 0.1572 | 7.7572 | 9.5 | 0.4990 | −0.0017 | 9.4983 |
| 7.7 | 0.5855 | 0.1501 | 7.8501 | 9.6 | 0.4874 | −0.0219 | 9.5781 |
| 7.8 | 0.5819 | 0.1436 | 7.9436 | 9.7 | 0.4757 | −0.0422 | 9.6578 |
| 7.9 | 0.5781 | 0.1368 | 8.0368 | 9.8 | 0.4641 | −0.0625 | 9.7375 |
| 8.0 | 0.5743 | 0.1300 | 8.1300 | 9.9 | 0.4524 | −0.0829 | 9.8171 |
| 8.1 | 0.5705 | 0.1233 | 8.2233 | 10.0 | 0.4408 | −0.1033 | 9.8967 |
| 8.2 | 0.5669 | 0.1168 | 8.3168 | 10.1 | 0.4292 | −0.1237 | 9.9763 |
The first pK a of citric acid (3.1459) is lower than that of propanoic acid (4.8259), indicating that citric acid is more acidic in its first dissociation step.
In summary, citric acid, with its triprotic nature and lower pK a values, proves to be highly versatile for buffering and complexation applications [18]. Its stepwise dissociation over a broad pH range offers significant advantages in coordination chemistry and biological systems [19]. Conversely, propanoic acid, characterized by its simpler single-step dissociation, is more appropriate for applications requiring precise pH control within a narrower range [20].
3.2 Metal–ligand stability constants
3.2.1 Titanium propanoate
3.2.1.1 Pointwise calculation method
For the calculation of stability constants by this method, n − and pL were calculated at every pH using an Excel program. Figure 2 shows the intersection of the complex titration curve with the ligand titration curve at pH 2.4, indicating the onset of significant metal–ligand interactions, where partial deprotonation of the ligand enables coordination with titanium ions. The n − values ranging from 1.0835 to 2.8135 suggest the progressive formation of ML2 and ML3 species, with increasing ligand binding as coordination sites are utilized. The stability constants from Tables 5 and 6 (log K 2 = 4.7564 and log K 3 = 4.1015) align with expected trends. To enhance the robustness of the results, a statistical analysis of the pointwise data was conducted. The mean and standard deviation were calculated from the individual log K values at each titration point. The calculated stability constants were
log K 2 = 4.682 ± 0.125
log K 3 = 3.925 ± 0.766
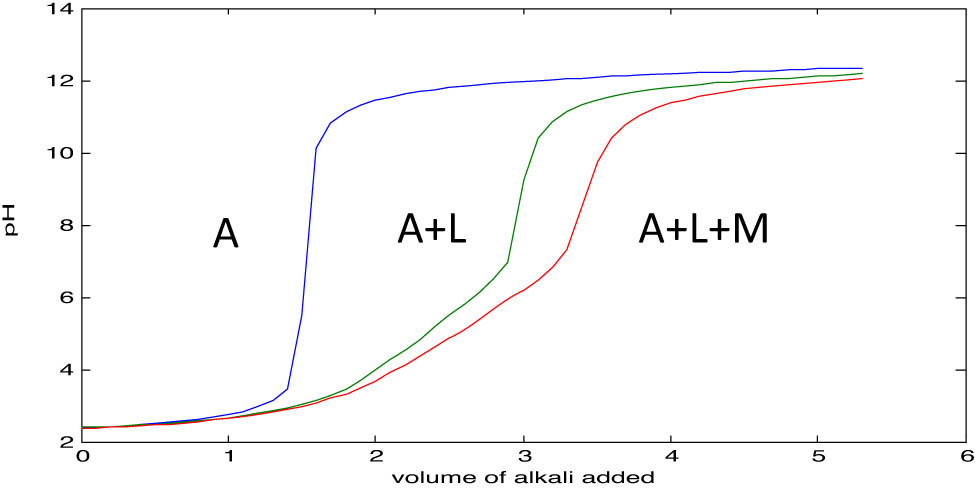
Titration curves for the three solution sets: free acid (HNO3), ligand–metal complex (propanoic acid), and metal ion (titanium chloride).
Determination of log K 2 values of titanium propanoate using the pointwise method
| V 2 | V 3 | n − | pL |
|
log K 2 |
|---|---|---|---|---|---|
| 0.6200 | 0.8500 | 1.1875 | 5.2731 | −0.6369 | 4.6362 |
| 0.8200 | 1.0600 | 1.2030 | 5.1779 | −0.5938 | 4.5841 |
| 0.9827 | 1.2143 | 1.2019 | 5.0788 | −0.5968 | 4.4820 |
| 1.1000 | 1.3445 | 1.2815 | 4.9998 | −0.4070 | 4.5928 |
| 1.2000 | 1.4455 | 1.3645 | 4.9228 | −0.2415 | 4.6814 |
| 1.2714 | 1.5250 | 1.4331 | 4.8433 | −0.1170 | 4.7263 |
| 1.3300 | 1.5875 | 1.4610 | 4.7533 | −0.0679 | 4.6854 |
| 1.3800 | 1.6333 | 1.5071 | 4.6692 | 0.0124 | 4.6816 |
| 1.4188 | 1.6750 | 1.5338 | 4.5803 | 0.0587 | 4.6391 |
| 1.4500 | 1.7105 | 1.6014 | 4.5050 | 0.1786 | 4.6836 |
| 1.4813 | 1.7368 | 1.6963 | 4.4406 | 0.3603 | 4.8008 |
| 1.5078 | 1.7632 | 1.8021 | 4.3837 | 0.6077 | 4.9913 |
The relatively low standard deviation for log K 2 indicates high precision in determining the stability of the 1:2 complex. In contrast, the higher standard deviation for log K 3 reflects greater variability, which is consistent with known challenges in evaluating higher-order complexes. These include reduced thermodynamic favorability, increased steric hindrance, and greater sensitivity to experimental fluctuations at higher pH values [21]. The distribution of log K values was assessed for normality using visual inspection, and no significant outliers were removed, as residual differences did not exceed ±2 standard units. This reinforces confidence in the calculated values. Additionally, the close agreement between pointwise, half-integral, linear plot, and least-squares methods supports the reliability and reproducibility of the overall findings.
The volume difference (V 3−V 2) highlights proton displacement during complexation, supporting stoichiometric findings [11]. The results are displayed in Tables 6 and 7.
Determination of Log K 3 values of titanium propanoate using the pointwise method
| V 2 | V 3 | n − | pL |
|
log K 3 |
|---|---|---|---|---|---|
| 1.5567 | 1.8314 | 2.0627 | 4.2195 | −1.1746 | 3.0449 |
| 1.5863 | 1.8510 | 2.1494 | 4.1760 | −0.7554 | 3.4206 |
| 1.6071 | 1.8706 | 2.2306 | 4.2196 | −0.5234 | 3.6962 |
| 1.6310 | 1.8902 | 2.3229 | 4.1926 | −0.3216 | 3.8710 |
| 1.6548 | 1.9125 | 2.5137 | 4.2574 | 0.0238 | 4.2812 |
| 1.6786 | 1.9375 | 2.8135 | 4.5987 | 0.6396 | 5.2383 |
3.2.1.2 Half-integral method
Using the half-integral method, stability constants were determined from the complex formation curve (Figure 3) at n − = 1.5 and n − = 2.5, yielding log K 2 = 4.655 ± 0.0025 and log K 3 = 4.251 ± 0.145, respectively. These uncertainties were quantified by propagating the pH measurement error (±0.01) through the local slope of the complexation curve, thus incorporating the influence of experimental parameters such as ligand concentration and titration accuracy. The markedly lower uncertainty in log K 2 reflects a well-defined coordination step, while the higher variability in log K 3 is expected due to the weaker and more sensitive nature of third-step complexation. The close agreement with values obtained through the point-wise method confirms the internal consistency and reliability of the data. Minor differences may stem from experimental fluctuations or the inherent approximation of the half-integral approach. Further validation using the linear plot method enhances the credibility and robustness of the reported stability constants.
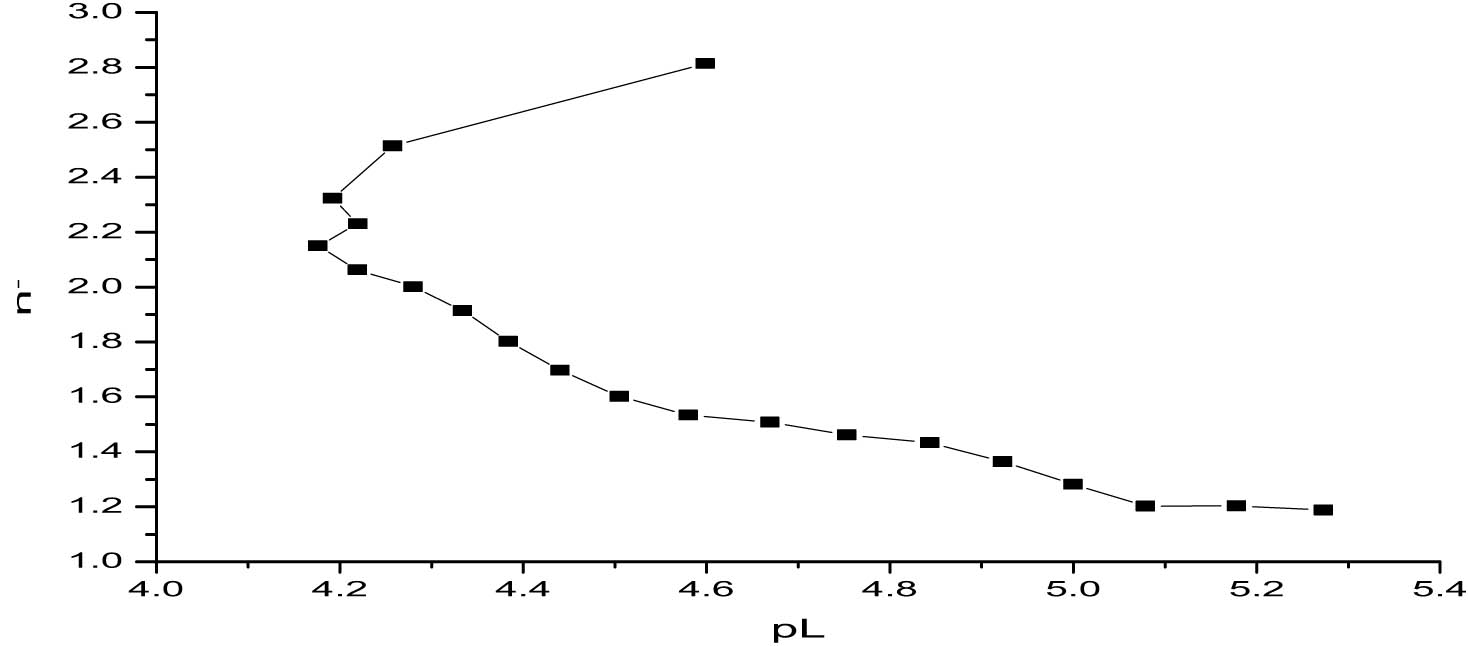
Determination of log K 2 and log K 3 values of titanium propanoate using the half-integral method.
3.2.1.3 Linear plot method
The linear plot method provides a systematic approach to determining stability constants by plotting log(n − − 1)/(2 − n −) and log(n − − 2)/(3 − n −) against the corresponding pL values [15]. This method directly reflects the relationship between ligand concentration and the complex formation, offering visual and numerical validation of the stability constants. The derived values, log K 2 = 4.655 and log K 3 = 4.251, align closely with the results from the pointwise and half-integral methods, underscoring consistency and methodological reliability.
The straight-line nature of the plots, evident in Figures 4 and 5, confirms the stepwise formation of ML2 and ML3 complexes. The slopes and intercepts of these plots provide insights into the equilibrium dynamics of the system. For instance, the relatively small difference between log K 2 and log K 3 suggests that while the second ligand binds strongly, the third ligand encounters increasing steric hindrance or electrostatic repulsion, reducing the favorability of complexation.
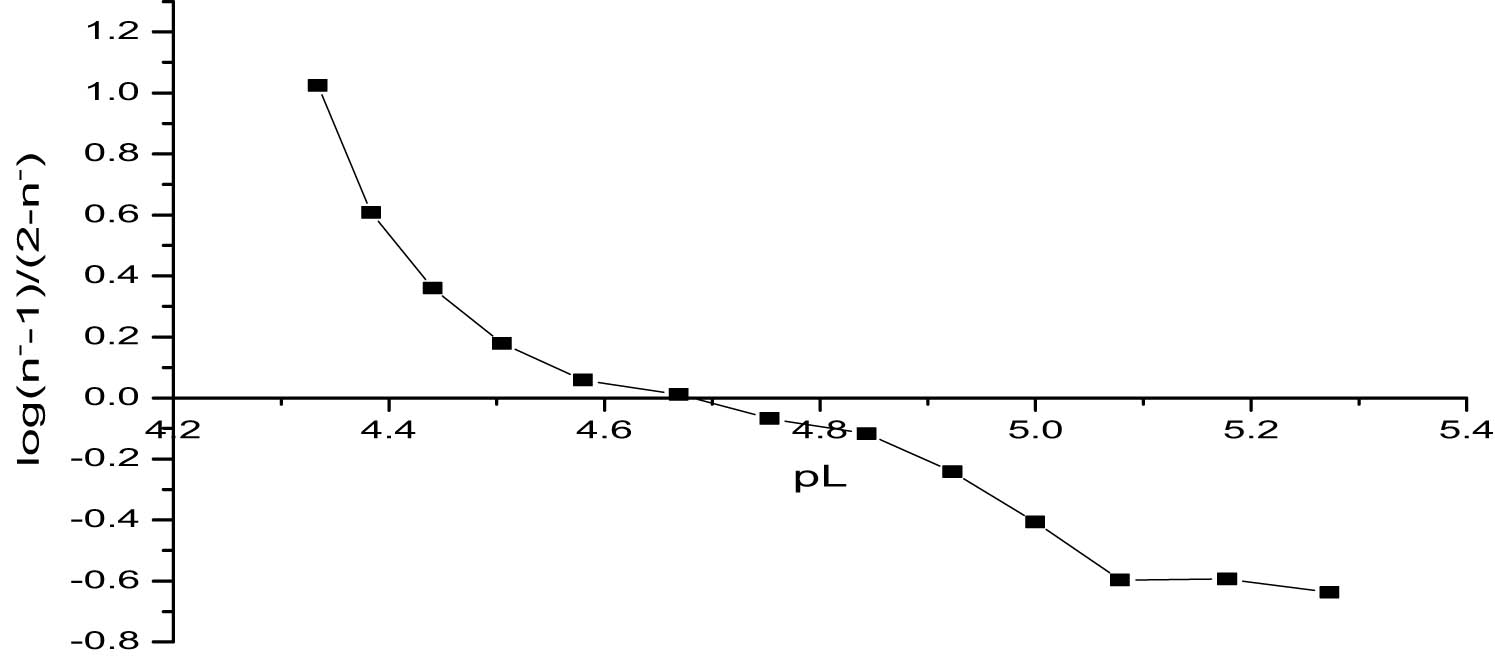
Determination of log K 2 values of titanium propanoate using the linear plot method.
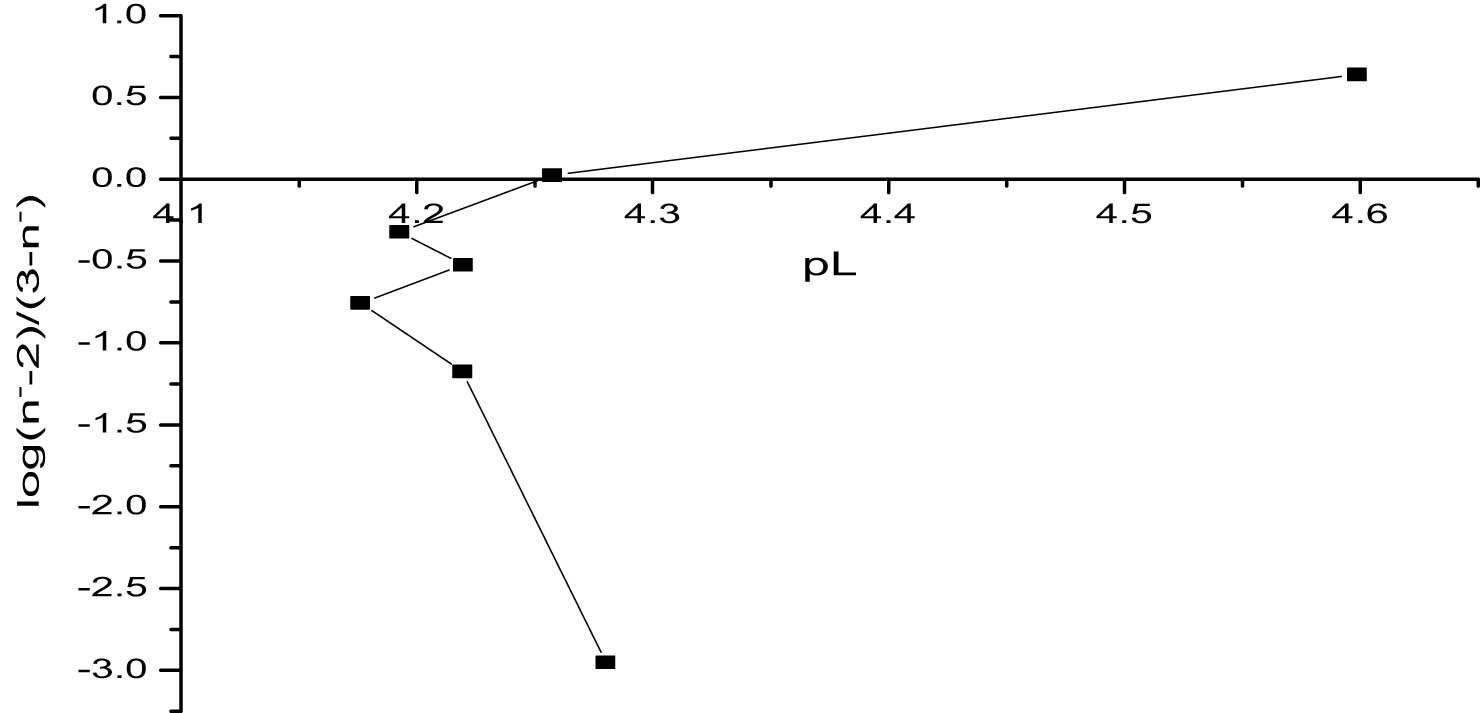
Determination of log K 3 values of titanium propanoate using the linear plot method.
3.2.1.4 Least-squares method
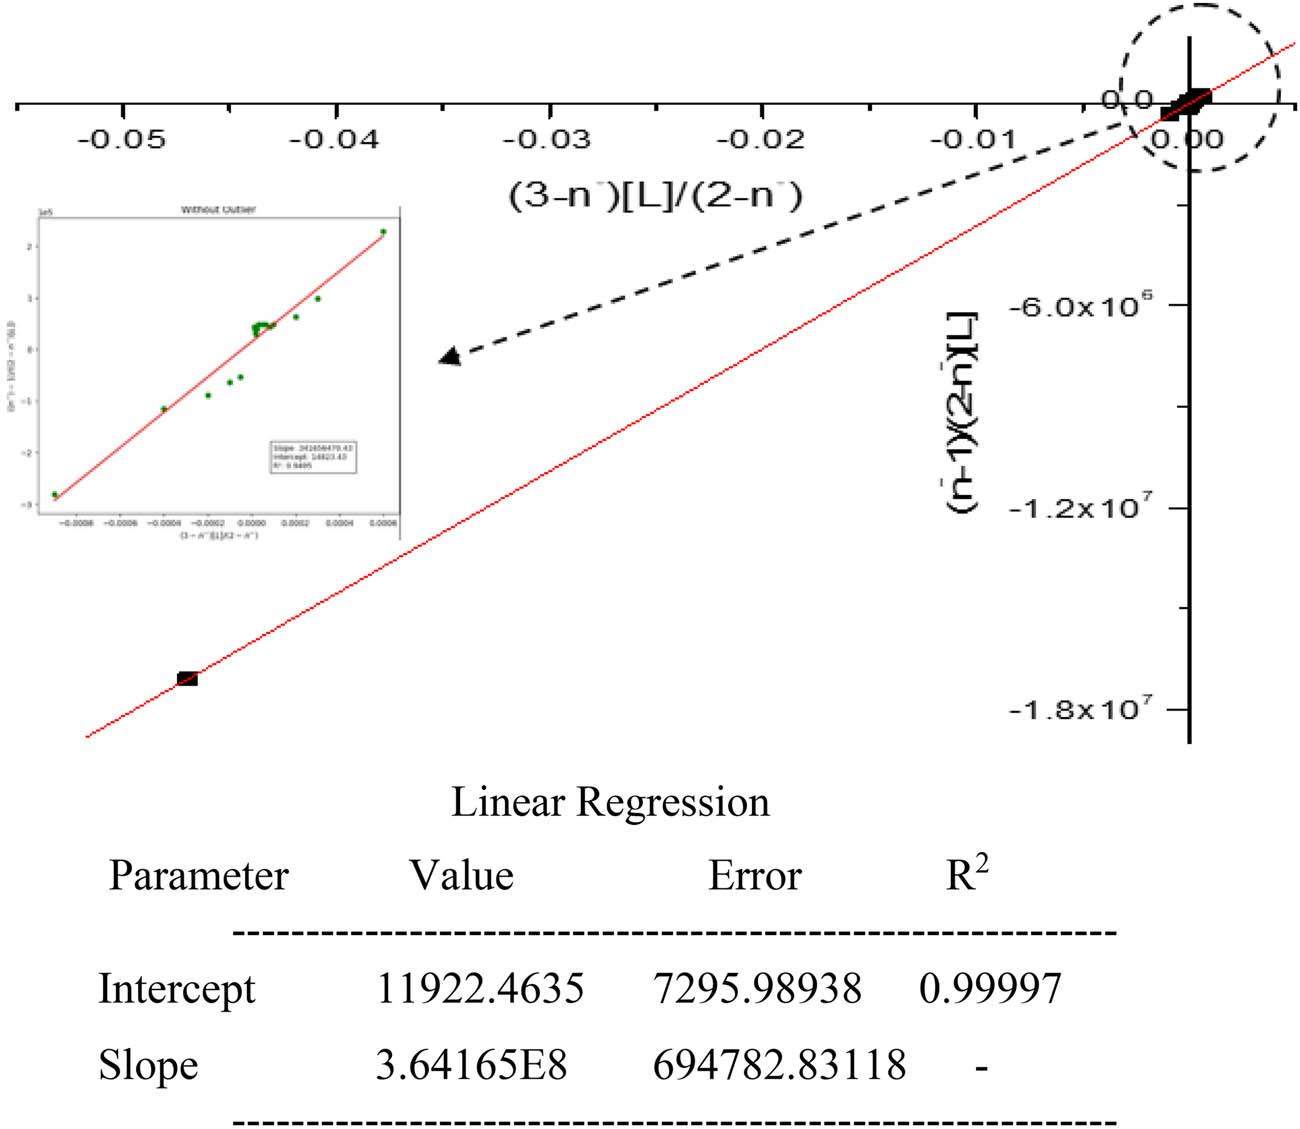
The least-squares method was employed for the estimation of K 2 and K 3 (1:2 and 1:3 titanium ligand complex species). The method utilizes the linear equation of Rossotti and Rossotti equation (4), where the y-intercept directly gives K 3 and the slope provides K 2 K 3 [22] as follows:
Further division by the product K 2 K 3 yields the x-intercept −1/K 2 and slope 1/K 2 K 3, providing a consistency check for the derived constants [15]. Equation (4) becomes
The regression results presented in Table 8, along with Figures 6 and 7, demonstrate a strong linear relationship with an R 2 value of 0.99997, indicating an excellent fit to the experimental data. Such a high coefficient of determination confirms the reliability of the model, suggesting minimal deviation between observed and calculated values.
Determination of log K 2 and log K 3 values for titanium propanoate using the least-squares method
| pL | n − | [L] |
|
|
|---|---|---|---|---|
| 5.2731 | 1.1875 | 5.3 × 10⁻⁶ | 1.2 × 10⁻⁵ | 43273.7427 |
| 5.1779 | 1.2030 | 6.6 × 10⁻⁶ | 1.5 × 10⁻⁵ | 38379.4056 |
| 5.0788 | 1.2019 | 8.3 × 10⁻⁶ | 1.9 × 10⁻⁵ | 30339.0368 |
| 4.9998 | 1.2815 | 1.0 × 10⁻⁵ | 2.4 × 10⁻⁵ | 39155.6176 |
| 4.9228 | 1.3645 | 1.2 × 10⁻⁵ | 3.1 × 10⁻⁵ | 48014.1694 |
| 4.8433 | 1.4331 | 1.4 × 10⁻⁵ | 4.0 × 10⁻⁵ | 53250.2639 |
| 4.7533 | 1.4610 | 1.8 × 10⁻⁵ | 5.0 × 10⁻⁵ | 48467.1681 |
| 4.6692 | 1.5071 | 2.1 × 10⁻⁵ | 6.5 × 10⁻⁵ | 48040.9190 |
| 4.5803 | 1.5338 | 2.6 × 10⁻⁵ | 8.3 × 10⁻⁵ | 43560.2481 |
| 4.5050 | 1.6014 | 3.1 × 10⁻⁵ | 0.0001 | 48261.3917 |
| 4.4406 | 1.6963 | 3.6 × 10⁻⁵ | 0.0002 | 63217.6627 |
| 4.3837 | 1.8021 | 4.1 × 10⁻⁵ | 0.0003 | 98024.2553 |
| 4.3340 | 1.9137 | 4.6 × 10⁻⁵ | 0.0006 | 228575.0338 |
| 4.2800 | 2.0011 | 5.2 × 10⁻⁵ | −0.0469 | −17084838.08 |
| 4.2195 | 2.0627 | 6.0 × 10⁻⁵ | −0.0009 | −280901.229 |
| 4.1760 | 2.1494 | 6.7 × 10⁻⁵ | −0.0004 | −115394.9119 |
| 4.2196 | 2.2306 | 6.0 × 10⁻⁵ | −0.0002 | −88498.5412 |
| 4.1926 | 2.3229 | 6.4 × 10⁻⁵ | −0.0001 | −63837.9119 |
| 4.2574 | 2.5137 | 5.5 × 10⁻⁵ | −5.2 × 10⁻⁵ | −53301.5501 |
| 4.5987 | 2.8135 | 2.5 × 10⁻⁵ | −5.8 × 10⁻⁶ | −88487.5877 |
| 5.2731 | 1.1875 | 5.3 × 10⁻⁶ | 1.2 × 10⁻⁵ | 43273.7427 |
Determination of log K 2 and log K 3 values for titanium propanoate.
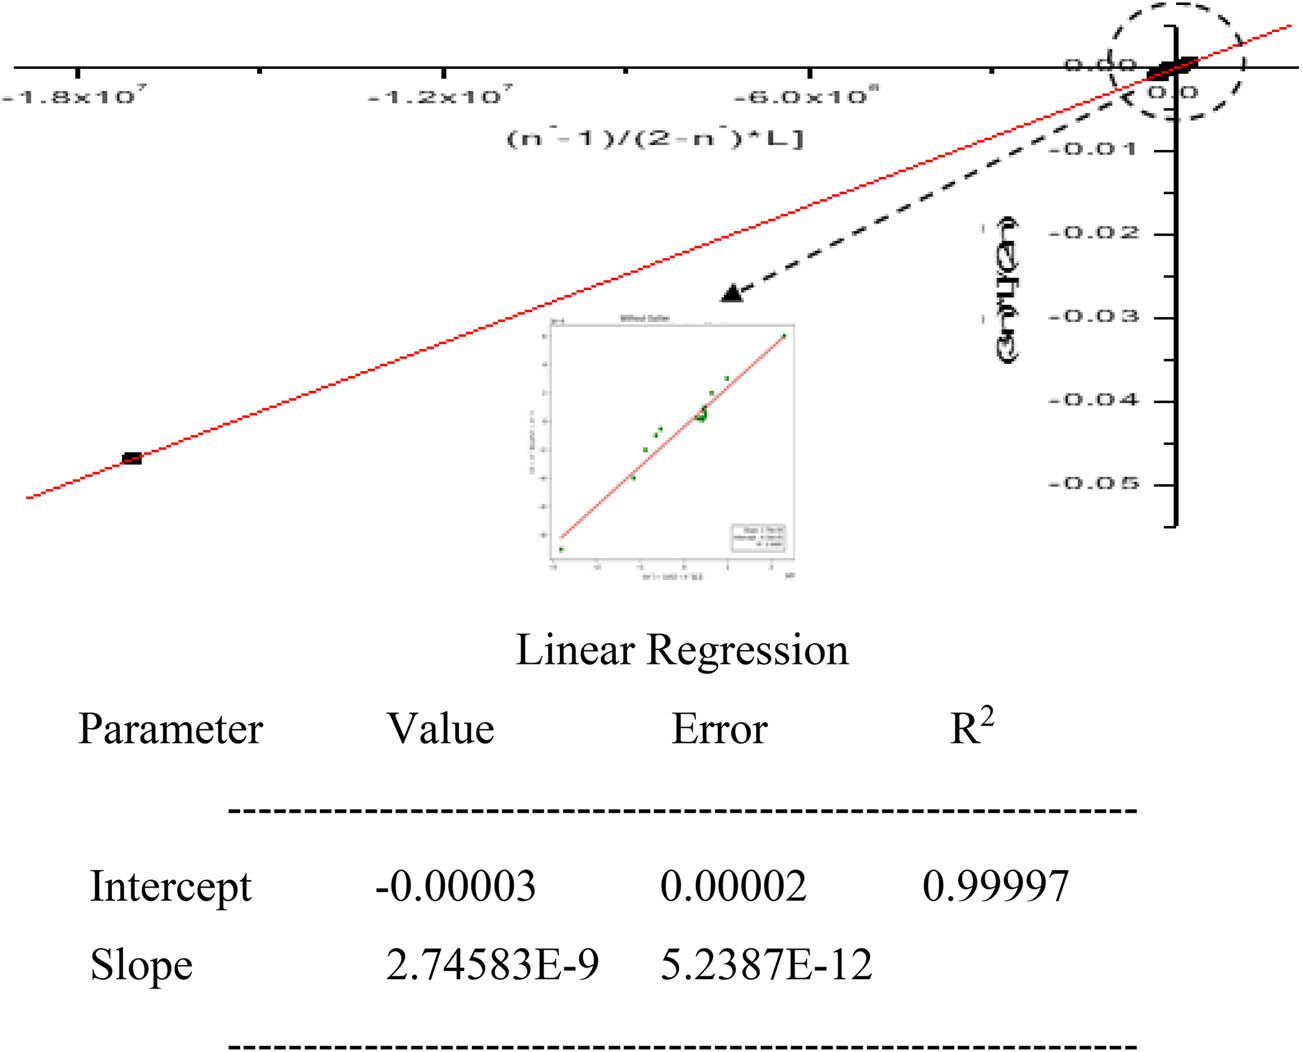
Determination of log K 2 and log K 3 values (x-intercept) for titanium propanoate.
In Figure 6, the regression analysis yields an intercept of 11,922.46 and a slope of 3.64165 × 10⁸, corresponding to the product of the second and third stepwise stability constants (K 2 K 3). Figure 7 provides an intercept of −0.00003 and a slope of 2.74583 × 10⁻⁹, further reinforcing the consistency and accuracy of the derived values.
The calculated stability constants log K 2 = 4.5257 and log K 3 = 4.0763 are in close agreement, with a difference of less than 1.8, further validating the method’s applicability for this system. This moderate stepwise variation supports the reliability of the method for evaluating 1:2 and 1:3 complex stoichiometries in this titanium–ligand system [22].
Verification using the least-squares method, alongside the linear plot approach, improves the accuracy of titanium–ligand complex characterization by minimizing manual errors and accounting for data variability. The moderate stability constants reflect consistent binding behavior, supporting the potential of titanium–propanoate complexes for use in catalysis, environmental remediation, and biomedical applications (Table 9).
Stability constants of Ti-propanoate obtained using the four methods
| Method | log K 2 | log K 3 | log K 2 + log K 3 |
|---|---|---|---|
| Pointwise method | 4.7567 | 4.1015 | 8.8582 |
| Half-integral method | 4.655 | 4.251 | 8.9060 |
| Linear plot method | 4.655 | 4.25 | 8.9050 |
| Least-squares method (y-intercept) | 4.5257 | 4.0763 | 8.6020 |
| Least-squares method (x-intercept) | 4.5229 | 4.0384 | 8.5613 |
3.2.2 Titanium citrate
3.2.2.1 Pointwise calculation method
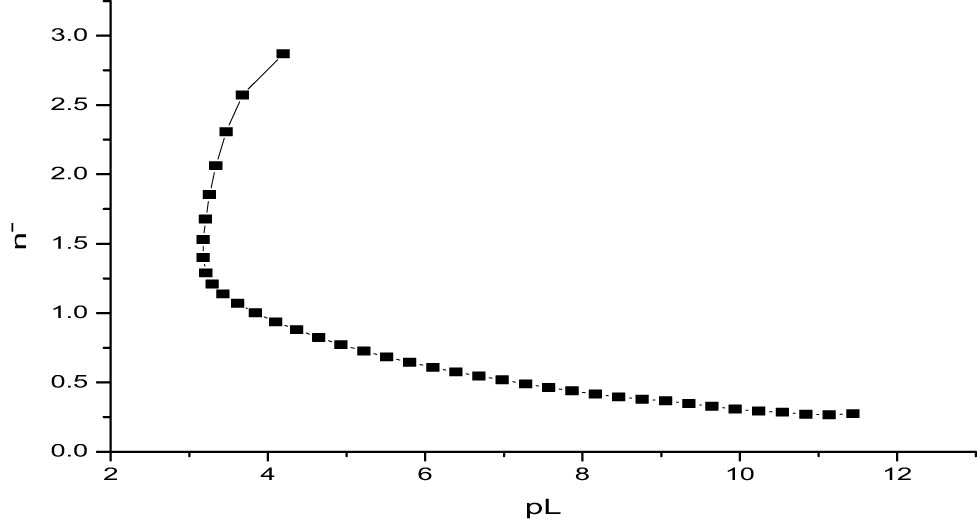
The pointwise calculation method was used to determine the values of n − and pL at various pH levels using an Excel program. The complex titration curve intersecting the ligand titration curve at pH 2.6 (Table 10, Figure 1) signals the formation of a metal–ligand complex. The n − values ranging from 0.26626 to 2.8701 suggest stepwise complexation, consistent with the tridentate nature of citrate as a ligand. These values indicate the formation of ML chelate species, with the first stability constant calculated as log K 1 = 7.8351. This high value reflects the strong binding affinity between titanium ions and citrate, likely due to the ligand’s ability to provide multiple coordination sites, stabilizing the chelate structure. The calculated log K 1 values across the titration range were used to compute a mean log K 1 = 7.727 with a standard deviation of ±1.738. This relatively high standard deviation indicates greater variability in the estimated stability constant across different pH values. Such variation is expected in systems involving multidentate ligands like citrate due to complex coordination dynamics, pH sensitivity, and potential competition among coordination sites [3]. The variability also reflects that ML-type chelates with multiple binding modes may not exhibit uniform behavior across the full pH range. Nonetheless, this observed trend aligns well with results, specifically the half-integral (log K 1 = 7.26), linear plot (log K 1 = 7.26), and Henderson–Hasselbalch (log K 1 = 7.4337) methods, which are described in the subsequent section. No data point was excluded from the analysis, as residual inspections showed no outliers beyond ±2 standard deviations. While a high standard deviation indicates some spread in the data, the convergence of results from independent computational approaches supports the validity of the experimental outcomes.
Determination of log K 1 for titanium citrate using the point-wise method
| V 2 | V 3 | n − | pL |
|
log K 2 |
|---|---|---|---|---|---|
| 0.8500 | 1.2600 | 0.2663 | 11.1369 | −0.4402 | 10.6967 |
| 1.0667 | 1.4600 | 0.2709 | 10.8381 | −0.4300 | 10.4081 |
| 1.2286 | 1.6250 | 0.2853 | 10.5407 | −0.3989 | 10.1418 |
| 1.3625 | 1.7500 | 0.2917 | 10.2420 | −0.3853 | 9.8570 |
| 1.4700 | 1.8600 | 0.3072 | 9.9444 | −0.3532 | 9.5915 |
| 1.5583 | 1.9546 | 0.3263 | 9.6481 | −0.3148 | 9.3332 |
| 1.6357 | 2.0357 | 0.3476 | 9.3517 | −0.2734 | 9.0783 |
| 1.7056 | 2.1053 | 0.3672 | 9.0551 | −0.2364 | 8.8186 |
| 1.7611 | 2.1579 | 0.3776 | 8.7569 | −0.2170 | 8.5399 |
| 1.8130 | 2.2080 | 0.3955 | 8.4600 | −0.1842 | 8.2758 |
| 1.8565 | 2.2480 | 0.4161 | 8.1635 | −0.1471 | 8.0164 |
| 1.9000 | 2.2880 | 0.4385 | 7.8674 | −0.1073 | 7.7601 |
| 1.9370 | 2.3259 | 0.4633 | 7.5717 | −0.0639 | 7.5078 |
| 1.9741 | 2.3630 | 0.4891 | 7.2762 | −0.0189 | 7.2573 |
| 2.0104 | 2.4000 | 0.5174 | 6.9813 | 0.0303 | 7.0115 |
| 2.0448 | 2.4345 | 0.5454 | 6.6863 | 0.0791 | 6.7654 |
| 2.0793 | 2.4690 | 0.5757 | 6.3919 | 0.1324 | 6.5243 |
| 2.1138 | 2.5035 | 0.6085 | 6.0980 | 0.1916 | 6.2896 |
| 2.1483 | 2.5379 | 0.6442 | 5.8049 | 0.2579 | 6.0628 |
| 2.1828 | 2.5724 | 0.6833 | 5.5129 | 0.3339 | 5.8468 |
| 2.2179 | 2.6069 | 0.7257 | 5.2222 | 0.4226 | 5.6448 |
| 2.2536 | 2.6414 | 0.7722 | 4.9336 | 0.5301 | 5.4637 |
| 2.2893 | 2.6759 | 0.8234 | 4.6484 | 0.6685 | 5.3169 |
| 2.3200 | 2.7097 | 0.8799 | 4.3690 | 0.8648 | 5.2338 |
3.2.2.2 Half-integral method
Using the half-integral method, the stability constant log K 1 was determined from the point at which n − = 0.5 on the complex formation curve (Figure 8). The resulting value, log K 1 = 7.26 ± 0.0085, was calculated by propagating the uncertainty in the pH measurement (±0.01) through the slope of the curve at the half-integral point. This approach ensures that the reported uncertainty accounts for experimental parameters such as pH resolution and ligand concentration sensitivity, as recommended for precise evaluation of stability constants. The small uncertainty reflects the high reliability of the measurement for a 1:1 complex. This value is slightly lower than that obtained via the pointwise method, which may be attributed to minor experimental variability or the inherent approximation of the half-integral technique. Nevertheless, the close agreement between methods confirms the robustness of the results. Additional validation using the linear plot method further supports the consistency and accuracy of the derived stability constants.
Determination of log K1 for titanium citrate using the half-integral method (metal–ligand titration curve).
3.2.2.3 Linear plot method:
In this approach, a plot of log n −/(1 − n −) against pL (Figure 9) confirmed the stability constant log K 1 = 7.26, as indicated by the point where the curve crosses the pL-axis. This method’s results are consistent with those of the half-integral method, supporting the calculated stability constant. The alignment of values across different methods demonstrates the robustness of the experimental setup and the analytical techniques used.
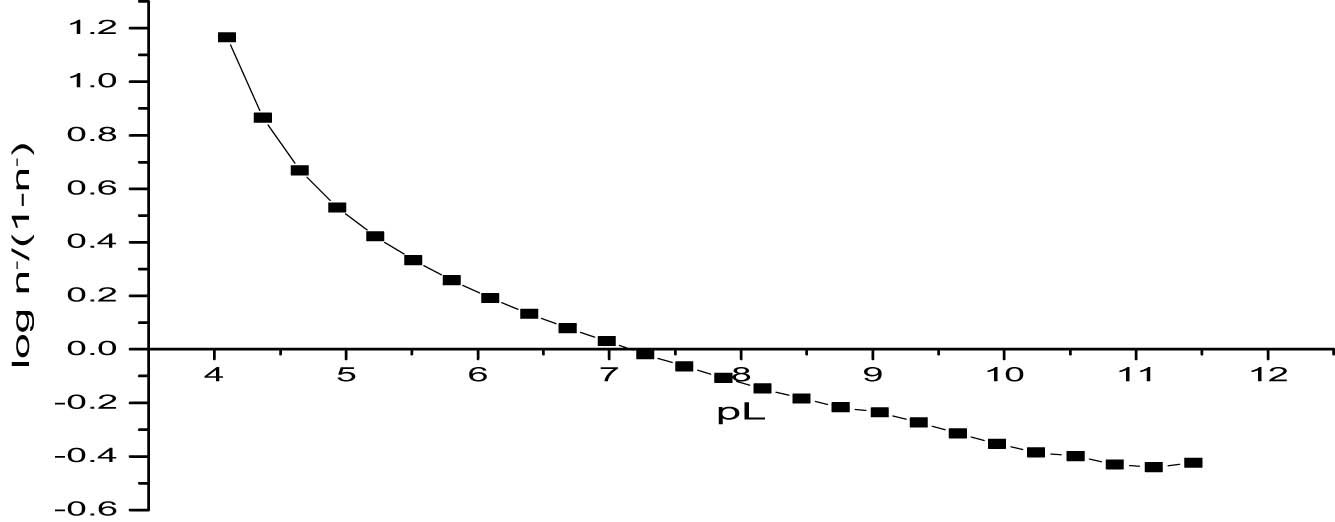
Determination of log K 1 values for titanium citrate using the linear plot method.
3.2.2.4 Henderson–Hasselbalch equation
The Henderson–Hasselbalch equation was applied to verify the stability constant further, particularly since only one complex or chelate is formed under the studied conditions. This method, commonly used for monobasic acids, proved effective for determining dissociation constants from n − and [L] data over a limited range, such as in cases involving strong complexes or low n − values. Table 11 illustrates the reliability of this approach in confirming the earlier calculated log K 1 value [8]. The ability of citrate to form a stable chelate with titanium, even under conditions of strong complexation or precipitation, supports the robustness of the findings (Table 12),
Determination of log K 1 for titanium citrate using the Henderson’s equation
| p L | [L] | n − |
|
log[L] | log K 1 |
|---|---|---|---|---|---|
| 11.1369 | 7.3 × 10⁻¹² | 0.2663 | −0.4402 | −11.1369 | 10.6967 |
| 10.8381 | 1.5 × 10⁻¹¹ | 0.2709 | −0.4300 | −10.8381 | 10.4081 |
| 10.5407 | 2.9 × 10⁻¹¹ | 0.2853 | −0.3989 | −10.5407 | 10.1418 |
| 10.2420 | 5.7 × 10⁻¹¹ | 0.2917 | −0.3853 | −10.2420 | 9.8567 |
| 9.9447 | 1.1 × 10⁻¹⁰ | 0.3072 | −0.3532 | −9.9447 | 9.5915 |
| 9.6481 | 2.2 × 10⁻¹⁰ | 0.3263 | −0.3148 | −9.6481 | 9.3332 |
| 9.3517 | 4.4 × 10⁻¹⁰ | 0.3476 | −0.2734 | −9.3517 | 9.0783 |
| 9.0551 | 8.8 × 10⁻¹⁰ | 0.3672 | −0.2364 | −9.0551 | 8.8186 |
| 8.7569 | 1.8 × 10⁻⁹ | 0.3776 | −0.2170 | −8.7569 | 8.5399 |
| 8.4600 | 3.5 × 10⁻⁹ | 0.3955 | −0.1842 | −8.4600 | 8.2758 |
| 8.1635 | 6.9 × 10⁻⁹ | 0.4161 | −0.1471 | −8.1635 | 8.0164 |
| 7.8674 | 1.4 × 10⁻⁸ | 0.4385 | −0.1073 | −7.8674 | 7.7601 |
| 7.5717 | 2.7 × 10⁻⁸ | 0.4633 | −0.0639 | −7.5717 | 7.5078 |
| 7.2762 | 5.3 × 10⁻⁸ | 0.4891 | −0.0189 | −7.2762 | 7.2573 |
| 6.9813 | 1.0 × 10⁻⁷ | 0.5174 | 0.0303 | −6.9813 | 7.0115 |
| 6.6863 | 2.1 × 10⁻⁷ | 0.5454 | 0.0791 | −6.6863 | 6.7654 |
| 6.3919 | 4.1 × 10⁻⁷ | 0.5757 | 0.1325 | −6.3919 | 6.5243 |
| 6.0980 | 8.0 × 10⁻⁷ | 0.6085 | 0.1916 | −6.0980 | 6.2896 |
| 5.8049 | 1.6 × 10⁻⁶ | 0.6442 | 0.2579 | −5.8050 | 6.0628 |
| 5.5129 | 3.1 × 10⁻⁶ | 0.6833 | 0.3339 | −5.5129 | 5.8468 |
| 5.2222 | 6.0 × 10⁻⁶ | 0.7257 | 0.4226 | −5.2222 | 5.6448 |
| 4.9336 | 1.2 × 10⁻⁵ | 0.7722 | 0.5301 | −4.9336 | 5.4637 |
| 4.6484 | 2.2 × 10⁻⁵ | 0.8234 | 0.6685 | −4.6484 | 5.3169 |
| 4.3690 | 4.3 × 10⁻⁵ | 0.8799 | 0.8648 | −4.3690 | 5.2338 |
| 4.0982 | 8.0 × 10⁻⁵ | 0.9360 | 1.1654 | −4.0982 | 5.2636 |
Stability constants of Ti-citrate obtained using the four methods
| Method | log K 1 |
|---|---|
| Pointwise method | 7.8351 |
| Half-integral method | 7.26 |
| Linear plot method | 7.26 |
| Henderson’s equation | 7.4337 |
4 Conclusion
This study successfully evaluated proton–ligand and metal–ligand stability constants for titanium complexes with propanoic and citric acids, employing multiple computational methods. The proton–ligand dissociation constants aligned with the expected pH-dependent behavior, confirming the ligands’ dissociation in the medium. For propanoic acid, the value of pK a1 = 4.8259 was consistent with those of pointwise and halfintegral methods, while for citric acid, triprotic dissociation constants (pK a1 = 3.1459, pK a2 = 4.8270, pK a3 = 8.3813) were reliably calculated.
The study of titanium-propanoate complexes identified stability constants log K 2 = 4.7564 and log K 3 = 4.1015, while titanium–citrate complexes yielded log K 1 = 7.8351. The results obtained from all methods, pointwise, half-integral, linear plot, and least squares or Henderson–Hasselbalch’s, showed good agreement, confirming the reliability and precision of these approaches.
The study highlights the contrasting coordination behavior of citric and propanoic acids with titanium(iv), with citric acid forming more stable chelates and propanoic acid offering simpler pH-dependent control. While no direct applications were tested, the stability profiles established here provide a basis for future research into potential industrial and environmental uses of titanium–ligand complexes. Moreover, the applied methodology offers a reliable framework for investigating similar metal–ligand systems.
-
Funding information: This research did not receive any specific grant from funding agencies in the public, commercial, or not-for-profit sectors.
-
Author contributions: Abdalazeem. A. Omar: conceptualization, methodology, and writing – original draft; Yasser R. M. Elmarassi: investigation and writing original draft; M. Saadawy: formal analysis and writing original draft; Abdallah Bashir Musa: Data curation and writing original draft; Nesrine M. R. Mahmoud: formal analysis, and writing– review and editing.
-
Conflict of interest: The authors declare that there is no conflict of interest.
-
Ethical approval: The conducted research is not related to either human or animal use.
-
Data availability statement: The datasets generated during and/or analyzed during the current study are available from the corresponding author on reasonable request.
References
[1] Durrani A. A Study of stability constant of co-ordination compounds. Int J Chem Stud. 2014;1(5):10–2, www.chemijournal.com.Suche in Google Scholar
[2] Parcasio Cid Andres A, Chen J, Fukuzumi K, Ip B, Cid AP. Metal coordination chemistry in the study of biological pathway and processes: A review. Int J Pharm Biol Chem Sci. 2014;3(3):36–45. www.ijpbcs.netorwww.ijpbcs.com.Suche in Google Scholar
[3] Saurabh A, Meghana CM, Singh PK, Verma PC. Titanium-based materials: Synthesis, properties, and applications. Mater Today Proc. 2022;56:412–9. https://www.sciencedirect.com/science/article/pii/S2214785322002991.10.1016/j.matpr.2022.01.268Suche in Google Scholar
[4] Covington A, Danish E. Measurement of magnesium stability constants of biologically relevant ligands by simultaneous use of pH and ion-selective electrodes. J Solut Chem. 2009;38:1449–62.10.1007/s10953-009-9459-3Suche in Google Scholar
[5] Kefalas E, Panagiotidis P, Raptopoulou C, Terzis A, Mavromoustakos T, Salifoglou A. Mononuclear titanium(iv)−citrate complexes from aqueous solutions: pH-specific synthesis and structural and spectroscopic studies in relevance to aqueous titanium(iv)−citrate speciation. Inorg Chem. 2005;44(8):2596–605.10.1021/ic049276oSuche in Google Scholar PubMed
[6] Gómez-Ruiz S, Gallego B, Zizak Z, Hey-Hawkins E, Juranic Z, Kaluđerović G. Titanium(iv) carboxylate complexes: Synthesis, structural characterization and cytotoxic activity. Polyhedron. 2010;29:354–60.10.1016/j.poly.2009.05.068Suche in Google Scholar
[7] Muthaiah S, Bhatia A, Kannan M. Stability of metal complexes. In: Srivastva AN, editor. Stability of metal complexes. Rijeka: IntechOpen; 2020. 10.5772/intechopen.90894.Suche in Google Scholar
[8] Omar A, Ali E. Titanium carboxylate complexes stability constants estimated by four graphical methods. Int J Basic Appl Sci. 2014;3(4):497.10.14419/ijbas.v3i4.3750Suche in Google Scholar
[9] Bjerrum J. Review of metal ammine formation in aqueous solution: theory of the reversible step reactions. Chem Abstr. 1941;35:6527–34.Suche in Google Scholar
[10] Maldhure *AK, Agarkar SS, Taywade RK, Wankhade RS. Metal-ligand stability constants of Co (II), Ni (II) and Cu (II) metal ion complexes with N-(5-methyl-2-hydroxyacetophenone)-N′-(2- hydroxyacetophenone) ethylenediamine. J Chem Pharm Res. 2012;4(8):3865–8.Suche in Google Scholar
[11] Zamzam TO(Al-Ahdal), Shivaji L, Jadhav DD, Kayande MJR. pH-metric study of metal-ligand stability constant of transition metal complexes with pharmacologically active ligand N-[(E)-(4-hydroxy-3-methoxyphenyl)methylene] isonicotinohydrazide. Curr Pharma Res. 2019;407:58–65. www.jcpronline.in/.Suche in Google Scholar
[12] Maru MS, Shah MK. Transition metal complexes of 2- ( substituted-1H-pyrazole-4-yl) -1H- benzo [d] imidazoles: Synthesis and characterization. J Chem Pharm Res. 2012;4(3):1638–43.Suche in Google Scholar
[13] Kumar A, Malik AK. Pointwise potentiometric studies on the complexes of Cu(II), Cd(II), Co(II), Ni(II), Pb(II) and Zn(II) with gabapentin. Eurasian J Anal Chem. 2007;2(2):1–6.Suche in Google Scholar
[14] Deosarkar S, Kalambe AB, Thakare VJ, Wanale S, Hiwase V. Potentiometric studies on electrolyte effects on complex equilibria of some substituted 5-(2-Hydroxy Phenyl) pyrazoles. Der Pharma Chem. 2011;3(6):75–83.Suche in Google Scholar
[15] Mishra AK, Mishra PM, Misra SK. Equilibrium studies on bivalent transition metal chelates with biologically active Schiff’s base of heterocyclic aldehydes. Rasayan J Chem. 2011;4(2):303–19.Suche in Google Scholar
[16] Ramteke AA, Narwade ML. Studies of stability constants of the complexes of chlorosubstituted pyrazoles and pyrazoline with Cu(II),Ni(II),Co(II) and Nd(III) metal ions in 70\% dioxane-water mixture at 0.1 m ionic strength. Arch Appl Sci Res. 2013;5(1):231–7. https://api.semanticscholar.org/CorpusID:99091681.Suche in Google Scholar
[17] Science MA, Hussain S, Farooqui M, Aurangabad C. Studies of binary complexes of metal ions with 2, 2-bipyridyl by potentiometry. Chem Sci Trans. 2015;4(1):176–80.Suche in Google Scholar
[18] Zhang S, Liu C, Su M, Zhou D, Tao Z, Wu S, et al. Development of citric acid-based biomaterials for biomedical applications. J Mater Chem B. 2024;12(45):11611–35. https://xlink.rsc.org/?DOI=D4TB01666A.10.1039/D4TB01666ASuche in Google Scholar PubMed
[19] Silva A, Kong X, Hider R. Determination of the pKa value of the hydroxyl group in the α-hydroxycarboxylates citrate, malate and lactate by 13C NMR: Implications for metal coordination in biological systems. Biometals. 2009;22:771–8.10.1007/s10534-009-9224-5Suche in Google Scholar PubMed
[20] Feng X, Xu H, Yao J, Li S, Zhu H, Ouyang P. Kinetic analysis and pH-shift control strategy for propionic acid production with Propionibacterium Freudenreichii CCTCC M207015. Appl Biochem Biotechnol. 2010;160(2):343–9. 10.1007/s12010-008-8300-6.Suche in Google Scholar PubMed
[21] Purgel M, Schuur J. First principle determination of stability constants of metal complexes by cellmetry method. Int J Quantum Chem. 2023;123(22):e27214.10.1002/qua.27214Suche in Google Scholar
[22] Gurdeep R. Advance inorganic chemistry-II. 12 edn. New York: Wiley-Interscience; 1986. p. 67.Suche in Google Scholar
© 2025 the author(s), published by De Gruyter
This work is licensed under the Creative Commons Attribution 4.0 International License.
Artikel in diesem Heft
- Research Articles
- Phytochemical investigation and evaluation of antioxidant and antidiabetic activities in aqueous extracts of Cedrus atlantica
- Influence of B4C addition on the tribological properties of bronze matrix brake pad materials
- Discovery of the bacterial HslV protease activators as lead molecules with novel mode of action
- Characterization of volatile flavor compounds of cigar with different aging conditions by headspace–gas chromatography–ion mobility spectrometry
- Effective remediation of organic pollutant using Musa acuminata peel extract-assisted iron oxide nanoparticles
- Analysis and health risk assessment of toxic elements in traditional herbal tea infusions
- Cadmium exposure in marine crabs from Jiaxing City, China: Insights into health risk assessment
- Green-synthesized silver nanoparticles of Cinnamomum zeylanicum and their biological activities
- Tetraclinis articulata (Vahl) Mast., Mentha pulegium L., and Thymus zygis L. essential oils: Chemical composition, antioxidant and antifungal properties against postharvest fungal diseases of apple, and in vitro, in vivo, and in silico investigation
- Exploration of plant alkaloids as potential inhibitors of HIV–CD4 binding: Insight into comprehensive in silico approaches
- Recovery of phenylethyl alcohol from aqueous solution by batch adsorption
- Electrochemical approach for monitoring the catalytic action of immobilized catalase
- Green synthesis of ZIF-8 for selective adsorption of dyes in water purification
- Optimization of the conditions for the preparation of povidone iodine using the response surface methodology
- A case study on the influence of soil amendment on ginger oil’s physicochemical properties, mineral contents, microbial load, and HPLC determination of its vitamin level
- Removal of antiviral favipiravir from wastewater using biochar produced from hazelnut shells
- Effect of biochar and soil amendment on bacterial community composition in the root soil and fruit of tomato under greenhouse conditions
- Bioremediation of malachite green dye using Sargassum wightii seaweed and its biological and physicochemical characterization
- Evaluation of natural compounds as folate biosynthesis inhibitors in Mycobacterium leprae using docking, ADMET analysis, and molecular dynamics simulation
- Novel insecticidal properties of bioactive zoochemicals extracted from sea urchin Salmacis virgulata
- Elevational gradients shape total phenolic content and bioactive potential of sweet marjoram (Origanum majorana L.): A comparative study across altitudinal zones
- Study on the CO2 absorption performance of deep eutectic solvents formed by superbase DBN and weak acid diethylene glycol
- Preparation and wastewater treatment performance of zeolite-modified ecological concrete
- Multifunctional chitosan nanoparticles: Zn2+ adsorption, antimicrobial activity, and promotion of aquatic health
- Comparative analysis of nutritional composition and bioactive properties of Chlorella vulgaris and Arthrospira platensis: Implications for functional foods and dietary supplements
- Growth kinetics and mechanical characterization of boride layers formed on Ti6Al4V
- Enhancement of water absorption properties of potassium polyacrylate-based hydrogels in CaCl2-rich soils using potassium di- and tri-carboxylate salts
- Electrochemical and microbiological effects of dumpsite leachates on soil and air quality
- Modeling benzene physicochemical properties using Zagreb upsilon indices
- Characterization and ecological risk assessment of toxic metals in mangrove sediments near Langen Village in Tieshan Bay of Beibu Gulf, China
- Protective effect of Helicteres isora, an efficient candidate on hepatorenal toxicity and management of diabetes in animal models
- Valorization of Juglans regia L. (Walnut) green husk from Jordan: Analysis of fatty acids, phenolics, antioxidant, and cytotoxic activities
- Molecular docking and dynamics simulations of bioactive terpenes from Catharanthus roseus essential oil targeting breast cancer
- Selection of a dam site by using AHP and VIKOR: The Sakarya Basin
- Characterization and modeling of kidney bean shell biochar as adsorbent for caffeine removal from aquatic environments
- The effects of short-term and long-term 2100 MHz radiofrequency radiation on adult rat auditory brainstem response
- Biochemical insights into the anthelmintic and anti-inflammatory potential of sea cucumber extract: In vitro and in silico approaches
- Resveratrol-derived MDM2 inhibitors: Synthesis, characterization, and biological evaluation against MDM2 and HCT-116 cells
- Phytochemical constituents, in vitro antibacterial activity, and computational studies of Sudanese Musa acuminate Colla fruit peel hydro-ethanol extract
- Chemical composition of essential oils reviewed from the height of Cajuput (Melaleuca leucadendron) plantations in Buru Island and Seram Island, Maluku, Indonesia
- Phytochemical analysis and antioxidant activity of Azadirachta indica A. Juss from the Republic of Chad: in vitro and in silico studies
- Stability studies of titanium–carboxylate complexes: A multi-method computational approach
- Efficient adsorption performance of an alginate-based dental material for uranium(vi) removal
- Synthesis and characterization of the Co(ii), Ni(ii), and Cu(ii) complexes with a 1,2,4-triazine derivative ligand
- Evaluation of the impact of music on antioxidant mechanisms and survival in salt-stressed goldfish
- Optimization and validation of UPLC method for dapagliflozin and candesartan cilexetil in an on-demand formulation: Analytical quality by design approach
- Biomass-based cellulose hydroxyapatite nanocomposites for the efficient sequestration of dyes: Kinetics, response surface methodology optimization, and reusability
- Multifunctional nitrogen and boron co-doped carbon dots: A fluorescent probe for Hg2+ and biothiol detection with bioimaging and antifungal applications
- Separation of sulphonamides on a C12-diol mixed-mode HPLC column and investigation of their retention mechanism
- Characterization and antioxidant activity of pectin from lemon peels
- Fast PFAS determination in honey by direct probe electrospray ionization tandem mass spectrometry: A health risk assessment insight
- Correlation study between GC–MS analysis of cigarette aroma compounds and sensory evaluation
- Synthesis, biological evaluation, and molecular docking studies of substituted chromone-2-carboxamide derivatives as anti-breast cancer agents
- The influence of feed space velocity and pressure on the cold flow properties of diesel fuel
- Acid etching behavior and mechanism in acid solution of iron components in basalt fibers
- Protective effect of green synthesized nanoceria on retinal oxidative stress and inflammation in streptozotocin-induced diabetic rat
- Evaluation of the antianxiety activity of green zinc nanoparticles mediated by Boswellia thurifera in albino mice by following the plus maze and light and dark exploration tests
- Yeast as an efficient and eco-friendly bifunctional porogen for biomass-derived nitrogen-doped carbon catalysts in the oxygen reduction reaction
- Novel descriptors for the prediction of molecular properties
- Synthesis and characterization of surfactants derived from phenolphthalein: In vivo and in silico studies of their antihyperlipidemic effect
- Turmeric oil-fortified nutraceutical-SNEDDS: An approach to boost therapeutic effectiveness of dapagliflozin during treatment of diabetic patients
- Analysis and study on volatile flavor compounds of three Yunnan cultivated cigars based on headspace-gas chromatography-ion mobility spectrometry
- Near-infrared IR780 dye-loaded poloxamer 407 micelles: Preparation and in vitro assessment of anticancer activity
- Study on the influence of the viscosity reducer solution on percolation capacity of thin oil in ultra-low permeability reservoir
- Detection method of Aristolochic acid I based on magnetic carrier Fe3O4 and gold nanoclusters
- Special Issue on Advancing Sustainable Chemistry for a Greener Future
- One-pot fabrication of highly porous morphology of ferric oxide-ferric oxychloride/poly-O-chloroaniline nanocomposite seeded on poly-1H pyrrole: Photocathode for green hydrogen generation from natural and artificial seawater
- High-efficiency photocathode for green hydrogen generation from sanitation water using bismuthyl chloride/poly-o-chlorobenzeneamine nanocomposite
- Innovative synthesis of cobalt-based catalysts using ionic liquids and deep eutectic solvents: A minireview on electrocatalytic water splitting
- Special Issue on Phytochemicals, Biological and Toxicological Analysis of Plants
- Comparative analysis of fruit quality parameters and volatile compounds in commercially grown citrus cultivars
- Total phenolic, flavonoid, flavonol, and tannin contents as well as antioxidant and antiparasitic activities of aqueous methanol extract of Alhagi graecorum plant used in traditional medicine: Collected in Riyadh, Saudi Arabia
- Study on the pharmacological effects and active compounds of Apocynum venetum L.
- Chemical profile of Senna italica and Senna velutina seed and their pharmacological properties
- Essential oils from Brazilian plants: A literature analysis of anti-inflammatory and antimalarial properties and in silico validation
- Toxicological effects of green tea catechin extract on rat liver: Delineating safe and harmful doses
- Unlocking the potential of Trigonella foenum-graecum L. plant leaf extracts against diabetes-associated hypertension: A proof of concept by in silico studies