
Microorganism community composition analysis coupling with 15N tracer experiments reveals the nitrification rate and N2O emissions in low pH soils in Southern China
-
Feifei He
 and
Zheng Li
and
Zheng Li

Abstract
Nitrification in agricultural soil is an important process for food production. In acidic soil, nitrification is however also considered to be a major source of N2O production. The nitrification rate largely depends on the community composition of ammonia-oxidizing organisms. To obtain a view of the nitrification rates and N2O emission situations in low pH soils in Southern China and understand their relations with the microbial community composition, here we conducted 15N tracer experiments and microorganism community composition analysis using four acidic agricultural soil samples collected in Southern China. A single dominant community (relative abundance >68%) of the ammonia-oxidizing bacteria and ammonia-oxidizing archaea was observed in the soils with pH = 4.81–6.02. A low amount of
1 Introduction
It is widely known that nitrogen is of utmost importance to plants. Therefore, routinely applied nitrogen-based fertilizers are necessary for maintaining agricultural production [1]. Nitrogen uptake in plants involves the biological oxidation of ammonium to nitrate via nitrite, in a process termed nitrification. In soil, there are two major categories of microorganisms responsible for this process, namely, autotrophic ammonia-oxidizing bacteria (AOB) [2,3,4] and ammonia-oxidizing archaea (AOA) [5,6]. With nitrite being the intermediate product, AOB carries out most ammonia oxidation in soil, which is the primary step in the oxidation process converting ammonia to nitrate and is considered the rate-limiting step of nitrification in most soil systems [7]. With regard to AOA, while they have also been reported to possess the ammonia monooxygenase α-subunit (amoA) gene, their ammonia oxidation pathway is less clear [8,9]. Furthermore, AOA’s genomes typically harbor a large number of amoA genes than AOB in many ecosystems [10,11]. Interestingly, Lu et al. [12] and Zhang et al. [13] reported that AOA might play a more important role in nitrification in acidic soils than AOB.
Nitrification is highly sensitive to soil pH. The suitable pH range for nitrification to take place in the soil is 5.5–10.0, with the optimal pH being around 8.5. In the 10 soils studied by Sahrawat [14], when the soil pH was less than 5.0, no nitrification was detected at all. In some rare cases, nitrification may also occur in soils with extremely low pH (e.g., 3.8), as reported by Tisdale and Nelson [15]. Nevertheless, strongly acidic soils generally have limited nitrification abilities. Although applying nitrogen-based fertilizers and/or manure can accelerate nitrification in acidic soil [16], such promoting effect is only moderate in highly acidic soil [17,18,19].
Nitrous oxide (N2O) is a greenhouse gas that contributes to the depletion of the stratospheric ozone layer. Agricultural and natural soils collectively give rise to approximately 50–70% of total global emissions [20]. Nitrification is one of the major processes that emit N2O in soil, especially under aerobic conditions. In addition, high N2O emissions stemming from denitrification were also observed in acidic soils under aerobic conditions [21].
The central hypothesis of this work was that the high nitrification rate in acidic soils is largely due to the specific dominant ammonia-oxidizing microbial communities. To verify this, we carried out microorganism community composition analysis coupling with 15N tracer experiments to reveal the effects of soil pH on the nitrification rate and N2O emissions and explored the underlying mechanism.
2 Materials and methods
2.1 Experimental soils
Soil samples were collected from four agricultural fields in Yunnan Province, Southern China (Table 1). Ten samples (0–0.2 m depth) were collected and pooled for each soil type. For soil property measurement, we followed the standard methods described in ref. [22]. Briefly, the soil samples were first air-dried and sieved through a 4 mm mesh. Subsequently, the soil was digested with potassium dichromate and concentrated sulfuric acid, and residual dichromate was titrated with FeSO4 (0.2 M) to determine the total soil organic carbon. The total soil N was estimated following the micro-Kjeldahl digestion–distillation procedure. Finally, the pH value was measured using a pH meter, following the procedure described in ref. [23].
Information of sampling sites and soil properties
| Soil | I | II | III | IV |
|---|---|---|---|---|
| Sampling site | Wenshan | Yuxi | Kunming | Wenshan |
| Coordinates | N 24°16′609′′ | N 24°17′511′′ | N 24o49′778′′ | N 24°03′271′′ |
| E 104°51′788′′ | E 102°22′505′′ | E 102o50′279′′ | E 105°04′910′′ | |
| Land use | Tea garden | Corn field | Vegetable field | Vegetable field |
| pH (water) | 4.03 | 4.81 | 5.41 | 6.02 |
| Total organic carbon (g C kg−1) | 27.2 | 23.7 | 12.9 | 7.46 |
| Total nitrogen (g N kg−1) | 2.60 | 2.00 | 1.22 | 0.85 |
| <2 µm clay particles (%) | 75.0 | 71.0 | 74.3 | 23.6 |
2.2 DNA extraction and terminal restriction fragment length polymorphism (T-RFLP) analysis of the amoA genes
The same samples used for soil property measurement were used for DNA extraction. Immediately after the soil samples were collected and pooled, an appropriate amount of soil was quickly wrapped in aluminum foil, frozen in liquid nitrogen, and stored at −80°C. Genomic DNA was extracted from 0.5 g of frozen soil using the HiPure Soil DNA Mini Kit (Magen Bio Inc., Guangzhou, China) following the manufacturer’s instructions. The concentration and purity of the extracted DNA were assessed using the Biophotometer plus system (Eppendorf, Hamburg, Germany). For T-RFLP analysis, PCR amplifications were performed using the primer pairs Arch-amoAF/Arch-amoAR (for AOA) [24] and amoA1F/amoA2R (for AOB) [25]. Each forward primer was fluorescently labeled using 5-carboxyfluorescein. The thermocycling PCR conditions were 94°C for 2 min followed by 30 cycles of 94°C for 20 s, 57°C for 45 s, and 72°C for 45 s. The PCR products were electrophoresed on 1.0% (m/v) agarose gels and detected using an image analyzer (UV/white transilluminator). Subsequently, the PCR products were gel-purified using the Agarose Gel Extraction Kit (Tiangen Inc., Beijing, China) and digested using the restriction enzyme TaqI (Takara Bio Inc., Shiga, Japan). The mixture (17 µL of the purified PCR products, 2 µL of buffer, and 1 µL of 10 U/µL TaqI) was incubated at 37°C for 4 h. The terminal restriction fragments (T-RFs) of AOA and AOB were fluorescently labeled by Sangon Inc. (Shanghai, China). The relative abundance of each T-RF was determined by calculating the ratio of the area of each fluorescence peak to the total area.
2.3 15N-tracer experiments
The nitrification rate was estimated according to the final pool size of
2.4 Calculation and statistical analyses
Nitrification rates were calculated as described by Mørkved et al. [26]:
where c is the relative share of
The modeled nitrification rates were calculated using the following equation (on the basis of the changes in the
where N
NO3 is the
Multiple comparisons were made using one-way ANOVA with Duncan’s post-hoc test. All analyses were conducted using the SPSS 25.0 package (SPSS Inc., Chicago, USA), and p < 0.05 was considered to be statistically significant.
3 Results
3.1 Soil properties
Soil I (pH = 4.03) contained a total organic carbon content of 27.2 g C kg−1 and a total nitrogen content of 2.60 g N kg−1. The soil was sampled in late spring from the plough layer of a field where tea plants were grown for ∼20 years. Soil II (pH = 4.81), obtained from a corn–corn rotation field, contained a total organic carbon content of 23.7 g C kg−1 and a total nitrogen content of 2.00 g N kg−1. Soil III (pH = 5.41) and soil IV (pH = 6.02) were obtained from a vegetable planting field, and their total organic carbon and total nitrogen contents were estimated as 12.9 and 7.46 g C kg−1, and 1.22 and 0.85 g N kg−1, respectively (Table 1).
3.2 T-RFLP analysis of AOA and AOB
As shown by the AOB T-RFLP profiles, the 296-bp T-RF was the most dominant AOB T-RF in soils II and III and accounted for 73–77% of the total AOB T-RFs, while it showed low relative abundance (12–27%) in soils I and IV (Figure 1). Meanwhile, the 15-bp T-RF in soil I and the 196-bp T-RF in soil IV were the dominant AOB T-RFs and accounted for 38 and 40% of the total AOB T-RFs, respectively (Figure 1). In soils II, III, and IV, only two (16- and 296-bp), three (13-, 15-, and 296-bp) and four (15-, 17-, 196-, and 296-bp) T-RFs were detected, respectively, whereas as many as eight T-RFs were detected in soil I (Figure 1).
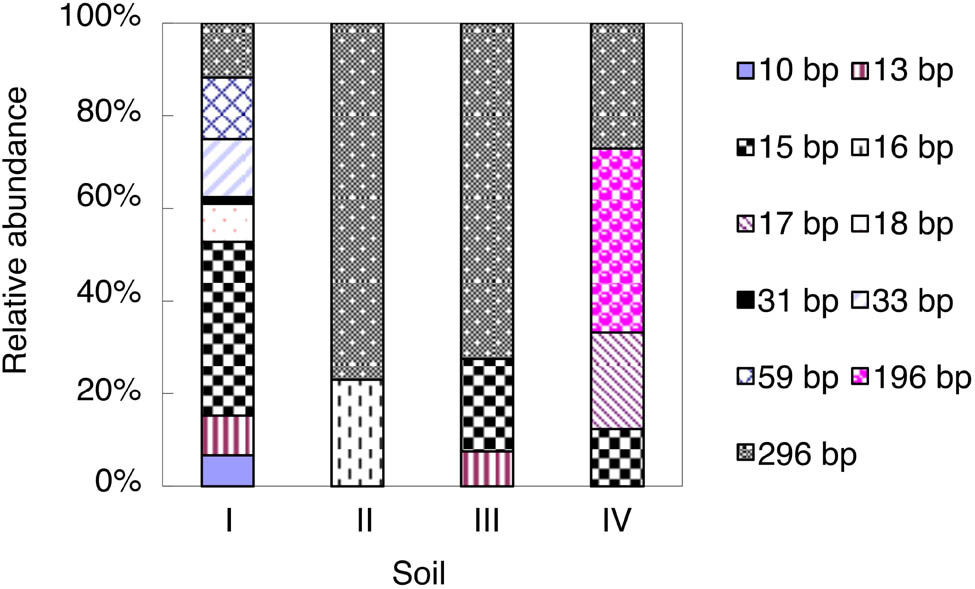
Relative abundance of AOB amoA T-RFs in the studied soils at the end of the incubation. For soil information, see Table 1.
As shown in Figure 2, 18 AOA T-RFs were detected in the studied soils. Such a large number suggested that the AOA communities had relatively higher diversity than the AOB communities. The 70-bp T-RF was the most dominant AOA T-RF and accounted for 68% of the total AOA T-RFs. Notably, this T-RF was only detected in soils I and IV.
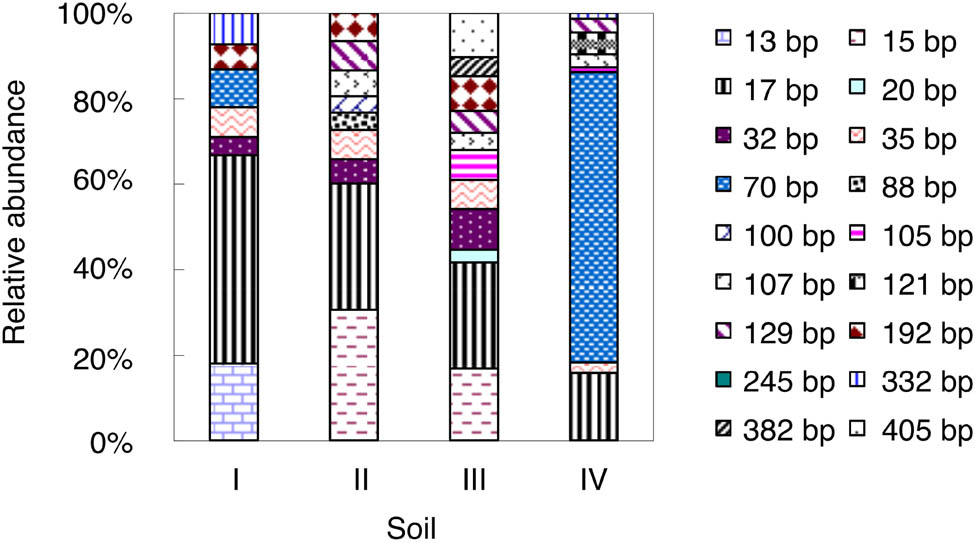
Relative abundance of AOA amoA T-RFs in the studied soils at end of the incubation. For soil information, see Table 1.
3.3 Soil inorganic N
The ammonium concentration of soil I increased rapidly after being incubated with (15NH4)2SO4, and following 1 day of incubation, the ammonium concentration in soil I was constantly higher than those in soils II–IV (Figure 3a).
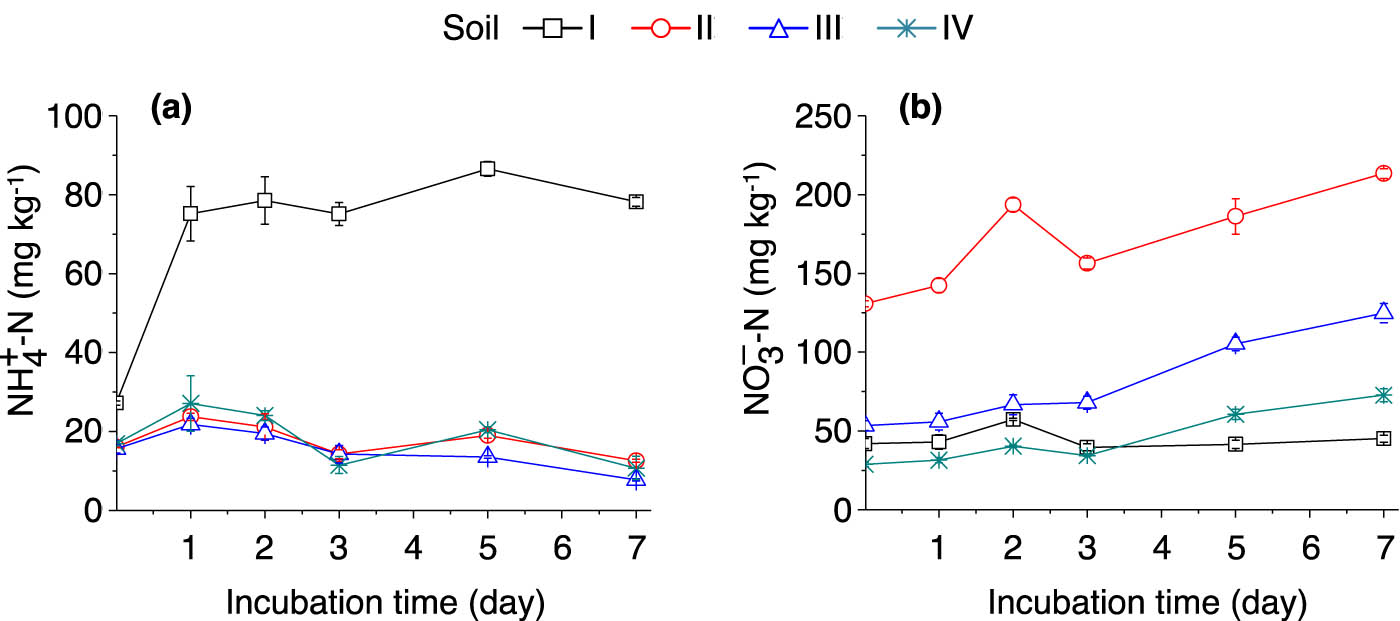
Dynamics of soil
Dynamics of soil
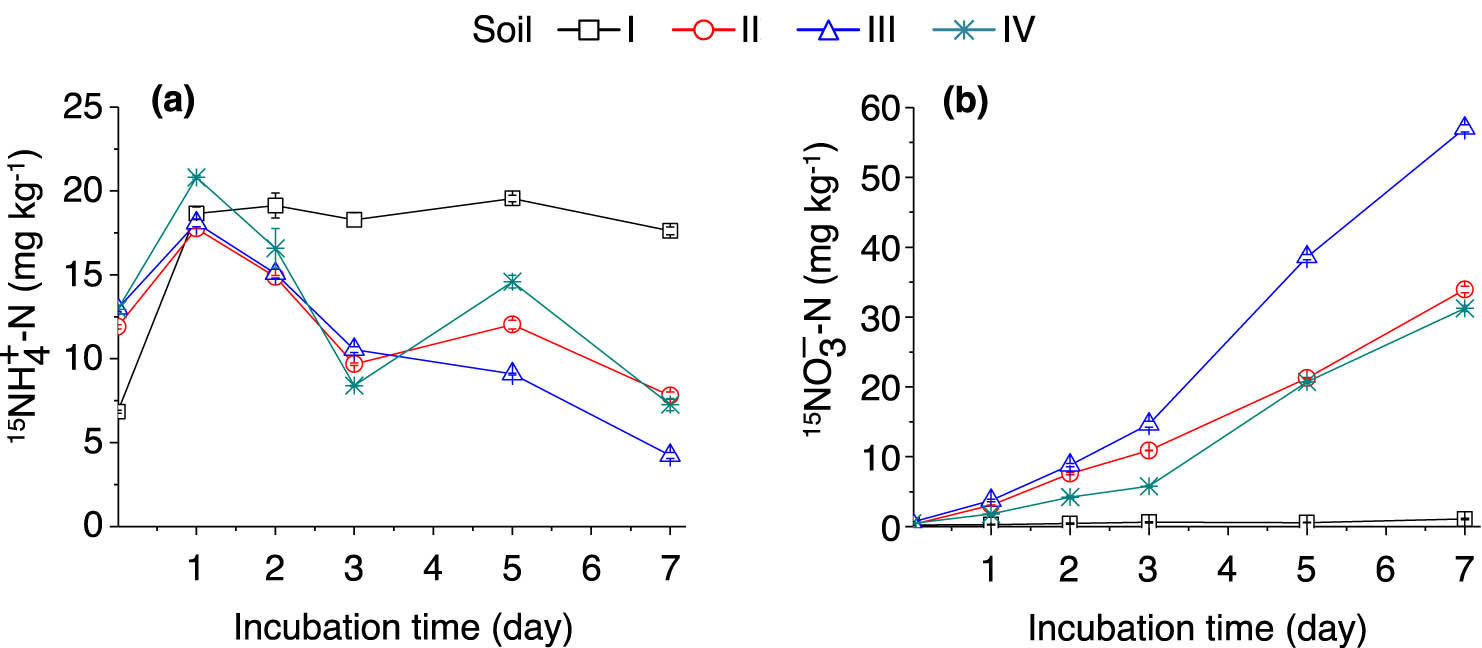
In the (15NH4)2SO4-labeled samples, the % 15N excess of the
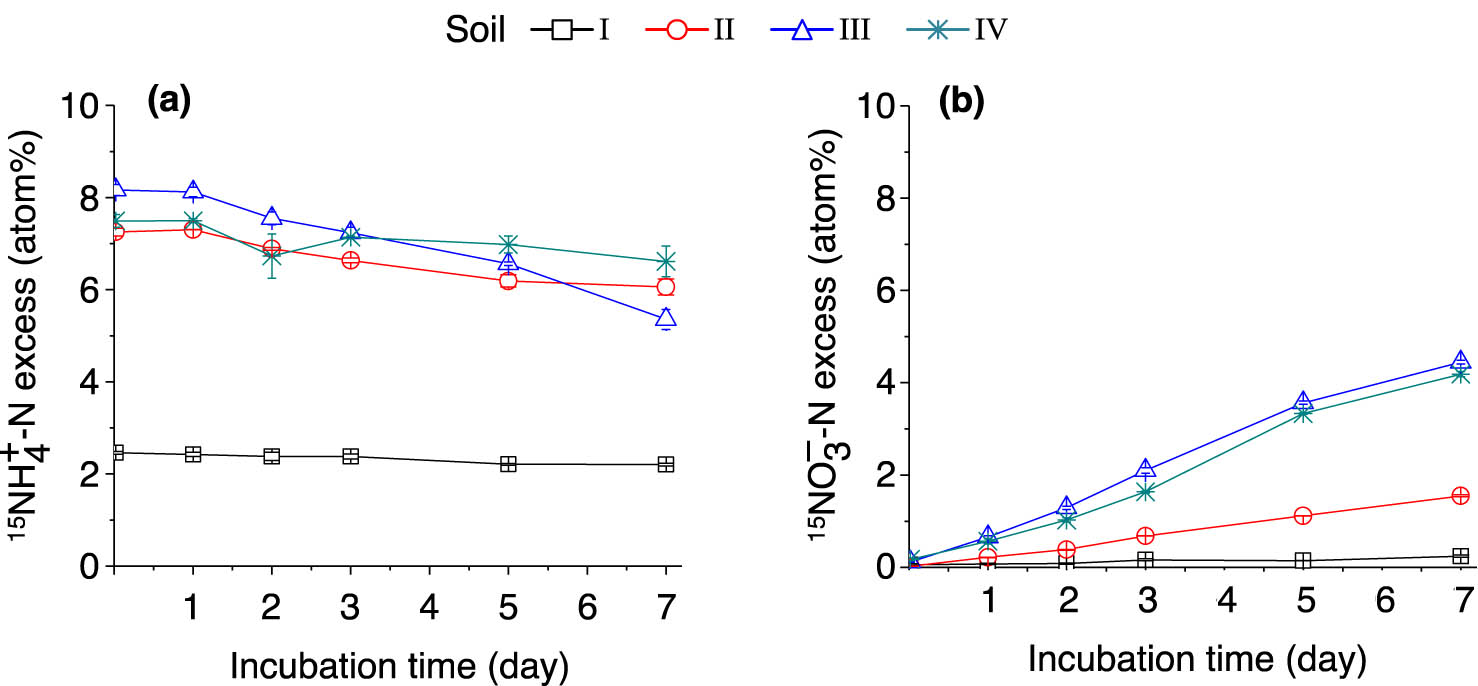
Dynamics of soil
3.4 Nitrification rates
The lowest nitrification rate (0.52 mg N kg−1 day−1) was observed in soil I, yet the nitrification rate did not increase along with the pH gradient in soils II–IV (Table 2). Among the tested soil samples, soil III (pH = 5.41) displayed the highest nitrification rate. These results suggested that nitrification was significantly suppressed in soil I. As expected, the modeled nitrification rates were lower than the calculated nitrification rates, and a significant correlation was observed (y = −0.214 + 0.747x, r 2 = 0.996, p < 0.01).
Nitrification rates of the studied soils
| Soil | Calculated nitrification* (mg N kg−1 day−1) | Modeled nitrification** (mg N kg−1 day−1) |
|---|---|---|
| I | 0.52 ± 0.03d | 0.11 ± 0.02c |
| II | 7.01 ± 0.10b | 4.81 ± 0.06b |
| III | 11.6 ± 0.57a | 8.44 ± 0.10a |
| IV | 6.05 ± 0.34c | 4.62 ± 0.06b |
Different letters denote significant differences (p < 0.05) among the studied soils. *Calculated according to the equation described by Mørkved et al. [26]. **Calculated following the zero-order equation.
3.5 N2O emissions
The fluxes of N2O in the studied soils are shown in Figure 6a. The N2O fluxes in soils I and II remained high during the incubation period and peaked on day 5. Between days 5 and 7, the N2O flux in soil I only slightly decreased while the flux in soil II dropped dramatically. The average N2O fluxes are shown in Table 3. Two highest average N2O fluxes were found in soil II (1.34 µg N kg−1 h−1) and soil I (1.11 µg N kg−1 h−1). The flux of 15N2O was higher in soil II than in soils I, III, and IV during the incubation period (Figure 6b). The 15N–N2O flux only slightly increased in soil I after the addition of (15NH4)2SO4, whereas the increases were significant in soils II–IV, suggesting that the oxidation of
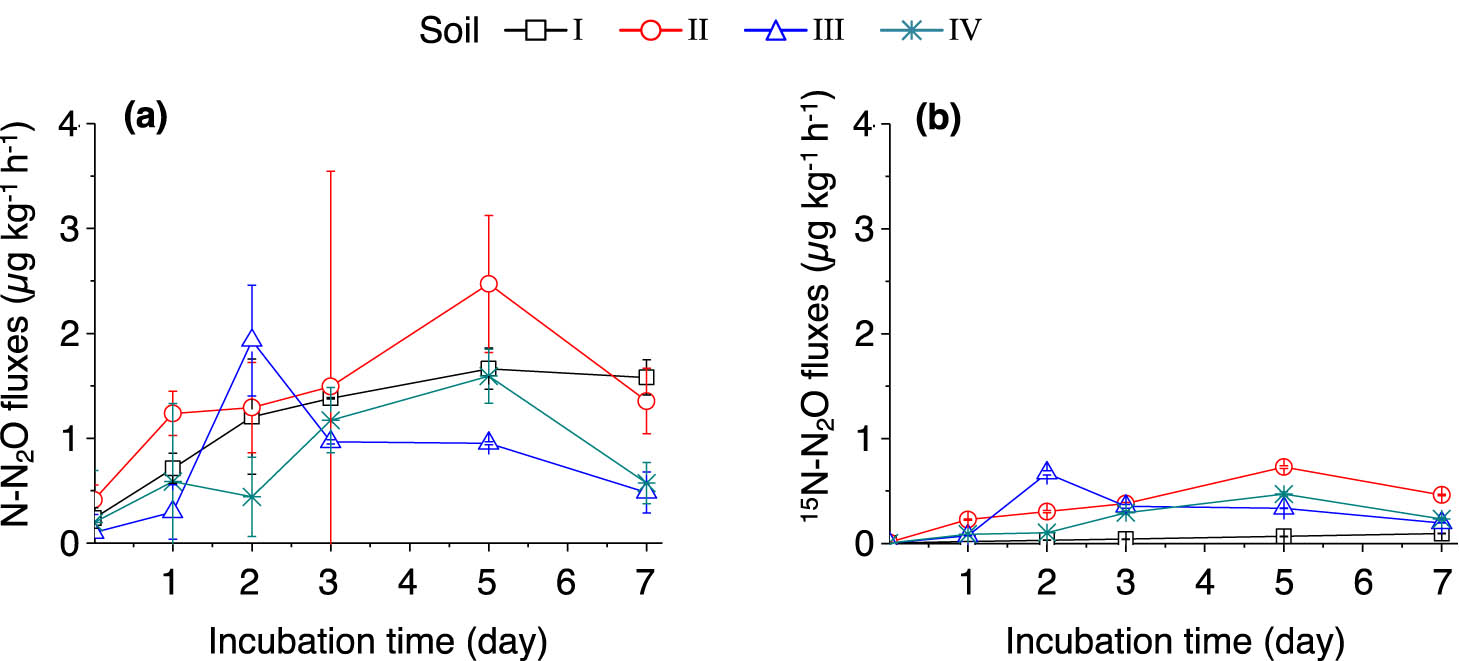
Dynamics of soil N2O emissions (a) and 15N–N2O emissions (b) after adding (15NH4)2SO4. The error bars represent SEM. n = 3 replicates. For soil information, see Table 1.
Average N2O flux and cumulative emissions from 2 h to 7 days after adding (15NH4)2SO4
| Soil | N2O flux (µg N kg−1 h−1) | 15N2O flux (ng N kg−1 h−1) | N2O emission (µg N kg−1) | 15N2O emission (µg N kg−1) |
|---|---|---|---|---|
| I | 1.11 ± 0.18ab | 41.1 ± 2.48d | 195 ± 30.3ab | 6.19 ± 0.56d |
| II | 1.34 ± 0.15a | 351 ± 7.92a | 255 ± 34.7a | 66.0 ± 1.69a |
| III | 0.72 ± 0.06b | 271 ± 1.53b | 138 ± 8.82b | 50.9 ± 0.80b |
| IV | 0.74 ± 0.12b | 197 ± 5.29c | 159 ± 39.5ab | 41.1 ± 1.73c |
Different letters denote significant differences (p < 0.05) among the studied soils.
During the 7 day (15NH4)2SO4 incubation period, the total N2O emissions in soils I and II were significantly higher (p < 0.05) compared with those of soils III and IV (Table 3). This result indicates that a low pH may negatively correlate with N2O emissions in soil. The 15N–N2O emission in soil I significantly decreased along with the incubation period, which is likely because the contribution of autotrophic nitrification to N2O production was suppressed in strongly acidic soil.
In the (15NH4)2SO4-labeled samples, the % 15N excess of N2O gradually increased over time in soils II–IV because of the nitrification and/or denitrification of the labeled
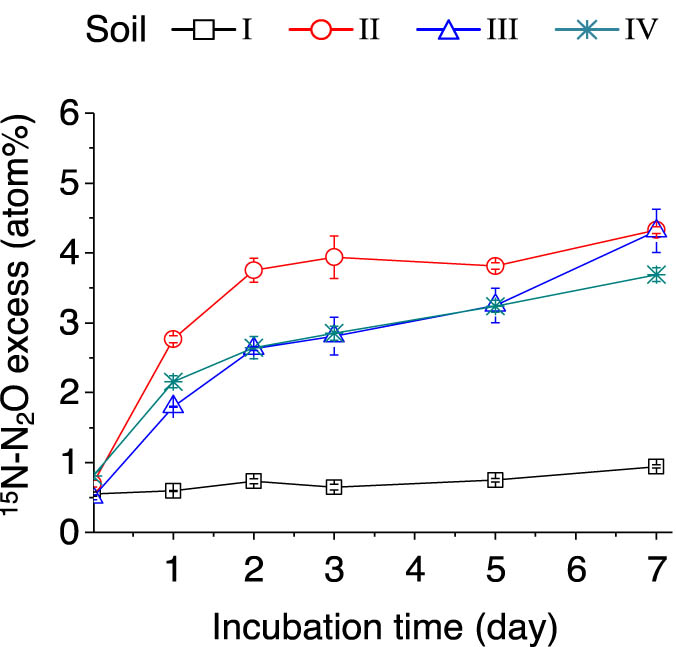
Dynamics of soil 15N–N2O atom% excess after adding (15NH4)2SO4. The error bars represent SEM. n = 3 replicates. For soil information, see Table 1.
4 Discussion
Soil pH is a key factor that controls the nitrification rate, and low pH conditions suppress nitrification [27,28,29]. In the present study, the nitrification rate in soil I (pH 4.03) was 91–95% lower than those in soils II–IV (pH 4.81–6.02). Given that the
In addition to substrate limitation, our finding that the most acidic soil (soil I, pH = 4.03) displayed the lowest nitrification rate might also be explained by the low abundance and/or activity of AOA [13,32,33]. qPCR quantification of AOB and AOA showed no significant difference between these two in terms of the total microbial amount in the studied soils (data not shown). However, our T-RFLP results revealed compositional variations of the AOB and AOA communities in the four studied soils. The AOB communities were relatively less diversified compared with the AOA communities in this study (Figures 1 and 2). The T-RFLP profile showed that only one AOB T-RF (296 bp) remained dominant in soils II and III at the end of the incubation period. No dominant AOB T-RF was detected in soils I and IV. By contrast, the AOA communities featured a dominant 70-bp T-RF, except for the community in soil IV. Our results suggest that dominant communities, rather than community abundance, may exert a major effect on nitrification. In our study, a single dominant T-RF of AOB and/or AOA may contribute to the higher nitrification rates observed in soils II–IV. It is worth noting that, in addition to soil pH, the field management practice is another factor influencing microbial composition. Notably, it has been reported that AOA and AOB could respond differently to management practices [23]. In the four soil samples we studied, only soil I was from a perennial system, which was less fertilized than other annual cropping systems (soils II–IV). Thus, nitrogen input differences may also contribute to the varied niche differentiation between AOA and AOB in the four soils.
Our N2O emission results suggest that soil N2O emissions are enhanced under low pH conditions. This is in line with the findings of Van den Heuvel et al. [34]. In their study, only 25% of the soil spots were of low pH (<5), but these soil spots gave rise to 77% of the total N2O emission. In the present study, the low pH value in soil I resulted in both higher N2O flux and emission. However, soil I’s flux and emission of 15N2O were lower than those of soils II–IV after adding (15NH4)2SO4. Hence, the N2O emission from strongly acidic soil may mainly be produced by denitrification, which is also an important process in a low pH environment. A previous 15N tracer experiment unraveled that, under aerobic conditions, denitrification in acidic soils could contribute to N2O production more markedly in comparison with autotrophic nitrification and heterotrophic nitrification [35]. Furthermore, an analysis based on 107 measurements in 26 publications also showed that in soils with a pH value lower than ∼4.4 and under aerobic conditions, denitrification is responsible for >50% of the soil N2O production [36]. From a chemical point of view, the N2O reductase produced during denitrification is sensitive to soil pH, and potential denitrifying enzyme activity is the highest in alkaline soil and the lowest in acidic soil [37]. Moreover, under low pH conditions, the reduction of N2O to N2 could be halted until
In summary, our results suggest that the nitrification rate and N2O emission are largely affected by soil pH by modifying the composition of AOB and/or AOA. Future work is needed to further characterize the AOB and AOA reported here and investigate if the high N2O emission observed in the acidic soil under aerobic conditions was mainly caused by denitrification.
-
Funding information: This work was supported by the National Natural Science Foundation of China (NSFC) (project numbers: 31201688 and 41661071).
-
Author contributions: F.H., D.L., and Z.L. conceived and designed the experiments. F.H. and H.Y. performed the experiments. F.H. and Z.L. wrote the manuscript. All authors read and approved the final manuscript.
-
Conflict of interest: The authors state no conflict of interest.
-
Data availability statement: The datasets generated during and/or analyzed during the current study are available from the corresponding authors on reasonable request.
References
[1] Beeckman F, Motte H, Beeckman T. Nitrification in agricultural soils: impact, actors and mitigation. Curr Opin Biotechnol. 2018;50:166–73.10.1016/j.copbio.2018.01.014Search in Google Scholar PubMed
[2] Jia Z, Conrad R. Bacteria rather than archaea dominate microbial ammonia oxidation in an agricultural soil. Environ Microbiol. 2009;11(7):1658–71.10.1111/j.1462-2920.2009.01891.xSearch in Google Scholar PubMed
[3] Xia W, Zhang C, Zeng X, Feng Y, Weng J, Lin X, et al. Autotrophic growth of nitrifying community in an agricultural soil. ISME J. 2011;5(7):1226–36.10.1038/ismej.2011.5Search in Google Scholar PubMed PubMed Central
[4] Lin Y, Hu H-W, Ye G, Fan J, Ding W, He Z-Y, et al. Ammonia-oxidizing bacteria play an important role in nitrification of acidic soils: a meta-analysis. Geoderma. 2021;404:115395.10.1016/j.geoderma.2021.115395Search in Google Scholar
[5] Venter JC, Remington K, Heidelberg JF, Halpern AL, Rusch D, Eisen JA, et al. Environmental genome shotgun sequencing of the Sargasso Sea. Science. 2004;304(5667):66–74.10.1126/science.1093857Search in Google Scholar PubMed
[6] Könneke M, Bernhard AE, de la Torre JR, Walker CB, Waterbury JB, Stahl DA. Isolation of an autotrophic ammonia-oxidizing marine archaeon. Nature. 2005;437(7058):543–6.10.1038/nature03911Search in Google Scholar PubMed
[7] Verhamme DT, Prosser JI, Nicol GW. Ammonia concentration determines differential growth of ammonia-oxidising archaea and bacteria in soil microcosms. ISME J. 2011;5(6):1067–71.10.1038/ismej.2010.191Search in Google Scholar PubMed PubMed Central
[8] Kerou M, Offre P, Valledor L, Abby SS, Melcher M, Nagler M, et al. Proteomics and comparative genomics of Nitrososphaera viennensis reveal the core genome and adaptations of archaeal ammonia oxidizers. Proc Natl Acad Sci U S A. 2016;113(49):7937–46.10.1073/pnas.1601212113Search in Google Scholar PubMed PubMed Central
[9] Kozlowski JA, Stieglmeier M, Schleper C, Klotz MG, Stein LY. Pathways and key intermediates required for obligate aerobic ammonia-dependent chemolithotrophy in bacteria and Thaumarchaeota. ISME J. 2016;10(8):1836–45.10.1038/ismej.2016.2Search in Google Scholar PubMed PubMed Central
[10] Qin H, Yuan H, Zhang H, Zhu Y, Yin C, Tan Z, et al. Ammonia-oxidizing archaea are more important than ammonia-oxidizing bacteria in nitrification and NO3−-N loss in acidic soil of sloped land. Biol Fert Soils. 2013;49(6):767–76.10.1007/s00374-012-0767-1Search in Google Scholar
[11] Coca-Salazar A, Richaume A, Florio A, Carnol M. Response of ammonia-oxidizing bacteria and archaea abundance and activity to land use changes in agricultural systems of the Central Andes. Eur J Soil Biol. 2021;102:103263.10.1016/j.ejsobi.2020.103263Search in Google Scholar
[12] Lu L, Han W, Zhang J, Wu YC, Wang B, Lin X, et al. Nitrification of archaeal ammonia oxidizers in acid soils is supported by hydrolysis of urea. ISME J. 2012;6(10):1978–84.10.1038/ismej.2012.45Search in Google Scholar PubMed PubMed Central
[13] Zhang L-M, Hu H-W, Shen J-P, He J-Z. Ammonia-oxidizing archaea have more important role than ammonia-oxidizing bacteria in ammonia oxidation of strongly acidic soils. ISME J. 2012;6(5):1032–45.10.1038/ismej.2011.168Search in Google Scholar PubMed PubMed Central
[14] Sahrawat KL. Nitrification in some tropical soils. Plant Soil. 1982;65:281–6.10.1007/BF02374659Search in Google Scholar
[15] Tisdale SL, Nelson WL. Soil Fertility and Fertilizers. 2nd edn. New York: The Macmillan Co.; 1970.Search in Google Scholar
[16] Li X, Han S, Wan W, Zheng L, Chen W, Huang Q. Manure fertilizes alter the nitrite oxidizer and comammox community composition and increase nitrification rates. Soil Till Res. 2020;204:104701.10.1016/j.still.2020.104701Search in Google Scholar
[17] Aciego Pietri JC, Brookes PC. Nitrogen mineralisation along a pH gradient of a silty loam UK soil. Soil Biol Biochem. 2008;40(1):797–802.10.1016/j.soilbio.2007.10.014Search in Google Scholar
[18] Xiao K, Yu L, Xu J, Brooks PC. pH, nitrogen mineralization, and KCl-extractable aluminum as affected by initial soil pH and rate of vetch residue application: results from a laboratory study. J Soil Sediments. 2014;14(1):1513–25.10.1007/s11368-014-0909-1Search in Google Scholar
[19] Wang Z, Meng Y, Zhu-Barker X, He X, Horwath WR, Luo H, et al. Responses of nitrification and ammonia oxidizers to a range of background and adjusted pH in purple soils. Geoderma. 2019;334:9–14.10.1016/j.geoderma.2018.07.038Search in Google Scholar
[20] Syakila A, Kroeze C. The global nitrogen budget revisited. Greenh Gas Meas Manag. 2011;1(1):17–26.10.3763/ghgmm.2010.0007Search in Google Scholar
[21] Li Z, Xia S, Zhang R, Zhang R, Chen F, Liu Y. N2O emissions and product ratios of nitrification and denitrification are altered by K fertilizer in acidic agricultural soils. Environ Pollut. 2020;265:115065.10.1016/j.envpol.2020.115065Search in Google Scholar PubMed
[22] Jackson ML. Soil chemical analysis. Prentice Hall, Englewood Cliffs, New Jersey. In: Pau EA, Ladd JN, editors. Soil biochemistry. Vol. 5. New York: Marcel Dekkar; 1958. p. 415–71.Search in Google Scholar
[23] Liang D, Ouyang Y, Tiemann L, Robertson GP. Niche differentiation of bacterial versus archaeal soil nitrifiers induced by ammonium inhibition along a management gradient. Front Microbiol. 2020;11:568588.10.3389/fmicb.2020.568588Search in Google Scholar
[24] Francis CA, Roberts KJ, Beman JM, Santoro AE, Oakley BB. Ubiquity and diversity of ammonia-oxidizing archaea in water columns and sediments of the ocean. Proc Natl Acad Sci U S A. 2005;102(41):14683–8.10.1073/pnas.0506625102Search in Google Scholar
[25] Rotthauwe JH, Witzel KP, Liesack W. The ammonia monooxygenase structural gene amoA as a functional marker: molecular fine-scale analysis of natural ammonia-oxidizing populations. Appl Environ Microbiol. 1997;63(12):4704–12.10.1128/aem.63.12.4704-4712.1997Search in Google Scholar
[26] Mørkved PT, Dörschb P, Henriksen TM, Bakken LR. N2O emissions and product ratios of nitrification and denitrification as affected by freezing and thawing. Soil Biol Biochem. 2006;38:3411–20.10.1016/j.soilbio.2006.05.015Search in Google Scholar
[27] DeForest JL, Otuya RK. Soil nitrification increases with elevated phosphorus or soil pH in an acidic mixed mesophytic deciduous forest. Soil Biol Biochem. 2020;142:107716.10.1016/j.soilbio.2020.107716Search in Google Scholar
[28] Zhao W, Cai Z-C, Xu Z-H. Does ammonium-based N addition influence nitrification and acidification in humid subtropical soils of China? Plant Soil. 2007;297:213–21.10.1007/s11104-007-9334-1Search in Google Scholar
[29] Jiang QQ, Bakken LR. Comparison of Nitrosospira strains isolated from terrestrial environments. FEMS Microbiol Ecol. 1999;30(2):171–86.10.1111/j.1574-6941.1999.tb00646.xSearch in Google Scholar
[30] Burton SAQ, Prosser JI. Autotrophic ammonia oxidation at low pH through urea hydrolysis. Appl Environ Microbiol. 2001;67(7):2952–7.10.1128/AEM.67.7.2952-2957.2001Search in Google Scholar
[31] de Boer W, Kowalchuk GA. Nitrification in acid soils: microorganisms and mechanisms. Soil Biol Biochem. 2001;33(7–8):853–66.10.1016/S0038-0717(00)00247-9Search in Google Scholar
[32] Yao H, Gao Y, Nicol G, Campbell CD, Colin D, Prosser JI, et al. Links between ammonia oxidizer community structure, abundance, and nitrification potential in acidic soils. Appl Environ Microbiol. 2011;77(13):4618–25.10.1128/AEM.00136-11Search in Google Scholar PubMed PubMed Central
[33] Chen J, Xue QZ, Xue Z, Jia ZH, Shen RF. High pH-enhanced soil nitrification was associated with ammonia-oxidizing bacteria rather than archaea in acidic soils. Appl Environ Microbiol. 2014;85(1):21–9.10.1016/j.apsoil.2014.09.003Search in Google Scholar
[34] Van den Heuvel RN, Bakker SE, Jetten MSM, Hefting MM. Decreased N2O reduction by low soil pH causes high emissions in a riparian ecosystem. Geobiology. 2011;9:294–300.10.1111/j.1472-4669.2011.00276.xSearch in Google Scholar PubMed
[35] Zhu T, Zhang J, Cai Z. The contribution of nitrogen transformation processes to total N2O emissions from soils used for intensive vegetable cultivation. Plant Soil. 2011;343(1–2):313–27.10.1007/s11104-011-0720-3Search in Google Scholar
[36] Cheng Y, Zhang J-B, Wang J, Cai Z-C, Wang S-Q. Soil pH is a good predictor of the dominating N2O production processes under aerobic conditions. J Plant Nutr Soil Sci. 2015;178(3):1–4.10.1002/jpln.201400577Search in Google Scholar
[37] Čuhel J, Šimek M. Proximal and distal control by pH of denitrification rate in a pasture soil. Agric Ecosyst Environ. 2011;141(1–2):230–3.10.1016/j.agee.2011.02.016Search in Google Scholar
[38] Tokuda S, Hayatsu M. Nitrous oxide production from strongly acid tea field soils. Soil Sci Plant Nutr. 2000;46(4):835–44.10.1080/00380768.2000.10409149Search in Google Scholar
[39] Zhang Y, Zhao J, Huang X, Cheng Y, Cai Z, Zhang J, et al. Microbial pathways account for the pH effect on soil N2O production. Eur J Soil Biol. 2021;106:103337.10.1016/j.ejsobi.2021.103337Search in Google Scholar
[40] Zhang J, Cai Z, Zhu T. N2O production pathways in the subtropical acid forest soils in China. Environ Res. 2011;111:1643–9.10.1016/j.envres.2011.04.005Search in Google Scholar PubMed
© 2022 Feifei He et al., published by De Gruyter
This work is licensed under the Creative Commons Attribution 4.0 International License.
Articles in the same Issue
- Biomedical Sciences
- Effects of direct oral anticoagulants dabigatran and rivaroxaban on the blood coagulation function in rabbits
- The mother of all battles: Viruses vs humans. Can humans avoid extinction in 50–100 years?
- Knockdown of G1P3 inhibits cell proliferation and enhances the cytotoxicity of dexamethasone in acute lymphoblastic leukemia
- LINC00665 regulates hepatocellular carcinoma by modulating mRNA via the m6A enzyme
- Association study of CLDN14 variations in patients with kidney stones
- Concanavalin A-induced autoimmune hepatitis model in mice: Mechanisms and future outlook
- Regulation of miR-30b in cancer development, apoptosis, and drug resistance
- Informatic analysis of the pulmonary microecology in non-cystic fibrosis bronchiectasis at three different stages
- Swimming attenuates tumor growth in CT-26 tumor-bearing mice and suppresses angiogenesis by mediating the HIF-1α/VEGFA pathway
- Characterization of intestinal microbiota and serum metabolites in patients with mild hepatic encephalopathy
- Functional conservation and divergence in plant-specific GRF gene family revealed by sequences and expression analysis
- Application of the FLP/LoxP-FRT recombination system to switch the eGFP expression in a model prokaryote
- Biomedical evaluation of antioxidant properties of lamb meat enriched with iodine and selenium
- Intravenous infusion of the exosomes derived from human umbilical cord mesenchymal stem cells enhance neurological recovery after traumatic brain injury via suppressing the NF-κB pathway
- Effect of dietary pattern on pregnant women with gestational diabetes mellitus and its clinical significance
- Potential regulatory mechanism of TNF-α/TNFR1/ANXA1 in glioma cells and its role in glioma cell proliferation
- Effect of the genetic mutant G71R in uridine diphosphate-glucuronosyltransferase 1A1 on the conjugation of bilirubin
- Quercetin inhibits cytotoxicity of PC12 cells induced by amyloid-beta 25–35 via stimulating estrogen receptor α, activating ERK1/2, and inhibiting apoptosis
- Nutrition intervention in the management of novel coronavirus pneumonia patients
- circ-CFH promotes the development of HCC by regulating cell proliferation, apoptosis, migration, invasion, and glycolysis through the miR-377-3p/RNF38 axis
- Bmi-1 directly upregulates glucose transporter 1 in human gastric adenocarcinoma
- Lacunar infarction aggravates the cognitive deficit in the elderly with white matter lesion
- Hydroxysafflor yellow A improved retinopathy via Nrf2/HO-1 pathway in rats
- Comparison of axon extension: PTFE versus PLA formed by a 3D printer
- Elevated IL-35 level and iTr35 subset increase the bacterial burden and lung lesions in Mycobacterium tuberculosis-infected mice
- A case report of CAT gene and HNF1β gene variations in a patient with early-onset diabetes
- Study on the mechanism of inhibiting patulin production by fengycin
- SOX4 promotes high-glucose-induced inflammation and angiogenesis of retinal endothelial cells by activating NF-κB signaling pathway
- Relationship between blood clots and COVID-19 vaccines: A literature review
- Analysis of genetic characteristics of 436 children with dysplasia and detailed analysis of rare karyotype
- Bioinformatics network analyses of growth differentiation factor 11
- NR4A1 inhibits the epithelial–mesenchymal transition of hepatic stellate cells: Involvement of TGF-β–Smad2/3/4–ZEB signaling
- Expression of Zeb1 in the differentiation of mouse embryonic stem cell
- Study on the genetic damage caused by cadmium sulfide quantum dots in human lymphocytes
- Association between single-nucleotide polymorphisms of NKX2.5 and congenital heart disease in Chinese population: A meta-analysis
- Assessment of the anesthetic effect of modified pentothal sodium solution on Sprague-Dawley rats
- Genetic susceptibility to high myopia in Han Chinese population
- Potential biomarkers and molecular mechanisms in preeclampsia progression
- Silencing circular RNA-friend leukemia virus integration 1 restrained malignancy of CC cells and oxaliplatin resistance by disturbing dyskeratosis congenita 1
- Endostar plus pembrolizumab combined with a platinum-based dual chemotherapy regime for advanced pulmonary large-cell neuroendocrine carcinoma as a first-line treatment: A case report
- The significance of PAK4 in signaling and clinicopathology: A review
- Sorafenib inhibits ovarian cancer cell proliferation and mobility and induces radiosensitivity by targeting the tumor cell epithelial–mesenchymal transition
- Characterization of rabbit polyclonal antibody against camel recombinant nanobodies
- Active legumain promotes invasion and migration of neuroblastoma by regulating epithelial-mesenchymal transition
- Effect of cell receptors in the pathogenesis of osteoarthritis: Current insights
- MT-12 inhibits the proliferation of bladder cells in vitro and in vivo by enhancing autophagy through mitochondrial dysfunction
- Study of hsa_circRNA_000121 and hsa_circRNA_004183 in papillary thyroid microcarcinoma
- BuyangHuanwu Decoction attenuates cerebral vasospasm caused by subarachnoid hemorrhage in rats via PI3K/AKT/eNOS axis
- Effects of the interaction of Notch and TLR4 pathways on inflammation and heart function in septic heart
- Monosodium iodoacetate-induced subchondral bone microstructure and inflammatory changes in an animal model of osteoarthritis
- A rare presentation of type II Abernethy malformation and nephrotic syndrome: Case report and review
- Rapid death due to pulmonary epithelioid haemangioendothelioma in several weeks: A case report
- Hepatoprotective role of peroxisome proliferator-activated receptor-α in non-cancerous hepatic tissues following transcatheter arterial embolization
- Correlation between peripheral blood lymphocyte subpopulations and primary systemic lupus erythematosus
- A novel SLC8A1-ALK fusion in lung adenocarcinoma confers sensitivity to alectinib: A case report
- β-Hydroxybutyrate upregulates FGF21 expression through inhibition of histone deacetylases in hepatocytes
- Identification of metabolic genes for the prediction of prognosis and tumor microenvironment infiltration in early-stage non-small cell lung cancer
- BTBD10 inhibits glioma tumorigenesis by downregulating cyclin D1 and p-Akt
- Mucormycosis co-infection in COVID-19 patients: An update
- Metagenomic next-generation sequencing in diagnosing Pneumocystis jirovecii pneumonia: A case report
- Long non-coding RNA HOXB-AS1 is a prognostic marker and promotes hepatocellular carcinoma cells’ proliferation and invasion
- Preparation and evaluation of LA-PEG-SPION, a targeted MRI contrast agent for liver cancer
- Proteomic analysis of the liver regulating lipid metabolism in Chaohu ducks using two-dimensional electrophoresis
- Nasopharyngeal tuberculosis: A case report
- Characterization and evaluation of anti-Salmonella enteritidis activity of indigenous probiotic lactobacilli in mice
- Aberrant pulmonary immune response of obese mice to periodontal infection
- Bacteriospermia – A formidable player in male subfertility
- In silico and in vivo analysis of TIPE1 expression in diffuse large B cell lymphoma
- Effects of KCa channels on biological behavior of trophoblasts
- Interleukin-17A influences the vulnerability rather than the size of established atherosclerotic plaques in apolipoprotein E-deficient mice
- Multiple organ failure and death caused by Staphylococcus aureus hip infection: A case report
- Prognostic signature related to the immune environment of oral squamous cell carcinoma
- Primary and metastatic squamous cell carcinoma of the thyroid gland: Two case reports
- Neuroprotective effects of crocin and crocin-loaded niosomes against the paraquat-induced oxidative brain damage in rats
- Role of MMP-2 and CD147 in kidney fibrosis
- Geometric basis of action potential of skeletal muscle cells and neurons
- Babesia microti-induced fulminant sepsis in an immunocompromised host: A case report and the case-specific literature review
- Role of cerebellar cortex in associative learning and memory in guinea pigs
- Application of metagenomic next-generation sequencing technique for diagnosing a specific case of necrotizing meningoencephalitis caused by human herpesvirus 2
- Case report: Quadruple primary malignant neoplasms including esophageal, ureteral, and lung in an elderly male
- Long non-coding RNA NEAT1 promotes angiogenesis in hepatoma carcinoma via the miR-125a-5p/VEGF pathway
- Osteogenic differentiation of periodontal membrane stem cells in inflammatory environments
- Knockdown of SHMT2 enhances the sensitivity of gastric cancer cells to radiotherapy through the Wnt/β-catenin pathway
- Continuous renal replacement therapy combined with double filtration plasmapheresis in the treatment of severe lupus complicated by serious bacterial infections in children: A case report
- Simultaneous triple primary malignancies, including bladder cancer, lymphoma, and lung cancer, in an elderly male: A case report
- Preclinical immunogenicity assessment of a cell-based inactivated whole-virion H5N1 influenza vaccine
- One case of iodine-125 therapy – A new minimally invasive treatment of intrahepatic cholangiocarcinoma
- S1P promotes corneal trigeminal neuron differentiation and corneal nerve repair via upregulating nerve growth factor expression in a mouse model
- Early cancer detection by a targeted methylation assay of circulating tumor DNA in plasma
- Calcifying nanoparticles initiate the calcification process of mesenchymal stem cells in vitro through the activation of the TGF-β1/Smad signaling pathway and promote the decay of echinococcosis
- Evaluation of prognostic markers in patients infected with SARS-CoV-2
- N6-Methyladenosine-related alternative splicing events play a role in bladder cancer
- Characterization of the structural, oxidative, and immunological features of testis tissue from Zucker diabetic fatty rats
- Effects of glucose and osmotic pressure on the proliferation and cell cycle of human chorionic trophoblast cells
- Investigation of genotype diversity of 7,804 norovirus sequences in humans and animals of China
- Characteristics and karyotype analysis of a patient with turner syndrome complicated with multiple-site tumors: A case report
- Aggravated renal fibrosis is positively associated with the activation of HMGB1-TLR2/4 signaling in STZ-induced diabetic mice
- Distribution characteristics of SARS-CoV-2 IgM/IgG in false-positive results detected by chemiluminescent immunoassay
- SRPX2 attenuated oxygen–glucose deprivation and reperfusion-induced injury in cardiomyocytes via alleviating endoplasmic reticulum stress-induced apoptosis through targeting PI3K/Akt/mTOR axis
- Aquaporin-8 overexpression is involved in vascular structure and function changes in placentas of gestational diabetes mellitus patients
- Relationship between CRP gene polymorphisms and ischemic stroke risk: A systematic review and meta-analysis
- Effects of growth hormone on lipid metabolism and sexual development in pubertal obese male rats
- Cloning and identification of the CTLA-4IgV gene and functional application of vaccine in Xinjiang sheep
- Antitumor activity of RUNX3: Upregulation of E-cadherin and downregulation of the epithelial–mesenchymal transition in clear-cell renal cell carcinoma
- PHF8 promotes osteogenic differentiation of BMSCs in old rat with osteoporosis by regulating Wnt/β-catenin pathway
- A review of the current state of the computer-aided diagnosis (CAD) systems for breast cancer diagnosis
- Bilateral dacryoadenitis in adult-onset Still’s disease: A case report
- A novel association between Bmi-1 protein expression and the SUVmax obtained by 18F-FDG PET/CT in patients with gastric adenocarcinoma
- The role of erythrocytes and erythroid progenitor cells in tumors
- Relationship between platelet activation markers and spontaneous abortion: A meta-analysis
- Abnormal methylation caused by folic acid deficiency in neural tube defects
- Silencing TLR4 using an ultrasound-targeted microbubble destruction-based shRNA system reduces ischemia-induced seizures in hyperglycemic rats
- Plant Sciences
- Seasonal succession of bacterial communities in cultured Caulerpa lentillifera detected by high-throughput sequencing
- Cloning and prokaryotic expression of WRKY48 from Caragana intermedia
- Novel Brassica hybrids with different resistance to Leptosphaeria maculans reveal unbalanced rDNA signal patterns
- Application of exogenous auxin and gibberellin regulates the bolting of lettuce (Lactuca sativa L.)
- Phytoremediation of pollutants from wastewater: A concise review
- Genome-wide identification and characterization of NBS-encoding genes in the sweet potato wild ancestor Ipomoea trifida (H.B.K.)
- Alleviative effects of magnetic Fe3O4 nanoparticles on the physiological toxicity of 3-nitrophenol to rice (Oryza sativa L.) seedlings
- Selection and functional identification of Dof genes expressed in response to nitrogen in Populus simonii × Populus nigra
- Study on pecan seed germination influenced by seed endocarp
- Identification of active compounds in Ophiopogonis Radix from different geographical origins by UPLC-Q/TOF-MS combined with GC-MS approaches
- The entire chloroplast genome sequence of Asparagus cochinchinensis and genetic comparison to Asparagus species
- Genome-wide identification of MAPK family genes and their response to abiotic stresses in tea plant (Camellia sinensis)
- Selection and validation of reference genes for RT-qPCR analysis of different organs at various development stages in Caragana intermedia
- Cloning and expression analysis of SERK1 gene in Diospyros lotus
- Integrated metabolomic and transcriptomic profiling revealed coping mechanisms of the edible and medicinal homologous plant Plantago asiatica L. cadmium resistance
- A missense variant in NCF1 is associated with susceptibility to unexplained recurrent spontaneous abortion
- Assessment of drought tolerance indices in faba bean genotypes under different irrigation regimes
- The entire chloroplast genome sequence of Asparagus setaceus (Kunth) Jessop: Genome structure, gene composition, and phylogenetic analysis in Asparagaceae
- Food Science
- Dietary food additive monosodium glutamate with or without high-lipid diet induces spleen anomaly: A mechanistic approach on rat model
- Binge eating disorder during COVID-19
- Potential of honey against the onset of autoimmune diabetes and its associated nephropathy, pancreatitis, and retinopathy in type 1 diabetic animal model
- FTO gene expression in diet-induced obesity is downregulated by Solanum fruit supplementation
- Physical activity enhances fecal lactobacilli in rats chronically drinking sweetened cola beverage
- Supercritical CO2 extraction, chemical composition, and antioxidant effects of Coreopsis tinctoria Nutt. oleoresin
- Functional constituents of plant-based foods boost immunity against acute and chronic disorders
- Effect of selenium and methods of protein extraction on the proteomic profile of Saccharomyces yeast
- Microbial diversity of milk ghee in southern Gansu and its effect on the formation of ghee flavor compounds
- Ecology and Environmental Sciences
- Effects of heavy metals on bacterial community surrounding Bijiashan mining area located in northwest China
- Microorganism community composition analysis coupling with 15N tracer experiments reveals the nitrification rate and N2O emissions in low pH soils in Southern China
- Genetic diversity and population structure of Cinnamomum balansae Lecomte inferred by microsatellites
- Preliminary screening of microplastic contamination in different marine fish species of Taif market, Saudi Arabia
- Plant volatile organic compounds attractive to Lygus pratensis
- Effects of organic materials on soil bacterial community structure in long-term continuous cropping of tomato in greenhouse
- Effects of soil treated fungicide fluopimomide on tomato (Solanum lycopersicum L.) disease control and plant growth
- Prevalence of Yersinia pestis among rodents captured in a semi-arid tropical ecosystem of south-western Zimbabwe
- Effects of irrigation and nitrogen fertilization on mitigating salt-induced Na+ toxicity and sustaining sea rice growth
- Bioengineering and Biotechnology
- Poly-l-lysine-caused cell adhesion induces pyroptosis in THP-1 monocytes
- Development of alkaline phosphatase-scFv and its use for one-step enzyme-linked immunosorbent assay for His-tagged protein detection
- Development and validation of a predictive model for immune-related genes in patients with tongue squamous cell carcinoma
- Agriculture
- Effects of chemical-based fertilizer replacement with biochar-based fertilizer on albic soil nutrient content and maize yield
- Genome-wide identification and expression analysis of CPP-like gene family in Triticum aestivum L. under different hormone and stress conditions
- Agronomic and economic performance of mung bean (Vigna radiata L.) varieties in response to rates of blended NPS fertilizer in Kindo Koysha district, Southern Ethiopia
- Influence of furrow irrigation regime on the yield and water consumption indicators of winter wheat based on a multi-level fuzzy comprehensive evaluation
- Discovery of exercise-related genes and pathway analysis based on comparative genomes of Mongolian originated Abaga and Wushen horse
- Lessons from integrated seasonal forecast-crop modelling in Africa: A systematic review
- Evolution trend of soil fertility in tobacco-planting area of Chenzhou, Hunan Province, China
- Animal Sciences
- Morphological and molecular characterization of Tatera indica Hardwicke 1807 (Rodentia: Muridae) from Pothwar, Pakistan
- Research on meat quality of Qianhua Mutton Merino sheep and Small-tail Han sheep
- SI: A Scientific Memoir
- Suggestions on leading an academic research laboratory group
- My scientific genealogy and the Toronto ACDC Laboratory, 1988–2022
- Erratum
- Erratum to “Changes of immune cells in patients with hepatocellular carcinoma treated by radiofrequency ablation and hepatectomy, a pilot study”
- Erratum to “A two-microRNA signature predicts the progression of male thyroid cancer”
- Retraction
- Retraction of “Lidocaine has antitumor effect on hepatocellular carcinoma via the circ_DYNC1H1/miR-520a-3p/USP14 axis”