
Informatic analysis of the pulmonary microecology in non-cystic fibrosis bronchiectasis at three different stages
-
Yuchao Wang
 and
Xiaohong Yang
and
Xiaohong Yang

Abstract
This study explored the impact of pulmonary microecological changes on disease progression in non-cystic fibrosis bronchiectasis (nCFB). A careful search of the NCBI BioProject database revealed the 16S rRNA-based microbiological testing results of 441 pulmonary sputum samples from patients in the relatively stable (baseline), acute exacerbation, or recovery stage. After preliminary analysis and screening, we selected 152 samples for further analyses, including determination of the operational taxonomic unit (OTU) distribution at the phylum, class, order, family and genus levels, community structure, alpha diversity, beta diversity, microbial multivariables, correlations, and community structure after the abundances of intragroup samples were averaged. The recovery group showed significant differences in pulmonary microbiological changes (P < 0.05) compared with the other groups. There were 30 differentially abundant OTUs, with 27 and 7 at the genus and phylum levels, respectively. The Chao1 value of the recovery group was comparable to that of the baseline group, and the Shannon and Simpson values of the recovery group were the highest. Rhodococcus in Actinobacteria was positively correlated with Ochrobactrum in Firmicutes. The differences in pulmonary microecological changes at different nCFB stages may serve as a biologically predictive indicator of nCFB progression.
1 Introduction
Non-cystic fibrosis bronchiectasis (nCFB) is a chronic pulmonary disease characterized pathologically by permanent dilation and chronic inflammation of the bronchi and bronchioles and clinically by chronic progressive cough and hemoptysis dyspnoea and exacerbated recurrent infection [1]. It is the final common pathway through which various inflammatory, hereditary, autoimmune, developmental, and allergic diseases funnel [2,3,4,5,6]. Compared to patients without nCFB, those with nCFB have higher all-cause-, respiratory- and lung cancer-related mortalities. nCFB has brought a heavy economic burden to the medical system and is becoming a new-type chronic pandemic disease [7,8,9,10,11].
In patients with nCFB, core species exist in the pulmonary microecology, such as Pseudomonas aeruginosa, Haemophilus influenzae, and Streptococcus pneumoniae; these microorganisms may be associated with decreased pulmonary function and pathological reoccurrence and aggravation in these patients [12]. According to a cross-sectional study [13], pulmonary microecology is associated with disease progression in nCFB patients. This association is influenced by multiple mixed variables, particularly the disease phenotypes, antibiotic use, age, and sex of the patients; moreover, the effect of antibiotics on the pulmonary microecology of patients with nCFB varies according to the type, administration frequency, and duration of use of the antibiotics [13].
Based on the context mentioned above, we reanalyzed the raw 16S rRNA-based data regarding the pulmonary microecology in nCFB and investigated the progressive changes in the pulmonary microecology in patients with nCFB at different stages based on informatic analyses.
2 Materials and methods
2.1 Data collection
To perform the current longitudinal analysis, we performed a thorough search across the NCBI BioProject database (https://www.ncbi.nlm.nih.gov/bioproject/), with “bronchiectasis” as the keyword. A total of 42 results were obtained. Then, screening was performed according to the detailed information of each dataset: 11 datasets were removed due to their focus on a single disease stage, 16 were removed due to their focus on the association of single bacterial species (Pseudomonas aeruginosa, Staphylococcus aureus, Mycobacterium, and so on) with the disease, 2 were excluded due to the lack of raw data, and 9 were excluded due to being unsuitable for analysis (lack of specific grouping information, data platforms unsuitable for analysis, insufficient sample size, and so on). Finally, four datasets were selected.
2.2 Grouping
The four datasets were merged, and the involved patients were divided into the baseline group, the acute exacerbation group, and the recovery group. In the baseline group, slight aggravation of clinical symptoms was allowed, and antibiotic use had not occurred in the previous 30 days. In the exacerbation group, the diagnosis was made by specialists who also prescribed intravenous or oral antibiotics, and sputum was sampled before antibiotic use. The recovery group included patients who had terminated antibiotic use at least 1 month prior. The total number of selected samples was 454 from three refs [13–15]. For the sake of comparability among the samples in terms of different observational indices, 7 samples were excluded from the recovery group for weak correlation according to correlation analysis, and 18 and 186 were excluded from the exacerbation group and the baseline group, respectively, according to correlation analysis, clustering analysis, and principal component analysis. Eventually, the baseline group contained 60 cases, the exacerbation group contained 45 cases, and the recovery group included 48 cases.
The baseline data of the three groups are summarized in Table 1.
Baseline data of the three groups
| Index | Stratification | B (n = 60) | E (n = 45) | R (n = 48) | P |
|---|---|---|---|---|---|
| Age | 58.25 ± 14.204 | 59.28 ± 10.710 | 58.09 ± 14.373 | 0.935 | |
| FEV1 (% predicted) | 66.87 ± 23.985 | 63.36 ± 25.559 | 69.16 ± 24.344 | 0.636 | |
| BMI class (%) | Normal | 29 (48.3) | 22 (48.9) | 31 (64.6) | 0.722 |
| Obesity | 3 (5) | 6 (13.3) | 4 (8.3) | ||
| Underweight | 28 (46.7) | 17 (37.8) | 13 (27.1) | ||
| Sex (%) | Female | 38 (63.3) | 34 (75.6) | 35 (72.9) | 0.839 |
| Male | 22 (36.7) | 11 (24.4) | 13 (27.1) | ||
| Cause (%) | PCD | 8 (13.3) | 4 (8.9) | 7 (14.6) | 0.36 |
| Immunodeficiency | 1 (1.7) | 1 (2.2) | 0 (0.0) | ||
| Idiopathic | 27 (45.0) | 17 (37.8) | 28 (58.3) | ||
| ABPA | 5 (8.3) | 11 (24.4) | 7 (14.6) | ||
| Postinfection | 18 (30.0) | 12 (26.7) | 6 (12.5) | ||
| Smoking (%) | N | 42 (70) | 28 (62.2) | 32 (66.7) | 0.417 |
| Y | 18 (30) | 17 (37.8) | 16 (33.3) |
Note: B, baseline; E, exacerbation; R, recovery; BMI, body mass index; ABPA, allergic bronchopulmonary aspergillosis; PCD, primary ciliary dyskinesia (Kartagener syndrome); FEV1, Forced Expiratory Volume In 1s.
2.3 Statistical analysis
Vsearch (version 2.4.2) was used for operational taxonomic unit (OTU) classification [16]. After quality control, high-quality sequences (valid tags) were applied for OTU classification according to a sequence similarity threshold of 97%. The sequence with the maximum abundance in each OTU was taken as the representative sequence of the OTU. The obtained sequence was compared with the descriptions in the database and then annotated using the RDP classifier naive Bayesian classification algorithm [17] to obtain the annotation information of the corresponding OTU. According to the number of sequences for each OTU in each sample, an abundance matrix of the OTUs in each sample (otu_table.biom) was constructed. Based on sequence comparison, the phylogeny of the representative sequences of the OTUs was constructed with PyNAST (v0.1) software [18] and a phylogenetic tree file (rep_phylo.tre) was obtained. According to the principle of minimum depth, all the samples were randomly selected to obtain an OTU table (otu_table_even.biom). The number of tags in each sample that was integrated into the OTU table was calculated, and the abundance of each OTU in each sample was determined (Figure 1).
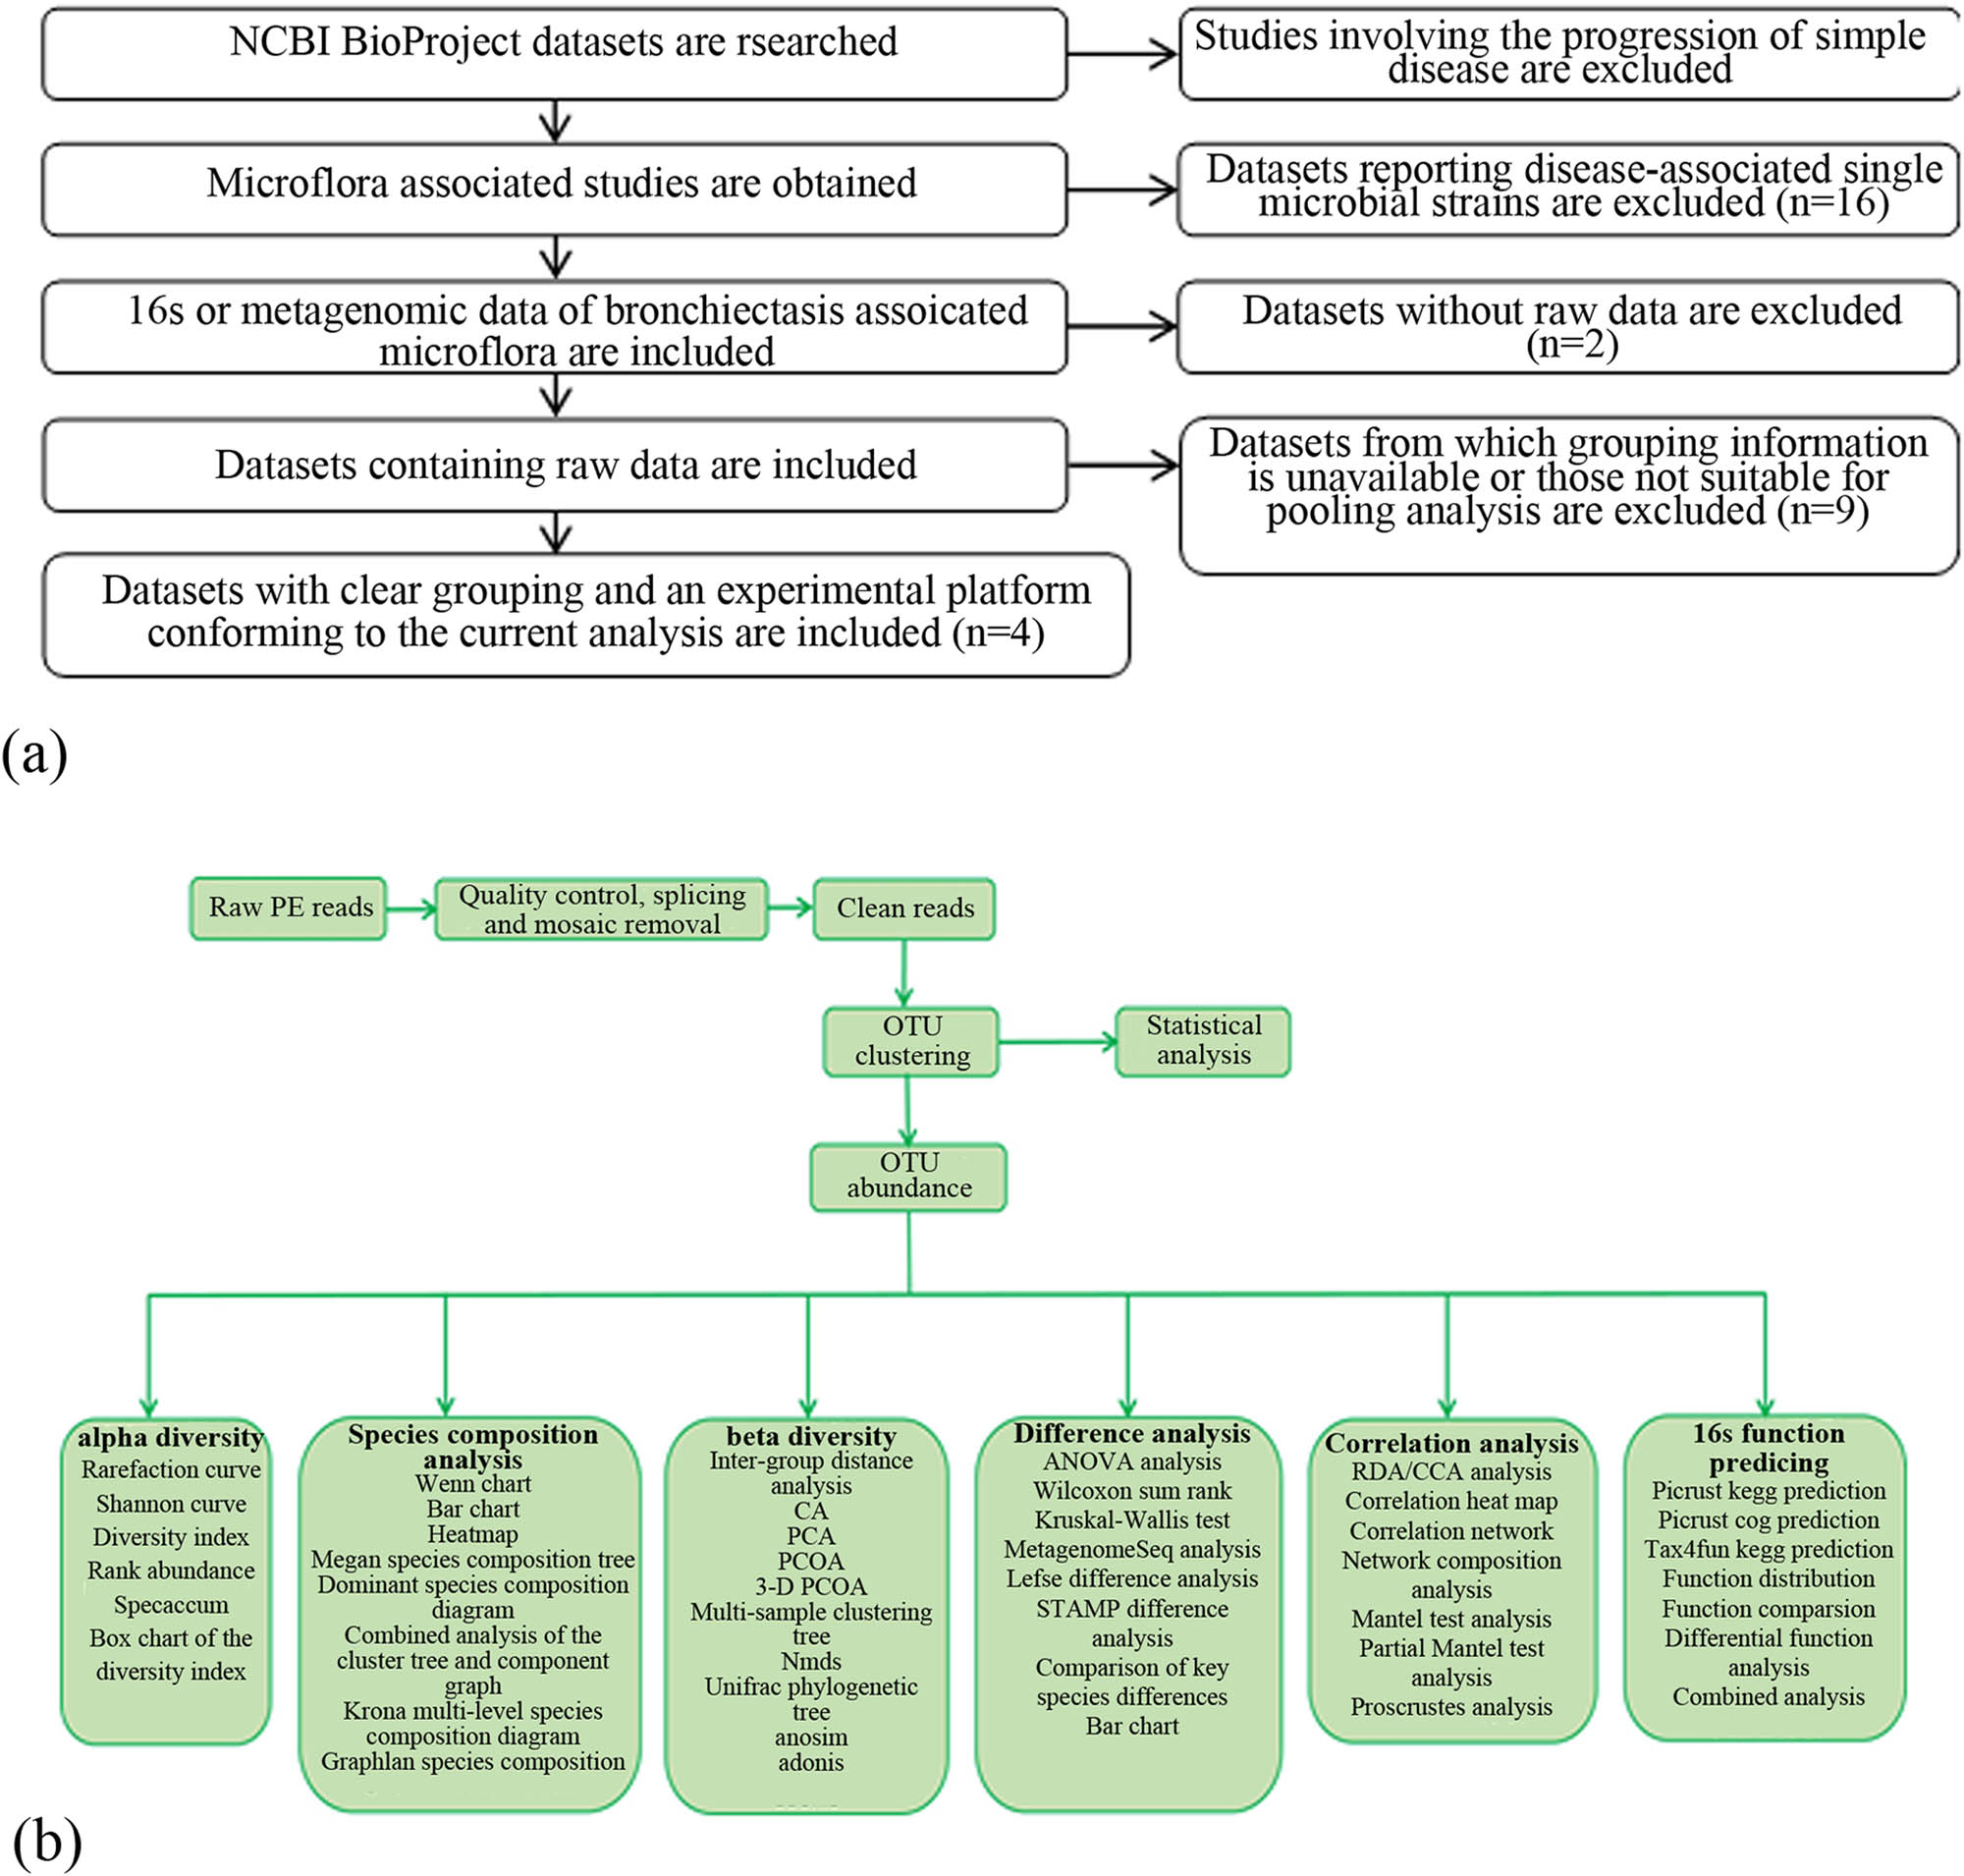
The flow diagram of the study design. (a) sample screening route; (b) informatic analysis route.
Data were analyzed using SPSS 25.0. For continuous variables with a normal distribution, analysis of variance (ANOVA) was used to compare among groups, and for those with abnormal distribution, nonparametric Kruskal–Wallis ANOVA was used. Count data are presented as the number (percentage) and were tested using the chi-square method. A difference with P < 0.05 was considered to be statistically significant.
3 Results
3.1 Flora structure
According to the OTU annotation outcomes, a number of the OTUs corresponded to the same genus or species. The classification outcomes were pooled, and the relative abundances of the samples at different levels were obtained (Figures 2 and 3). At the phylum level, the top ten microorganisms were Firmicutes, Proteobacteria, Bacteroidetes, Actinobacteria, Fusobacteria, Spirochaetes, Tenericutes, Cyanobacteria, TM7, and Synergistetes. At the genus level, the top ten microorganisms were Streptococcus, Pseudomonas, Haemophilus, Prevotella, Neisseria, Veillonella, Rothia, Granulicatella, Gemella, and Fusobacterium. Due to the lack of raw data in some samples, we did not perform analysis at the species level.
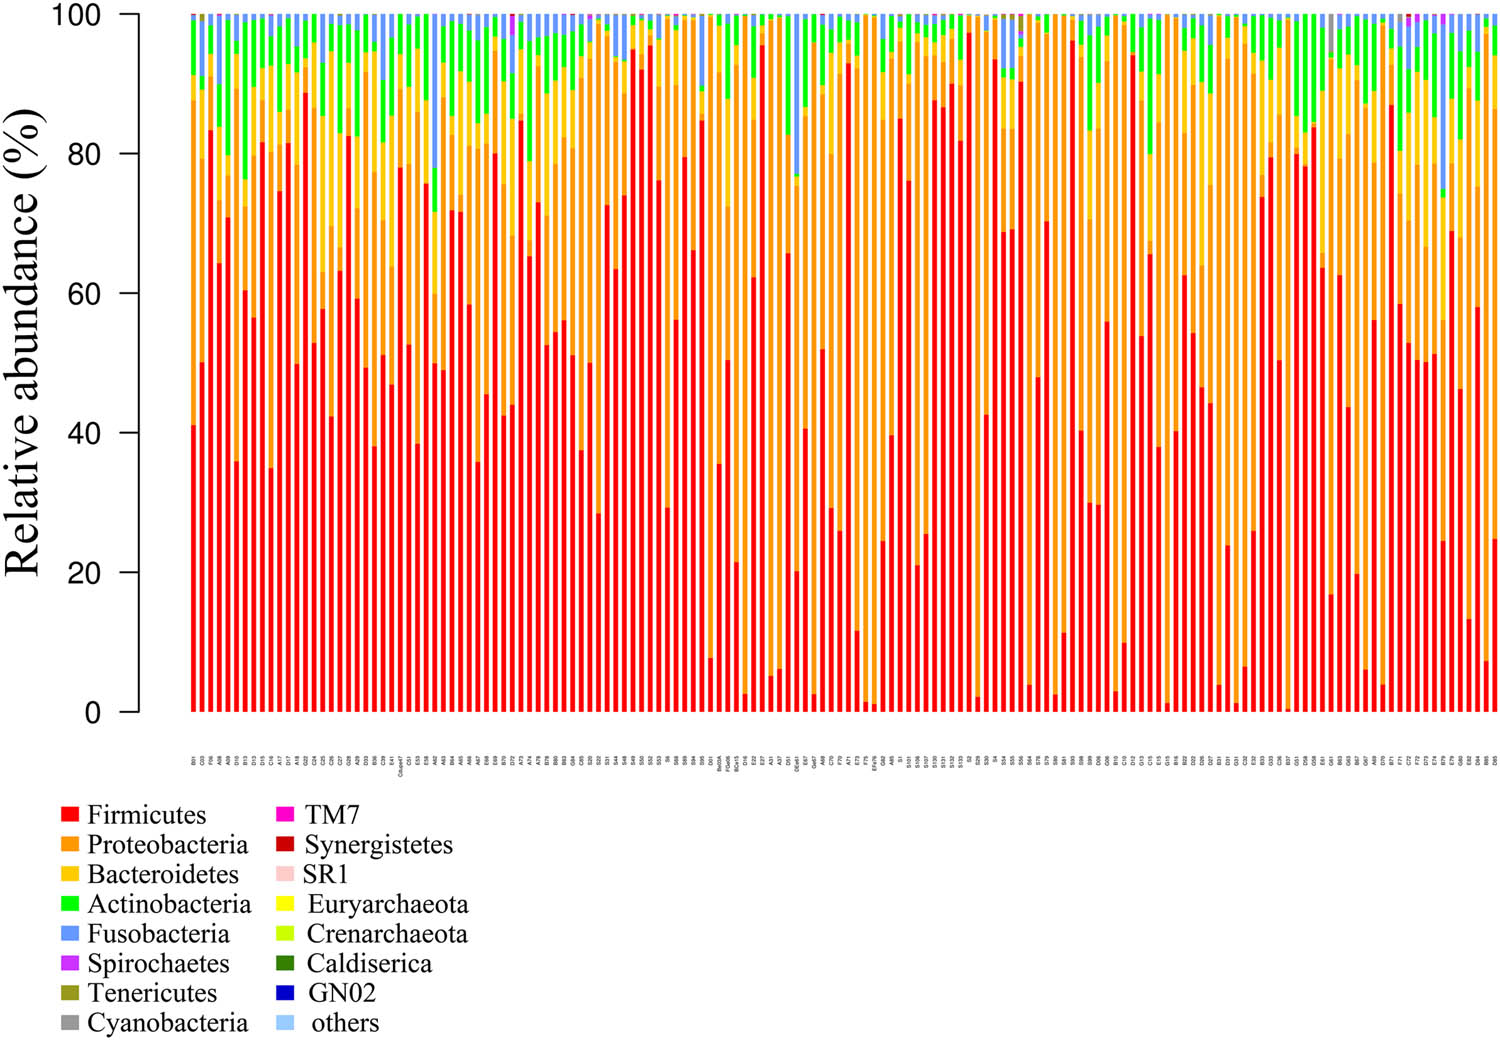
Histogram of the flora structure of the samples (top 15).
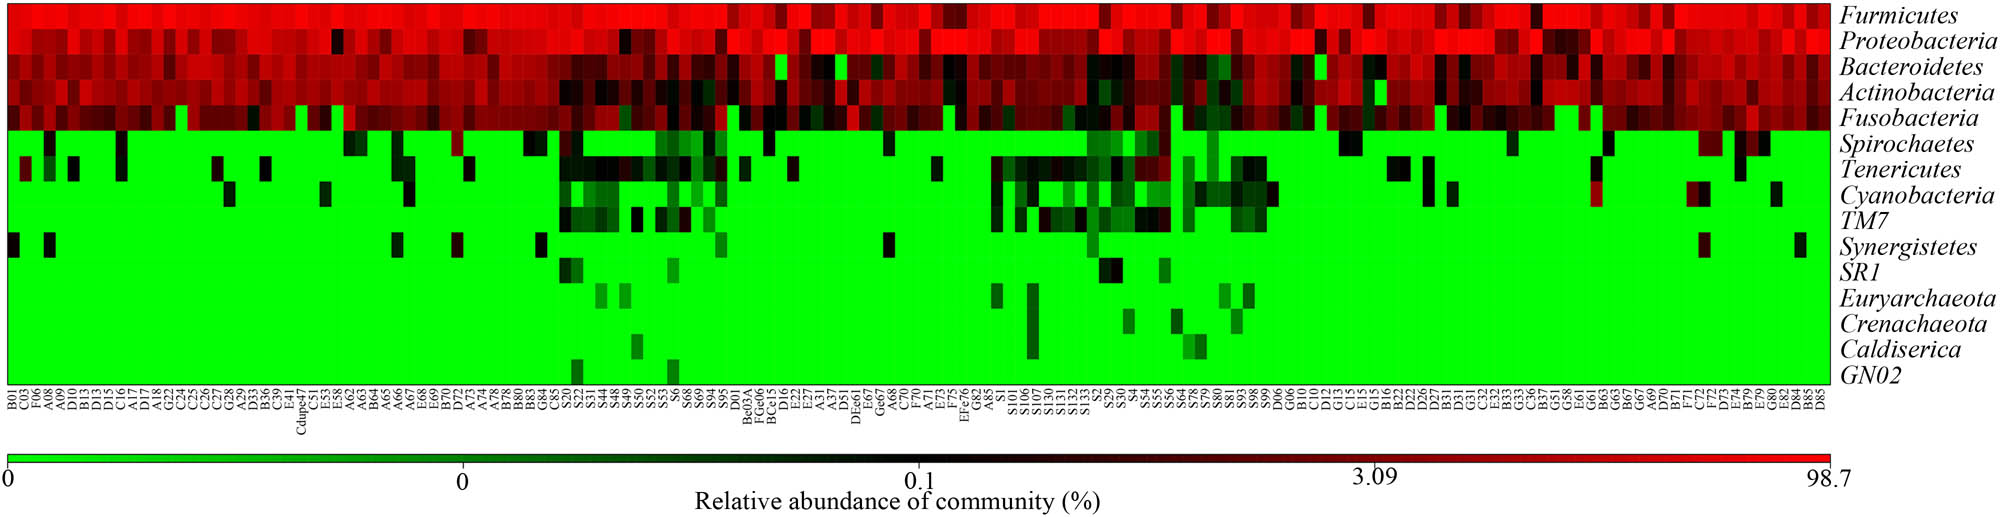
Heatmap based on relative abundances (top 15).
3.2 Alpha diversity
To compare the diversities among the samples, we normalized sampling depths before analysis. Alpha diversity analysis showed that the coverage of all the samples approached 1. The three groups showed significant differences in alpha diversity. The Chao1 value of the recovery group was close to that of the baseline group. In addition, the Shannon (3.74213) and Simpson (0.836411) values of the recovery group were the highest among the three groups. Compared to the baseline group, the recovery group did not show significant differences in terms of the Chao1, Goods coverage, observed species, and Shannon and Simpson indices (P = 0.452, 0.343, 0.179, 0.110, and 0.071, respectively). However, the acute exacerbation group showed significant differences in these indices compared to any of the remaining groups (P < 0.05). The results are summarized in Table 2.
Alpha diversities of the three groups
| Group | Chao1 | Goods coverage | Observed species | Shannon | Simpson |
|---|---|---|---|---|---|
| B | 90.30403* | 0.989453* | 61.8* | 2.796442* | 0.672084* |
| E | 71.56429** | 0.990647** | 50.6** | 2.753378** | 0.738157** |
| R | 85.14293 | 0.992488 | 71.1 | 3.74213 | 0.836411 |
| F | 10.068 | 11.754 | 11.661 | 11.102 | 10.435 |
| P | 0.000 | 0.000 | 0.000 | 0.000 | 0.000 |
Note: *P < 0.001, B vs E; **P = 0.001, E vs R. B, baseline; E, exacerbation; R, recovery.
Violin analyses showed that the alpha diversity of the acute exacerbation group was significantly different from that of the remaining groups, particularly the baseline group. No significant difference was observed between the baseline and recovery groups (Figure 4).
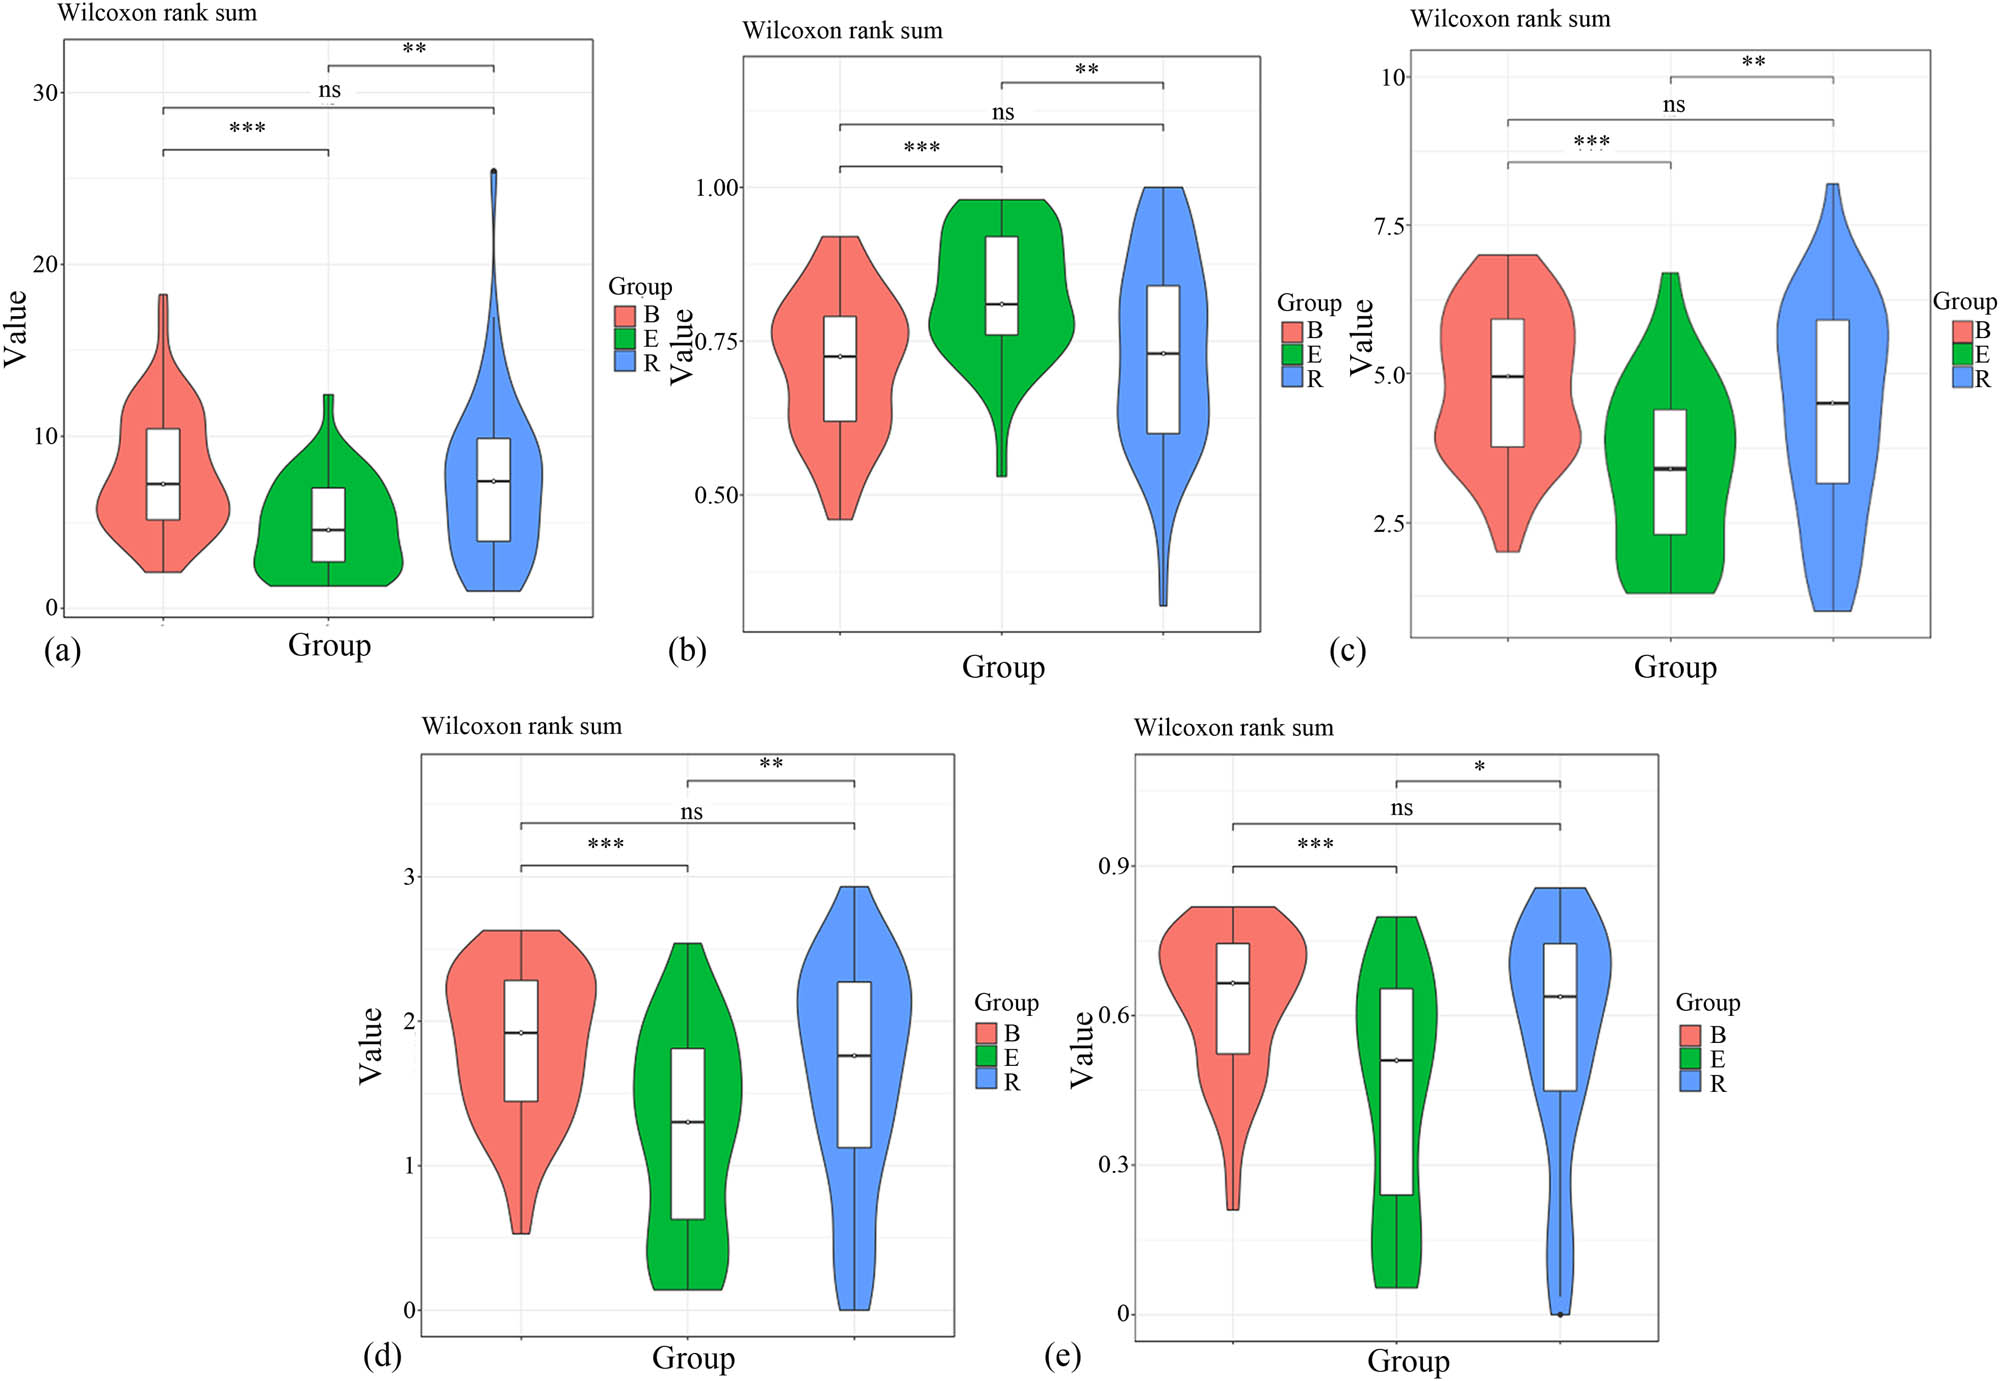
Violin plots of the alpha diversities of the three groups. (a) Chao1 violin. (b) Goods coverage violin. (c) Observed species violin. (d) Shannon violin. (e) Simpson violin. *P < 0.05, **P < 0.01, and ***P < 0.001, ns, no significant difference.
3.3 Principal component analysis (PCA) and nonmetric multidimensional scaling (NMDS) analysis of beta diversity
In this study, all the samples were from patients with nCFB, and therefore, the sample compositions of the three groups were similar. Nevertheless, the acute exacerbation group exhibited a large difference compared with the remaining groups, whereas the difference between the baseline and recovery groups was noticeable (Figure 5).
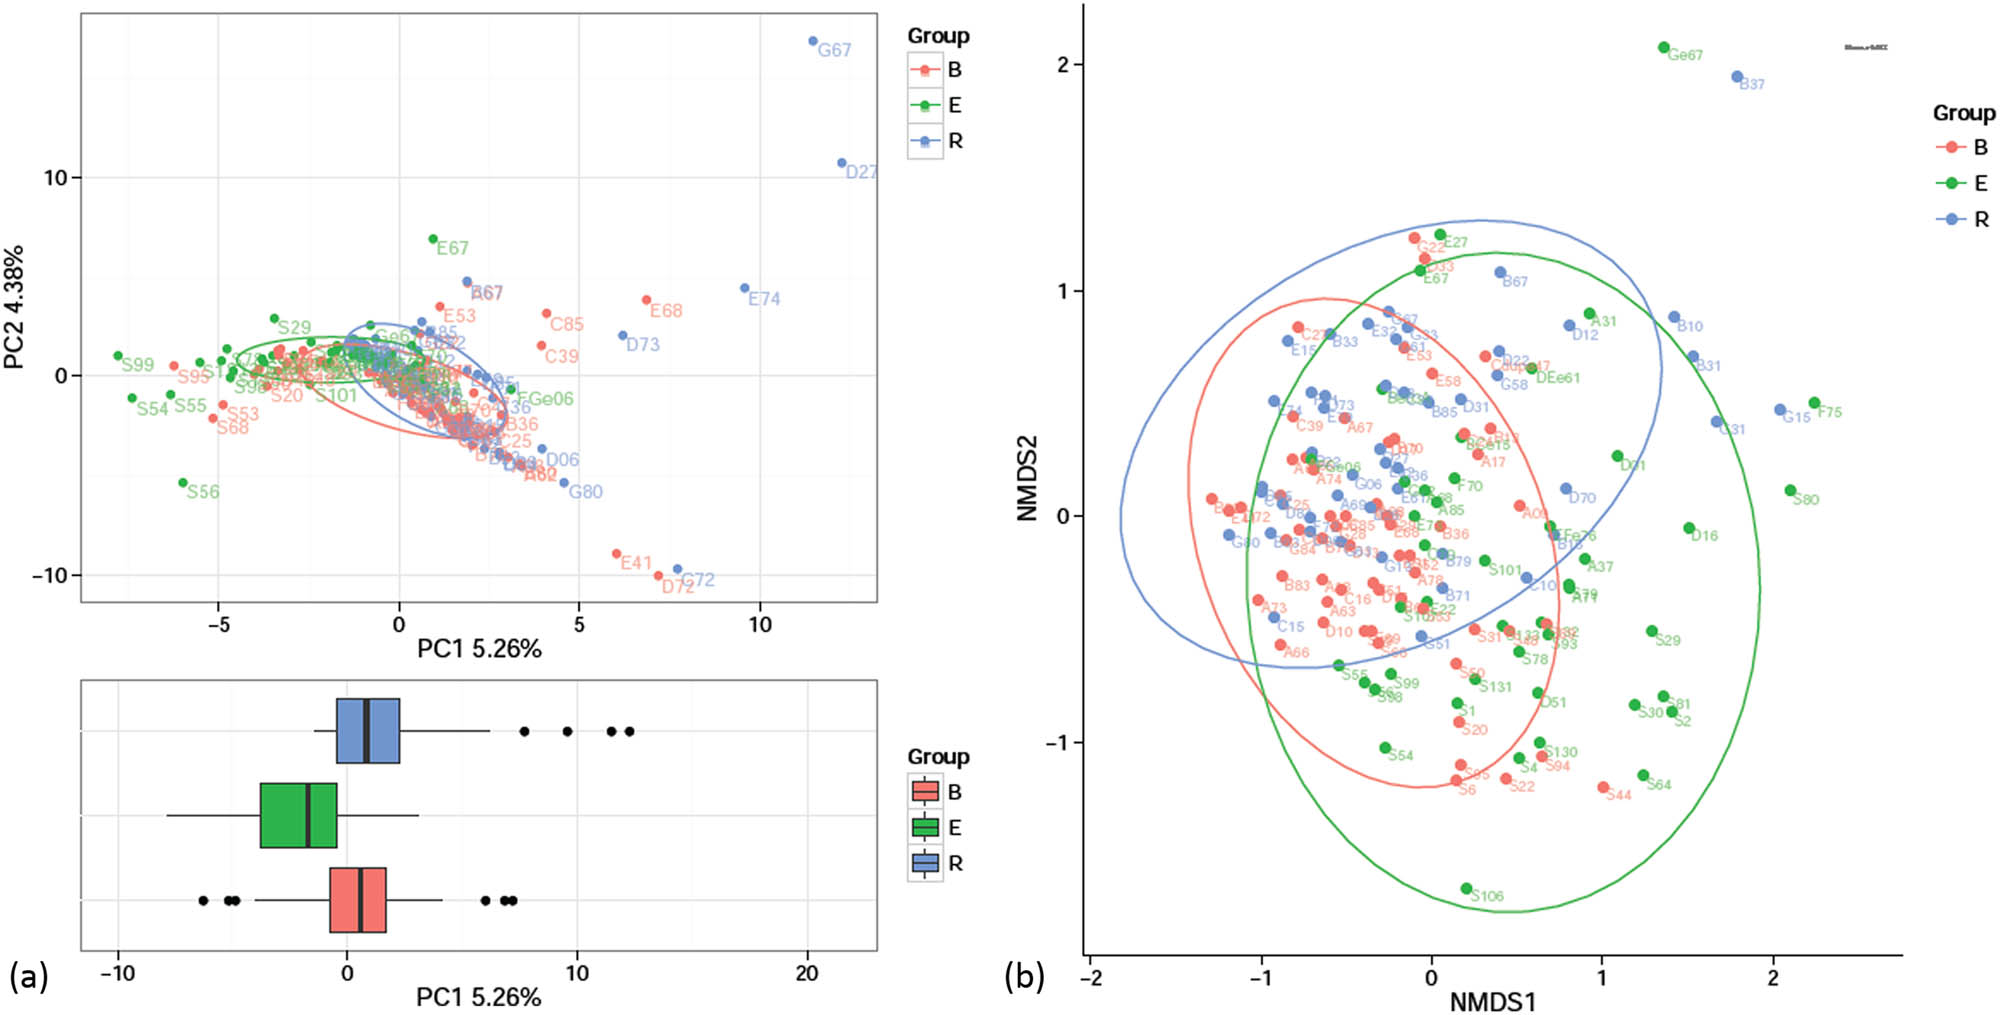
Analysis of the beta diversities of the three groups. (a) PCA: the axes indicate two or three eigenvalues that maximally reflect the variances. (b) NMDS analysis: the horizontal axis (NMDS1) and the longitudinal axis (NMDS2) are two ordering axes. In both panels, each point represents one sample, and the points of the same color indicate the same group. Similar samples were gathered together, and two samples with a large difference were distant from each other.
3.4 Multivariable analysis of the microorganisms
Adonis (i.e., PERMANOVA) analysis and ANOSIM were used to test possible significant differences among the groups.
3.4.1 Differences among the groups
The three groups showed 30 significantly differentially abundant OTUs. At the phylum level, there were seven OTUs with significantly differential abundances, including Firmicutes, Proteus, Bacteroides, Actinomycetes, Fusobacteria, Tenericutes, and Spirochetes (the dominant flora constituents were mainly included in the first five phyla). At the genus level, the number of OTUs with a significantly differential abundance was 27. However, due to a partial lack of raw data, an analysis at the species level was not completed (Table 3).
OTUs with significantly differential abundances at different levels
| Method | OTU | Phylum | Class | Order | Family | Genus | Species |
|---|---|---|---|---|---|---|---|
| ANOVA | 30 | 7 | 13 | 17 | 26 | 27 | 8 |
| Kruskal–Wallis | 52 | 8 | 18 | 24 | 33 | 47 | 20 |
3.4.2 Differentially abundant genera
After analyzing the differentially abundant taxa at different levels, we selected the taxa with the top seven abundances for boxplot analysis to obtain the intragroup abundance and intergroup comparison outcomes of the dominant differentially abundant taxa. The three groups exhibited significant differences in the abundances and diversities of the phyla Bacteroides (P = 1.66 × 10−05), Firmicutes (P = 0.0003899), and Actinomycetes (P = 0.004875), and increased abundances and diversities of Proteus (P = 2.12 × 10−05), Crenarchaeota (P = 0.02058), Euryarchaeota (P = 0.022601), and TM7 (P = 0.02594) (Table 4). At the genus level, the acute exacerbation group exhibited noticeably decreased abundances and diversities of Burkholderia, Prevotella, Oribacterium, Neisseria, Veillonella, Leptotrichia, Actinomycetes, Mesorhizobium, Bacteroides, Megacocci, Mirabilis, Scardovia, Aminobacilli, and Micromonospora compared with those in the remaining groups. The abundances and diversities of Burkholderia, Pseudomonas, Streptococcus granulosus, Nicoletella, Haemophilus, Bulletidia, and Staphylococcus noticeably increased compared with those in the baseline group. The findings at the phylum and genus levels in the recovery group were comparable to those in the baseline group, but the mean abundance value of the genus Pseudomonas (0.246435) was closer to that of the acute exacerbation group (0.247582). It is noteworthy that the average abundances of TM7 and Guangarchaea in the recovery group were zero and that the average abundances of Lactobacillus, Ochrobactrum, Aminobacter, Rhodococcus, and Achromobacter in the recovery group were significantly higher than those in the baseline group (P < 0.001; Figures 6–8).
ANOVA of the abundances and diversities of the microorganisms at the phylum level
| Bacteroidetes | Proteobacteria | Firmicutes | Actinobacteria | Crenarchaeota | TM7 | Euryarchaeota | |
|---|---|---|---|---|---|---|---|
| B-Mean | 0.07817288 | 0.223382312 | 0.6080541 | 0.06078536 | 0 | 8.90 × 10−05 | 5.81 × 10−07 |
| R-Mean | 0.072189358 | 0.426044182 | 0.4196319 | 0.06051731 | 0 | 0 | 0 |
| E-Mean | 0.025787458 | 0.478334768 | 0.4476249 | 0.03230325 | 6.61 × 10−06 | 0.000212 | 6.38 × 10−06 |
| T-Statistic | 11.86259313 | 11.57698109 | 8.2779996 | 5.51846275 | 3.986332099 | 3.742807 | 3.740274967 |
| P | 1.66 × 10−05 | 2.12 × 10−05 | 0.0003899 | 0.00487497 | 0.020581964 | 0.025944 | 0.02600638 |
| Bonferroni_P | 0.000248583 | 0.000318163 | 0.0058489 | 0.07312458 | 0.308729457 | 0.389156 | 0.390095695 |
Note: B, baseline; E, exacerbation; R, recovery.
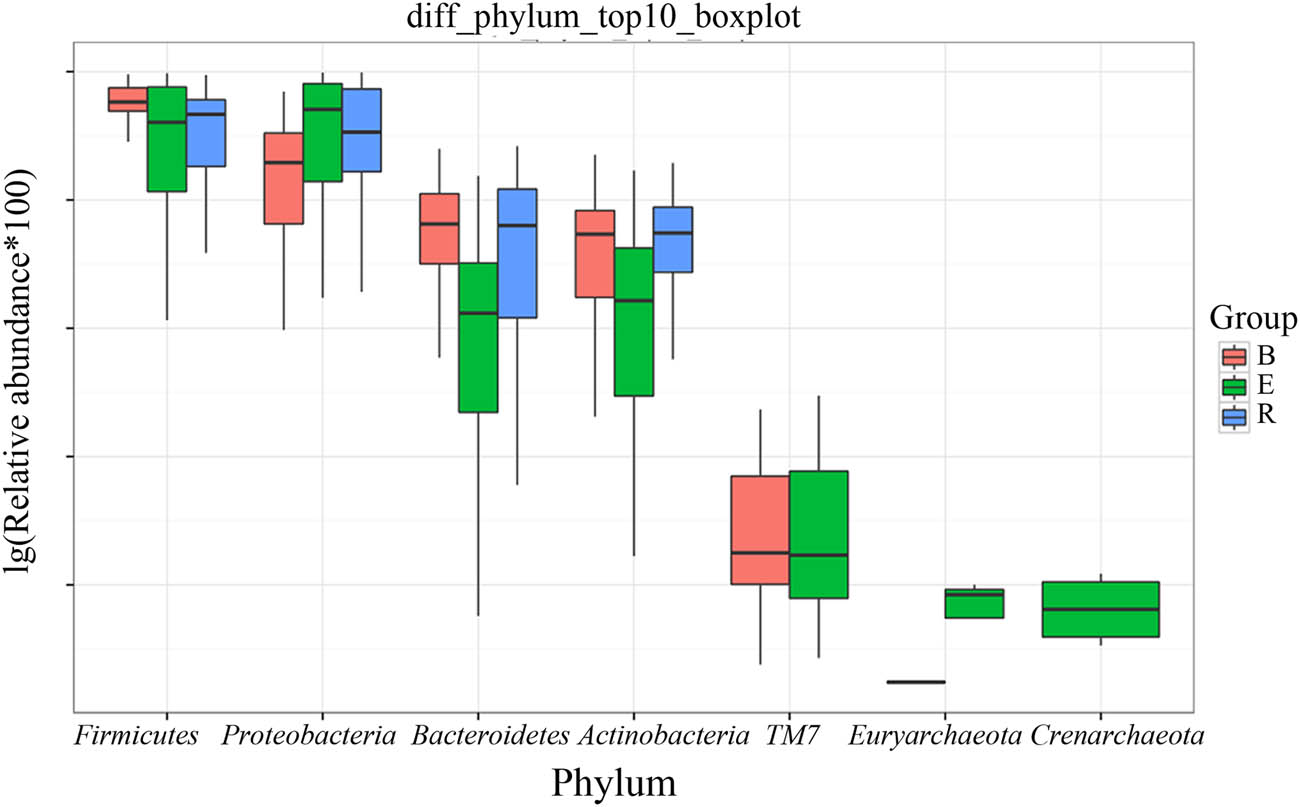
Boxplot of the top 7 phyla among the three groups. B, baseline; E, exacerbation; R, recovery.
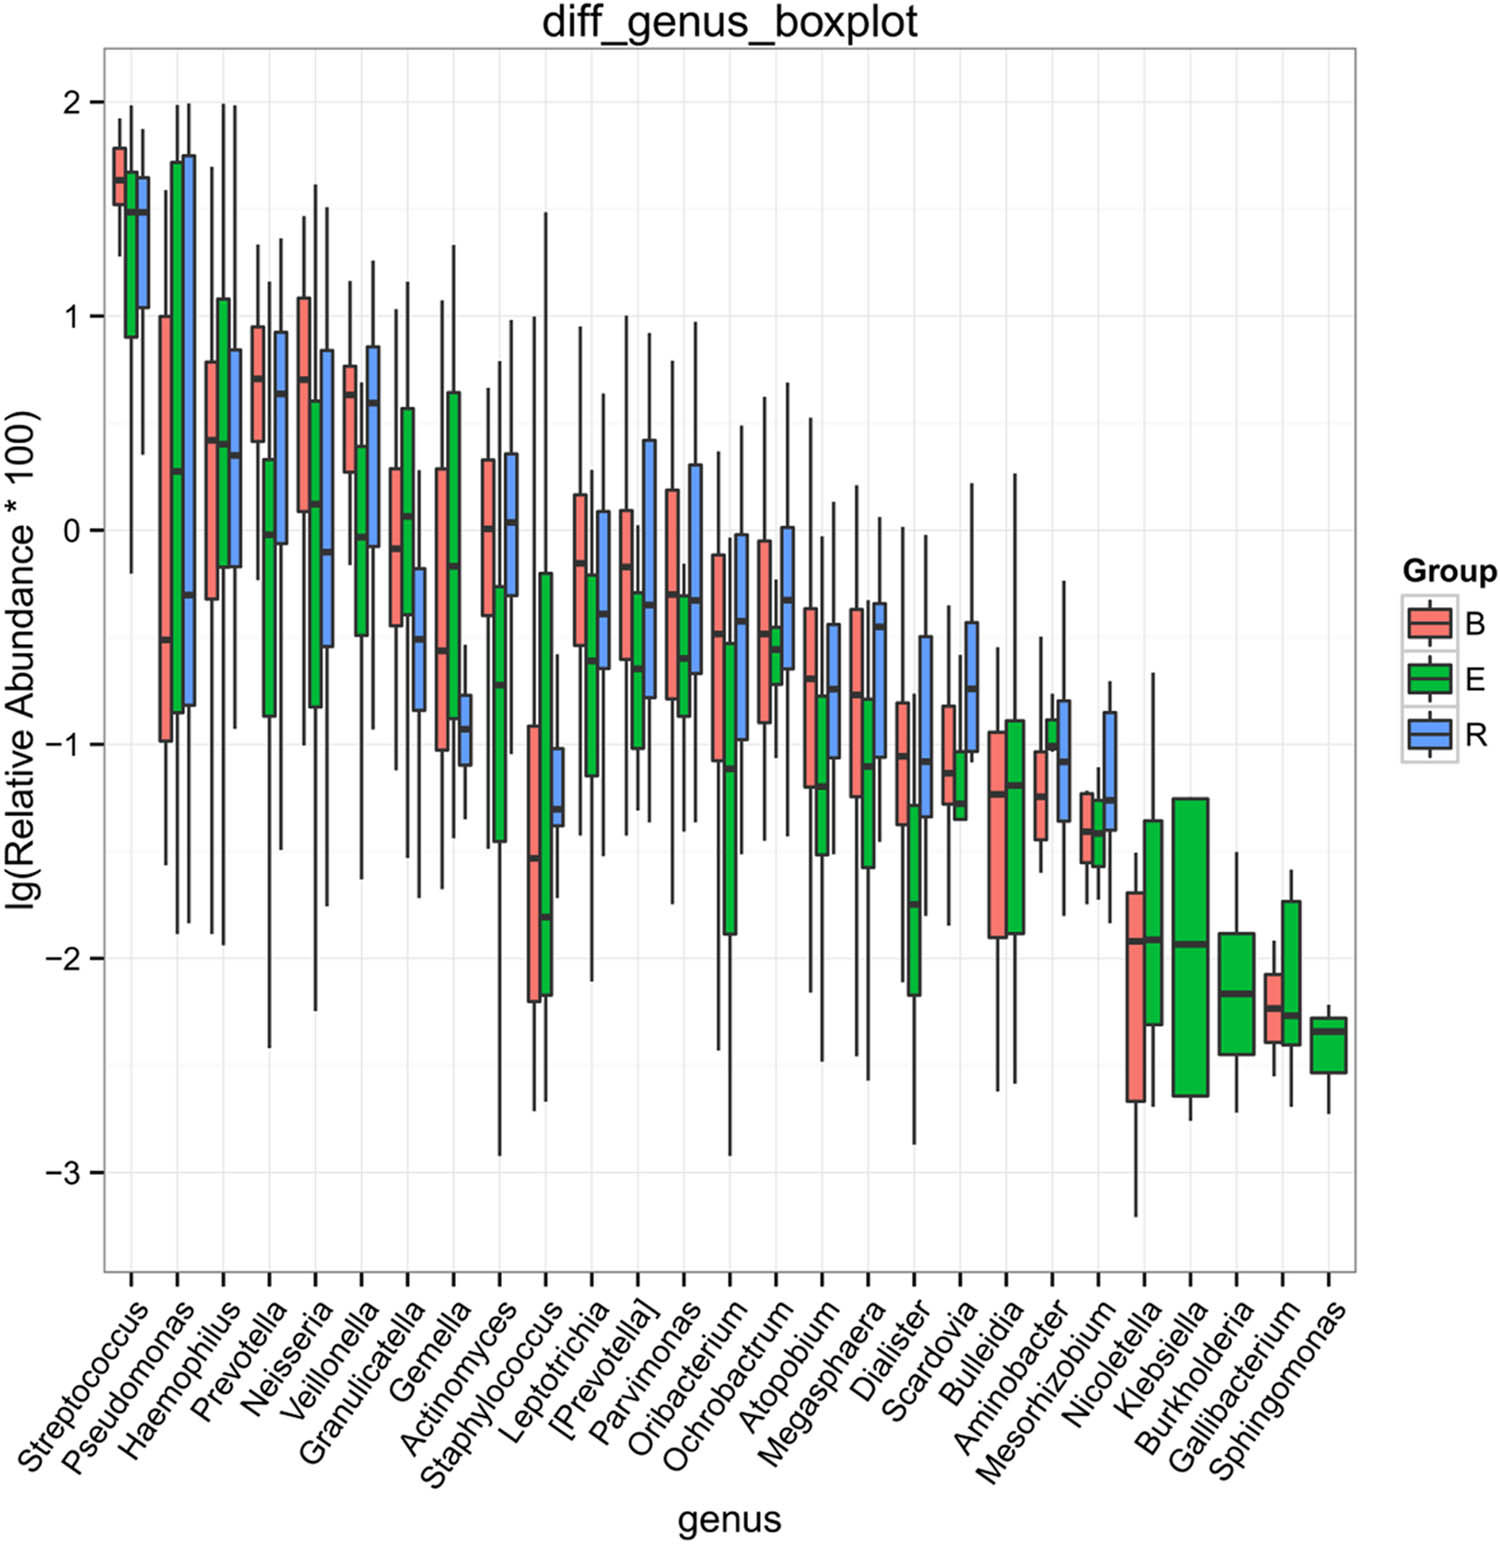
Boxplot of the differentially abundant genera (top 10) among the three groups. B, baseline; E, exacerbation; R, recovery.
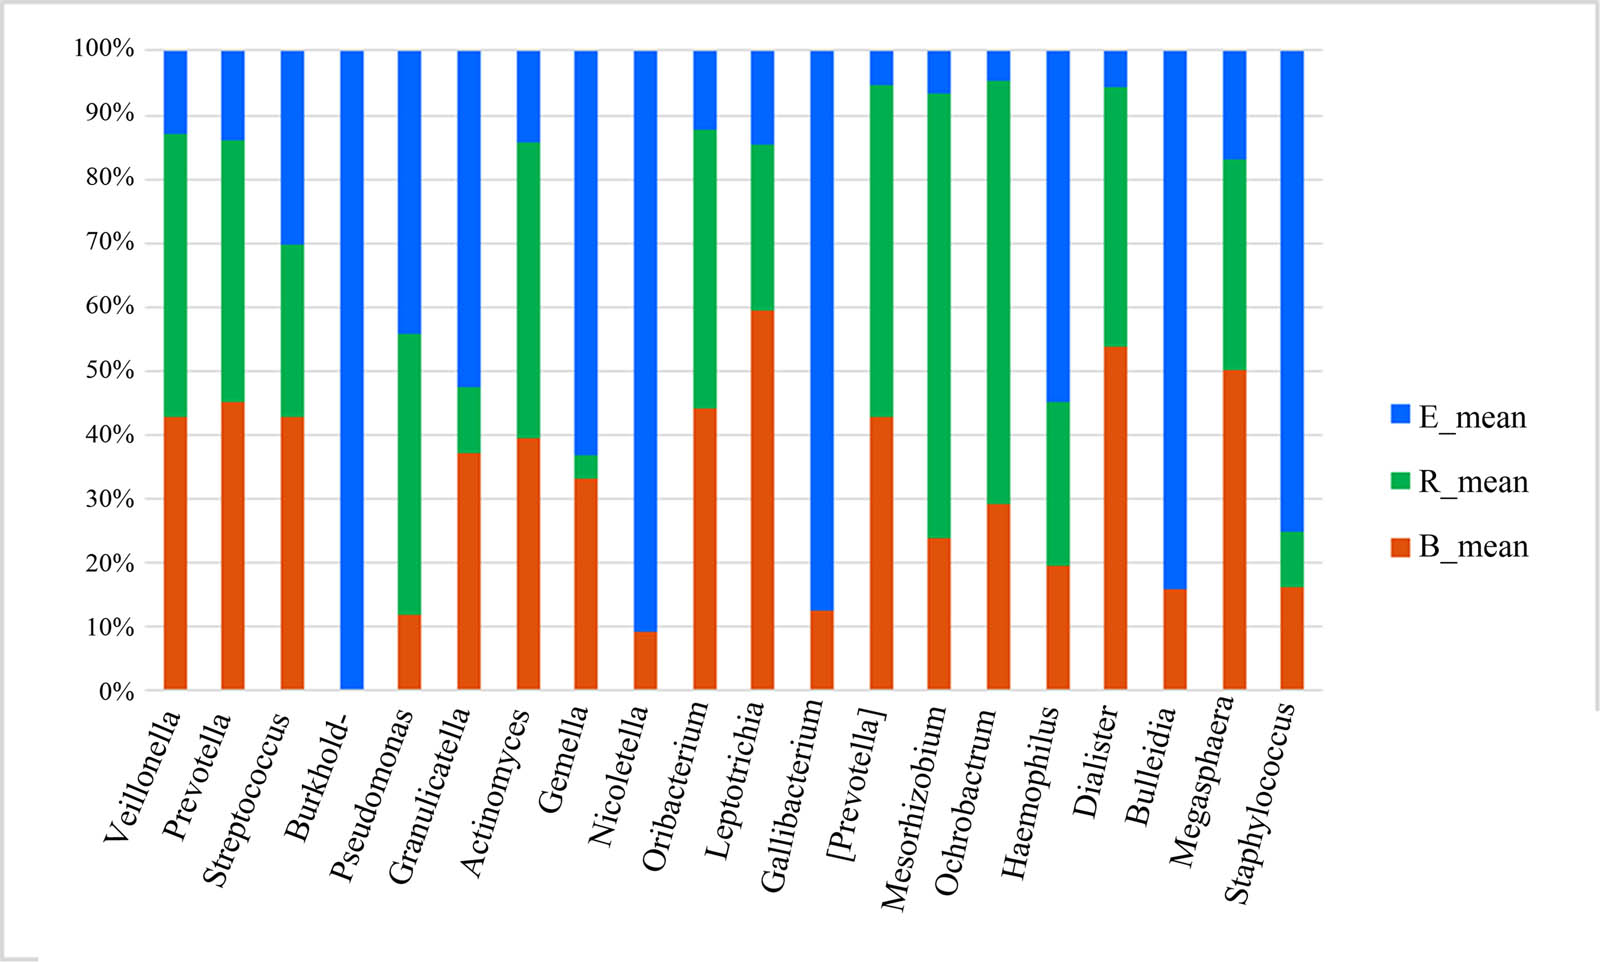
Stacked histogram of the differentially abundant genera among the three groups (percentage). B, baseline; E, exacerbation; R, recovery.
3.4.3 LEfSe analysis
The compositions, annotations, and contributions of the differentially abundant taxa among the three groups and the relative abundances of the differentially abundant taxa in each sample were analyzed. The baseline group exhibited the highest abundance, uniformity, and diversity. The recovery group showed higher uniformity than the acute exacerbation group; however, its abundance and diversity were lower than those of the latter group. Bacillus, Firmicutes, Lactobacillaceae, Streptococcaceae, and Streptococcus had the highest abundances in the baseline group, whereas Epsilonproteobacteria, Mogibacteriaceae, Mogibacterium, Tannerella, Campylobacteraceae, Campylobacter, and Campylobacterales had the lowest abundances. Gammaproteobacteria and Proteobacteria had the highest abundances in the acute exacerbation group, and Capnocytophaga, Flavobacteriales, Azorhizophilus, Mogibacterium, Flavobacteria, Escherichia, Clostridiales FamilyXIII_Incertae Sedis, Flavobacteriaceae, and Nicoletella had the lowest abundances. Pseudomonadales, Pseudomonas, and Pseudomonadaceae had the highest abundances in the recovery group, while Xanthomonadaceae, Xanthomonadales, Stenotrophomonas, Aminobacter, and Mesorhizobium had the lowest abundances (Figure 9).
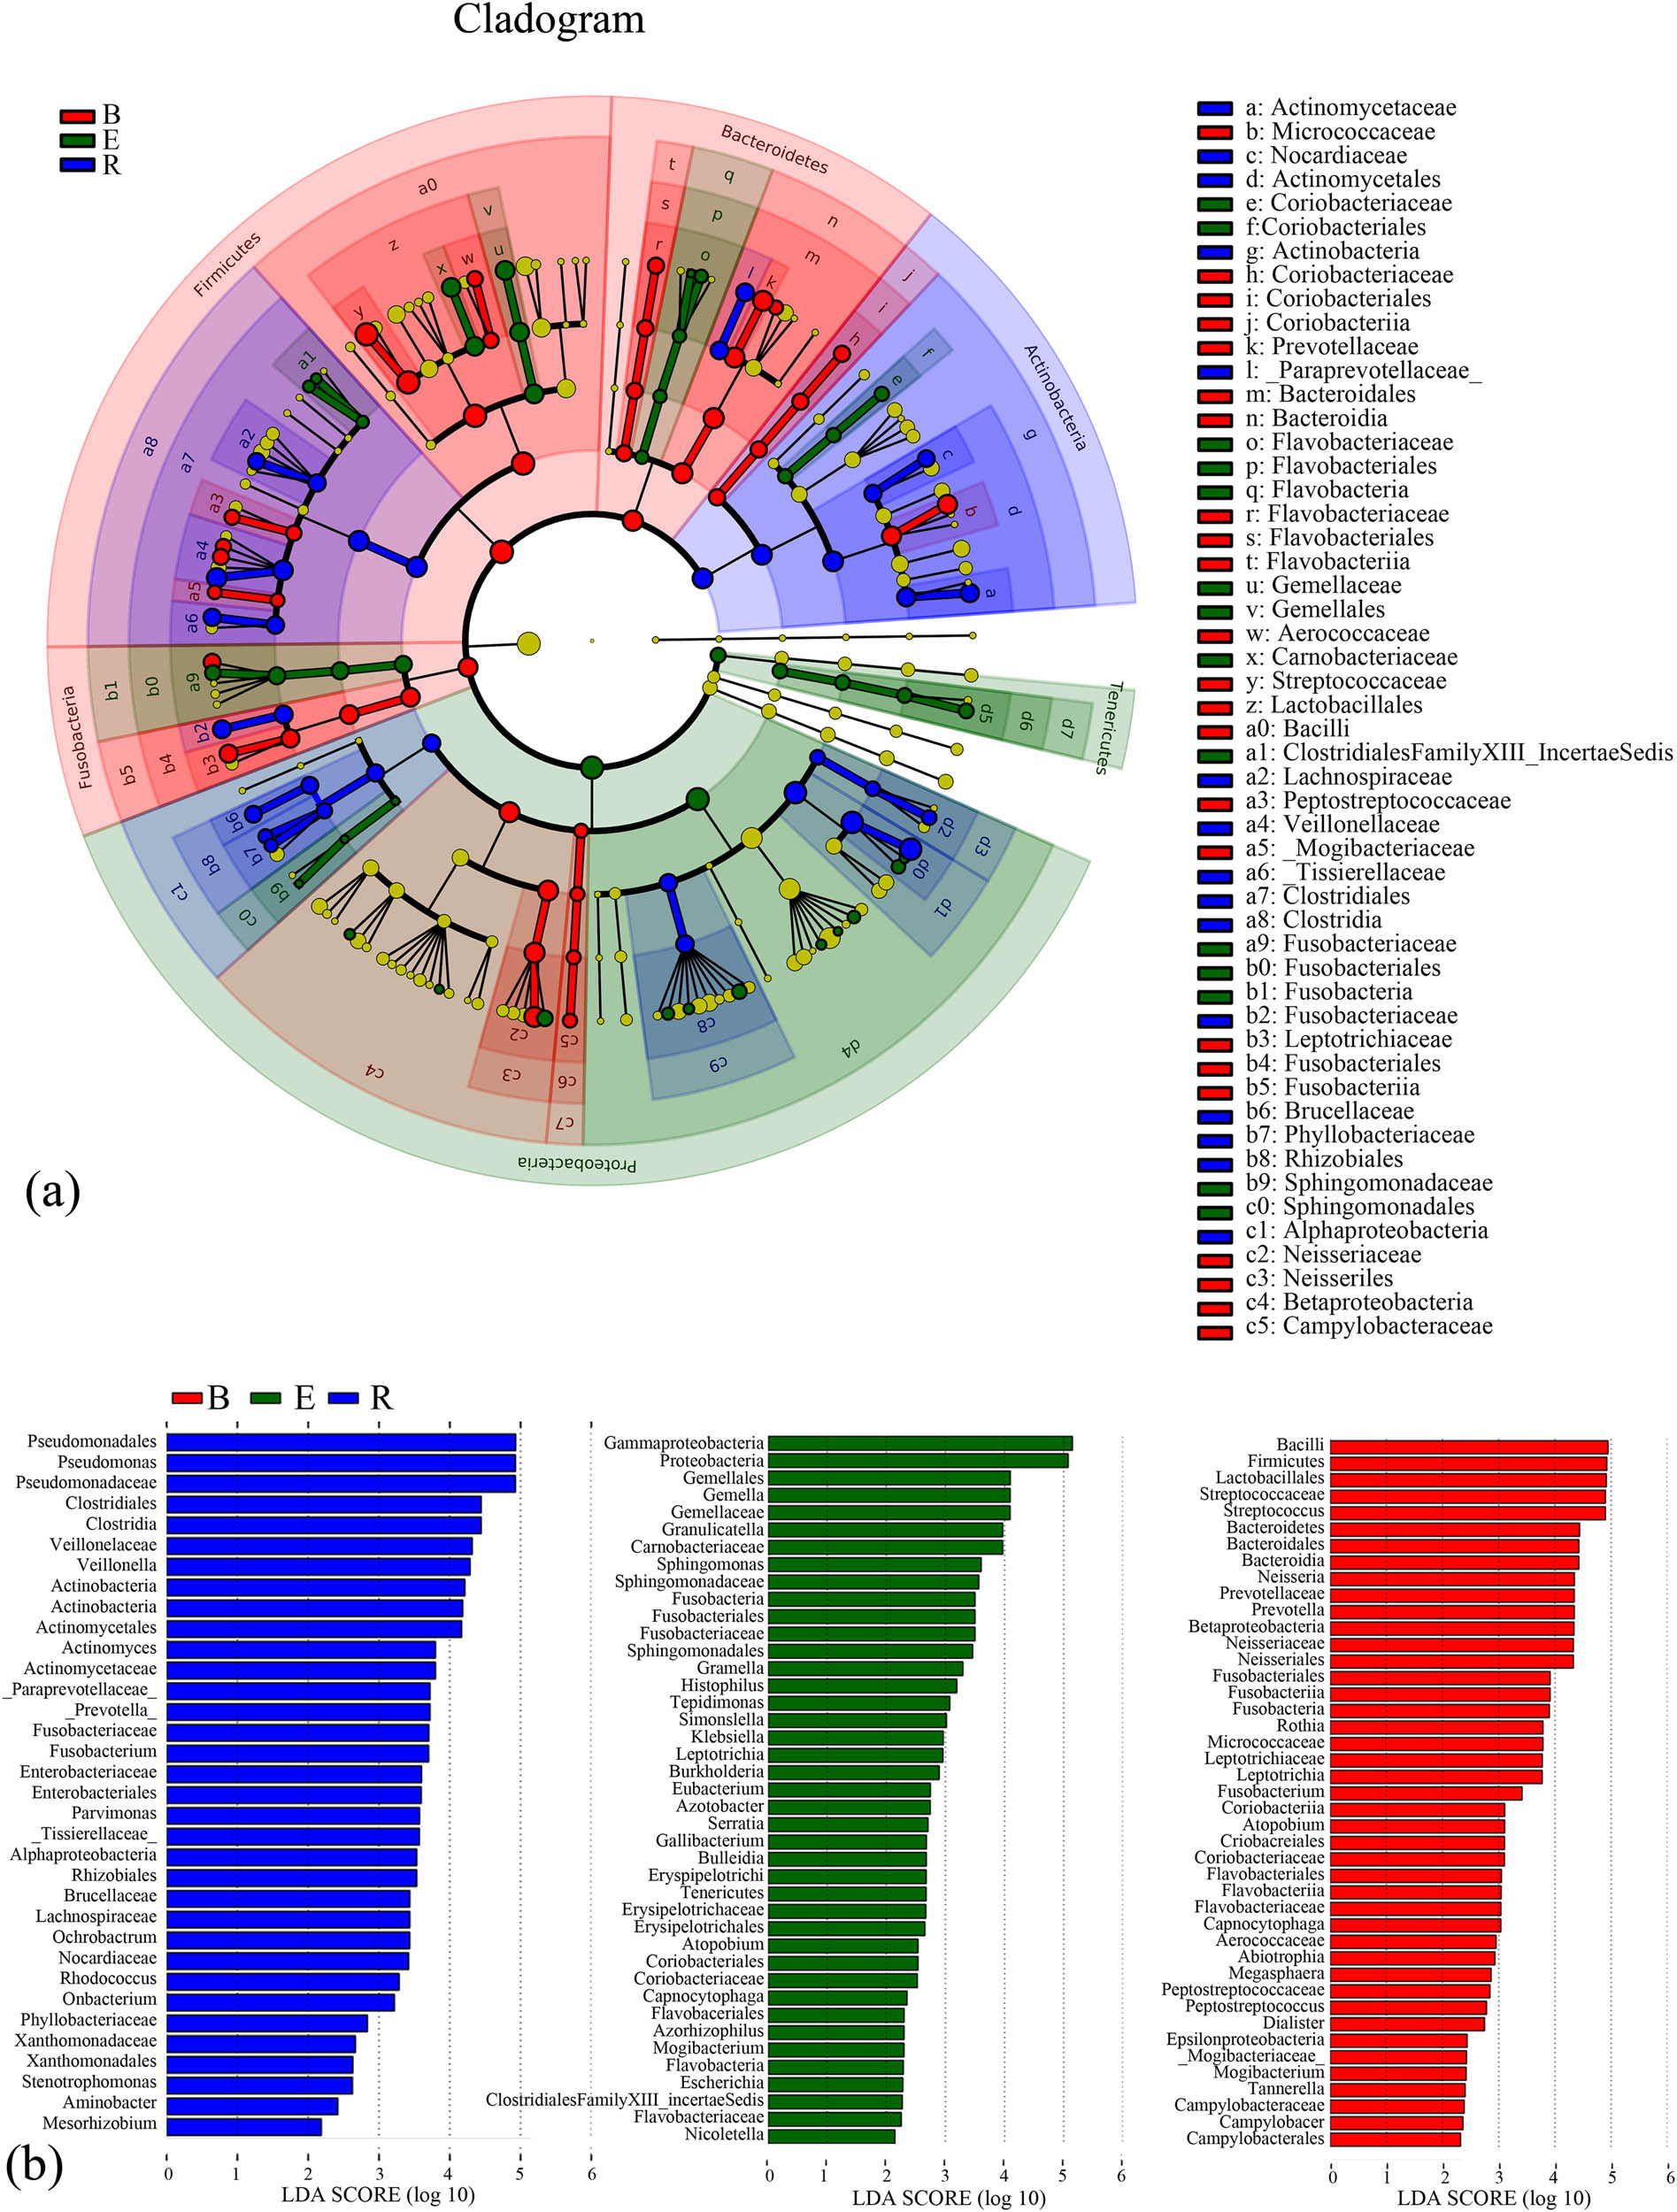
LEfSe analysis of the samples of the three groups. (a) Cladogram of the differentially abundant taxa. Different colors indicate different groups. Red nodes represent the differentially abundant taxa with a relatively high abundance in the baseline group, and green nodes represent the differentially abundant taxa with a relatively high abundance in the acute exacerbation group. Yellow nodes represent the taxa without significant differences between the baseline and acute exacerbation groups. The diameter of the node is positively proportional to the relative abundance of the taxon. The layers of nodes from inside to outside represent the phylum, class, order, family, and genus levels. The letters in the cladogram that are used to designate the taxa are defined in the right column. (b) Score graph of the differentially abundant taxa. Different colors indicate different groups, and the length of the bar indicates the relative abundance of the taxon. B, baseline; E, exacerbation; R, recovery.
3.4.4 Adonis analysis
The total variance was decomposed based on the matrix (based on Bray–Curtis distance), and the interpretability of the grouping factor for the differences among the samples was analyzed. The statistical significance analysis mentioned above was performed using the permutation test (Table 5). The results showed that the grouping method in this study had statistical significance (P = 0.001): patients at different stages of nCFB exhibited differences in microbial flora structure and the abundances and diversity of the microorganisms at the acute exacerbation phase differed from those at the baseline phase and the recovery phase. However, as all the samples in this study were from patients with the same disease, the interpretability of this grouping method was low regarding the differences in intrapulmonary microorganisms at different phases of nCFB.
Outcomes of the PERMANOVA/Adonis analysis (Bray–Curtis)
| Df | SumsOfSqs | MeanSqs | F. model | R 2 | Pr (>F) | Signif | |
|---|---|---|---|---|---|---|---|
| Group_factor | 2 | 3.097 | 1.54872 | 7.3535 | 0.08984 | 0.001 | *** |
| Residuals | 149 | 31.381 | 0.21061 | 0.91016 | |||
| Total | 151 | 34.478 | 1 |
*** indicates that the involved groups had a statistically significant difference.
3.4.5 Correlation analysis
According to the heatmap of the correlation analysis results (Figure 10), Streptococcus had a considerable competitive relationship with Pseudomonas (r = −0.577 and P = 1.15 × 10⁻¹³) and Haemophilus (r = −0.363 and P = 6.4 × 10−0.5), and Rhodococcus and Nocardia had certain suppressive effects on Streptococcus. Rothia, Granulicatella, and Atopobium might be accomplices of Streptococcus, whereas the genus Pseudomonas was a loner. Except for being slightly intimate with Nocardia, Pseudomonas was “unfriendly” to Haemophilus (r = −0.241 and P = 0.0028), Prevotella (r = −0.334 and P = 2.66 × 10−05), Neisseria (r = −0.276 and P = 0.0006), Veillonella (r = −0.358 and P = 5.98 × 10−06), Rothia (r = −328 and P = 3.60 × 10−05), Actinomyces (r = −0.230 and P = 0.004), Megasphaera (r = −0.227 and P = 0.005), Granulicatella (r = −0.208 and P = 0.010), Gemella (r = −0.166 and P = 0.041), Parvimonas (r = −0.187 and P = 0.021), Lautropia (r = 0.182 and P = 0.025), and Leptotrichia (r = −0.169 and P = 0.037). Haemophilus was also antagonistic: it showed competitiveness with Prevotella, Veillonella, Actinomyces, Atopobium, and Megasphaera but not Pseudomonas. In contrast, Prevotella had a number of partners. It had synergetic relationships with Veillonella (r = 0.705 and P = 3.67 × 10⁻²⁴), Megasphaera (r = 0.617 and P = 2.76 × 10⁻¹⁷), Oribacterium (r = 0.546 and P = 3.30 × 10⁻¹³), and Atopobium (r = 0.502 and P = 4.57 × 10⁻¹¹) and was also a “friend” of Leptotrichia (r = 0.304 and P < 0.001), Parvimonas (r = 0.254 and P = 0.002), Actinobacillus (r = 0.224 and P = 0.005), and Moryella (r = 0.194 and P = 0.017). Neisseria had synergetic relationships with Capnocytophaga (r = 0.336 and P = 2.29 × 10−05), Oribacterium (r = 0.259 and P = 0.001), Lautropia (r = 0.246 and P = 0.002), Aggregatibacter (r = 0.202 and P = 0.013), and Megasphaera (r = 0.193 and P = 0.017). Veillonella was positively correlated with Megasphaera (r = 0.537 and P = 1.02 × 10⁻¹²), Actinomyces (r = 0.501 and P = 4.93 × 10⁻¹¹), Oribacterium (r = 0.469 and P = 1.14 × 10−09), Atopobium (r = 0.369 and P = 3.00 × 10−06), Leptotrichia (r = 0.328 and P = 3.63 × 10−05), and Moryella (r = 0.306 and P = 0.000). Granulicatella was positively correlated with Gemella (r = 0.593 and P = 8.69 × 10⁻¹⁶) and Staphylococcus (0.250 and P = 0.002) but exhibited mutual suppression with Actinomyces (r = −0.215 and P = 0.008) and Streptococcus (r = 0.290 and P = 0.000).
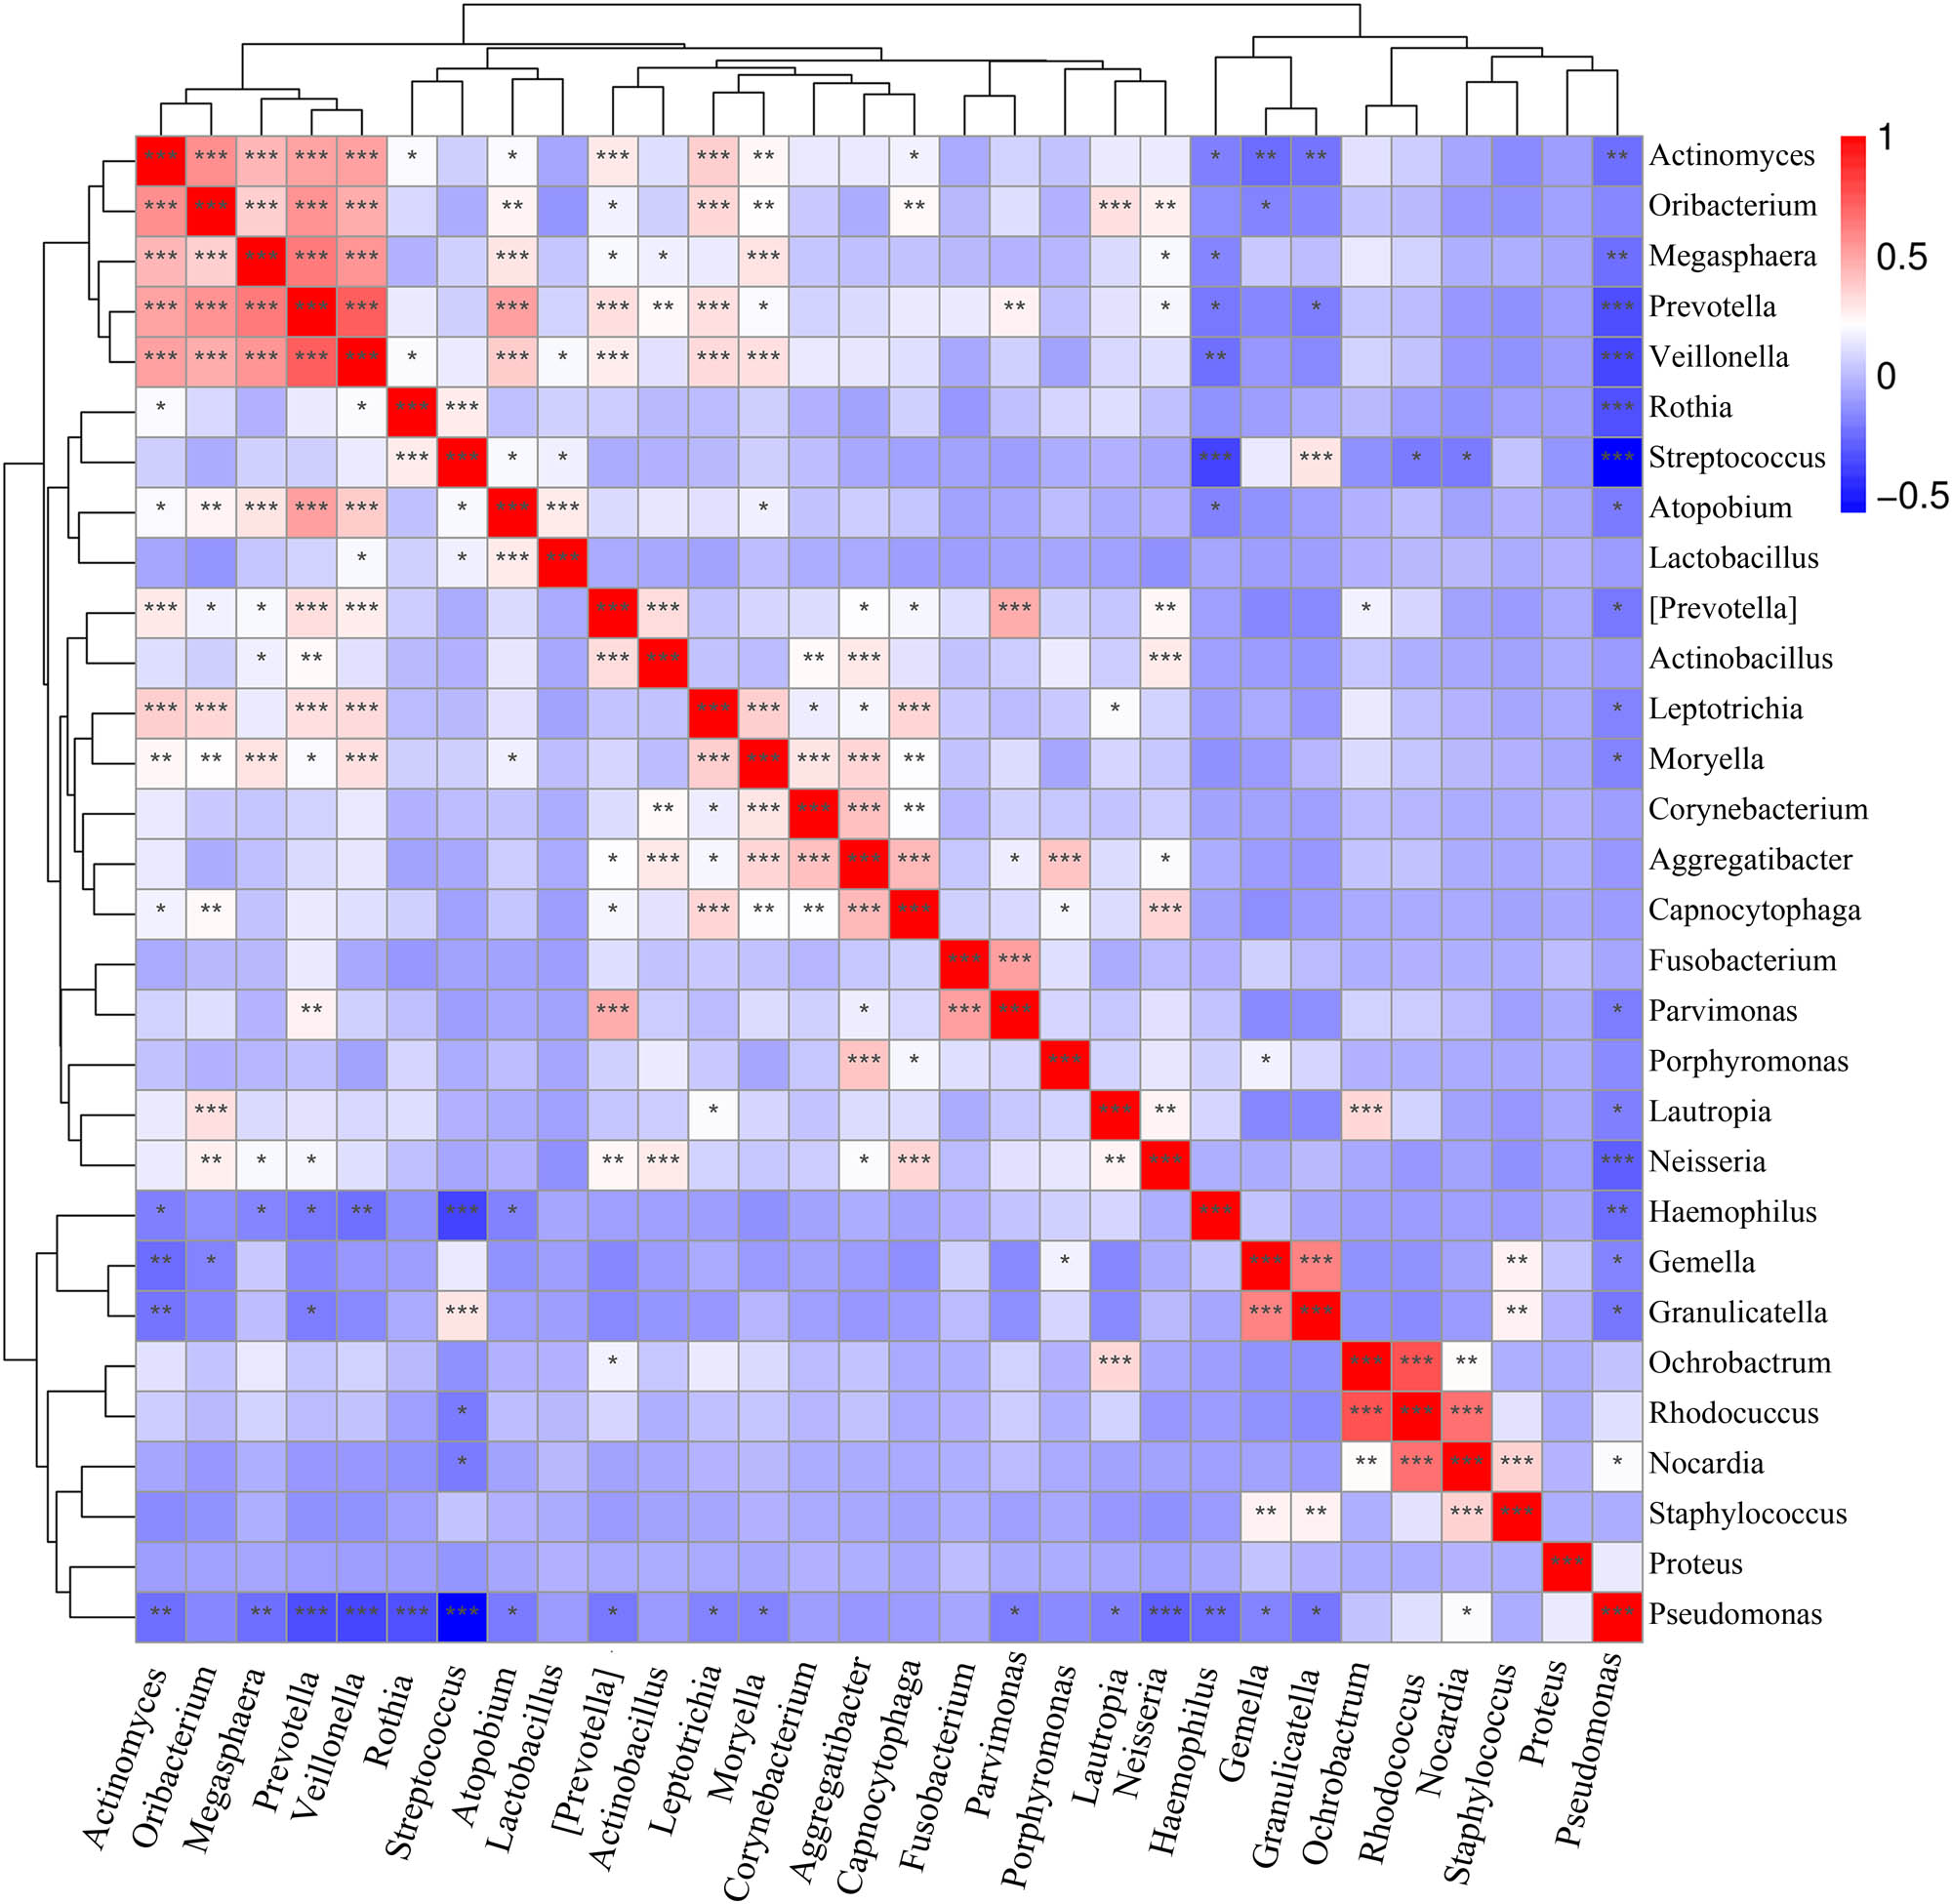
Heatmap of correlations. Note: Red denotes a positive correlation, whereas blue denotes a negative correlation. A larger number of asterisks indicate a higher correlation.
4 Discussion
The mutual effect among microbial flora constituents in nCFB impacts the diversity and abundance of the microorganisms. This impact leads to changes in patients’ antibiotic sensitivity, pulmonary immunomodulatory capacity, and pathological conditions, which further influence the disease progression [19,20]. In chronic obstructive pulmonary disease (COPD), decreased abundances of Firmicutes and Proteobacteria have been reported [21,22,23]. With disease progression, nCFB can also gradually become complicated with COPD, which may contribute to the changes in pulmonary microecology in nCFB patients as well as nCFB patients’ progressive decline of pulmonary function. In this study, we performed an informatic analysis of the pulmonary microecology in patients with nCFB at different phases. We found that at the acute exacerbation stage, Firmicutes, Actinobacteria, and Bacteroidetes abundances decreased, while Proteobacteria and Archaea abundances increased, although these changes may not be the only factor altering the progression or prognosis of the disease.
In patients with nCFB at the acute exacerbation phase, the bacterial load does not change significantly compared to patients at other phases [13,14,15]. In patients with asthma and those with COPD, the dominant genera in healthy volunteers, such as Prevotella and Veillonella, exhibit low abundances [24,25,26]. Our study found that the abundance of Prevotella and Veillonella in patients with nCFB at the acute exacerbation phase noticeably decreased compared with those in patients in the remaining groups. Furthermore, we found that the nCFB patients at the acute exacerbation phase did not show a noticeable difference in bacterial load when compared to patients in any of the remaining groups. These results suggest that the pulmonary microecology of nCFB patients is in a state of dynamic equilibrium according to different disease stages. In addition, according to the literature [24,25,26], in patients with asthma and those with COPD, the abundances of Pseudomonas aeruginosa and Haemophilus influenzae increased, and that of Staphylococcus aureus also showed abnormalities. Although our results were consistent with those reported, we did not find abnormalities in the abundances of these taxa in nCFB patients at the acute exacerbation phase compared with those at other phases. The reason for this difference may be attributed to the different populations included in our study and in theirs. Compared with those in the baseline group, the abundance, uniformity, and diversity of the pulmonary microecology in the acute exacerbation group decreased. The recovery group exhibited the lowest abundance and diversity but the best uniformity among the three groups. This phenomenon may be attributed to antibiotic use or the interaction among bacterial genera. The possibility of self-adjusting the pulmonary microecology after insult should also not be excluded.
To date, most related studies have focused on the variations in Firmicutes and Proteobacteria abundances [21,22,23], and according to these studies, Firmicutes abundance in the pulmonary microecology of patients with COPD and those with asthma decreased significantly, whereas Proteobacteria abundance significantly increased. Similar changes in the pulmonary microecology were observed in nCFB patients at the acute exacerbation stage in this study. In addition, this study also revealed that the abundance and diversity of Bacteroidetes and Actinomycetes in these patients were lower than those in the baseline and recovery groups. These changes were accompanied by the increased abundance and diversity of Proteobacteria, Crenarchaeota, Euryarchaeota, and TM7. Normally, Crenarchaeota and Euryarchaeota live in extreme environments [27], which resemble the original environment of life. Is it reasonable to assume that the pulmonary environment in the acute exacerbation stage aggravates into a stage of destruction, considering that most Crenarchaeota and Euryarchaeota bacteria are anaerobic? With the removal of a large quantity of sputum, the suppressive effect of antibiotics on pathogenic bacteria, ciliary function, the immune system, and the environment of the lower respiratory tract is improved. Therefore, will the environment at the recovery stage no longer be suitable for Crenarchaeota and Euryarchaeota, which then migrate or evolve? Although the correlation analysis in this study did not reveal a correlation of increased Crenarchaeota and Euryarchaeota abundances with increased Proteobacteria abundance, the change in Crenarchaeota and Euryarchaeota abundances discovered in this study may provide a new idea for related research to be conducted in the future.
The interactions among bacterial genera are extremely subtle. According to previous studies [30,31], the abundances of Prevotella and Veillonella significantly increase in the pulmonary microecology of patients with lung cancer and those with asthma [28,29]. This study found that Prevotella and Veillonella cooperated with each other and that Ochrobactrum and Rhodococcus were synergetic. Pseudomonas is an independent dominant bacterial genus, and it exerted noticeable suppressive effects on Haemophilus, Prevotella, Neisseria, Veillonella, Rothia, Actinomyces, Leptotrichia, Parvimonas, Capnocytophaga, Atopobium, Lautropia, and Streptococcus. The interrelations among the bacteria suggest a hypothesis: in addition to the use of drugs to suppress or kill pathogenic bacteria, it means to increase the abundance of the competitor of the pathogenic bacteria, such as bacterial transplantation and regulation of the intestinal flora, may also help enhance the treatment effect. Oral administration or transplantation of probiotics can improve pulmonary resistance against viruses, Mycobacterium tuberculosis, and other pathogenic bacteria [30,31,32,33,34]. Currently, broad- or ultrabroad-spectrum antibiotics have been used to target Pseudomonas aeruginosa in clinical practice [35,36,37,38]. However, with these antibiotics, P. aeruginosa has become increasingly drug-resistant, while its competitor bacteria have become increasingly less drug-resistant. This cycle repeats, and consequently, P. aeruginosa cannot be brought under satisfactory control. The mutual competitiveness among bacteria may provide us with a new idea in clinical practice: can we increase the abundance and activity of the competitor bacteria of P. aeruginosa to suppress its activity?
This study had some limitations. First, because the pulmonary microecological characteristics of healthy individuals in the same analysis region could not be obtained in the database, a comparative analysis of pulmonary microecology between healthy individuals and patients with bronchiectasis could not be performed. Second, due to the partial absence of the original data, we could not perform analysis of bacterial species such as P. aeruginosa, Pseudomonas mucilaginosa, and Staphylococcus aureus, which play key roles in the prognosis of nCFB. Therefore, the guiding significance of this study regarding antibiotic determination and immunoregulation is compromised. Third, all the data used in this study were from the outcomes of 16S rRNA-based sputum analysis, which might suffer from bias due to the influence of the upper respiratory tract. If bronchoalveolar lavage fluid samples had been obtained for next-generation sequence-based longitudinal analysis, the results of this study would be more persuasive. Fourth, our analysis was limited to pulmonary microorganisms at different stages of nCFB. Currently, whole-genome detection techniques for the intestines have advanced and have already been applied to detect intestinal diseases [39,40]. There exists comorbidity between multiple pulmonary diseases and intestinal diseases, which is associated with the intermigration and disturbance of microbes [41]. In this study, however, we did not take the interrelation between pulmonary microecology and intestinal microecology into consideration. What role does this intermigration and disturbance mechanism play in nCFB and whether we can take advantage of this disturbance effect to improve the flora structure in nCFB by regulating the intestinal microecology and thus improve patients’ conditions remains to be investigated. Fifth, this study was originally planned as bioinformatics analysis and did not involve experimental research. In addition, in the future, analysis of lower respiratory tract samples from nCFB patients can be combined with the exploration of the mechanism underlying the impact of the changes in intestinal microorganisms on the immunoregulation of the gut-lung axis, which can be expected to reveal more nonantibiotic therapies for nCFB.
There were changes in the abundance and diversity of the bacterial flora at the acute exacerbation stage of nCFB. Proteobacteria may be a biological signal of nCFB changes, and the appearance of Crenarchaeota and Euryarchaeota may be a biological signal of disease aggravation. The mutual competitiveness and cooperation among bacteria may provide new ideas for clinical medication in the treatment of nCFB.
-
Funding information: This study was financially supported by the Autonomous Region Innovation Environment (talents and base) Construction Programs-Science and Technology Innovation Base Construction (resource sharing platform) (grant no. PT1903) and Respiratory Disease Microbial Strain Resource Sharing Platform Construction of Xinjiang. The funders had no roles in study design, the collection, analysis, or interpretation of data, the writing of the report, or the decision to submit the article for publication.
-
Author contributions: Y.C.W. devised the study plan and led the writing of the article; Y.C. and C.W. conducted the experiment and collected the data; X.H.Y. conducted the analysis; and C.W. supervised the whole process.
-
Conflict of interest: Authors state no conflict of interest.
-
Data availability statement: The datasets generated during and/or analyzed during the current study are available from the corresponding author on reasonable request.
References
[1] Flume PA, Chalmers JD, Olivier KN. Advances in bronchiectasis: endotyping, genetics, microbiome, and disease heterogeneity. Lancet. 2018;392(10150):880–90.10.1016/S0140-6736(18)31767-7Search in Google Scholar
[2] Massart A, Hunt DP. Pulmonary manifestations of inflammatory bowel disease. Am J Med. 2020;133(1):39–43.10.1016/j.amjmed.2019.07.007Search in Google Scholar PubMed
[3] Bush A, Floto RA. Pathophysiology, causes and genetics of paediatric and adult bronchiectasis. Respirology. 2019;24(11):1053–62.10.1111/resp.13509Search in Google Scholar PubMed
[4] Janjua S, Mathioudakis AG, Fortescue R, Walker RA, Sharif S, Threapleton CJ, et al. Prophylactic antibiotics for adults with chronic obstructive pulmonary disease: a network meta-analysis. Cochrane Database Syst Rev. 2021;1:CD013198.10.1002/14651858.CD013198Search in Google Scholar
[5] Pasteur MC, Helliwell SM, Houghton SJ, Webb SC, Foweraker JE, Coulden RA, et al. An investigation into causative factors in patients with bronchiectasis. Am J Respir Crit Care Med. 2000;162:1277–84.10.1164/ajrccm.162.4.9906120Search in Google Scholar PubMed
[6] Pasteur MC, Bilton D, Hill A. BTS bronchiectasis (non-CF) guideline group. British thoracic society guideline for non-CF bronchiectasis. Thorax. 2010;65(Suppl. 1):i1–58.10.1136/thx.2010.136119Search in Google Scholar PubMed
[7] GBD 2015 LRI Collaborators. Estimates of the global, regional, and national morbidity, mortality, and aetiologies of lower respiratory tract infections in 195 countries: a systematic analysis for the Global Burden of Disease Study 2015. Lancet Infect Dis. 2017 Nov;2017(17):1133–61.Search in Google Scholar
[8] Visser SK, Bye P, Morgan L. Management of bronchiectasis in adults. Med J. 2018;209:177–83.10.5694/mja17.01195Search in Google Scholar PubMed
[9] Chalmers JD, Chang AB, Chotirmall SH, Dhar R, McShane PJ. Bronchiectasis. Nat Rev Dis Primers. 2018;4:45.10.1038/s41572-018-0042-3Search in Google Scholar PubMed
[10] Chotirmall SH, Chalmers JD. Bronchiectasis: an emerging global epidemic. BMC Pulm Med. 2018;18:76.10.1186/s12890-018-0629-1Search in Google Scholar PubMed PubMed Central
[11] Sin S, Yun SY, Kim JM, Park CM, Cho J, Choi SM, et al. Mortality risk and causes of death in patients with non-cystic fibrosis bronchiectasis. Respiratory Research. 2019;3(20):271.10.1186/s12931-019-1243-3Search in Google Scholar PubMed PubMed Central
[12] Rogers GB, van der Gast CJ, Cuthbertson L, Thomson SK, Bruce KD, Martin ML, et al. Clinical measures of disease in adult non-CF bronchiectasis correlate with airway microbiota composition. Thorax. 2013;68(8):731–7.10.1136/thoraxjnl-2012-203105Search in Google Scholar PubMed
[13] Cox MJ, Turek EM, Hennessy C, Mirza GK, James PL, Coleman M, et al. Longitudinal assessment of sputum microbiome by sequencing of the 16S rRNA gene in non-cystic fibrosis bronchiectasis patients. PLoS One. 2017;12(2):e0170622.10.1371/journal.pone.0170622Search in Google Scholar PubMed PubMed Central
[14] Woo TE, Lim R, Heirali AA, Acosta N, Rabin HR, Mody CH, et al. A longitudinal characterization of the Non-Cystic Fibrosis Bronchiectasis airway microbiome. Sci Rep. 2019;9(1):6871.10.1038/s41598-019-42862-ySearch in Google Scholar PubMed PubMed Central
[15] Metwally AA, Ascoli C, Turturice B, Rani A, Ranjan R, Chen Y, et al. Pediatric lung transplantation: dynamics of the microbiome and bronchiolitis obliterans in cystic fibrosis. J Heart Lung Transplant. 2020;39(8):824–34.10.1016/j.healun.2020.04.016Search in Google Scholar PubMed PubMed Central
[16] Lu J, Carmody LA, Opron K, Simon RH, Kalikin LM, Caverly LJ, et al. Parallel analysis of cystic fibrosis sputum and saliva reveals overlapping communities and an opportunity for sample decontamination. mSystems. 2020;5(4):e00296-20.10.1128/mSystems.00296-20Search in Google Scholar PubMed PubMed Central
[17] Wang Q, Garrity GM, Tiedje JM, Cole JR. Naive Bayesian classifier for rapid assignment of rRNA sequences into the new bacterial taxonomy. Appl Environ Microbiol. 2007;73(16):5261–7.10.1128/AEM.00062-07Search in Google Scholar PubMed PubMed Central
[18] Pozzi FI, Green GY, Barbona IG, Rodriguez GR, Felitti S. CleanBSequences: an efficient curator of biological sequences in R. Mol Genet Genomics. 2020;295(4):837–41.10.1007/s00438-020-01671-zSearch in Google Scholar PubMed
[19] Limoli DH, Hoffman LR. Help, hinder, hide and harm: what can we learn from the interactions between Pseudomonas aeruginosa and Staphylococcus aureus during respiratory infections? Thorax. 2019;74(7):684–92.10.1136/thoraxjnl-2018-212616Search in Google Scholar PubMed PubMed Central
[20] Taylor SL, Leong LEX, Ivey KL, Wesselingh S, Grimwood K, Wainwright CE et al. Total bacterial load, inflammation, and structural lung disease in paediatric cystic fibrosis. J Cyst Fibros. 2020;19(6):923–30.10.1016/j.jcf.2020.03.008Search in Google Scholar PubMed
[21] Li L, Li Z, Bi J, Zhang J, Zhang C. Airway microbiota is associated with the severity of non-CF bronchiectasis. Clin Respir J. 2021;15(2):154–62.10.1111/crj.13279Search in Google Scholar PubMed
[22] Liu J, Ran Z, Wang F, Xin C, Xiong B, Song Z. Role of pulmonary microorganisms in the development of chronic obstructive pulmonary disease. Crit Rev Microbiol. 2020;47:1–12. 10.1080/1040841X.2020.1830748.Search in Google Scholar PubMed
[23] Liu H, Zheng D, Lin Y, Liu Z, Liang Z, Su J, et al. Association of sputum microbiome with clinical outcome of initial antibiotic treatment in hospitalized patients with acute exacerbations of COPD. Pharmacol Res. 2020;160(10):105095.10.1016/j.phrs.2020.105095Search in Google Scholar PubMed
[24] Haldar K, George L, Wang Z, Mistry V, Ramsheh MY, Free RC, et al. The sputum microbiome is distinct between COPD and health, independent of smoking history. Respir Res. 2020;21(1):183.10.1186/s12931-020-01448-3Search in Google Scholar PubMed PubMed Central
[25] Sharma A, Laxman B, Naureckas ET, Hogarth DK, Sperling AI, Solway J, et al. Associations between fungal and bacterial microbiota of airways and asthma endotypes. J Allergy Clin Immunol. 2019;144(5):1214–27.10.1016/j.jaci.2019.06.025Search in Google Scholar PubMed PubMed Central
[26] Opron K, Begley LA, Erb-Downward JR, Freeman C, Madapoosi S, Alexis NE, et al. Lung microbiota associations with clinical features of COPD in the SPIROMICS cohort. NPJ Biofilms Microbiomes. 2021;7(1):14.10.1038/s41522-021-00185-9Search in Google Scholar PubMed PubMed Central
[27] Cell Editorial Team. Living in Their World. Cell. 2018;172(6):1137–8.10.1016/j.cell.2018.02.056Search in Google Scholar PubMed
[28] Thorsen J, Rasmussen MA, Waage J, Mortensen M, Brejnrod A, Bønnelykke K, et al. Infant airway microbiota and topical immune perturbations in the origins of childhood asthma. Nat Commun. 2019;10(1):5001.10.1038/s41467-019-12989-7Search in Google Scholar PubMed PubMed Central
[29] Tsay JJ, Wu BG, Badri MH, Clemente JC, Shen N, Meyn P, et al. Airway microbiota is associated with upregulation of the PI3K pathway in lung cancer. Am J Respir Crit Care Med. 2018;198(9):1188–98.10.1164/rccm.201710-2118OCSearch in Google Scholar PubMed PubMed Central
[30] Turek EM, Cox MJ, Hunter M, Hui J, James P, Willis-Owen SAG, et al. Airway microbial communities, smoking and asthma in a general population sample. EBioMedicine. 2021;71:103538.10.1016/j.ebiom.2021.103538Search in Google Scholar PubMed PubMed Central
[31] Khan N, Mendonca L, Dhariwal A, Fontes G, Menzies D, Xia J, et al. Intestinal dysbiosis compromises alveolar macrophage immunity to Mycobacterium tuberculosis. Mucosal Immunol. 2019;12(3):772–83.10.1038/s41385-019-0147-3Search in Google Scholar PubMed
[32] Bacher P, Hohnstein T, Beerbaum E, Röcker M, Blango MG, Kaufmann S, et al. Human anti-fungal Th17 immunity and pathology rely on cross-reactivity against Candida albicans. Cell. 2019;176(6):1340–55.10.1016/j.cell.2019.01.041Search in Google Scholar PubMed
[33] Antunes KH, Fachi JL, de Paula R, da Silva EF, Pral LP, Dos Santos AÁ, et al. Microbiota-derived acetate protects against respiratory syncytial virus infection through a GPR43-type 1 interferon response. Nat Commun. 2019;10(1):3273.10.1038/s41467-019-11152-6Search in Google Scholar PubMed PubMed Central
[34] Dickson RP, Cox MJ. Gut microbiota and protection from pneumococcal pneumonia. Gut. 2017;66(2):384.10.1136/gutjnl-2016-311823Search in Google Scholar PubMed PubMed Central
[35] Vendrell M, de Gracia J, Olveira C, Martinez-Garcia MA, Girón R, Máiz L, et al. Diagnosis and treatment of bronchiectasis. Spanish society of pneumology and thoracic surgery. Arch Bronconeumol. 2008;44(11):629–40.10.1157/13128330Search in Google Scholar PubMed
[36] Martínez-García MÁ, Máiz L, Olveira C, Girón RM, de la Rosa D, Blanco M, et al. Spanish guidelines on treatment of bronchiectasis in adults. Arch Bronconeumol. 2018;54(2):88–98.10.1016/j.arbr.2017.07.014Search in Google Scholar
[37] Hill AT, Sullivan AL, Chalmers JD, De Soyza A, Elborn SJ, Floto AR, et al. British thoracic society guideline for bronchiectasis in adults. Thorax. 2019;74(Suppl 1):1–69.10.1136/bmjresp-2018-000348Search in Google Scholar PubMed PubMed Central
[38] Polverino E, Goeminne PC, McDonnell MJ, Aliberti S, Marshall SE, Loebinger MR, et al. European respiratory society guidelines for the management of adult bronchiectasis. Eur Respir J. 2017;50(3):1700629.10.1183/13993003.00629-2017Search in Google Scholar PubMed
[39] Aron-Wisnewsky J, Warmbrunn MV, Nieuwdorp M, Clément K. Metabolism and metabolic disorders and the microbiome: the intestinal microbiota associated with obesity, lipid metabolism and metabolic health: pathophysiology and therapeutic strategies. Gastroenterology. 2020;160:573–99. 10.1053/j.gastro.2020.10.057.Search in Google Scholar PubMed
[40] Lee M, Chang EB. Inflammatory bowel diseases (IBD) (inflammatory bowel diseases and the microbiome: Searching the crime scene for clues). Gastroenterology. 2020;160:524–37. 10.1053/j.gastro.2020.09.056.Search in Google Scholar PubMed PubMed Central
[41] Santo CE, Caseior C, Martins MJ, Monteiro R, Brandão I. Gut microbiota, in the halfway between nutrition and lung function. Nutrients. 2021;13(5):1716.10.3390/nu13051716Search in Google Scholar PubMed PubMed Central
© 2022 Yuchao Wang et al., published by De Gruyter
This work is licensed under the Creative Commons Attribution 4.0 International License.
Articles in the same Issue
- Biomedical Sciences
- Effects of direct oral anticoagulants dabigatran and rivaroxaban on the blood coagulation function in rabbits
- The mother of all battles: Viruses vs humans. Can humans avoid extinction in 50–100 years?
- Knockdown of G1P3 inhibits cell proliferation and enhances the cytotoxicity of dexamethasone in acute lymphoblastic leukemia
- LINC00665 regulates hepatocellular carcinoma by modulating mRNA via the m6A enzyme
- Association study of CLDN14 variations in patients with kidney stones
- Concanavalin A-induced autoimmune hepatitis model in mice: Mechanisms and future outlook
- Regulation of miR-30b in cancer development, apoptosis, and drug resistance
- Informatic analysis of the pulmonary microecology in non-cystic fibrosis bronchiectasis at three different stages
- Swimming attenuates tumor growth in CT-26 tumor-bearing mice and suppresses angiogenesis by mediating the HIF-1α/VEGFA pathway
- Characterization of intestinal microbiota and serum metabolites in patients with mild hepatic encephalopathy
- Functional conservation and divergence in plant-specific GRF gene family revealed by sequences and expression analysis
- Application of the FLP/LoxP-FRT recombination system to switch the eGFP expression in a model prokaryote
- Biomedical evaluation of antioxidant properties of lamb meat enriched with iodine and selenium
- Intravenous infusion of the exosomes derived from human umbilical cord mesenchymal stem cells enhance neurological recovery after traumatic brain injury via suppressing the NF-κB pathway
- Effect of dietary pattern on pregnant women with gestational diabetes mellitus and its clinical significance
- Potential regulatory mechanism of TNF-α/TNFR1/ANXA1 in glioma cells and its role in glioma cell proliferation
- Effect of the genetic mutant G71R in uridine diphosphate-glucuronosyltransferase 1A1 on the conjugation of bilirubin
- Quercetin inhibits cytotoxicity of PC12 cells induced by amyloid-beta 25–35 via stimulating estrogen receptor α, activating ERK1/2, and inhibiting apoptosis
- Nutrition intervention in the management of novel coronavirus pneumonia patients
- circ-CFH promotes the development of HCC by regulating cell proliferation, apoptosis, migration, invasion, and glycolysis through the miR-377-3p/RNF38 axis
- Bmi-1 directly upregulates glucose transporter 1 in human gastric adenocarcinoma
- Lacunar infarction aggravates the cognitive deficit in the elderly with white matter lesion
- Hydroxysafflor yellow A improved retinopathy via Nrf2/HO-1 pathway in rats
- Comparison of axon extension: PTFE versus PLA formed by a 3D printer
- Elevated IL-35 level and iTr35 subset increase the bacterial burden and lung lesions in Mycobacterium tuberculosis-infected mice
- A case report of CAT gene and HNF1β gene variations in a patient with early-onset diabetes
- Study on the mechanism of inhibiting patulin production by fengycin
- SOX4 promotes high-glucose-induced inflammation and angiogenesis of retinal endothelial cells by activating NF-κB signaling pathway
- Relationship between blood clots and COVID-19 vaccines: A literature review
- Analysis of genetic characteristics of 436 children with dysplasia and detailed analysis of rare karyotype
- Bioinformatics network analyses of growth differentiation factor 11
- NR4A1 inhibits the epithelial–mesenchymal transition of hepatic stellate cells: Involvement of TGF-β–Smad2/3/4–ZEB signaling
- Expression of Zeb1 in the differentiation of mouse embryonic stem cell
- Study on the genetic damage caused by cadmium sulfide quantum dots in human lymphocytes
- Association between single-nucleotide polymorphisms of NKX2.5 and congenital heart disease in Chinese population: A meta-analysis
- Assessment of the anesthetic effect of modified pentothal sodium solution on Sprague-Dawley rats
- Genetic susceptibility to high myopia in Han Chinese population
- Potential biomarkers and molecular mechanisms in preeclampsia progression
- Silencing circular RNA-friend leukemia virus integration 1 restrained malignancy of CC cells and oxaliplatin resistance by disturbing dyskeratosis congenita 1
- Endostar plus pembrolizumab combined with a platinum-based dual chemotherapy regime for advanced pulmonary large-cell neuroendocrine carcinoma as a first-line treatment: A case report
- The significance of PAK4 in signaling and clinicopathology: A review
- Sorafenib inhibits ovarian cancer cell proliferation and mobility and induces radiosensitivity by targeting the tumor cell epithelial–mesenchymal transition
- Characterization of rabbit polyclonal antibody against camel recombinant nanobodies
- Active legumain promotes invasion and migration of neuroblastoma by regulating epithelial-mesenchymal transition
- Effect of cell receptors in the pathogenesis of osteoarthritis: Current insights
- MT-12 inhibits the proliferation of bladder cells in vitro and in vivo by enhancing autophagy through mitochondrial dysfunction
- Study of hsa_circRNA_000121 and hsa_circRNA_004183 in papillary thyroid microcarcinoma
- BuyangHuanwu Decoction attenuates cerebral vasospasm caused by subarachnoid hemorrhage in rats via PI3K/AKT/eNOS axis
- Effects of the interaction of Notch and TLR4 pathways on inflammation and heart function in septic heart
- Monosodium iodoacetate-induced subchondral bone microstructure and inflammatory changes in an animal model of osteoarthritis
- A rare presentation of type II Abernethy malformation and nephrotic syndrome: Case report and review
- Rapid death due to pulmonary epithelioid haemangioendothelioma in several weeks: A case report
- Hepatoprotective role of peroxisome proliferator-activated receptor-α in non-cancerous hepatic tissues following transcatheter arterial embolization
- Correlation between peripheral blood lymphocyte subpopulations and primary systemic lupus erythematosus
- A novel SLC8A1-ALK fusion in lung adenocarcinoma confers sensitivity to alectinib: A case report
- β-Hydroxybutyrate upregulates FGF21 expression through inhibition of histone deacetylases in hepatocytes
- Identification of metabolic genes for the prediction of prognosis and tumor microenvironment infiltration in early-stage non-small cell lung cancer
- BTBD10 inhibits glioma tumorigenesis by downregulating cyclin D1 and p-Akt
- Mucormycosis co-infection in COVID-19 patients: An update
- Metagenomic next-generation sequencing in diagnosing Pneumocystis jirovecii pneumonia: A case report
- Long non-coding RNA HOXB-AS1 is a prognostic marker and promotes hepatocellular carcinoma cells’ proliferation and invasion
- Preparation and evaluation of LA-PEG-SPION, a targeted MRI contrast agent for liver cancer
- Proteomic analysis of the liver regulating lipid metabolism in Chaohu ducks using two-dimensional electrophoresis
- Nasopharyngeal tuberculosis: A case report
- Characterization and evaluation of anti-Salmonella enteritidis activity of indigenous probiotic lactobacilli in mice
- Aberrant pulmonary immune response of obese mice to periodontal infection
- Bacteriospermia – A formidable player in male subfertility
- In silico and in vivo analysis of TIPE1 expression in diffuse large B cell lymphoma
- Effects of KCa channels on biological behavior of trophoblasts
- Interleukin-17A influences the vulnerability rather than the size of established atherosclerotic plaques in apolipoprotein E-deficient mice
- Multiple organ failure and death caused by Staphylococcus aureus hip infection: A case report
- Prognostic signature related to the immune environment of oral squamous cell carcinoma
- Primary and metastatic squamous cell carcinoma of the thyroid gland: Two case reports
- Neuroprotective effects of crocin and crocin-loaded niosomes against the paraquat-induced oxidative brain damage in rats
- Role of MMP-2 and CD147 in kidney fibrosis
- Geometric basis of action potential of skeletal muscle cells and neurons
- Babesia microti-induced fulminant sepsis in an immunocompromised host: A case report and the case-specific literature review
- Role of cerebellar cortex in associative learning and memory in guinea pigs
- Application of metagenomic next-generation sequencing technique for diagnosing a specific case of necrotizing meningoencephalitis caused by human herpesvirus 2
- Case report: Quadruple primary malignant neoplasms including esophageal, ureteral, and lung in an elderly male
- Long non-coding RNA NEAT1 promotes angiogenesis in hepatoma carcinoma via the miR-125a-5p/VEGF pathway
- Osteogenic differentiation of periodontal membrane stem cells in inflammatory environments
- Knockdown of SHMT2 enhances the sensitivity of gastric cancer cells to radiotherapy through the Wnt/β-catenin pathway
- Continuous renal replacement therapy combined with double filtration plasmapheresis in the treatment of severe lupus complicated by serious bacterial infections in children: A case report
- Simultaneous triple primary malignancies, including bladder cancer, lymphoma, and lung cancer, in an elderly male: A case report
- Preclinical immunogenicity assessment of a cell-based inactivated whole-virion H5N1 influenza vaccine
- One case of iodine-125 therapy – A new minimally invasive treatment of intrahepatic cholangiocarcinoma
- S1P promotes corneal trigeminal neuron differentiation and corneal nerve repair via upregulating nerve growth factor expression in a mouse model
- Early cancer detection by a targeted methylation assay of circulating tumor DNA in plasma
- Calcifying nanoparticles initiate the calcification process of mesenchymal stem cells in vitro through the activation of the TGF-β1/Smad signaling pathway and promote the decay of echinococcosis
- Evaluation of prognostic markers in patients infected with SARS-CoV-2
- N6-Methyladenosine-related alternative splicing events play a role in bladder cancer
- Characterization of the structural, oxidative, and immunological features of testis tissue from Zucker diabetic fatty rats
- Effects of glucose and osmotic pressure on the proliferation and cell cycle of human chorionic trophoblast cells
- Investigation of genotype diversity of 7,804 norovirus sequences in humans and animals of China
- Characteristics and karyotype analysis of a patient with turner syndrome complicated with multiple-site tumors: A case report
- Aggravated renal fibrosis is positively associated with the activation of HMGB1-TLR2/4 signaling in STZ-induced diabetic mice
- Distribution characteristics of SARS-CoV-2 IgM/IgG in false-positive results detected by chemiluminescent immunoassay
- SRPX2 attenuated oxygen–glucose deprivation and reperfusion-induced injury in cardiomyocytes via alleviating endoplasmic reticulum stress-induced apoptosis through targeting PI3K/Akt/mTOR axis
- Aquaporin-8 overexpression is involved in vascular structure and function changes in placentas of gestational diabetes mellitus patients
- Relationship between CRP gene polymorphisms and ischemic stroke risk: A systematic review and meta-analysis
- Effects of growth hormone on lipid metabolism and sexual development in pubertal obese male rats
- Cloning and identification of the CTLA-4IgV gene and functional application of vaccine in Xinjiang sheep
- Antitumor activity of RUNX3: Upregulation of E-cadherin and downregulation of the epithelial–mesenchymal transition in clear-cell renal cell carcinoma
- PHF8 promotes osteogenic differentiation of BMSCs in old rat with osteoporosis by regulating Wnt/β-catenin pathway
- A review of the current state of the computer-aided diagnosis (CAD) systems for breast cancer diagnosis
- Bilateral dacryoadenitis in adult-onset Still’s disease: A case report
- A novel association between Bmi-1 protein expression and the SUVmax obtained by 18F-FDG PET/CT in patients with gastric adenocarcinoma
- The role of erythrocytes and erythroid progenitor cells in tumors
- Relationship between platelet activation markers and spontaneous abortion: A meta-analysis
- Abnormal methylation caused by folic acid deficiency in neural tube defects
- Silencing TLR4 using an ultrasound-targeted microbubble destruction-based shRNA system reduces ischemia-induced seizures in hyperglycemic rats
- Plant Sciences
- Seasonal succession of bacterial communities in cultured Caulerpa lentillifera detected by high-throughput sequencing
- Cloning and prokaryotic expression of WRKY48 from Caragana intermedia
- Novel Brassica hybrids with different resistance to Leptosphaeria maculans reveal unbalanced rDNA signal patterns
- Application of exogenous auxin and gibberellin regulates the bolting of lettuce (Lactuca sativa L.)
- Phytoremediation of pollutants from wastewater: A concise review
- Genome-wide identification and characterization of NBS-encoding genes in the sweet potato wild ancestor Ipomoea trifida (H.B.K.)
- Alleviative effects of magnetic Fe3O4 nanoparticles on the physiological toxicity of 3-nitrophenol to rice (Oryza sativa L.) seedlings
- Selection and functional identification of Dof genes expressed in response to nitrogen in Populus simonii × Populus nigra
- Study on pecan seed germination influenced by seed endocarp
- Identification of active compounds in Ophiopogonis Radix from different geographical origins by UPLC-Q/TOF-MS combined with GC-MS approaches
- The entire chloroplast genome sequence of Asparagus cochinchinensis and genetic comparison to Asparagus species
- Genome-wide identification of MAPK family genes and their response to abiotic stresses in tea plant (Camellia sinensis)
- Selection and validation of reference genes for RT-qPCR analysis of different organs at various development stages in Caragana intermedia
- Cloning and expression analysis of SERK1 gene in Diospyros lotus
- Integrated metabolomic and transcriptomic profiling revealed coping mechanisms of the edible and medicinal homologous plant Plantago asiatica L. cadmium resistance
- A missense variant in NCF1 is associated with susceptibility to unexplained recurrent spontaneous abortion
- Assessment of drought tolerance indices in faba bean genotypes under different irrigation regimes
- The entire chloroplast genome sequence of Asparagus setaceus (Kunth) Jessop: Genome structure, gene composition, and phylogenetic analysis in Asparagaceae
- Food Science
- Dietary food additive monosodium glutamate with or without high-lipid diet induces spleen anomaly: A mechanistic approach on rat model
- Binge eating disorder during COVID-19
- Potential of honey against the onset of autoimmune diabetes and its associated nephropathy, pancreatitis, and retinopathy in type 1 diabetic animal model
- FTO gene expression in diet-induced obesity is downregulated by Solanum fruit supplementation
- Physical activity enhances fecal lactobacilli in rats chronically drinking sweetened cola beverage
- Supercritical CO2 extraction, chemical composition, and antioxidant effects of Coreopsis tinctoria Nutt. oleoresin
- Functional constituents of plant-based foods boost immunity against acute and chronic disorders
- Effect of selenium and methods of protein extraction on the proteomic profile of Saccharomyces yeast
- Microbial diversity of milk ghee in southern Gansu and its effect on the formation of ghee flavor compounds
- Ecology and Environmental Sciences
- Effects of heavy metals on bacterial community surrounding Bijiashan mining area located in northwest China
- Microorganism community composition analysis coupling with 15N tracer experiments reveals the nitrification rate and N2O emissions in low pH soils in Southern China
- Genetic diversity and population structure of Cinnamomum balansae Lecomte inferred by microsatellites
- Preliminary screening of microplastic contamination in different marine fish species of Taif market, Saudi Arabia
- Plant volatile organic compounds attractive to Lygus pratensis
- Effects of organic materials on soil bacterial community structure in long-term continuous cropping of tomato in greenhouse
- Effects of soil treated fungicide fluopimomide on tomato (Solanum lycopersicum L.) disease control and plant growth
- Prevalence of Yersinia pestis among rodents captured in a semi-arid tropical ecosystem of south-western Zimbabwe
- Effects of irrigation and nitrogen fertilization on mitigating salt-induced Na+ toxicity and sustaining sea rice growth
- Bioengineering and Biotechnology
- Poly-l-lysine-caused cell adhesion induces pyroptosis in THP-1 monocytes
- Development of alkaline phosphatase-scFv and its use for one-step enzyme-linked immunosorbent assay for His-tagged protein detection
- Development and validation of a predictive model for immune-related genes in patients with tongue squamous cell carcinoma
- Agriculture
- Effects of chemical-based fertilizer replacement with biochar-based fertilizer on albic soil nutrient content and maize yield
- Genome-wide identification and expression analysis of CPP-like gene family in Triticum aestivum L. under different hormone and stress conditions
- Agronomic and economic performance of mung bean (Vigna radiata L.) varieties in response to rates of blended NPS fertilizer in Kindo Koysha district, Southern Ethiopia
- Influence of furrow irrigation regime on the yield and water consumption indicators of winter wheat based on a multi-level fuzzy comprehensive evaluation
- Discovery of exercise-related genes and pathway analysis based on comparative genomes of Mongolian originated Abaga and Wushen horse
- Lessons from integrated seasonal forecast-crop modelling in Africa: A systematic review
- Evolution trend of soil fertility in tobacco-planting area of Chenzhou, Hunan Province, China
- Animal Sciences
- Morphological and molecular characterization of Tatera indica Hardwicke 1807 (Rodentia: Muridae) from Pothwar, Pakistan
- Research on meat quality of Qianhua Mutton Merino sheep and Small-tail Han sheep
- SI: A Scientific Memoir
- Suggestions on leading an academic research laboratory group
- My scientific genealogy and the Toronto ACDC Laboratory, 1988–2022
- Erratum
- Erratum to “Changes of immune cells in patients with hepatocellular carcinoma treated by radiofrequency ablation and hepatectomy, a pilot study”
- Erratum to “A two-microRNA signature predicts the progression of male thyroid cancer”
- Retraction
- Retraction of “Lidocaine has antitumor effect on hepatocellular carcinoma via the circ_DYNC1H1/miR-520a-3p/USP14 axis”