Optimization of extraction using surface response methodology and quantification of cannabinoids in female inflorescences of marijuana (Cannabis sativa L.) at three altitudinal floors of Peru
-
Clara Espinoza-Silva
 ,
Erika Pascual
,
Erika Pascual

Abstract
The aim of this study was to extract and quantify cannabinoids from female inflorescences of Cannabis sativa L. from three altitudinal floors of Peru, by optimizing the amplitude, time, and methanol concentration in the ultrasound-assisted extraction required to maximize cannabidiol (CBD), delta-9-tetrahydrocannabinol (Δ9-THC) content, and yields. Optimal extraction conditions were determined by response surface and the central composite design was used. The quadratic model was adequate for yield, Δ9-THC, and CBD with R 2 values of 0.998, 0.985, and 0.991 respectively. Optimal conditions were 99% radiation amplitude, 20 min extraction time, and 96% ethanol concentration. The optimized extract of C. sativa L. inflorescences had a yield of 24.12%, 0.62% CBD, and 5.973% THC. The content of cannabinoids studied in the Junín Region at altitudes between 2,070 and 3,274 m above sea level (m asl) had a CBD content between 0.1 and 0.4%, THC between 2.2 and 6%, and yield of 10–24%; in the Ayacucho region at an altitude of 2,627 m asl the CBD content was between 0.62 and 0.65%, THC was 6.21–6.72%, and yield of 23.8–24%; and in the Huánuco region at altitude of 660–711 m asl it had a CBD content between 0.55 and 0.65%, THC from 8.11 to 8.92%, and yield from 24.3 to 29.7%. It was concluded from the present work that the parameters such as amplitude, time, and solvent directly influence the extraction yield, in the same way the altitude influences the content of cannabinoids, being lower yields at higher planting altitude.
1 Introduction
Due to the legalization of marijuana planting in Peru, for medicinal purposes, the need arises to know the content of main cannabinoids present in Cannabis plants found in three regions of Peru, and cultivated in the wild. These regions are located at different altitudes where the Cannabis plants have acclimatized, so through this study we will be able to know the content of cannabinoids, and therefore identify the region that produces Cannabis with better contents of the main cannabinoids, in order to be able to use these heated seeds and avoid importation, with the risks it contemplates, such as the transmission of diseases for example. In many countries, as well as in Perú, cannabis-based medicines are being legalized. More than 480 active compounds have been isolated from cannabis and one-third belongs to the cannabinoid family. Cannabidiol (CBD), delta-9-tetrahydrocannabinol (Δ9-THC) are the most common and most studied cannabinoids [1,2], because they are the ones that have been shown, according to studies, to have a strong influence on the effects of medical products derived from cannabis. Δ9-THC is known to have psychoactive properties and CBD is known for its medicinal potential [3].
THC is the main psychoactive compound of cannabis, it is attributed for the stimulation of specific receptors in the brain that cause various effects and alterations such as reduced pain and inflammation, increased appetite, nausea, and insomnia. CBD is a non-psychoactive cannabinoid; it does not cause psychotropic effects. More and more studies show its efficacy in relieving symptoms of anxiety, inflammation, pain, and the treatment of various neurological diseases. These compounds are involved in the treatment of several types of cancer, epilepsy, Parkinson’s disease, chronic pain, asthma, and showing various mechanisms of action, making Cannabis sativa a plant with significant pharmacological potential [4,5]. This is the reason why many countries have already legalized the cultivation of marijuana for medicinal purposes and why several research studies have been published with different methods of cannabinoids extraction, using microwaves [6], supercritical CO2 extraction [7], hot water [8], enzymes [9], and ultrasound [10], with the aim of increasing the extraction yield and the content of bioactive compounds. Currently, the extraction of cannabinoids by maceration in alcohol is still used, although it is an ancient method for extraction. Alcohol-based extraction is particularly useful for the preparation of cannabis tincture containing cannabinoids. The ultrasound-assisted extraction method has become more attractive due to its various advantages, such as low energy consumption, less extraction time, less damage by active compounds, and high extraction yields compared to conventional extraction methods. Ultrasound-assisted extraction has been successfully used in the extraction of several medicinal compounds, including alkaloids, flavonoids, glycosides, phenolic compounds, and polysaccharides from plants in laboratory research [11]. Ultrasound extraction reduces the extraction time compared to traditional methods [12]. Ultrasound produces a cavitation effect, which can cause physical and mechanical changes in raw materials, facilitating the extraction of compounds [13,14].
Response surface methodology is a collection of techniques that allows the researcher to inspect a response, which can be shown as a surface, when experiments investigate the effect of varying quantitative factors on the values taken by a dependent variable or response. That is, it is about finding the optimal values for the independent variables that maximize, minimize, or meet certain restrictions on the response variable. Response surface methodology is a set of mathematical and statistical techniques that are useful for modeling and analysis in applications where a response of interest is influenced by different variables and the aim is to optimize this response [15].
Therefore, in this study it is proposed to optimize the extraction through the response surface methodology, maximizing the extraction of cannabinoids (CBD and THC) and yield, from the inflorescence of Cannabis from the three regions of Peru, using a green technique such as ultrasound.
2 Materials and methods
2.1 Plant materials
Inflorescence samples of C. sativa L. were collected in three regions of Peru and at different altitudinal levels between 3,300 and 601 m above sea level (m asl), which grow in the wild. For the study of optimization of extraction parameters, we worked with samples from a single altitudinal floor (Junín), and the parameters were taken for the rest of the samples. The collected samples were stored in darkness until they were used for the experimentation. To carry out the experimentation, the samples were crushed and passed through a sieve No. 30 with an aperture size of 590 μm.
2.2 Reagent and solvents
Methanol gradient grade for liquid chromatography LiChrosolv® Reag., and methanol for analysis EMSURE® ACS, ISO, Reag. acetonitrile for HPLC, gradient grade ≥99.9%, chloroform suitable for HPLC ≥99.8%, HPLC grade pure water, standard CBD (1.0 mg/mL) in methanol, analytical standard, for drug analysis, Δ9-THC (1.0 mg/mL) in methanol, analytical standard, for drug analysis de MERCK
2.3 Extraction procedure
Five grams of the inflorescences that was suspended in 50 mL of methanol (76–96%) and exposed to sonication with amplitude (50–100%) and time (10–20 min) variable according to the experimental design was used. For the extraction of cannabinoids of inflorescences, a compact ultrasonic laboratory device UP 100H (Hielscher Ultrasound Technology, Teltow, Germany) of 100 W and 30 kHz of power was used. This equipment can adjust the power output by adjusting the amplitude percentage. A sonotrode MS 7 was used with a pulse control set to 1 cycle of continuous operation
2.4 Yield determination
The yield of the extracts was determined by drying a known weight of the extract in a glass petri dish, in an oven at 50°C for 4 h. After ensuring complete evaporation of the solvent, the extracts were reweighed and the yield was calculated as a percentage of the dry weight of plant.
2.5 Phytochemical analysis of cannabinoids by HPLC
First, the extract obtained by sonication was decarboxylated of the above extract and was transferred to a derivatization vessel. About 200 μL of the above extract was transferred to a bypass vessel. The solvent was evaporated in nitrogen gas until dry. The sample was decarboxylated for 15 min at 210°C. The residue was dissolved in 200 μL of methanol: chloroform (9:1 v/v). Quantification of cannabinoids was performed on a Shimadzu LC-10AD HPLC instrument, column: 250 mm × 4 mm RP-8 (5 μm); column temperature: 30°C, mobile phase: acetonitrile: water (8:2 v/v), isocratic, downtime: 10 min, flow: 1 mL/min, detection: photodiode matrix (PDA), 220 and 240 nm, injection: 10 μL [16].
2.6 Experimental design and statistical analysis
The surface response methodology was used to evaluate and optimize the effect of the variables solvent concentration, time, and amplitude on the yield and cannabinoids content (THC and CBD). The experiment was conducted based on the central composite design (CCD). In the design, coded levels are used to model the experimental data as shown in Table 1, each predictor has three levels of −1, 0, and 1 corresponding to the lower, central, and upper values, respectively. In the present study, the amplitude range from 50 to 100%, time range from 10 to 20 min, and the percentage of methanol used was from 76 to 96%. In a CCD, the distance from the center to a star point, represented by “α” is ±1, since the star points are located at the center of each face of the design space. For the three-factor CCD, 18 experimental runs and four center point replicas were performed randomly. The parameters or responses were yield by weight and performance of THC and CBD. Design Expert Software was used to perform statistical and regression analysis of the design and fit an appropriate mathematical model to the experimental data. Analysis of variance for each of the responses was performed with a 95% confidence interval to determine the significant differences within the means based on probability or “p-value” (p < 0.05). Finally, the design optimization of the predictors for optimal values of the answers based on the desirability function was performed after testing the model to determine its importance and reliability.
Level of variables selected in the factorial design and response surface methodology, through CCD of the three factors with three levels
| Run no. | Coded factors | Decoded factors | ||||
|---|---|---|---|---|---|---|
| A | B | C | Amplitude (%) | Time (min) | Solvent (%) | |
| 1 | 0 | 0 | 0 | 75 | 15 | 86 |
| 2 | −1 | 1 | −1 | 50 | 20 | 76 |
| 3 | −1 | −1 | 1 | 50 | 10 | 96 |
| 4 | −1 | 1 | 1 | 50 | 20 | 96 |
| 5 | 0 | 0 | 0 | 75 | 15 | 86 |
| 6 | 0 | 0 | 0 | 75 | 15 | 86 |
| 7 | 0 | −1 | 0 | 75 | 10 | 86 |
| 8 | 0 | 1 | 0 | 75 | 20 | 86 |
| 9 | 1 | 1 | 1 | 100 | 20 | 96 |
| 10 | −1 | 0 | 0 | 50 | 15 | 86 |
| 11 | 0 | 0 | 1 | 75 | 15 | 96 |
| 12 | −1 | −1 | −1 | 50 | 10 | 76 |
| 13 | 1 | −1 | 1 | 100 | 10 | 96 |
| 14 | 0 | 0 | 0 | 75 | 15 | 86 |
| 15 | 1 | 1 | −1 | 100 | 20 | 76 |
| 16 | 1 | 0 | 0 | 100 | 15 | 86 |
| 17 | 1 | −1 | −1 | 100 | 10 | 76 |
| 18 | 0 | 0 | −1 | 75 | 15 | 76 |
A, B, and C are coded factors of amplitude, time, and solvent.
3 Results and discussion
Table 2 shows that the content of CBD is between 0.15 and 0.62% and the content of THC between 3.2 and 6.01%, it is very similar to the results obtained in the study of Florian et al. [17] in several regions of Colombia.
Different combinations generated by the CCD and the responses recorded for each experiment of the yield, CBD, and THC content
| Run no. | Factors | Responses | ||||
|---|---|---|---|---|---|---|
| Amplitude (%) | Time (min) | Solvent (%) | Yield (%) | CBD (mg/100 g) | THC (mg/100 g) | |
| 1 | 75 | 15 | 86 | 18.25 | 0.55 | 5.85 |
| 2 | 50 | 20 | 76 | 17.35 | 0.15 | 3.21 |
| 3 | 50 | 10 | 96 | 17.6 | 0.17 | 3.68 |
| 4 | 50 | 20 | 96 | 17.79 | 0.18 | 3.7 |
| 5 | 75 | 15 | 86 | 18.2 | 0.52 | 5.8 |
| 6 | 75 | 15 | 86 | 18.25 | 0.55 | 5.85 |
| 7 | 75 | 10 | 86 | 18 | 0.54 | 5.84 |
| 8 | 75 | 20 | 86 | 18.31 | 0.56 | 5.83 |
| 9 | 100 | 20 | 96 | 24.12 | 0.61 | 6.01 |
| 10 | 50 | 15 | 86 | 17.92 | 0.16 | 3.48 |
| 11 | 75 | 15 | 96 | 18.56 | 0.58 | 5.9 |
| 12 | 50 | 10 | 76 | 17.42 | 0.15 | 3.2 |
| 13 | 100 | 10 | 96 | 23.51 | 0.62 | 5.99 |
| 14 | 75 | 15 | 86 | 18.25 | 0.55 | 5.85 |
| 15 | 100 | 20 | 76 | 22.72 | 0.6 | 5.78 |
| 16 | 100 | 15 | 86 | 23.42 | 0.6 | 5.82 |
| 17 | 100 | 10 | 76 | 22.42 | 0.58 | 5.8 |
| 18 | 75 | 15 | 76 | 17.62 | 0.53 | 5.75 |
Based on the data in Table 2, statistical analysis was performed.
3.1 Fit to model and analysis
The yield, THC, and CBD obtained in the treatments experimentally was used to calculate the coefficients of the second-order polynomial equation, the regression coefficients, and the “p” values. The regression model was established among yield (X), THC (Y), and CBD (Z) (Table 3).
Models for multivariate quadratic regression fitting
| Model | R 2 | Adjusted R 2 | Predicted R 2 | Prob >F | Lack of fit |
|---|---|---|---|---|---|
| X = 18.25 + 2.811 * A + 0.134 * B + 0.405 * C + 0.09875 * AB + 0.23375 * AC + 0.0713 * BC + 2.40 * A 2 − 0.11B 2 − 0.17556 * C 2 | 0.9998 | 0.9995 | 0.9982 | <0.01 | Not significant |
| Y = 0.5458 + 0.22 * A + 0.004 * B + 0.015 * C + 0 * AB + 0 * AC − 0.002 * BC − 0.169 * A 2 + 0.0008 * B 2 + 0.006 * C 2 | 0.9978 | 0.9954 | 0.9855 | <0.01 | Not significant |
| Z = 5.83 + 1.213 * A + 0.002 * B + 0.154 * C − 0.004 * AB − 0.069 * AC + 0.006 * BC − 1.1737 * A 2 + 0.0113 * B 2 + 0.0013 * C 2 | 0.9989 | 0.9977 | 0.9919 | <0.01 | Not significant |
X – yield, Y – THC content, Z – CBD content.
Response surface graph (3D) plots of yield (X), THC (Y), and CBD (Z) are shown based on the importance of the interaction between factors: A – radiation amplitude and ethanol concentration, B – time, and C – methanol concentration.
The experimentally obtained values for THC and CBD yield and content show a p-value of less than 0.05, significant for the model. The response surface plots shown in Figure 1 represent the interaction and influence of factors on the extraction yield and THC and CBD content of the extracts. The values found for the optimization of amplitude, time, and methanol concentration were very similar to those found by Agarwal et al. [10]. It was observed that by increasing the amplitude, time, and concentration of solvent, the yield and content of THC and CBD increases. This could be due to the fact that by increasing the amplitude, ultrasonic radiation facilitates the rupture of the cell walls by sonication, and the bubbles formed break the tissue of the cell walls, releasing the contents, thus increasing the yield and content of THC and CBD, a phenomenon that was also found by Kollia et al. [18] when using ultrasound in extraction of phenolic compounds. This improvement in ultrasound extraction could be attributed to ultrasonic effects, the acoustic transmission and the intensity of the echo transmitted to the medium is directly related to the vibration amplitude of sonication, producing a greater number of cavitation bubbles and, therefore, higher extraction efficiency [19]. Similarly, changes in ethanol concentration modify the physical properties of the solvent, such as density, dynamic viscosity, and dielectric constant, which can influence extractions and modify solubilities [20]. Finally, extraction time is associated with input power and improves ultrasonic extraction [13]. However, a longer extraction time with ultrasound treatment could induce degradation of bioactive compounds [21]. The strong positive influence of time can be explained by the fact that more mass is extracted as time passes.
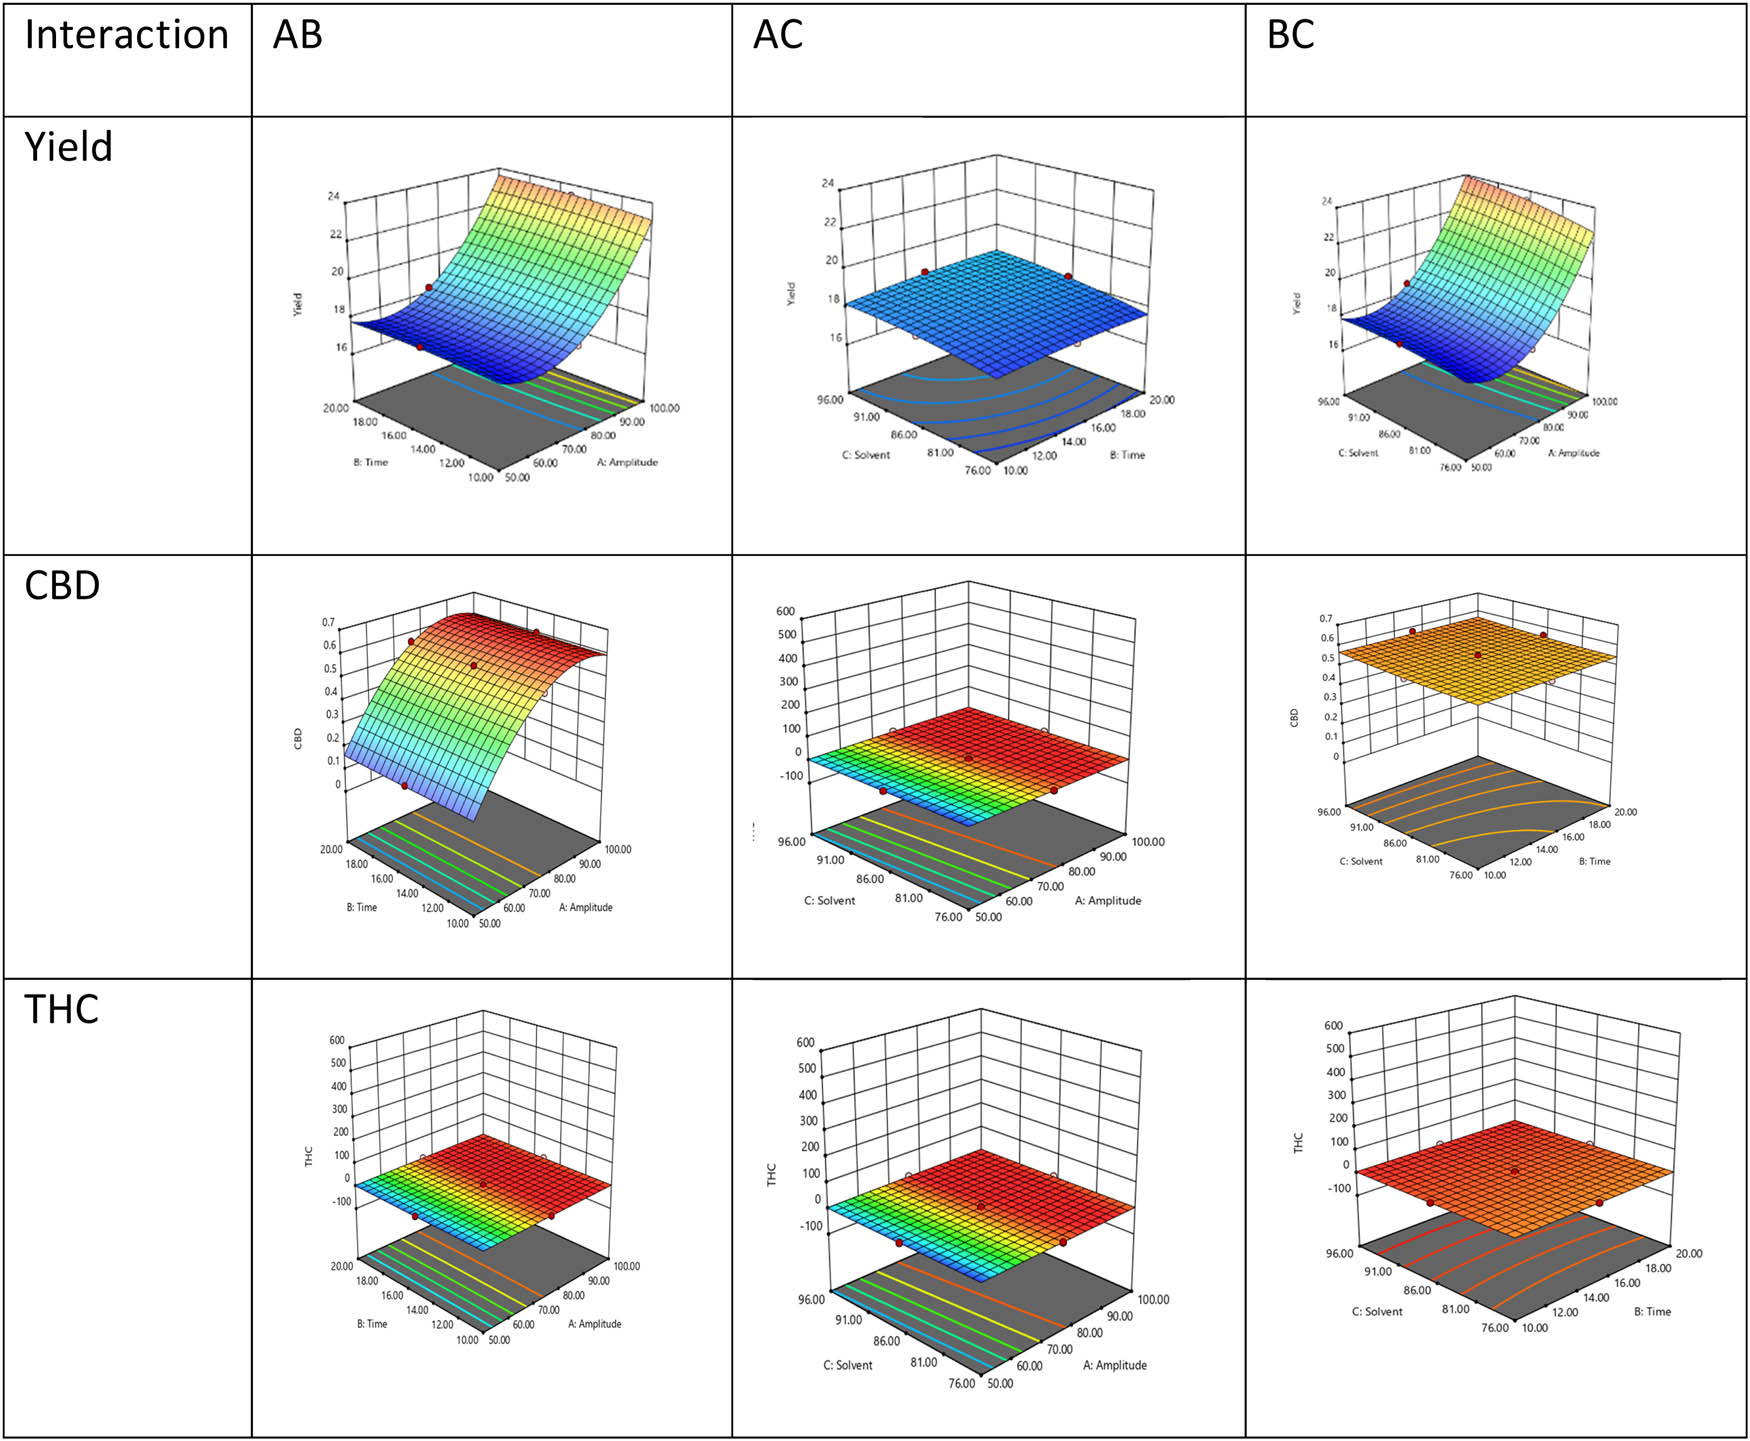
Response surface plots (3D) representing the influence of factors, solvent, amplitude, and time; for yield, THC, and CBD content.
3.2 Validation of optimal extraction conditions
The estimated levels of optimal extraction conditions, for maximum response and yield, THC, and CBD, with desirability value of 0.99, were amplitude of 99%, time 20 min. and methanol concentration of 96%, to obtain a yield of 24.12%, CBD of 0.620%, and THC of 5.973%. The quantification of yield, THC, and CBD content was carried out to verify what was reported by the model for the sample studied taking into account the parameters optimized by the software and a content similar to that reported by the software was found. The optimization criteria for the tea formulation were to maximize the yield and content of CBD and THC. Solvent amplitude, time, and concentration have been shown to have a positive correlation with THC and CBD yield and content. The confidence intervals for performance were 95% low CI = 23.94 and 95% high CI = 24.29, for THC content 95% low CI = 5.80 and 95% high CI = 6.13, and for CBD 95% low CI = 0.58 and 95% high CI = 0.66, confirmed that the model results are adequate and effective. The values obtained for amplitude and concentration of solvent were very similar to those found by Agarwal et al. [10]. The predicted R 2 value shows values of 0.99 for all three factors, demonstrating a good prediction for our optimization equation.
3.3 Quantification of cannabinoids from samples collected in different departments
With the optimized parameters, the extraction and quantification of cannabinoids from the cannabinoids collected in different regions and altitudinal floors of Peru, which show a marked difference between them, was carried out (Table 4).
Quantification of THC and CBD for inflorescences of C. sativa L. in three regions of Peru and different altitudinal floors
| REGIONN | JUNIN | AYACUCHO | HUANUCO | ||||||||||
|---|---|---|---|---|---|---|---|---|---|---|---|---|---|
| Altitude (m asl) | % | s.d. | Altitude (m asl) | % | s.d. | Altitude (m asl) | % | s.d. | |||||
| CBD | 3,274 | M1 | 0.1 | 0.05 | 2,627 | M1 | 0.65 | 0.08 | 711 | M1 | 0.55 | 0.1 | |
| 2,070 | M2 | 0.6 | 0.02 | 2,627 | M2 | 0.62 | 0.03 | 711 | M2 | 0.78 | 0.09 | ||
| 3,274 | M3 | 0.4 | 0.01 | 660 | M3 | 0.65 | 0.02 | ||||||
| THC | 3,274 | M1 | 2.2 | 0.21 | 2,627 | M1 | 6.72 | 0.15 | 711 | M1 | 8.92 | 0.85 | |
| 2,070 | M2 | 6 | 0.14 | 2,627 | M2 | 6.21 | 0.98 | 711 | M2 | 9.12 | 0.25 | ||
| 3,274 | M3 | 3.4 | 0.18 | 660 | M3 | 8.11 | 0.23 | ||||||
| YIELD | 3,274 | M1 | 10 | 0.33 | 2,627 | M1 | 23.8 | 0.14 | 711 | M1 | 24.3 | 1.2 | |
| 2,070 | M2 | 24 | 0.42 | 2,627 | M2 | 24 | 0.12 | 711 | M2 | 24.7 | 1.56 | ||
| 3,274 | M3 | 14 | 0.82 | 660 | M3 | 24.4 | 0.92 | ||||||
M – sample.
Each of them corresponds to a different altitude, with different climates, and it is observed that there are differences in their content being the Huánuco region the one that reports higher levels of THC and CBD. The factors that affect the quality and quantity of phytochemicals as well as bioactivity and altitude have been the most discussed, followed by climatic and edaphic factors [22]. Climatic factors, UV-B radiation, and temperature have effects on plant chemistry, because increased UV-B radiation and decreased temperature have caused plant cells to produce reactive oxygen species resulting in damage other than DNA and several other cellular structures as mentioned [23]. This is evidenced in the results of this work, where different values of cannabinoids are found in the three regions of Peru. From these results it could be said that planting would be recommended in the department of Huánuco because it has greater content of the cannabinoids studied.
4 Conclusions
R 2 values show that amplitude, time, and concentration are factors that directly influence the performance of cannabinoids for ultrasound-assisted extraction, obtaining an amplitude of 99%, time of 20 min, and methanol concentration of 96%, to maximize the yield and content of CBD and THC. The altitude in the three regions of Peru studied influences the content of cannabinoids present in the inflorescences, being those of the department of Huánuco at an altitude of 660 m asl the one that shows the highest content of cannabinoids.
-
Funding information: This work was supported by the CONCYTEC (Consejo Nacional de Ciencia y Tecnología-Perú) with the proyect 396-2019.
-
Conflict of interest: The authors state no conflict of interest.
-
Data availability statement: The datasets generated during and/or analyzed during the current study are available from the corresponding author on reasonable request.
References
[1] Pacher P, Bátkai S, Kunos G. The endocannabinoid system as an emerging target of pharmacotherapy. Pharmacol Rev. 2006;58(3):389–462. 10.1124/pr.58.3.2.Suche in Google Scholar PubMed PubMed Central
[2] Atoloye I, Adesina I, Shahbazi A, Bhowmik A. Response of cannabidiol hemp (Cannabis sativa L.) varieties grown in the southeastern United States to nitrogen fertilization. Open Agriculture. 2022;7(1):373–81. 10.1515/opag-2022-0094.Suche in Google Scholar
[3] Izzo AA, Borrelli F, Capasso R, Di Marzo V, Mechoulam R. Non-psychotropic plant cannabinoids: new therapeutic opportunities from an ancient herb. Trends Pharmacol Sci. 2009 Oct;30(10):515–27. 10.1016/j.tips.2009.07.006; Trends Pharmacol Sci. 2009;30(12):609. PMID: 19729208.Suche in Google Scholar PubMed
[4] Clarke RC, Watson DP. Cannabis y Medicinas Naturales de Cannabis. In: ElSohly MA, editor. La marihuana y los cannabinoides. Medicina y Ciencias Forenses. Prensa Humana; 2007. 10.1007/978-1-59259-947-9_1.Suche in Google Scholar
[5] Kumar P, Mahato DK, Kamle M, Borah R, Sharma B, Pandhi S, et al. Pharmacological properties, therapeutic potential, and legal status of Cannabis sativa L.: an overview. Phytother Res. 2021;35(11):6010–29. 10.1002/ptr.7213.Suche in Google Scholar PubMed
[6] Drinić Z, Vladić J, Koren A, Zeremski T, Stojanov N, Kiprovski B, et al. Microwave-assisted extraction of cannabinoids and antioxidants from Cannabis sativa aerial parts and process modeling. J Chem Technol Biotechnol. 2020;95:831–9. 10.1002/jctb.6273.Suche in Google Scholar
[7] Grijó DR, Vieitez Osorio IA, Cardozo-Filho L. Supercritical extraction strategies using CO2 and ethanol to obtain cannabinoid compounds from Cannabis hybrid flowers. J Co2 Util. 2018;28:174–80. 10.1016/j.jcou.2018.12.014.Suche in Google Scholar
[8] Shin SJ, Sung YJ. Improving enzymatic hydrolysis of industrial hemp (Cannabis sativa L.) by electron beam irradiation. Radiat Phys Chem. 2008;77:1034–8. 10.1016/j.radphyschem.2008.05.047.Suche in Google Scholar
[9] Kitryte V, Bagdonaite D, Rimantas Venskutonis P. Biorefining of industrial hemp (Cannabis sativa L.) threshing residues into cannabinoid and antioxidant fractions by supercritical carbon dioxide, pressurized liquid and enzyme-assisted extractions. Food Chem. 2018;267:420–9. 10.1016/j.foodchem.2017.09.080.Suche in Google Scholar PubMed
[10] Agarwal C, Máthé K, Hofmann T, Csóka L. Ultrasound-assisted extraction of cannabinoids from Cannabis sativa L. optimized by response surface methodology. J Food Sci. 2018;83(3):700–10. 10.1111/1750-3841.14075.Suche in Google Scholar PubMed
[11] Aihua S, Xiaoyan C, Xiaoguang Y, Jiang F, Yanmin L, Juhua Z. Applications and prospects of ultrasound-assisted extraction in Chinese herbal medicine. 2019;1(1):OAJBS.ID.000103. 10.38125/OAJBS.000103.Suche in Google Scholar
[12] Picó Y. Ultrasound-assisted extraction for food and environmental samples. Trends Anal Chem. 2013;43:84–99. 10.1016/J.TRAC.2012.12.005.Suche in Google Scholar
[13] Chemat F, Rombaut N, Sicaire AG, Meullemiestre A, Fabiano-Tixier AS, Abert-Vian M. Ultrasound assisted extraction of food and natural products. Mechanisms, techniques, combinations, protocols and applications. A review. Ultrason Sonochem. 2017;34:540–60. 10.1016/j.ultsonch.2016.06.035.Suche in Google Scholar PubMed
[14] Espinoza CR, Ruiz CAJ, Ramos OPF, Solano MAQ, Quiñonez GH, Mallma NES. Optimization of the ultrasound-assisted extraction of saponins from quinoa (Chenopodium quinoa Wild) using response surface methodology. Acta Sci Pol Technol Aliment. 2021; Jan–Mar;20(1):17–23. 10.17306/J.AFS.0859.Suche in Google Scholar PubMed
[15] Dean A, Voss D, Draguljić D. Response surface methodology. In: Design and analysis of experiments. Springer texts in statistics. Cham: Springer; 2017. 10.1007/978-3-319-52250-0_16.Suche in Google Scholar
[16] UNODC (United Nations Office on Drug and Crime). Recommended methods for the identification and analysis of cannabis and cannabis products. New York, USA; 2009. https://www.unodc.org/documents/scientific/ST-NAR-40-Ebook_1.pdf.Suche in Google Scholar
[17] Florian MR, Néstor A, Parada F, William Garzón FM. Study of cannabinoids content in marihuana samples (Cannabis sativa L.) cultivated in several regions of Colombia. Vitae-revista De La Facultad De Quimica Farmaceutica; 2009. p. 237–44. ID: 97924991.10.17533/udea.vitae.1936Suche in Google Scholar
[18] Kollia E, Markaki P, Zoumpoulakis P, Proestos C. Antioxidant activity of Cynara scolymus L. and Cynara cardunculus L. extracts obtained by different extraction techniques. Nat Prod Res. 2017;31(10):1163–7. 10.1080/14786419.2016.1219864.Suche in Google Scholar PubMed
[19] Zakaria F, Tan JK, Mohd Faudzi SM, Abdul Rahman MB, Ashari SE. Ultrasound-assisted extraction conditions optimisation using response surface methodology from Mitragyna speciosa (Korth.) Havil leaves. Ultrason Sonochem. 2021 Nov 30;81:105851. 10.1016/j.ultsonch.2021.105851.Suche in Google Scholar PubMed PubMed Central
[20] Arteaga-Crespo Y, Radice M, Bravo-Sanchez LR, García-Quintana Y, Scalvenzi L. Optimisation of ultrasound-assisted extraction of phenolic antioxidants from Ilex guayusa Loes. leaves using response surface methodology. Heliyon. 2019;27(61):e03043. 10.1016/j.heliyon.2019.e03043.Suche in Google Scholar PubMed PubMed Central
[21] Tiwari BK, O’Donnell CP, Cullen PJ. Effect of sonication on retention of anthocyanins in blackberry juice. J Food Eng. 2009;93(2):166–71. 10.1016/j.jfoodeng.2009.01.027.Suche in Google Scholar
[22] Seyis F, Yurteri E, Özcan A, Cirak C. Altitudinal impacts on chemical content and composition of Hypericum perforatum, a prominent medicinal herb. South Afr J Botany. 2020;135:391–403. 10.1016/j.sajb.2020.09.034.Suche in Google Scholar
[23] Chelghoum M, Guenane H, Tahri D. Influence of altitude, precipitation, and temperature factors on the phytoconstituents, antioxidant, and α-amylase inhibitory activities of Pistacia atlantica. Food Measure. 2021;15:4411–25. 10.1007/s11694-021-01006-5.Suche in Google Scholar
© 2023 the author(s), published by De Gruyter
This work is licensed under the Creative Commons Attribution 4.0 International License.
Artikel in diesem Heft
- Regular Articles
- The impact of COVID-19 pandemic on business risks and potato commercial model
- Effects of potato (Solanum tuberosum L.)–Mucuna pruriens intercropping pattern on the agronomic performances of potato and the soil physicochemical properties of the western highlands of Cameroon
- Machine learning-based prediction of total phenolic and flavonoid in horticultural products
- Revamping agricultural sector and its implications on output and employment generation: Evidence from Nigeria
- Does product certification matter? A review of mechanism to influence customer loyalty in the poultry feed industry
- Farmer regeneration and knowledge co-creation in the sustainability of coconut agribusiness in Gorontalo, Indonesia
- Lablab purpureus: Analysis of landraces cultivation and distribution, farming systems, and some climatic trends in production areas in Tanzania
- The effects of carrot (Daucus carota L.) waste juice on the performances of native chicken in North Sulawesi, Indonesia
- Properties of potassium dihydrogen phosphate and its effects on plants and soil
- Factors influencing the role and performance of independent agricultural extension workers in supporting agricultural extension
- The fate of probiotic species applied in intensive grow-out ponds in rearing water and intestinal tracts of white shrimp, Litopenaeus vannamei
- Yield stability and agronomic performances of provitamin A maize (Zea mays L.) genotypes in South-East of DR Congo
- Diallel analysis of length and shape of rice using Hayman and Griffing method
- Physicochemical and microbiological characteristics of various stem bark extracts of Hopea beccariana Burck potential as natural preservatives of coconut sap
- Correlation between descriptive and group type traits in the system of cow’s linear classification of Ukrainian Brown dairy breed
- Meta-analysis of the influence of the substitution of maize with cassava on performance indices of broiler chickens
- Bacteriocin-like inhibitory substance (BLIS) produced by Enterococcus faecium MA115 and its potential use as a seafood biopreservative
- Meta-analysis of the benefits of dietary Saccharomyces cerevisiae intervention on milk yield and component characteristics in lactating small ruminants
- Growth promotion potential of Bacillus spp. isolates on two tomato (Solanum lycopersicum L.) varieties in the West region of Cameroon
- Prioritizing IoT adoption strategies in millennial farming: An analytical network process approach
- Soil fertility and pomelo yield influenced by soil conservation practices
- Soil macrofauna under laying hens’ grazed fields in two different agroecosystems in Portugal
- Factors affecting household carbohydrate food consumption in Central Java: Before and during the COVID-19 pandemic
- Properties of paper coated with Prunus serotina (Ehrh.) extract formulation
- Fertiliser cost prediction in European Union farms: Machine-learning approaches through artificial neural networks
- Molecular and phenotypic markers for pyramiding multiple traits in rice
- Natural product nanofibers derived from Trichoderma hamatum K01 to control citrus anthracnose caused by Colletotrichum gloeosporioides
- Role of actors in promoting sustainable peatland management in Kubu Raya Regency, West Kalimantan, Indonesia
- Small-scale coffee farmers’ perception of climate-adapted attributes in participatory coffee breeding: A case study of Gayo Highland, Aceh, Indonesia
- Optimization of extraction using surface response methodology and quantification of cannabinoids in female inflorescences of marijuana (Cannabis sativa L.) at three altitudinal floors of Peru
- Production factors, technical, and economic efficiency of soybean (Glycine max L. Merr.) farming in Indonesia
- Economic performance of smallholder soya bean production in Kwara State, Nigeria
- Indonesian rice farmers’ perceptions of different sources of information and their effect on farmer capability
- Feed preference, body condition scoring, and growth performance of Dohne Merino ram fed varying levels of fossil shell flour
- Assessing the determinant factors of risk strategy adoption to mitigate various risks: An experience from smallholder rubber farmers in West Kalimantan Province, Indonesia
- Analysis of trade potential and factors influencing chili export in Indonesia
- Grade-C kenaf fiber (poor quality) as an alternative material for textile crafts
- Technical efficiency changes of rice farming in the favorable irrigated areas of Indonesia
- Palm oil cluster resilience to enhance indigenous welfare by innovative ability to address land conflicts: Evidence of disaster hierarchy
- Factors determining cassava farmers’ accessibility to loan sources: Evidence from Lampung, Indonesia
- Tailoring business models for small-medium food enterprises in Eastern Africa can drive the commercialization and utilization of vitamin A rich orange-fleshed sweet potato puree
- Revitalizing sub-optimal drylands: Exploring the role of biofertilizers
- Effects of salt stress on growth of Quercus ilex L. seedlings
- Design and fabrication of a fish feed mixing cum pelleting machine for small-medium scale aquaculture industry
- Indicators of swamp buffalo business sustainability using partial least squares structural equation modelling
- Effect of arbuscular mycorrhizal fungi on early growth, root colonization, and chlorophyll content of North Maluku nutmeg cultivars
- How intergenerational farmers negotiate their identity in the era of Agriculture 4.0: A multiple-case study in Indonesia
- Responses of broiler chickens to incremental levels of water deprivation: Growth performance, carcass characteristics, and relative organ weights
- The improvement of horticultural villages sustainability in Central Java Province, Indonesia
- Effect of short-term grazing exclusion on herbage species composition, dry matter productivity, and chemical composition of subtropical grasslands
- Analysis of beef market integration between consumer and producer regions in Indonesia
- Analysing the sustainability of swamp buffalo (Bubalus bubalis carabauesis) farming as a protein source and germplasm
- Toxicity of Calophyllum soulattri, Piper aduncum, Sesamum indicum and their potential mixture for control Spodoptera frugiperda
- Consumption profile of organic fruits and vegetables by a Portuguese consumer’s sample
- Phenotypic characterisation of indigenous chicken in the central zone of Tanzania
- Diversity and structure of bacterial communities in saline and non-saline rice fields in Cilacap Regency, Indonesia
- Isolation and screening of lactic acid bacteria producing anti-Edwardsiella from the gastrointestinal tract of wild catfish (Clarias gariepinus) for probiotic candidates
- Effects of land use and slope position on selected soil physicochemical properties in Tekorsh Sub-Watershed, East Gojjam Zone, Ethiopia
- Design of smart farming communication and web interface using MQTT and Node.js
- Assessment of bread wheat (Triticum aestivum L.) seed quality accessed through different seed sources in northwest Ethiopia
- Estimation of water consumption and productivity for wheat using remote sensing and SEBAL model: A case study from central clay plain Ecosystem in Sudan
- Agronomic performance, seed chemical composition, and bioactive components of selected Indonesian soybean genotypes (Glycine max [L.] Merr.)
- The role of halal requirements, health-environmental factors, and domestic interest in food miles of apple fruit
- Subsidized fertilizer management in the rice production centers of South Sulawesi, Indonesia: Bridging the gap between policy and practice
- Factors affecting consumers’ loyalty and purchase decisions on honey products: An emerging market perspective
- Inclusive rice seed business: Performance and sustainability
- Design guidelines for sustainable utilization of agricultural appropriate technology: Enhancing human factors and user experience
- Effect of integrate water shortage and soil conditioners on water productivity, growth, and yield of Red Globe grapevines grown in sandy soil
- Synergic effect of Arbuscular mycorrhizal fungi and potassium fertilizer improves biomass-related characteristics of cocoa seedlings to enhance their drought resilience and field survival
- Control measure of sweet potato weevil (Cylas formicarius Fab.) (Coleoptera: Curculionidae) in endemic land of entisol type using mulch and entomopathogenic fungus Beauveria bassiana
- In vitro and in silico study for plant growth promotion potential of indigenous Ochrobactrum ciceri and Bacillus australimaris
- Effects of repeated replanting on yield, dry matter, starch, and protein content in different potato (Solanum tuberosum L.) genotypes
- Review Articles
- Nutritional and chemical composition of black velvet tamarind (Dialium guineense Willd) and its influence on animal production: A review
- Black pepper (Piper nigrum Lam) as a natural feed additive and source of beneficial nutrients and phytochemicals in chicken nutrition
- The long-crowing chickens in Indonesia: A review
- A transformative poultry feed system: The impact of insects as an alternative and transformative poultry-based diet in sub-Saharan Africa
- Short Communication
- Profiling of carbonyl compounds in fresh cabbage with chemometric analysis for the development of freshness assessment method
- Special Issue of The 4th International Conference on Food Science and Engineering (ICFSE) 2022 - Part I
- Non-destructive evaluation of soluble solid content in fruits with various skin thicknesses using visible–shortwave near-infrared spectroscopy
- Special Issue on FCEM - International Web Conference on Food Choice & Eating Motivation - Part I
- Traditional agri-food products and sustainability – A fruitful relationship for the development of rural areas in Portugal
- Consumers’ attitudes toward refrigerated ready-to-eat meat and dairy foods
- Breakfast habits and knowledge: Study involving participants from Brazil and Portugal
- Food determinants and motivation factors impact on consumer behavior in Lebanon
- Comparison of three wine routes’ realities in Central Portugal
- Special Issue on Agriculture, Climate Change, Information Technology, Food and Animal (ACIFAS 2020)
- Environmentally friendly bioameliorant to increase soil fertility and rice (Oryza sativa) production
- Enhancing the ability of rice to adapt and grow under saline stress using selected halotolerant rhizobacterial nitrogen fixer