A hybrid approach for the machinability analysis of Incoloy 825 using the entropy-MOORA method
-
Saurabh Kumar Sahu
 ,
Shiena Shekhar
,
Shiena Shekhar

Abstract
With its exceptional qualities, Incoloy 825 is highly valued in a range of industries, including nuclear power plants, petrochemical plants, and chemical industries. Nevertheless, the unique combination of these properties presents a formidable challenge when it comes to machining Incoloy 825. Its low heat conductivity, rapid strain hardening, strong chemical affinity, and the presence of hard and abrasive particles in its microstructure all contribute to the difficulty. The objective of this study is to examine important factors related to the machinability of Incoloy 825. To achieve this, a hybrid tool called entropy coupled with MOORA will be used to determine the optimal cutting conditions. In order to achieve this, three specific input parameters were chosen: the spindle speed, feed rate, and depth of cut. Meanwhile, the major outcomes taken into account were the cutting force, cutting temperature, material removal rate, roughness of the machined surface, and flank wear. The experiments were conducted using Taguchi’s L27 orthogonal array, following the principles of experimental design. The findings indicate that the proposed hybrid approach is capable of accurately determining the best combination of parameters for cutting the chosen work material and can be employed in structural applications. For turning Incoloy 825, the optimal parametric setting was determined to be a spindle speed of 1,285 rpm, a feed rate of 0.0625 mm·rev−1, and a depth of cut of 0.3 mm.
1 Introduction
Nickel alloy is frequently referred to as the metal of versatility and serves as a prominent illustration of human innovation in the field of materials science. Chemical facilities, aerospace industries, marine equipment, pollution control systems, and nuclear reactors extensively utilize nickel-based alloys [1]. In fact, Ni-based alloys are employed in 50% of aircraft propulsion system weight because of their thermal stability, fatigue strength, and corrosion resistance in hostile environments [2,3]. Incoloy 825 is a nickel-based super alloy that acquires a remarkable combination of properties to withstand chemical attacks, especially in environments containing sulfuric acid, phosphoric acid, and chloride, as well as oxidation and corrosion at elevated temperatures. It has a good precipitation-hardening ability [4]. However, these alloys are categorized as difficult-to-machine substances due to their low heat conductivity and strong chemical reactivity. As a result, these alloys have poor machinability [5]. To produce a component, the work material goes through various manufacturing operations like casting, forming, welding of similar and dissimilar metals, and machining [6]. The final and essential stage of the manufacturing procedure is the machining process. The turning process has been a major operation in manufacturing since the beginning of industrialization [7]. The turning operation is widely recognized as the most prevalent machining process that is utilized to produce intricate shapes and geometries with a high degree of dimensional precision and exceptional surface quality. Turning is a viable alternative to the traditional grinding technique. It is a versatile and cost-effective method for working with hardened steel [8]. The turning attributes are composed of two separate characteristics, namely quality parameters (namely, surface quality, machining temperature, and cutting force) and performance attributes, i.e. the rate of material removal [9], to ascertain the parameters of turning and conduct trials under appropriate conditions. Improper choice of machining attributes can lead to accelerated wear of the cutting tool, resulting in inadequate machining of the workpiece or degradation of its surface quality [10]. This results in economic and temporal losses in the production industry, which affect the reputation of the industry in the market [11]. With an appropriate choice of cutting tools and cutting conditions, machinability can be improved [12]. In the past, research has been mostly focused on conducting experimental studies to analyse the machinability of diverse work materials, including titanium alloys [13], steel, and nitinol alloys [14,15]. Further, most of the researchers have analysed the machinability of various materials by assessing a single output parameter of the machining process [16]. In addition, design methods such as factorial design, response surface methodology [17], and Taguchi methods [18–20] are commonly employed instead of the one-factor-at-a-time experimental approach due to their time-consuming nature and high cost [21]. Furthermore, various multi-response optimization decision-making procedures also exist, including the analytic hierarchy process (AHP), analytical network processing, and the technique for order of preference by similarity to the ideal solution (TOPSIS). Azizi et al. discussed the combination of three multi-criterion decision-making (MCDM) methods, i.e. AHP, entropy, and TOPSIS to optimize the grinding parameters of Inconel 738 [22]. The techniques employed to manage multiple responses in the presence of competing criteria, i.e. MOORA and multi-objective optimization on the basis of simple ratio analysis (MOOSRA), were used to examine non-traditional machine selection criteria. MOORA and MOOSRA are used to evaluate expert group data subjectively. Since all of the traits may be taken into account together with their relative importance, the MOORA technique offered a more accurate assessment of the provided options. Also, for material selection for the storage tank and flywheel, VIekriterijumsko KOmpromisno Rangiranje (VIKOR) gives better result compared with ELimination et Choix Traduisant la REalite (ELECTRE) and other methods mentioned in the literature [23,24]. Jhodkar et al. [25] conducted a turning process of machining on a titanium alloy using an L27 array. Then, a hybrid MOORA with the FUZZY approach is used to modify the regulating parameters. Additionally, it has been demonstrated that MOORA might be utilized to maximize several contradictory outcomes that are associated with some specific limitations. MOORA consists of two key components: reference points and ratio points. These components play a crucial role in assessing the performance of given alternatives. The COPRAS method was utilized to transform several outputs into a single index known as the multi-performance characteristics index [26].
In order to mitigate the possibility of adopting unsuitable alternatives in unconventional manufacturing processes, Chakraborty presented a novel methodology called the MOORA method. The MOORA approach described in this study proved to be more productive, time-saving, and accessible compared to the existing multiobjective decision-making strategies [27]. In a different study, Shakeel Ahmed adopted TOPSIS method for enhancing drilling performance. The TOPSIS combination method proved more efficient in resolving multiresponse issues in the drilling process [28,29]. Assignment of an appropriate weightage to the selected criteria was marked as the major challenge in the above-discussed research. Therefore, in the later investigations, to ensure a comprehensive and adaptable analysis, the alternatives were assigned weights using one of the mathematically proven tools, such as the weighted entropy method. These tools helped the researchers to evaluate the weightage of the individual criterion more accurately. These weights were then utilized as input in various MCDM techniques: TOPSIS, VIKOR, and Multi MOORA. TOPSIS is a reliable method for rating alternatives, multi-MOORA is highly proficient in optimizing numerous objectives, and VIKOR provides a solution that involves making compromises [30]. The selection of the most suitable grinding conditions involved the utilization of an amalgam of three techniques: AHP, entropy, and TOPSIS [31,32]. In the machining business, it is common for the objectives of tool consumption and surface roughness (R a) to be minimized while the material removal rate (MRR) should be maximized. To determine the objective and constant weights of the mentioned criteria, the AHP approach was employed. The TOPSIS and WASPAS algorithms were utilized to select the optimal alternative based on predetermined criteria weights [33]. Among the methods that are described in the above literature, the MOORA approach is characterized by its user-friendly nature, simplicity, and ease of use. This method offers a comparable or nearly equivalent alternative answer with a high level of accuracy, as observed by multiple researchers who have employed various tough MODM strategies [34].
The primary goal of this research is to propose reduced machining time along with the higher surface quality and rate of material removal, low temperature and force during machining of the selected Incoloy 825 work part. To attain this objective, the present study focuses on turning Incoloy 825 and analysing five significant quality attributes: surface R a, machining force (F c), temperature (T m), MRR, and flank width (VBc) by using Taguchi’s L27 orthogonal array. An integrated MCDM tool, i.e. entropy-MOORA, is exploited with the aim of acquiring the desired goal of the investigation. The results demonstrated that the proposed methodology is able to effectively choose the most suitable combination of machining parameters for turning operations.
2 Materials and methodology
2.1 Design of experiment
The identification of the optimum combination of parameters has been recognized as a complicated challenge in production processes due to some effects of interactions among different cutting variables. The optimization strategy is crucial in ensuring both the quality of the final item and the efficiency of production in this situation. The orthogonal array design (OAD) proposed by Taguchi has been actively adopted and advocated by several researchers worldwide. It aids in enhancing the quality attributes by providing optimal combinations of input parameters. The Taguchi orthogonal array is a valuable tool for obtaining solutions to full factorial designs while limiting the trial experiments required [35]. To achieve the optimal set of input parameters, Taguchi’s OAD helps to find the impact of these parameters on the specified performance indicators. Furthermore, these arrays offer an optimal solution by minimizing the number of experimental trials while maintaining the quality.
For this experiment, three elements that can be controlled, viz., the spindle speed, feed rate, and depth of cut, were chosen. These factors were examined at three different levels, and an orthogonal array was created according to the specifications provided in Table 1. As per Taguchi L27 OAD, the layout of cutting parameters at different levels with their numeric values is depicted in Table 2.
Cutting parameters (factors) and their levels
| S. no. | Parameters | Unit | Symbol | Level | ||
|---|---|---|---|---|---|---|
| Low | Medium | High | ||||
| 1 | Spindle speed | rpm | SS | 645 | 1,000 | 1,285 |
| 2 | Feed rate | mm·rev−1 | FR | 0.0625 | 0.125 | 0.25 |
| 3 | Depth of cut | mm | DOC | 0.1 | 0.2 | 0.3 |
Taguchi’s L27 OAD
| Run | Cutting variables | ||
|---|---|---|---|
| Spindle speed (rpm) | Feed rate (mm·rev−1) | Depth of cut (mm) | |
| 1 | 645 | 0.0625 | 0.1 |
| 2 | 645 | 0.0625 | 0.2 |
| 3 | 645 | 0.0625 | 0.3 |
| 4 | 645 | 0.125 | 0.1 |
| 5 | 645 | 0.125 | 0.2 |
| 6 | 645 | 0.125 | 0.3 |
| 7 | 645 | 0.25 | 0.1 |
| 8 | 645 | 0.25 | 0.2 |
| 9 | 645 | 0.25 | 0.3 |
| 10 | 1,000 | 0.0625 | 0.1 |
| 11 | 1,000 | 0.0625 | 0.2 |
| 12 | 1,000 | 0.0625 | 0.3 |
| 13 | 1,000 | 0.125 | 0.1 |
| 14 | 1,000 | 0.125 | 0.2 |
| 15 | 1,000 | 0.125 | 0.3 |
| 16 | 1,000 | 0.25 | 0.1 |
| 17 | 1,000 | 0.25 | 0.2 |
| 18 | 1,000 | 0.25 | 0.3 |
| 19 | 1,285 | 0.0625 | 0.1 |
| 20 | 1,285 | 0.0625 | 0.2 |
| 21 | 1,285 | 0.0625 | 0.3 |
| 22 | 1,285 | 0.125 | 0.1 |
| 23 | 1,285 | 0.125 | 0.2 |
| 24 | 1,285 | 0.125 | 0.3 |
| 25 | 1,285 | 0.25 | 0.1 |
| 26 | 1,285 | 0.25 | 0.2 |
| 27 | 1,285 | 0.25 | 0.3 |
2.2 Workpiece and cutting tool material
The present study employed Taguchi’s L27 OAD for the execution of the experimentation. A round bar of Incoloy 825 with a diameter of 40 mm and a length of 250 mm was selected as an experimental work material. The chemical composition of this material is 38.51% Ni, 20.14% Cr, 2.98% Mo, 1.54% Cu, and 0.65% Ti. Incoloy 825 workpiece was machined (turned) on conventional lathe (Manufacturer: National Small Industries Limited) using a diamond-shaped tool made of tungsten carbide having ISO designation CNGM120408MG (Manufacturer industry: Kennametal, Grade: KC5010). For each trial run, a fresh insert cutting edge was employed. The cutting inserts were securely held in place using an ISO-designated tool holder, PCLNL2020K12.
2.3 Methodology
This research aims to investigate the suitability of a hybrid technique during the machining of hard-to-machined materials, viz. nickel-based superalloys. The methodology employed in the present investigation is outlined below.
2.3.1 MOORA method
A multi-objective or multi-attribute optimization is a method in which two or more competing features (objectives) are optimized simultaneously within a set of restrictions. A multi-objective problem is a common occurrence in various organizations, industries, corporate offices, manufacturing units, and other settings when there is a requirement to make optimal choices while considering two or more than two conflicting attributes. MODM approaches are appropriate tools for selecting one or more alternatives from a given set of options. The MOORA approach, initially proposed by Brauers (2004), is a versatile multi-objective optimization strategy that may effectively address a wide range of complicated decision-making situations. The study utilized the MOORA approach [36,37], which involves the following steps:
Create a decision matrix that represents performance characteristics in relation to certain attributes or objectives using equation (1):
(1)where
The data in the decision matrix are normalized to create a ratio system. The normalized value can be computed using equation (2):
(2)where
Calculate the criteria weight: for calculating the weight of the criteria, several methods are available such as AHP, simple additive weighting, swing weighting, entropy method, and fuzzy logic. However, the entropy method provides impartiality by utilizing the variability of data instead of subjective judgement, thereby maintaining impartial criteria weights. In this study, the entropy method was used for calculating the criteria weight, and a complete description is provided in Section 2.3.2. Further, the weighted normalization matrix can be determined using equation (3):
(3)The normalized performance measurements are aggregated by adding them for beneficial criteria (larger-is-better) and subtracting them for non-beneficial criteria (smaller-is-better). Equation (4) represents the overall assessment value of the performance measures:
(4)where
Occasionally, certain criteria are considered more significant than others. Hence, to assign greater significance to specific criteria, it can be multiplied by its corresponding weight as shown in equation (5):
(5)where the weight of the jth criteria is denoted as
After assessment, rank the overall values of
2.3.2 Entropy method
The concept of entropy in information theory can be considered as a measure of the level of uncertainty transmitted by a discrete probability distribution. This tool can be efficiently applied in the decision-making process as it quantifies the existing discrepancies between the sets of data and elucidates the average fundamental information supplied to the decision-maker.
The procedure for determining objective/criteria weights using the entropy approach is as follows.
Step 1: An array of performance indices (decision matrix) is normalized to obtain the experimental outcomes, i.e.
Here,
Step 2: Calculate the entropy of experimental results using equation (7). Entropy measures the uncertainty associated with each criterion. Entropy represents the quantity of information offered by each criterion. Unlike subjective approaches, which give weights based on expert judgments, entropy delivers an objective mechanism for determining weights based on actual data:
where
Step 3: Obtain the objective weight by utilizing the theory of entropy as shown in equation (8):
where (1−E j ) represents the degree of diversification.
Sample calculation for determining the criteria weight for criteria C 1:
Here, for criteria C 1, the calculation of entropy is as follows:
Step 1: From Table 5, the value of
Therefore, H 11 = 0.038/(0.038 + 0.134 + 0.22 + … + 0.217) = 0.008.
Similarly, for criteria C 1, H 21, H 31, H 41, and H 271 were calculated.
Step 2: Using equation (7) for calculating E 1, we calculated the value of k.
This value of k is constant for all the criteria.
To calculate the entropy of criteria C 1, the value of (H ij ln H ij ) was calculated for each trial, i.e. (H 11 ln H 11) = (0.008 ln 0.008) = −0.040. Similarly, (H 21 ln H 21), (H 31 ln H 31), … were calculated, and the values are displayed in Table 6 (criteria C 1 column).
Now, the above-calculated values are substituted into equation (7) to obtain the value of entropy E 1,
Similarly, entropies
Step 3: Using equation (8), the weight for criteria C 1 was calculated as
Similarly,
3 Experimentation and data collection
In the current experiment, a standard Lathe was employed to cut the specified work material, following the configuration displayed in Table 1. Taguchi L27 orthogonal array was applied to examine 27 numerous combinations of the spindle speed, feed rate, and depth of cut in the machining process. Figure 1 depicts the experimental configuration. The most critical machinability attributes that were studied in this experiment are the cutting force (F c), surface R a, cutting temperature (T m), MRR, and VBc. A three-dimensional lathe tool dynamometer was used to measure the cutting force, and its value was recorded after each run. The temperature of the machining zone was monitored using a non-contact type pyrometer. The average R a of the machined surface was measured using a surface R a tester (Surfcom touch). The value of R a was recorded at four distinct positions of the machined part (90° apart), and the average was taken to be the final R a of the relevant experiment. Flank wear and chip profile were evaluated using a digital metallurgical microscope (Make: Olympus, Model: DSX1000). The MRR was calculated using equation (9):
where
where D i is the initial diameter of the workpiece, D f is the final diameter of the workpiece, d is the depth of the cut (mm), f is the feed rate (mm·rev−1), and N is the spindle speed (rpm). The results of the experiment are presented in Table 3.
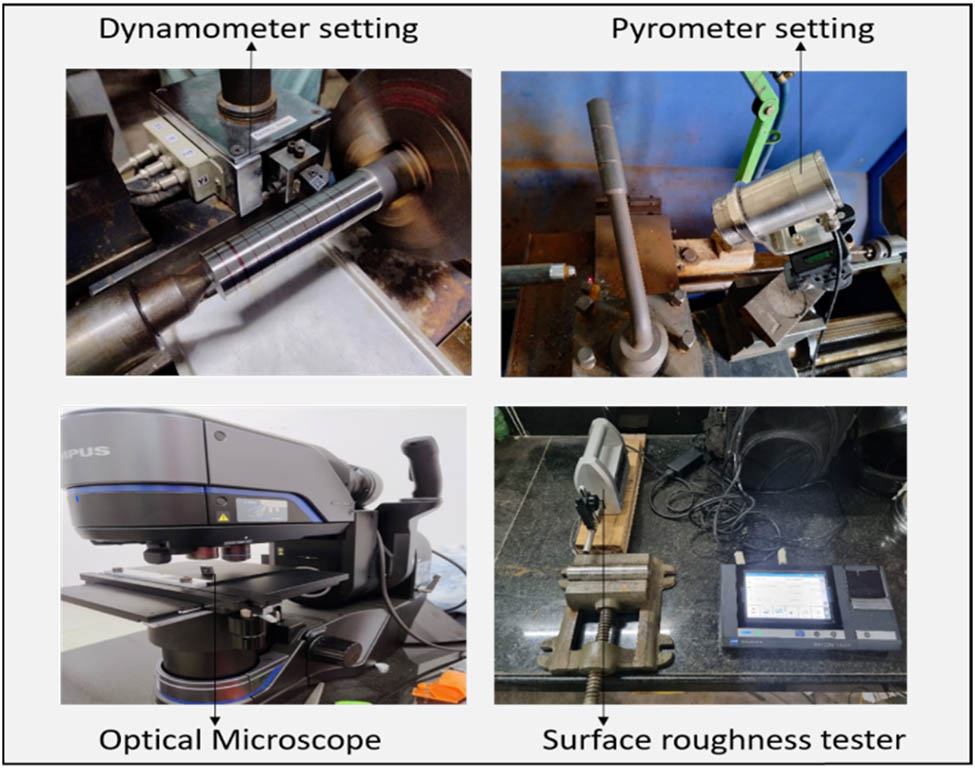
Experimental setup.
Experimental results
| Run/alternatives | Cutting parameters | Experimental responses: Criteria (C 1–C 5) | ||||||
|---|---|---|---|---|---|---|---|---|
| SS (rpm) | FR (mm·rev−1) | DOC (mm) | F c (N) | T m (°C) | R a (µm) | MRR (mm3·min−1) | VBc (µm) | |
| 1 | 645 | 0.0625 | 0.1 | 34.330 | 584.200 | 0.038 | 473.414 | 187.832 |
| 2 | 645 | 0.0625 | 0.2 | 122.620 | 668.600 | 0.092 | 978.473 | 216.841 |
| 3 | 645 | 0.0625 | 0.3 | 201.100 | 693.800 | 0.169 | 1463.912 | 232.315 |
| 4 | 645 | 0.125 | 0.1 | 98.100 | 539.500 | 0.079 | 981.005 | 97.501 |
| 5 | 645 | 0.125 | 0.2 | 191.290 | 598.530 | 0.229 | 1888.592 | 178.797 |
| 6 | 645 | 0.125 | 0.3 | 284.490 | 619.500 | 0.730 | 2927.824 | 164.708 |
| 7 | 645 | 0.25 | 0.1 | 127.530 | 564.300 | 0.092 | 1962.009 | 105.420 |
| 8 | 645 | 0.25 | 0.2 | 189.330 | 632.000 | 0.524 | 3913.892 | 153.227 |
| 9 | 645 | 0.25 | 0.3 | 224.650 | 665.900 | 1.003 | 5650.587 | 185.637 |
| 10 | 1,000 | 0.0625 | 0.1 | 49.050 | 582.700 | 0.085 | 760.469 | 63.089 |
| 11 | 1,000 | 0.0625 | 0.2 | 177.560 | 717.500 | 0.122 | 1464.025 | 116.472 |
| 12 | 1,000 | 0.0625 | 0.3 | 312.940 | 826.800 | 0.317 | 2269.631 | 76.215 |
| 13 | 1,000 | 0.125 | 0.1 | 24.520 | 539.200 | 0.238 | 1520.938 | 75.222 |
| 14 | 1,000 | 0.125 | 0.2 | 106.930 | 647.100 | 0.233 | 3034.025 | 174.718 |
| 15 | 1,000 | 0.125 | 0.3 | 271.740 | 746.400 | 0.545 | 4380.300 | 100.700 |
| 16 | 1,000 | 0.25 | 0.1 | 29.430 | 565.100 | 0.088 | 2935.900 | 100.553 |
| 17 | 1,000 | 0.25 | 0.2 | 137.340 | 682.600 | 0.348 | 6068.050 | 154.590 |
| 18 | 1,000 | 0.25 | 0.3 | 237.400 | 800.000 | 1.080 | 9078.525 | 146.803 |
| 19 | 1,285 | 0.0625 | 0.1 | 48.070 | 503.800 | 0.091 | 977.202 | 96.729 |
| 20 | 1,285 | 0.0625 | 0.2 | 161.860 | 580.900 | 0.509 | 1949.361 | 104.981 |
| 21 | 1,285 | 0.0625 | 0.3 | 273.700 | 763.900 | 1.515 | 2814.343 | 162.576 |
| 22 | 1,285 | 0.125 | 0.1 | 33.354 | 609.600 | 0.141 | 1886.316 | 91.947 |
| 23 | 1,285 | 0.125 | 0.2 | 133.420 | 657.300 | 0.083 | 3898.722 | 121.854 |
| 24 | 1,285 | 0.125 | 0.3 | 262.910 | 837.700 | 0.332 | 5832.952 | 149.803 |
| 25 | 1,285 | 0.25 | 0.1 | 48.070 | 603.800 | 0.084 | 3908.809 | 60.942 |
| 26 | 1,285 | 0.25 | 0.2 | 142.240 | 669.000 | 0.157 | 7525.089 | 76.663 |
| 27 | 1,285 | 0.25 | 0.3 | 198.160 | 857.800 | 0.866 | 11665.905 | 148.045 |
4 Results and discussion
4.1 Multi-objective optimization using the entropy-MOORA method
In the current investigation, the hybrid entropy-MOORA method is used. MOORA works by normalizing the decision matrix, calculating criterion ratios for each alternative, and aggregating these ratios to determine the optimum alternative. In the first step, the decision matrix was formed using equation (1) and is shown in Table 4.
Decision matrix
| Run | Criteria | ||||
|---|---|---|---|---|---|
| C 1 | C 2 | C 3 | C 4 | C 5 | |
| 1 | 34.330 | 584.200 | 0.038 | 473.414 | 187.832 |
| 2 | 122.620 | 668.600 | 0.092 | 978.473 | 216.841 |
| 3 | 201.100 | 693.800 | 0.169 | 1463.912 | 232.315 |
| 4 | 98.100 | 539.500 | 0.079 | 981.005 | 97.501 |
| 5 | 191.290 | 598.530 | 0.229 | 1888.592 | 178.797 |
| 6 | 284.490 | 619.500 | 0.730 | 2927.824 | 164.708 |
| 7 | 127.530 | 564.300 | 0.092 | 1962.009 | 105.420 |
| 8 | 189.330 | 632.000 | 0.524 | 3913.892 | 153.227 |
| 9 | 224.650 | 665.900 | 1.003 | 5650.587 | 185.637 |
| 10 | 49.050 | 582.700 | 0.085 | 760.469 | 63.089 |
| 11 | 177.560 | 717.500 | 0.122 | 1464.025 | 116.472 |
| 12 | 312.940 | 826.800 | 0.317 | 2269.631 | 76.215 |
| 13 | 24.520 | 539.200 | 0.238 | 1520.938 | 75.222 |
| 14 | 106.930 | 647.100 | 0.233 | 3034.025 | 174.718 |
| 15 | 271.740 | 746.400 | 0.545 | 4380.300 | 100.700 |
| 16 | 29.430 | 565.100 | 0.088 | 2935.900 | 100.553 |
| 17 | 137.340 | 682.600 | 0.348 | 6068.050 | 154.590 |
| 18 | 237.400 | 800.000 | 1.080 | 9078.525 | 146.803 |
| 19 | 48.070 | 503.800 | 0.091 | 977.202 | 96.729 |
| 20 | 161.860 | 580.900 | 0.509 | 1949.361 | 104.981 |
| 21 | 273.700 | 763.900 | 1.515 | 2814.343 | 162.576 |
| 22 | 33.354 | 609.600 | 0.141 | 1886.316 | 91.947 |
| 23 | 133.420 | 657.300 | 0.083 | 3898.722 | 121.854 |
| 24 | 262.910 | 837.700 | 0.332 | 5832.952 | 149.803 |
| 25 | 48.070 | 603.800 | 0.084 | 3908.809 | 60.942 |
| 26 | 142.240 | 669.000 | 0.157 | 7525.089 | 76.663 |
| 27 | 198.160 | 857.800 | 0.866 | 11665.905 | 148.045 |
In the next step, the decision matrix was normalized using equation (2) and is shown in Table 5. The objective of normalization is to standardize each element of the matrix in order to ensure that all elements have a comparable value [38].
Normalized decision matrix
| Run | Criteria | ||||
|---|---|---|---|---|---|
| C 1 | C 2 | C 3 | C 4 | C 5 | |
| 1 | 0.038 | 0.169 | 0.014 | 0.021 | 0.260 |
| 2 | 0.134 | 0.194 | 0.034 | 0.043 | 0.300 |
| 3 | 0.220 | 0.201 | 0.063 | 0.065 | 0.321 |
| 4 | 0.107 | 0.156 | 0.029 | 0.044 | 0.135 |
| 5 | 0.210 | 0.173 | 0.085 | 0.084 | 0.247 |
| 6 | 0.312 | 0.179 | 0.272 | 0.130 | 0.228 |
| 7 | 0.140 | 0.163 | 0.034 | 0.087 | 0.146 |
| 8 | 0.207 | 0.183 | 0.195 | 0.174 | 0.212 |
| 9 | 0.246 | 0.193 | 0.373 | 0.251 | 0.257 |
| 10 | 0.054 | 0.169 | 0.032 | 0.034 | 0.087 |
| 11 | 0.194 | 0.208 | 0.045 | 0.065 | 0.161 |
| 12 | 0.343 | 0.239 | 0.118 | 0.101 | 0.105 |
| 13 | 0.027 | 0.156 | 0.089 | 0.068 | 0.104 |
| 14 | 0.117 | 0.187 | 0.087 | 0.135 | 0.242 |
| 15 | 0.298 | 0.216 | 0.203 | 0.194 | 0.139 |
| 16 | 0.032 | 0.164 | 0.033 | 0.130 | 0.139 |
| 17 | 0.150 | 0.198 | 0.129 | 0.269 | 0.214 |
| 18 | 0.260 | 0.232 | 0.402 | 0.403 | 0.203 |
| 19 | 0.053 | 0.146 | 0.034 | 0.043 | 0.134 |
| 20 | 0.177 | 0.168 | 0.189 | 0.087 | 0.145 |
| 21 | 0.300 | 0.221 | 0.564 | 0.125 | 0.225 |
| 22 | 0.037 | 0.177 | 0.052 | 0.084 | 0.127 |
| 23 | 0.146 | 0.190 | 0.031 | 0.173 | 0.168 |
| 24 | 0.288 | 0.243 | 0.124 | 0.259 | 0.207 |
| 25 | 0.053 | 0.175 | 0.031 | 0.174 | 0.084 |
| 26 | 0.156 | 0.194 | 0.058 | 0.334 | 0.106 |
| 27 | 0.217 | 0.248 | 0.322 | 0.518 | 0.205 |
These normalized values were used to calculate the criterion weight by using the entropy method. Equation (6) and (7) were used to calculate the value of entropy of each criterion. Then, by using the entropy values of each criterion, the weight of the respective criterion was computed by using equation (8). The entropy and criterion weights are listed in Table 6.
Evaluation of entropy and criterion weights
| Run | Criteria | ||||
|---|---|---|---|---|---|
| C 1 | C 2 | C 3 | C 4 | C 5 | |
| 1 | −0.040 | −0.112 | −0.022 | −0.027 | −0.156 |
| 2 | −0.105 | −0.123 | −0.044 | −0.048 | −0.171 |
| 3 | −0.147 | −0.127 | −0.070 | −0.066 | −0.179 |
| 4 | −0.089 | −0.106 | −0.039 | −0.048 | −0.099 |
| 5 | −0.142 | −0.114 | −0.088 | −0.080 | −0.151 |
| 6 | −0.185 | −0.117 | −0.194 | −0.110 | −0.143 |
| 7 | −0.108 | −0.110 | −0.044 | −0.082 | −0.105 |
| 8 | −0.141 | −0.119 | −0.157 | −0.134 | −0.136 |
| 9 | −0.159 | −0.123 | −0.233 | −0.171 | −0.154 |
| 10 | −0.053 | −0.112 | −0.041 | −0.040 | −0.072 |
| 11 | −0.135 | −0.130 | −0.055 | −0.066 | −0.112 |
| 12 | −0.196 | −0.143 | −0.111 | −0.091 | −0.083 |
| 13 | −0.030 | −0.106 | −0.090 | −0.068 | −0.082 |
| 14 | −0.095 | −0.121 | −0.089 | −0.112 | −0.148 |
| 15 | −0.179 | −0.133 | −0.161 | −0.145 | −0.101 |
| 16 | −0.035 | −0.110 | −0.042 | −0.110 | −0.101 |
| 17 | −0.113 | −0.125 | −0.119 | −0.179 | −0.137 |
| 18 | −0.164 | −0.140 | −0.243 | −0.228 | −0.132 |
| 19 | −0.052 | −0.101 | −0.043 | −0.048 | −0.098 |
| 20 | −0.127 | −0.112 | −0.154 | −0.082 | −0.104 |
| 21 | −0.180 | −0.135 | −0.289 | −0.106 | −0.141 |
| 22 | −0.039 | −0.116 | −0.061 | −0.080 | −0.095 |
| 23 | −0.111 | −0.122 | −0.040 | −0.134 | −0.116 |
| 24 | −0.176 | −0.144 | −0.115 | −0.175 | −0.134 |
| 25 | −0.052 | −0.115 | −0.041 | −0.134 | −0.070 |
| 26 | −0.116 | −0.124 | −0.066 | −0.204 | −0.083 |
| 27 | −0.146 | −0.146 | −0.215 | −0.262 | −0.133 |
| Entropy | 0.945 | 0.997 | 0.869 | 0.919 | 0.981 |
| Criteria weight | 0.190 | 0.011 | 0.453 | 0.281 | 0.066 |
Entropy and Criteria weight are calculated by using the above mentioned data in the table and these are further used in calculations, therefore, they are indicated as bold.
Furthermore, these criterion weights were utilized to form a weighted normalized matrix, as listed in Table 7. The inclusion of criterion weights in MCDM is crucial to ensure that the decision-making process effectively captures the preferences of the decision-makers, resulting in well-informed and fair decisions.
Weighted normalized matrix
| Run | Criteria | ||||
|---|---|---|---|---|---|
| C 1 | C 2 | C 3 | C 4 | C 5 | |
| 1 | 0.0071 | 0.0018 | 0.0064 | 0.0059 | 0.0171 |
| 2 | 0.0255 | 0.0021 | 0.0155 | 0.0122 | 0.0197 |
| 3 | 0.0418 | 0.0022 | 0.0285 | 0.0183 | 0.0211 |
| 4 | 0.0204 | 0.0017 | 0.0133 | 0.0122 | 0.0089 |
| 5 | 0.0397 | 0.0019 | 0.0386 | 0.0236 | 0.0162 |
| 6 | 0.0591 | 0.0019 | 0.1230 | 0.0365 | 0.0150 |
| 7 | 0.0265 | 0.0018 | 0.0154 | 0.0245 | 0.0096 |
| 8 | 0.0393 | 0.0020 | 0.0883 | 0.0488 | 0.0139 |
| 9 | 0.0467 | 0.0021 | 0.1690 | 0.0705 | 0.0169 |
| 10 | 0.0102 | 0.0018 | 0.0143 | 0.0095 | 0.0057 |
| 11 | 0.0369 | 0.0022 | 0.0206 | 0.0183 | 0.0106 |
| 12 | 0.0650 | 0.0026 | 0.0534 | 0.0283 | 0.0069 |
| 13 | 0.0051 | 0.0017 | 0.0402 | 0.0190 | 0.0068 |
| 14 | 0.0222 | 0.0020 | 0.0393 | 0.0379 | 0.0159 |
| 15 | 0.0564 | 0.0023 | 0.0918 | 0.0547 | 0.0091 |
| 16 | 0.0061 | 0.0018 | 0.0148 | 0.0366 | 0.0091 |
| 17 | 0.0285 | 0.0021 | 0.0586 | 0.0757 | 0.0140 |
| 18 | 0.0493 | 0.0025 | 0.1819 | 0.1133 | 0.0133 |
| 19 | 0.0100 | 0.0016 | 0.0153 | 0.0122 | 0.0088 |
| 20 | 0.0336 | 0.0018 | 0.0858 | 0.0243 | 0.0095 |
| 21 | 0.0568 | 0.0024 | 0.2552 | 0.0351 | 0.0148 |
| 22 | 0.0069 | 0.0019 | 0.0238 | 0.0235 | 0.0084 |
| 23 | 0.0277 | 0.0020 | 0.0140 | 0.0487 | 0.0111 |
| 24 | 0.0546 | 0.0026 | 0.0559 | 0.0728 | 0.0136 |
| 25 | 0.0100 | 0.0019 | 0.0142 | 0.0488 | 0.0055 |
| 26 | 0.0295 | 0.0021 | 0.0264 | 0.0939 | 0.0070 |
| 27 | 0.0412 | 0.0027 | 0.1459 | 0.1456 | 0.0134 |
To calculate the assessment values (Y i ), the weighted normalized values of the non-beneficial criteria, i.e. F c, T m, R a, and VBc, are subtracted from beneficial criteria, i.e. MRR, by using equation (7), and are listed in Table 8. On the basis of assessment values, the rank was given to each alternative. The option with the highest Y i value is identified as being near the optimal solution.
Overall assessment values and ranks of the alternative experiments
| Run | Criteria | Y i | Rank | ||||
|---|---|---|---|---|---|---|---|
| C 1 | C 2 | C 3 | C 4 | C 5 | |||
| 1 | 0.0071 | 0.0018 | 0.0064 | 0.0059 | 0.0171 | 0.0265 | 20 |
| 2 | 0.0255 | 0.0021 | 0.0155 | 0.0122 | 0.0197 | 0.0505 | 14 |
| 3 | 0.0418 | 0.0022 | 0.0285 | 0.0183 | 0.0211 | 0.0752 | 9 |
| 4 | 0.0204 | 0.0017 | 0.0133 | 0.0122 | 0.0089 | 0.0320 | 17 |
| 5 | 0.0397 | 0.0019 | 0.0386 | 0.0236 | 0.0162 | 0.0729 | 10 |
| 6 | 0.0591 | 0.0019 | 0.1230 | 0.0365 | 0.0150 | 0.1624 | 3 |
| 7 | 0.0265 | 0.0018 | 0.0154 | 0.0245 | 0.0096 | 0.0288 | 18 |
| 8 | 0.0393 | 0.0020 | 0.0883 | 0.0488 | 0.0139 | 0.0946 | 8 |
| 9 | 0.0467 | 0.0021 | 0.1690 | 0.0705 | 0.0169 | 0.1640 | 2 |
| 10 | 0.0102 | 0.0018 | 0.0143 | 0.0095 | 0.0057 | 0.0226 | 22 |
| 11 | 0.0369 | 0.0022 | 0.0206 | 0.0183 | 0.0106 | 0.0520 | 13 |
| 12 | 0.0650 | 0.0026 | 0.0534 | 0.0283 | 0.0069 | 0.0996 | 7 |
| 13 | 0.0051 | 0.0017 | 0.0402 | 0.0190 | 0.0068 | 0.0348 | 16 |
| 14 | 0.0222 | 0.0020 | 0.0393 | 0.0379 | 0.0159 | 0.0415 | 15 |
| 15 | 0.0564 | 0.0023 | 0.0918 | 0.0547 | 0.0091 | 0.1051 | 6 |
| 16 | 0.0061 | 0.0018 | 0.0148 | 0.0366 | 0.0091 | -0.0048 | 25 |
| 17 | 0.0285 | 0.0021 | 0.0586 | 0.0757 | 0.0140 | 0.0276 | 19 |
| 18 | 0.0493 | 0.0025 | 0.1819 | 0.1133 | 0.0133 | 0.1338 | 4 |
| 19 | 0.0100 | 0.0016 | 0.0153 | 0.0122 | 0.0088 | 0.0234 | 21 |
| 20 | 0.0336 | 0.0018 | 0.0858 | 0.0243 | 0.0095 | 0.1064 | 5 |
| 21 | 0.0568 | 0.0024 | 0.2552 | 0.0351 | 0.0148 | 0.2941 | 1 |
| 22 | 0.0069 | 0.0019 | 0.0238 | 0.0235 | 0.0084 | 0.0174 | 23 |
| 23 | 0.0277 | 0.0020 | 0.0140 | 0.0487 | 0.0111 | 0.0061 | 24 |
| 24 | 0.0546 | 0.0026 | 0.0559 | 0.0728 | 0.0136 | 0.0539 | 12 |
| 25 | 0.0100 | 0.0019 | 0.0142 | 0.0488 | 0.0055 | −0.0172 | 26 |
| 26 | 0.0295 | 0.0021 | 0.0264 | 0.0939 | 0.0070 | −0.0289 | 27 |
| 27 | 0.0412 | 0.0027 | 0.1459 | 0.1456 | 0.0134 | 0.0576 | 11 |
Bold value indicates to show the best result in optimization as per ranking.
According to Table 8, experimental run number 21 has the highest assessment (Y i ) value, indicating the ideal setting of the process parameter. It denotes the ultimate combined score for every alternative. The assessment value offers a clear and concise overview of how effectively each alternative fulfils the numerous objectives taken into account during the decision-making process.
Therefore, it is concluded that the maximum assessment value can be obtained when the spindle speed is at a high level (1,285 rpm), the feed rate is at low level (0.0625 mm·rev−1), and the depth of cut is at a high level (0.3 mm).
4.2 Macro-morphological study of chip formation
The chip samples were collected during the experiment with the aim to examine their morphology and, hence, their impact on the machinability of the selected work material. The macroscopic images of the chips were captured using a smartphone and a digital metallurgical microscope (Olympus, Model: DSX1000), respectively. A few of the selected images were chosen to understand the pattern of the chip formed during machining and are shown in Figures 2–4. These combinations are essentially determined by maintaining two parameters at a fixed value while altering the third cutting parameter [39].
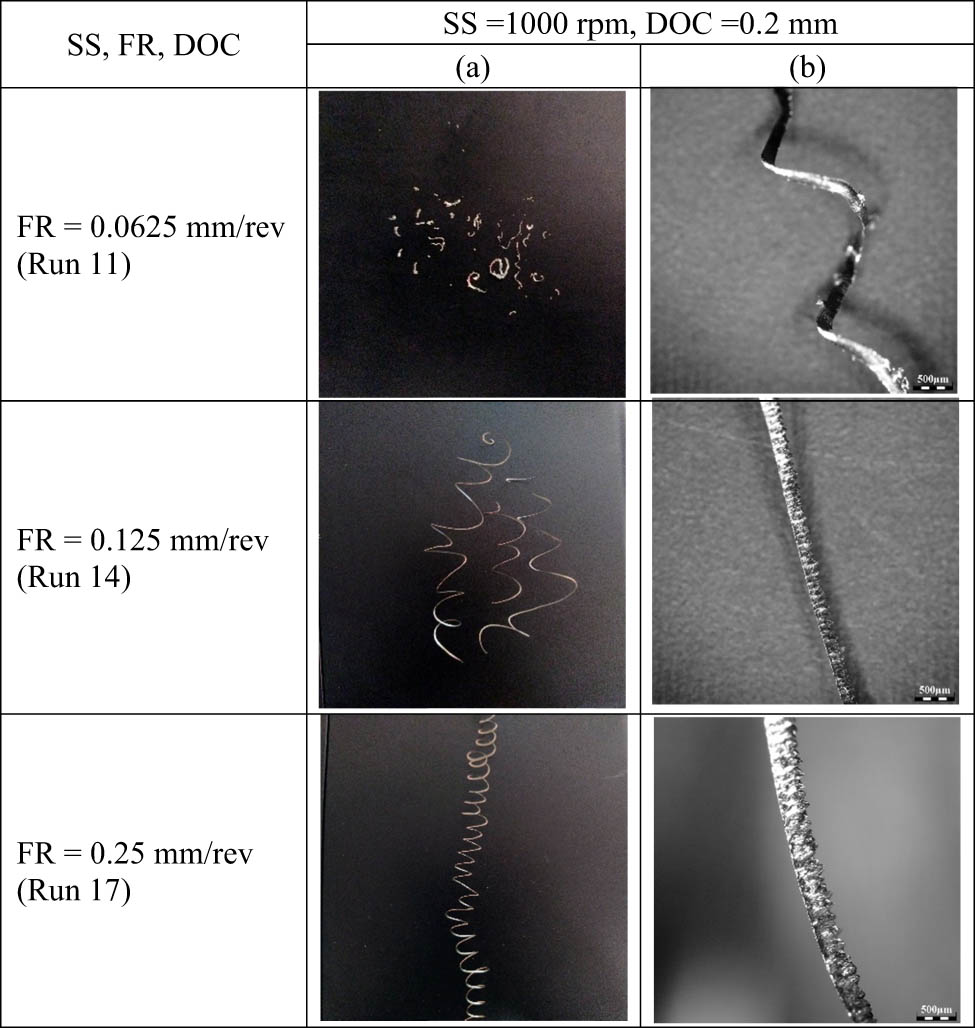
Macroscopic images of chips under a constant speed and depth of cut. (a) Image of chip under 1 × zoom at constant speed and depth of cut and (b) Macroscopic image of chip at constant speed and depth of cut.
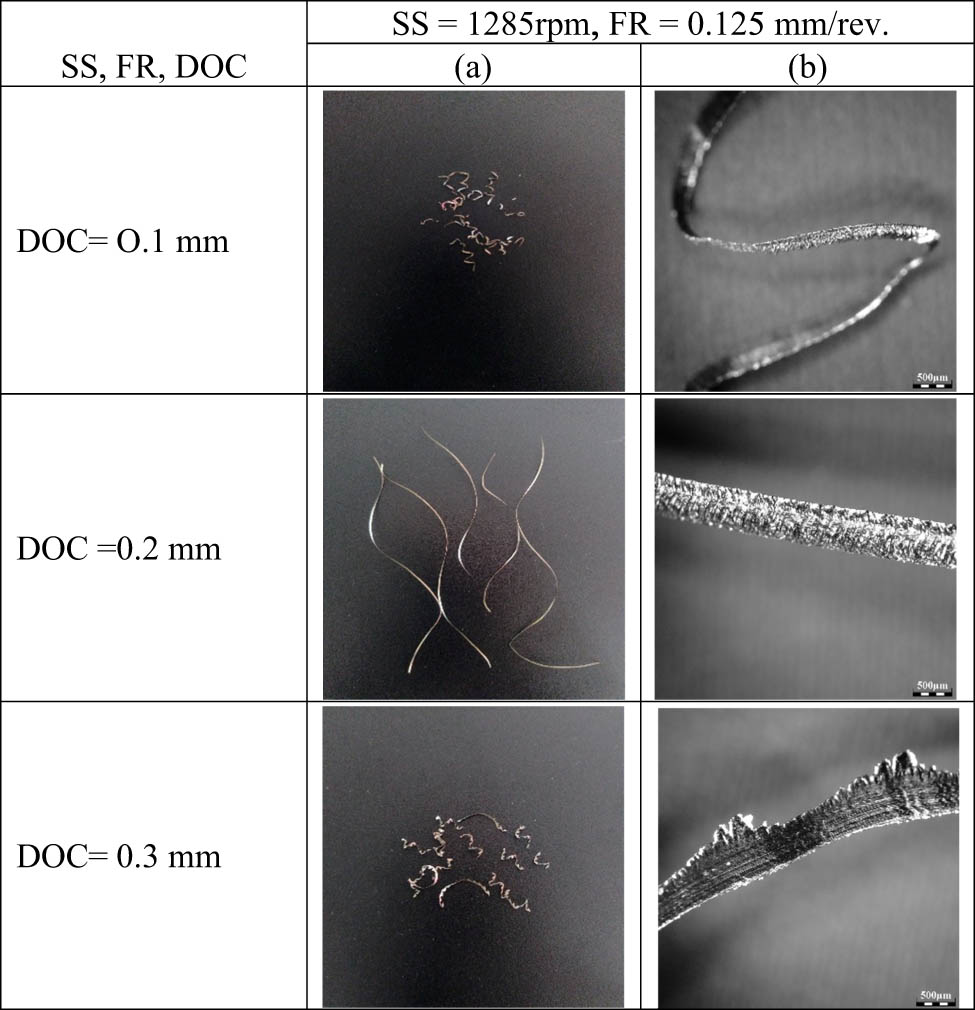
Macroscopic images of chips under a constant speed and feed rate. (a) Image of chip under 1 × zoom at constant speed and feed rate and (b) Macroscopic image of chip at constant speed and feed rate.
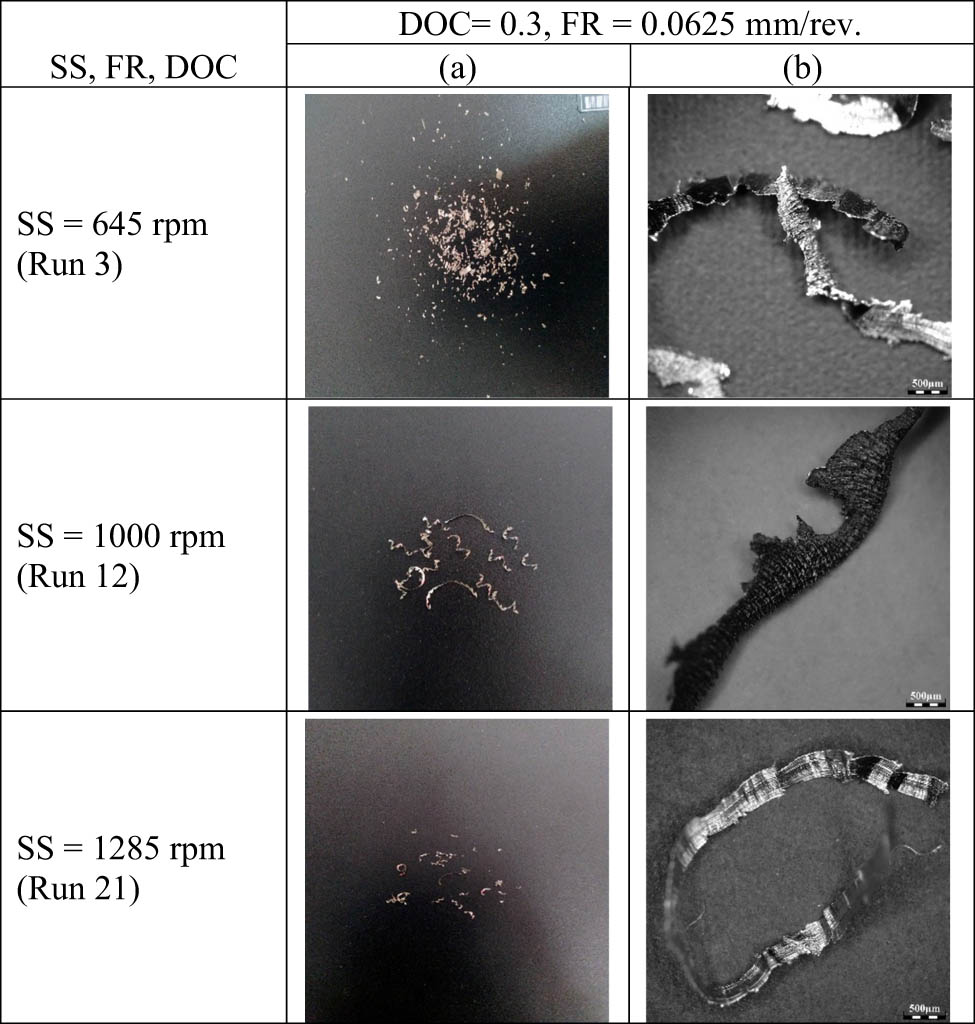
Macroscopic images of chips under a constant depth of cut and feed rate. (a) Image of chip under 1 × zoom at constant depth of cut and feed rate and (b) Macroscopic image of chip at constant depth of cut and feed rate.
As shown in Figure 2, a lower feed rate resulted in the formation of thin chips and increased the cutting temperature. Furthermore, a lower feed rate typically resulted in an improved surface quality (as seen from the experimental results) and a more seamless flow of chips. A lower feed rate also contributed to a lower amount of tool wear rate as it decreased the mechanical stress and accumulation of heat experienced by the cutting tool. On the contrary, an increase in the feed rate resulted in a substantial increase in the chip thickness. On the other hand, the chips exhibit a tightly coiled, long washer-like structure when subjected to a high feed rate [40]. The changes in chip shape are more prominent during the variation in the feed rate as compared to the speed and depth of the cut. The surface R a of the work material was observed to be high with increasing feed rate.
It is evident from Figure 3 that a low depth of cut generated thinner chips compared to its counterparts, which in turn helped in curtailing the total load on the tool and work material. Thus, it contributed to a reasonable surface quality, tool wear, and cutting force, as shown in Table 3. From Figure 3, it is also evidenced that continuous ribbon-type chips were formed at a medium depth of cut, i.e. 0.2 mm, whereas when the depth of cut increased, the pattern of chips was also changed to hard and twisted. In addition, continuous ribbon chips containing nearly uniform thickness were formed at a medium depth of cut. Conversely, for a high depth of cut, chips were more likely to be serrated and sharp-toothed in structures with higher thickness values. This might be due to the high chemical affinity of the selected work part.
Finally, chips were examined at varied spindle speeds and a fixed depth of cut and feed rate to understand their impact on the machinability of the work material. Discontinuous and round-toothed elemental chips were perceived at lower speeds. These chips are separated from the workpiece in fragments because of the brittleness and high degree of hardness of the work material at the initial stage of cutting. This might be due to the significant lack of thermal softening at the beginning of the machining process. On the other hand, at a lower cutting speed, the flank wear of the tool was more apparent since the contact time and stress were high. Further, an increase in the cutting speed to a moderate level decreased the chances of formation of the built-up edge (BUE) due to elevated temperatures (the temperature at Run 12 is comparatively higher), which in turn reduced the adherence of the material to the tool. Therefore, it became feasible to attain a state of equilibrium between the reduction in hardness due to heat and the structural strength, which could potentially result in a longer lifespan for the tool (it is clearly visible from Figure 3 and Table 3 that the flank wear is minimum at a moderate speed, i.e. 1,000 rpm). Besides, at a higher spindle speed, serrated chips were formed and the chip’s serrated texture was the consequence of thermal softening and intermittent shearing in the cutting region [41].
4.3 Study of flank wear
Tool wear is characterized by flank and crater wear. In this study, flank wear during dry turning of Incoloy 825 by using a coated carbide tool was investigated using a metallurgical microscope. Figure 5 depicts the microscopic images of the flank face of the tool insert. Since coated carbide tools were used for turning the work material, BUE formation was very rare because of the anti-sticking properties of the coated material. The results indicate that the BUE formation was more prominent in experiment numbers 1, 11, 22, and 23. This also indicated that when the depth of cut and feed rate were low, BUE was observed considerably. However, with increasing cutting speed and the depth of cut, flank wear was more visible as abrasive marks on the face of the inserts, as depicted in Figure 5. In addition, abrasion wear was also observed on the flank faces, exhibiting distinct sharp ridges and grooves aligned with the flow of chip and workpiece material travel directions. The abrasion wear mechanism in the Incoloy 825 alloy during machining is mostly produced by the mechanical wear resulting from the cutting action of hard carbide particles. Because of inadequate thermal softening, nickel-based superalloys commonly create discontinuous, segmented, or serrated chips at low cutting speeds. Chip hammering is more common with these kinds of chips, as shown in Figure 5, and is also supported by researchers previously [42].
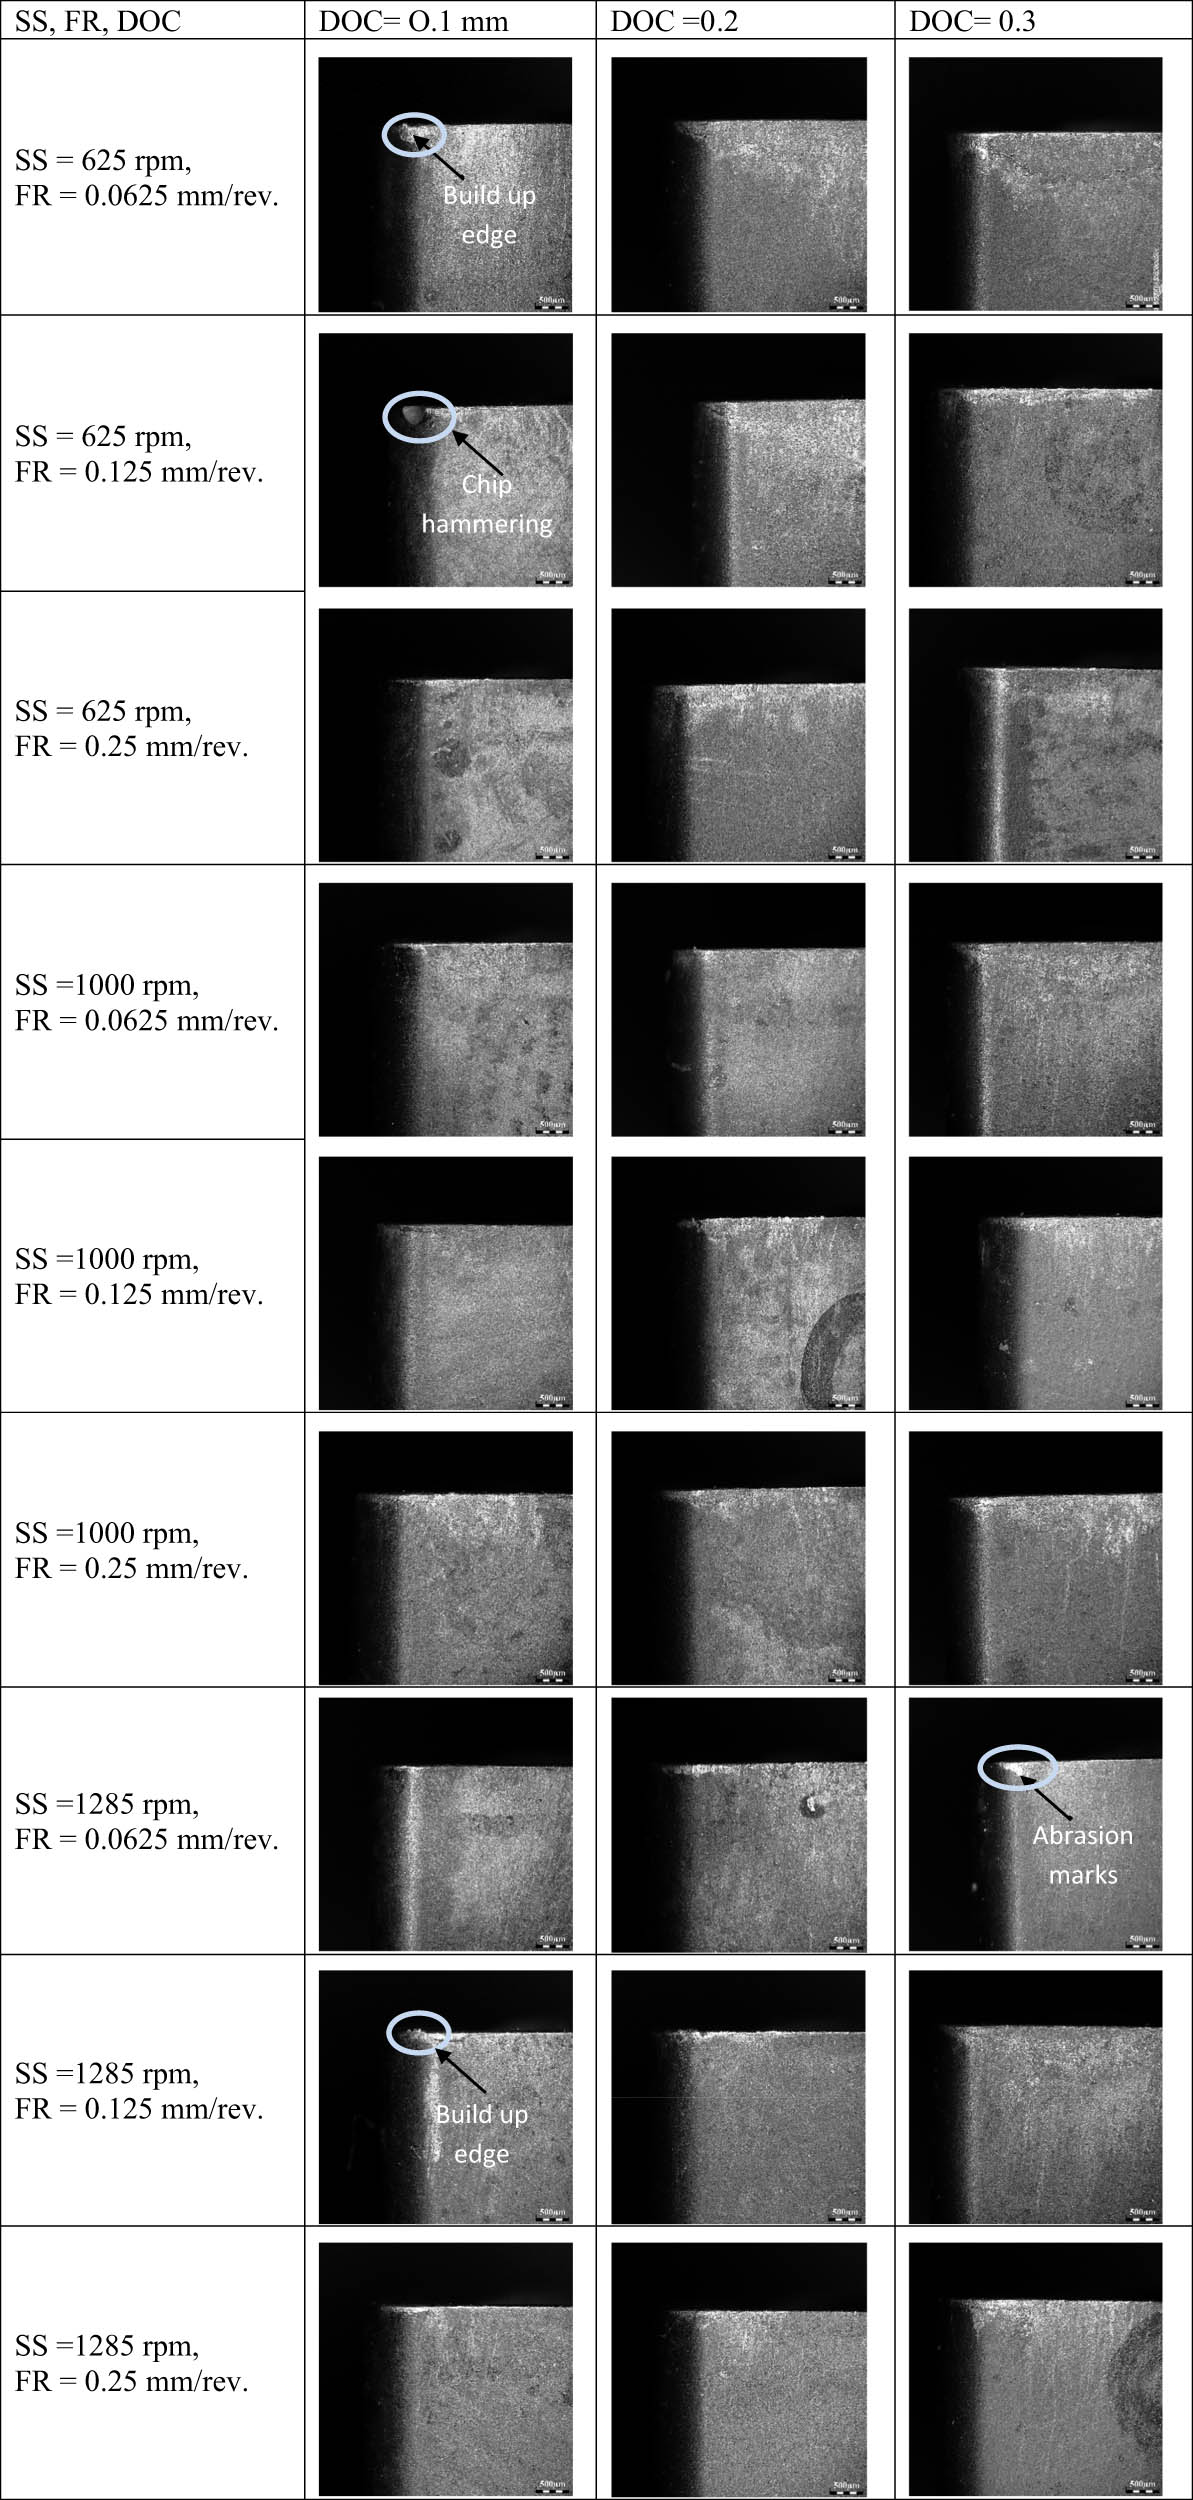
Images of flank wear.
5 Conclusion
This research aims to determine the practicality of employing the entropy-embedded MOORA approach to achieve an optimal combination of parameters when machining Incoloy 825 with coated carbide inserts during the dry environment of machining. The primary focus was on five specific qualitative parameters of machinability: cutting temperature, surface R a, MRR, cutting force, and flank width. The following results are concluded based on the experimental study.
A set of ranges was decided as per the available resources and literature review. The objective of this research was to achieve optimum values of surface R a, cutting temperature, cutting force, MRR, and flank wear. The most efficient and optimum machining parameters were observed at a spindle speed of 1,285 rpm, feed rate of 0.0625 mm·rev−1, and depth of cut of 0.3 mm; these parameters occurred during trial number 21, as shown in Table 2.
The proposed methodology, which combines entropy with the MOORA approach, was found to be efficient, simple, and easily understandable for resolving problems that involve multiple parameters.
The utilization of entropy-MOORA proved to be an effective and suitable approach in attaining an optimal configuration of parameters under specific cutting conditions. This could be valuable in addressing additional MCDM problems in other academic and industrial fields.
It is obvious that a knowledge of chip formation and a study of chip morphology are quite necessary to understand the machinability of materials, especially for turning superalloys and particularly for machining of Ni-alloys, including Incoloy 825.
Flank wear of carbide tools in turning Incoloy 825 is greatly influenced by high cutting temperatures and abrasive wear, demanding improved coatings and adjusted cutting conditions to enhance tool life and performance. Reducing operating costs and increasing machining efficiency require careful management of these variables.
The findings of the current investigation are restricted to the selected range of cutting parameters, cutting environment (i.e. dry), and cutting tools.
The proposed methodology may help the researchers to identify the best treatment combinations in a similar scenario.
Acknowledgements
I would like to thank AICTE for providing the financial support during the Ph.D. tenure. I would like to thank the Department of Mechanical Engineering of NIT, Raipur and IIITDM, Kurnool for allowing me to perform the experiment in their lab facilities.
-
Funding information: The authors state no funding involved.
-
Author contributions: Conceptualization: Shiena Shekhar, Akhtar Khan, Dheeraj Lal Soni; methodology: Saurabh Kumar Sahu, Prashant Kumar Gangwar, Manish Gupta; investigation: Saurabh Kumar Sahu, Shiena Shekhar, Akhtar Khan; data curation: Dheeraj Lal Soni, Prashant Kumar Gangwar, Manish Gupta; formal analysis: Saurabh Kumar Sahu, Akhtar Khan, and Prashant Kumar Gangwar; resources: Akhtar Khan, Dheeraj Lal Soni, and Manish Gupta; supervision: Akhtar Khan and Dheeraj Lal Soni; validation: Saurabh Kumar Sahu and Shiena Shekhar; writing – original draft: Saurabh Kumar Sahu, Shiena Shekhar and Akhtar Khan; writing – review and editing: Dheeraj Lal Soni, Prashant Kumar Gangwar, and Manish Gupta.
-
Conflict of interest: The authors state no conflict of interest.
-
Author statement: The authors are aware of its content and approve its submission. This article has not been submitted anywhere else for parallel publication.
-
Ethical approval: The conducted research is not related to either human or animal use.
-
Data availability statement: All data generated or analysed during this study are included in this published article.
References
[1] Thakur, A. and S. Gangopadhyay. State-of-the-art in surface integrity in machining of nickel-based super alloys. International Journal of Machine Tools and Manufacture, Vol. 100, 2016, pp. 25–54.10.1016/j.ijmachtools.2015.10.001Suche in Google Scholar
[2] Ezugwu, E. O., J. Bonney, and Y. Yamane. An overview of the machinability of aeroengine alloys. Journal of Materials Processing Technology, Vol. 134, No. 2, 2003, pp. 233–253.10.1016/S0924-0136(02)01042-7Suche in Google Scholar
[3] Bhadauria, A., S. Bajpai, A. Tiwari, S. K. Mishra, A. Nisar, S. Dubey, et al. Bimodal microstructure toughens plasma sprayed Al2O3-8YSZ-CNT coatings. Ceramics International, Vol. 49, No. 8, 2023, pp. 12348–12359.10.1016/j.ceramint.2022.12.092Suche in Google Scholar
[4] Rajkumar, V., M. Vishnukumar, M. Sowrirajan, and A. Rajesh Kannan. Microstructure, mechanical properties and corrosion behaviour of Incoloy 825 manufactured using wire arc additive manufacturing. Vacuum, Vol. 203, 2022, id. 111324.10.1016/j.vacuum.2022.111324Suche in Google Scholar
[5] Choudhury, I. A. and M. A. El-Baradie. Machinability of nickel-base super alloys: A general review. Journal of Materials Processing Technology, Vol. 300, No. 3–4, 1998, pp. 278–284.10.1016/S0924-0136(97)00429-9Suche in Google Scholar
[6] Chatterjee, S., S. K. Sahoo, B. Swain, S. S. Mahapatra, and T. Roy. Quality characterization of dissimilar laser welded joints of Ti6Al4V with AISI 304 by using copper deposition technique. The International Journal of Advanced Manufacturing Technology, Vol. 106, No. 9, 2020, pp. 4577–4591.10.1007/s00170-020-04935-5Suche in Google Scholar
[7] Rao, R. V. Machinability evaluation of work materials using a combined multiple attribute decision-making method. The International Journal of Advanced Manufacturing Technology, Vol. 28, No. 3–4, 2006, pp. 221–227.10.1007/s00170-004-2348-4Suche in Google Scholar
[8] Tamizharasan, T., T. Selvaraj, and A. N. Haq. Analysis of tool wear and surface finish in hard turning. The International Journal of Advanced Manufacturing Technology, Vol. 28, No. 7–8, 2006, pp. 671–679.10.1007/s00170-004-2411-1Suche in Google Scholar
[9] Nalbant, M., H. Gökkaya, and G. Sur. Application of Taguchi method in the optimization of cutting parameters for surface roughness in turning. Materials & Design, Vol. 28, No. 4, 2007, pp. 1379–1385.10.1016/j.matdes.2006.01.008Suche in Google Scholar
[10] Ezugwu, E. O. Key improvements in the machining of difficult-to-cut aerospace superalloys. International Journal of Machine Tools and Manufacture, Vol. 45, No. 12–13, 2005, pp. 1353–1367.10.1016/j.ijmachtools.2005.02.003Suche in Google Scholar
[11] Zheng, G., R. Xu, X. Cheng, G. Zhao, L. Li, and J. Zhao. Effect of cutting parameters on wear behavior of coated tool and surface roughness in high-speed turning of 300M. Journal of the International Measurement Confederation, Vol. 125, 2018, pp. 99–108.10.1016/j.measurement.2018.04.078Suche in Google Scholar
[12] Thakur, A., S. Gangopadhyay, A. Mohanty, and K. Maity. Experimental assessment on performance of TiN/TiCN/Al2O3/ZrCN coated tool during dry machining of Nimonic C-263. International Journal of Machining and Machinability of Materials, Vol. 18, No. 5–6, 2016, pp. 452–465.10.1504/IJMMM.2016.078985Suche in Google Scholar
[13] Chen, Z., X. Wu, L. He, F. Jiang, J. Shen, and L. Zhu. Comparative study on micro-milling machinability of titanium alloys prepared by different processes: Forging process, additive manufacturing process and heat-treatment process. Precision Engineering, Vol. 88, 2024, pp. 164–176.10.1016/j.precisioneng.2024.02.010Suche in Google Scholar
[14] Sureja, D., S. Kumari, B. Bhavani, K. Abhishek, R. Chaudhari, M. Singh, et al. Experimental analysis and optimization of machining parameters for Nitinol alloy: A Taguchi and multi-attribute decision-making approach. High Temperature Material Processes, Vol. 43, No. 1, 2024, id. 20220324.10.1515/htmp-2022-0324Suche in Google Scholar
[15] Ponnapureddy, S., A. Bhadauria, S. Bajpai, A. Tiwari, K. K. Pandey, A. K. Keshri, et al. Enhanced reliability with bimodal microstructure and transformation-induced toughening in Al2O3-YSZ based thermal barrier coatings. Surface and Coatings Technology, Vol. 462, Jun. 2023, id. 129488.10.1016/j.surfcoat.2023.129488Suche in Google Scholar
[16] Cagan, S. C. and B. B. Buldum. Machinability investigation of Incoloy 825 in high-speed turning under dry conditions. Reviews Materials, Vol. 26, No. 4, 2021, id. e13066.10.1590/s1517-707620210004.1366Suche in Google Scholar
[17] Chatterjee, S., S. S. Mahapatra, L. Lamberti, and C. I. Pruncu. Prediction of welding responses using AI approach: adaptive neuro-fuzzy inference system and genetic programming. Journal of the Brazilian Society of Mechanical Sciences and Engineering, Vol. 44, No. 2, 2022, id. 53.10.1007/s40430-021-03294-wSuche in Google Scholar
[18] Chatterjee, S., S. S. Mahapatra, A. K. Sahu, V. K. Bhardwaj, A. Choubey, B. N. Upadhyay, et al. Experimental and parametric evaluation of quality characteristics in Nd:YAG laser micro-drilling of Ti6Al4V and AISI 316. Proceedings of the ASME 2017 gas turbine India Conference, vol. 58516, p. V002T10A006, 2017.10.1115/GTINDIA2017-4679Suche in Google Scholar
[19] Choudhury, M. R., H. Dutta, U. Deka, B. Bhavani, K. K. Saxena, and A. Borah. Optimization of process parameters in plasma arc cutting of commercial-grade aluminium plate. High Temperature Materials and Processes, Vol. 43, No. 1, 2024, id. 20220329.10.1515/htmp-2022-0329Suche in Google Scholar
[20] Prajapati V., J. J. Vora, S. Das, K. Abhishek. Study of parametric influence and welding performance optimization during regulated metal deposition (RMDTM) using grey integrated with fuzzy taguchi approach. Journal of Manufacturing Processes, Vol. 54, 2020, pp. 286–300.10.1016/j.jmapro.2020.03.017Suche in Google Scholar
[21] Noordin, M. Y., V. C. Venkatesh, S. Sharif, S. Elting, and A. Abdullah. Application of response surface methodology in describing the performance of coated carbide tools when turning AISI 1045 steel. Journal of Materials Processing Technology, Vol. 145, No. 1, 2004, pp. 46–58.10.1016/S0924-0136(03)00861-6Suche in Google Scholar
[22] Azizi, A., M. Seidi, P. Bahrami, and F. Rabiei. Nickel-based super alloy grinding optimisation using a hybrid multi attribute decision making method based on entropy, AHP and TOPSIS. Advanced Materials Technologies, Vol. 10, No. 3, Jul. 2024, pp. 1536–1555.10.1080/2374068X.2023.2198798Suche in Google Scholar
[23] Sarkar, A., S. C. Panja, D. Das, and B. Sarkar. Developing an efficient decision support system for non-traditional machine selection: an application of MOORA and MOOSRA. Production and Manufacturing Research, Vol. 3, No. 1, 2015, pp. 324–342.10.1080/21693277.2014.895688Suche in Google Scholar
[24] Athawale, V. M. and S. Chakraborty. Material selection using multi-criteria decision-making methods: a comparative study, Proceedings of the Institution of Mechanical Engineers, Part L: Journal of Materials: Design and Applications, Vol. 226, No. 4, 2012, pp. 266–285.10.1177/1464420712448979Suche in Google Scholar
[25] Jhodkar, D., A. Khan, and K. Gupta. Fuzzy-MOORA based optimization of machining parameters for machinability enhancement of titanium. Mathematical Modelling of Engineering Problems, Vol. 8, No. 2, 2021, pp. 189–198.10.18280/mmep.080204Suche in Google Scholar
[26] Satapathy, S., T. K. Mahapatra, N. Alba-Baena, M. Mishra. A complete MCDM-based approach for acoustic material selection using the COPRAS tool BT. In: Noise pollution and ergonomic intervention by acoustic material, Satapathy, S., T. K. Mahapatra, N. Alba-Baena, M. Mishra eds., Springer Nature Switzerland, Cham, 2025, p. 21–35.10.1007/978-3-031-66308-6_3Suche in Google Scholar
[27] Chakraborty, S. Applications of the MOORA method for decision making in manufacturing environment. The International Journal of Advanced Manufacturing Technology, Vol. 54, No. 9–12, 2011, pp. 1155–1166.10.1007/s00170-010-2972-0Suche in Google Scholar
[28] Shakeel Ahmed, L. and M. Pradeep Kumar. Multiresponse optimization of cryogenic drilling on Ti-6Al-4V alloy using topsis method. Journal of Mechanical Science and Technology, Vol. 30, No. 4, 2016, pp. 1835–1841.10.1007/s12206-016-0340-1Suche in Google Scholar
[29] Dinbandhu and K. Abhishek. Parametric optimization and evaluation of RMDTM welding performance for ASTM A387 grade 11 steel plates using TOPSIS-taguchi approach. Lecture Notes in Mechanical Engineering, 2021, pp. 215–227.10.1007/978-981-16-0909-1_22Suche in Google Scholar
[30] Alamri, F. S., M. H. Saeed, and M. Saeed. A hybrid entropy-based economic evaluation of hydrogen generation techniques using multi-criteria decision making. International Journal of Hydrogen Energy, Vol. 49, 2024, pp. 711–723.10.1016/j.ijhydene.2023.10.324Suche in Google Scholar
[31] Azizi, A., M. Seidi, P. Bahrami, and F. Rabiei. Nickel-based super alloy grinding optimisation using a hybrid multi attribute decision making method based on entropy, AHP and TOPSIS. Advances in Materials and Processing Technologies, 2023, pp. 1–20.10.1080/2374068X.2024.2302288Suche in Google Scholar
[32] Abhishek, K., V. Prajapati, S. Kumari, B. K. Potnuru, and D. Bandhu. Application of metal cored filler wire for environmental-friendly welding of low alloy steel: experimental investigation and parametric optimization. International Journal on Interactive Design and Manufacturing, 2024, pp. 1–14.10.1007/s12008-024-01780-8Suche in Google Scholar
[33] Turudija, R., L. Radovic, A. Stankovic, and M. Stojkovic. Multi-criteria decision making in turning operations using AHP, TOPSIS and WASPAS methods, Conference on Information Technology and its Applications, Springer Nature Switzerland, Cham, 2023, pp. 193–205. 2024.10.1007/978-3-031-50755-7_19Suche in Google Scholar
[34] Khan, A. and K. Maity. Parametric optimization of some non-conventional machining processes using moora method. International Journal of Engineering Research in Africa, Vol. 20, 2016, pp. 19–40.10.4028/www.scientific.net/JERA.20.19Suche in Google Scholar
[35] Mounika, G., K. Rajyalakshmi, G. V. S. Rajkumar, and D. Sravani. Prediction and optimization of process parameters using design of experiments and fuzzy logic. International Journal on Interactive Design and Manufacturing, Vol. 18, No. 4, 2023, pp. 2333–2343.10.1007/s12008-023-01446-xSuche in Google Scholar
[36] Brauers, W. K. M. and E. K. Zavadskas. The MOORA method and its application to privatization in a transition economy. Control and Cybernetics Journal, Vol. 35, No. 2, 2006, pp. 445–469.Suche in Google Scholar
[37] Karande, P. and S. Chakraborty. Application of multi-objective optimization on the basis of ratio analysis (MOORA) method for materials selection. Materials and Design, Vol. 37, 2012, pp. 317–324.10.1016/j.matdes.2012.01.013Suche in Google Scholar
[38] Mhlanga, S. T. and M. Lall. Influence of Normalization Techniques on Multi-criteria Decision-making Methods. Journal of Physics: Conference Series, Vol. 2224, No. 1, 2022, id. 012076.10.1088/1742-6596/2224/1/012076Suche in Google Scholar
[39] Pawade, R. S. and S. S. Joshi. Mechanism of chip formation in high-speed turning of inconel 718. Machining Science and Technology, Vol. 15, No. 1, 2011, pp. 132–152.10.1080/10910344.2011.557974Suche in Google Scholar
[40] Anicic, O., S. Jovic, I. Camagic, M. Radojkovic, and N. Stanojevic. Measuring of cutting forces and chip shapes based on different machining parameters. Sensor Review, Vol. 38, No. 3, 2018, pp. 387–390.10.1108/SR-08-2017-0169Suche in Google Scholar
[41] Abidi, Y. Relationship between surface roughness and chip morphology when turning hardened steel. Production Engineering Archives, Vol. 26, No. 3, 2020, pp. 92–98.10.30657/pea.2020.26.19Suche in Google Scholar
[42] Cantero, J. L., J. Díaz-Álvarez, M. H. Miguélez, and N. C. Marín. Analysis of tool wear patterns in finishing turning of Inconel 718. Wear, Vol. 297, No. 1–2, 2013, pp. 885–894.10.1016/j.wear.2012.11.004Suche in Google Scholar
© 2024 the author(s), published by De Gruyter
This work is licensed under the Creative Commons Attribution 4.0 International License.
Artikel in diesem Heft
- Research Articles
- De-chlorination of poly(vinyl) chloride using Fe2O3 and the improvement of chlorine fixing ratio in FeCl2 by SiO2 addition
- Reductive behavior of nickel and iron metallization in magnesian siliceous nickel laterite ores under the action of sulfur-bearing natural gas
- Study on properties of CaF2–CaO–Al2O3–MgO–B2O3 electroslag remelting slag for rack plate steel
- The origin of {113}<361> grains and their impact on secondary recrystallization in producing ultra-thin grain-oriented electrical steel
- Channel parameter optimization of one-strand slab induction heating tundish with double channels
- Effect of rare-earth Ce on the texture of non-oriented silicon steels
- Performance optimization of PERC solar cells based on laser ablation forming local contact on the rear
- Effect of ladle-lining materials on inclusion evolution in Al-killed steel during LF refining
- Analysis of metallurgical defects in enamel steel castings
- Effect of cooling rate and Nb synergistic strengthening on microstructure and mechanical properties of high-strength rebar
- Effect of grain size on fatigue strength of 304 stainless steel
- Analysis and control of surface cracks in a B-bearing continuous casting blooms
- Application of laser surface detection technology in blast furnace gas flow control and optimization
- Preparation of MoO3 powder by hydrothermal method
- The comparative study of Ti-bearing oxides introduced by different methods
- Application of MgO/ZrO2 coating on 309 stainless steel to increase resistance to corrosion at high temperatures and oxidation by an electrochemical method
- Effect of applying a full oxygen blast furnace on carbon emissions based on a carbon metabolism calculation model
- Characterization of low-damage cutting of alfalfa stalks by self-sharpening cutters made of gradient materials
- Thermo-mechanical effects and microstructural evolution-coupled numerical simulation on the hot forming processes of superalloy turbine disk
- Endpoint prediction of BOF steelmaking based on state-of-the-art machine learning and deep learning algorithms
- Effect of calcium treatment on inclusions in 38CrMoAl high aluminum steel
- Effect of isothermal transformation temperature on the microstructure, precipitation behavior, and mechanical properties of anti-seismic rebar
- Evolution of residual stress and microstructure of 2205 duplex stainless steel welded joints during different post-weld heat treatment
- Effect of heating process on the corrosion resistance of zinc iron alloy coatings
- BOF steelmaking endpoint carbon content and temperature soft sensor model based on supervised weighted local structure preserving projection
- Innovative approaches to enhancing crack repair: Performance optimization of biopolymer-infused CXT
- Structural and electrochromic property control of WO3 films through fine-tuning of film-forming parameters
- Influence of non-linear thermal radiation on the dynamics of homogeneous and heterogeneous chemical reactions between the cone and the disk
- Thermodynamic modeling of stacking fault energy in Fe–Mn–C austenitic steels
- Research on the influence of cemented carbide micro-textured structure on tribological properties
- Performance evaluation of fly ash-lime-gypsum-quarry dust (FALGQ) bricks for sustainable construction
- First-principles study on the interfacial interactions between h-BN and Si3N4
- Analysis of carbon emission reduction capacity of hydrogen-rich oxygen blast furnace based on renewable energy hydrogen production
- Just-in-time updated DBN BOF steel-making soft sensor model based on dense connectivity of key features
- Effect of tempering temperature on the microstructure and mechanical properties of Q125 shale gas casing steel
- Review Articles
- A review of emerging trends in Laves phase research: Bibliometric analysis and visualization
- Effect of bottom stirring on bath mixing and transfer behavior during scrap melting in BOF steelmaking: A review
- High-temperature antioxidant silicate coating of low-density Nb–Ti–Al alloy: A review
- Communications
- Experimental investigation on the deterioration of the physical and mechanical properties of autoclaved aerated concrete at elevated temperatures
- Damage evaluation of the austenitic heat-resistance steel subjected to creep by using Kikuchi pattern parameters
- Topical Issue on Focus of Hot Deformation of Metaland High Entropy Alloys - Part II
- Synthesis of aluminium (Al) and alumina (Al2O3)-based graded material by gravity casting
- Experimental investigation into machining performance of magnesium alloy AZ91D under dry, minimum quantity lubrication, and nano minimum quantity lubrication environments
- Numerical simulation of temperature distribution and residual stress in TIG welding of stainless-steel single-pass flange butt joint using finite element analysis
- Special Issue on A Deep Dive into Machining and Welding Advancements - Part I
- Electro-thermal performance evaluation of a prismatic battery pack for an electric vehicle
- Experimental analysis and optimization of machining parameters for Nitinol alloy: A Taguchi and multi-attribute decision-making approach
- Experimental and numerical analysis of temperature distributions in SA 387 pressure vessel steel during submerged arc welding
- Optimization of process parameters in plasma arc cutting of commercial-grade aluminium plate
- Multi-response optimization of friction stir welding using fuzzy-grey system
- Mechanical and micro-structural studies of pulsed and constant current TIG weldments of super duplex stainless steels and Austenitic stainless steels
- Stretch-forming characteristics of austenitic material stainless steel 304 at hot working temperatures
- Work hardening and X-ray diffraction studies on ASS 304 at high temperatures
- Study of phase equilibrium of refractory high-entropy alloys using the atomic size difference concept for turbine blade applications
- A novel intelligent tool wear monitoring system in ball end milling of Ti6Al4V alloy using artificial neural network
- A hybrid approach for the machinability analysis of Incoloy 825 using the entropy-MOORA method
- Special Issue on Recent Developments in 3D Printed Carbon Materials - Part II
- Innovations for sustainable chemical manufacturing and waste minimization through green production practices
- Topical Issue on Conference on Materials, Manufacturing Processes and Devices - Part I
- Characterization of Co–Ni–TiO2 coatings prepared by combined sol-enhanced and pulse current electrodeposition methods
- Hot deformation behaviors and microstructure characteristics of Cr–Mo–Ni–V steel with a banded structure
- Effects of normalizing and tempering temperature on the bainite microstructure and properties of low alloy fire-resistant steel bars
- Dynamic evolution of residual stress upon manufacturing Al-based diesel engine diaphragm
- Study on impact resistance of steel fiber reinforced concrete after exposure to fire
- Bonding behaviour between steel fibre and concrete matrix after experiencing elevated temperature at various loading rates
- Diffusion law of sulfate ions in coral aggregate seawater concrete in the marine environment
- Microstructure evolution and grain refinement mechanism of 316LN steel
- Investigation of the interface and physical properties of a Kovar alloy/Cu composite wire processed by multi-pass drawing
- The investigation of peritectic solidification of high nitrogen stainless steels by in-situ observation
- Microstructure and mechanical properties of submerged arc welded medium-thickness Q690qE high-strength steel plate joints
- Experimental study on the effect of the riveting process on the bending resistance of beams composed of galvanized Q235 steel
- Density functional theory study of Mg–Ho intermetallic phases
- Investigation of electrical properties and PTCR effect in double-donor doping BaTiO3 lead-free ceramics
- Special Issue on Thermal Management and Heat Transfer
- On the thermal performance of a three-dimensional cross-ternary hybrid nanofluid over a wedge using a Bayesian regularization neural network approach
- Time dependent model to analyze the magnetic refrigeration performance of gadolinium near the room temperature
- Heat transfer characteristics in a non-Newtonian (Williamson) hybrid nanofluid with Hall and convective boundary effects
- Computational role of homogeneous–heterogeneous chemical reactions and a mixed convective ternary hybrid nanofluid in a vertical porous microchannel
- Thermal conductivity evaluation of magnetized non-Newtonian nanofluid and dusty particles with thermal radiation