A novel intelligent tool wear monitoring system in ball end milling of Ti6Al4V alloy using artificial neural network
-
Shrimali Mihir Rameshchandra
 ,
Ajit Kumar
,
Jay J. Vora
,
Ajit Kumar
,
Jay J. Vora

Abstract
The geometry and sharpness of the cutting tool have a substantial impact on the final product’s quality. The geometry of cutting edges is altered throughout the machining process, and wear causes the cutting edge to become dull. This causes increased surface roughness, dimensional inaccuracy, cutting forces, chatter, and vibration. The present research focuses on tool wear (Vb) under dry machining conditions during ball end milling of Ti6Al4V alloy. The experiments are conducted using the full factorial design of experiments with three parameters, viz. feed (f), depth of cut (A t), and rotational speed (S) at three levels. A total of 27 experiments are conducted with one replicate. Artificial neural network (ANN) with 3-18-2-1 architecture is used for the study of the tool wear monitoring (TWM) system. Results revealed that the TWM model is highly adequate, with R 2 = 99.89% and R 2adj = 99.65%. The percentage contribution of A t is the highest, amounting to 80.6%, followed by feed of 12.46%. The rotational speed has the least contribution to tool wear, amounting to 1.5%. From ANN modeling, R 2 value testing is found to be 0.9974, which is close to unity and reveals that the trained model excellently fitted the testing data. The model accuracy is also found to be 96.46%.
1 Introduction
Machining techniques have become more valuable as a value addition to produce items due to their ability to produce complex forms, longer tool life, shorter machining times, and fewer tool change times. Among the various machining processes, the ball end milling process is one of the extensively used end milling processes in a variety of industries, including automotive, aerospace, marine, and die/mold, to produce final products of intricate shape and geometry of superior quality. It is generally used for finishing and machining curved surfaces. Material removal occurs in the form of chips. Rapid tool wear is the major concern in ball end milling while machining difficult-to-cut materials such as titanium alloys. Tool wear is also a major concern for the metal-cutting research fraternity because it influences tool life, chatter, machine tool vibration, overall product quality, and product rejection [1]. Rejections of finished products are attributable to poor surface quality and dimensional inaccuracy caused by tool wear. Productivity is also directly associated with machine downtime, non-conforming parts, and the cost of tool replacement caused by the usage of worn tools [2]. Despite the fact that cutting tool life has been extended, thanks to improvements in tool materials and machine tool systems, tools still wear out after prolonged usage. In an effort to avoid this, nearly two decades of work have resulted in the widespread use of tool wear monitoring (TWM) systems on today’s contemporary machine tools, with the aim of preventing such failures. In addition to helping prevent tool failure, TWM can also improve cutting efficiency and maximum use of the tool. Furthermore, there is a growing requirement from manufacturing sectors to create a dependable and resilient TWM to reduce failures while enhancing productivity and product excellence. Consequently, it is crucial to develop a cost-effective and efficient TWM system to elevate machining efficiency and product quality. Two methods, viz. direct and indirect, are employed for TWM. The direct method is an offline TWM method, which is based on the actual loss of tool material measured and observed using laser optical sensors [3]. These methods are highly accurate and reliable; however, they are very expensive and difficult to implement on the shop floor. The former is an online monitoring technique that relies on the data collected by indirect sensors. Therefore, there is a need to develop an indirect TWM system to predict tool wear prior to the machining process [4]. Conventionally, tool wear is determined based on several experiments with varying machining parameters with the help of sensors. A large amount of data is generated that is very difficult to analyze manually. Machine learning (ML) techniques, such as artificial neural network (ANN), fuzzy logic, Adaptive neuro-fuzzy inference system (ANFIS), and artificial intelligence (AI), may prove to be more effective techniques for the prediction of TWM systems [5,6,7]. Image processing is also a potential technique to predict tool wear online, but the majority of the machining processes require cutting fluid; therefore, taking images of the tool/workpiece contact point is a very cumbersome task. A suitable high-resolution image equipped with an efficient algorithm may be helpful in analyzing the data and prediction of the TWM system.
In the manufacturing process, the cutting tools wear after prolonged use and deteriorate the product quality, leading to rejection. Thus, it is of paramount importance for the TWM system to predict tool wear levels to prevent deterioration and tool changes. There is no direct method to measure the tool wear online; thus, indirect methods based on the physical parameters, such as cutting forces, vibrations, surface roughness, and acoustic emissions, appearing during machining are being used to estimate the tool wear [8]. Tool wear has been extensively studied as various manufacturing parameters, such as cutting speed, feed, tool, and workpiece materials, significantly influence the tool wear progression. The machining of brittle materials, such as tungsten, may result in excessive tool wear or breakage after a few seconds of cutting [9]. The acoustic emission signals method was adopted by Ferrando Chacón et al. [10] to predict real-time tool wear by feature extraction based on the multiresolution level using wavelet packet transform. However, the method depends on defining an adequate threshold of amplitude of the signals to obtain consistent wear prediction, which is a very cumbersome task. Several ML techniques, such as decision tree, ANN, vector support mechanics, and k-nearest neighbor were used by various researchers for the identification of tool wear. Twardowski et al. [11] identified the tool wear based on the acoustic emission signal, and error prediction was done using the decision tree approach. Time series imaging and deep learning based on convolutional neural networks were found to be effective in determining tool wear in the end milling process [12]. Cheng et al. [13] presented a predictive model of the tool wear in turning of high-strength steel based on the ML technique using support vector regression, and its kernel function parameters were optimized using a grid search algorithm, genetic algorithm, and particle swarm optimization. The authors collected the cutting force, vibration, and surface texture data, and on the basis of extracted features of cutting force and vibration signal, the prediction accuracies were found to be 97.32 and 96.72%, respectively. Neuro-fuzzy modeling and measured machining force approaches were used by Azmi [14] for TWM in the machining of GFRP composites. ANFIS models were found to be more effective predictive models than power law based on measured machining forces. The image processing technique was also used for real-time tool wear in the machining process. Image processing was employed to predict the wear of the tool by identifying the change in the flank surface with the help of a high-resolution camera [15]. The acquired images were further processed with data acquisition systems. Tool wear is characterized by the change in the angles of the flank surface, which causes the reflection of light at different angles that are observed on the captured image. Various researchers [16,17] have used image processing to predict tool wear in dry machining. In general, in most industries, the machining process is wet machining, i.e., in the presence of a cutting fluid. The tool-workpiece contact zone remains submerged in the cutting fluid, and therefore, it is very difficult to capture the image. Thus, processing such images is very difficult. In the 1990s and 2000s, the majority of the work was based on the empirical modeling of tool wear based on the experimental data. However, such models are not effective in precise prediction of tool wear due to various limitations. The ML methods such as ANN, ANFIS, sensor data fusion approach, and image processing techniques were implemented by various researchers for the specific machining process. Dutta et al. [18] applied backpropagation ANN to predict tool wear in the face milling of carbide inserts. The aim of this study was to investigate the training time of ANN and compare it with other available methods. Palanisamy et al. [19] predicted tool wear in the end milling process using regression and the ANN approach. The authors developed an empirical mathematical model for flank wear using the full factorial method. The experimental data were also used to train feed-forward ANN. Rao et al. [20] predicted tool wear using ANN in boring operations. Multilayer backpropagation techniques were employed, and a predictive model for tool wear was developed. TWM based on the statistical methods and ANN alone may not be effective for intelligent machining; thus, various researchers have used different ML techniques, such as ANFIS [21], fuzzy [22], support vector mechanics [23,24,25], adaptive sensor fusion [26,27], and image processing [28–30] for online prediction of tool wear in various machining operations.
The preceding sections have discussed the effects of tool wear, which is one of the most significant difficulties in the metal-cutting industry. There is not yet a reliable method for keeping track of tool wear. Previous models relied on offline, empirical relationships between machining parameters and tool wear, which has a major impact on productivity. This approach cannot be automated, making it useless in the context of Industry 4.0. Due to various complexities, very little work in TWM in ball end milling has been reported. The present research proposes a novel TWM system based on full factorial and ANN that can predict tool wear during the ball end milling of Ti6Al4V alloy and take necessary action before severe tool wear. Three ball end milling parameters, such as rotational speed (S), feed (f), and axial depth of cut (A t), are considered as the input parameters for the development of the TWM system in terms of flank wear in ball end milling of the Ti6Al4V alloy. The radial depth of the cut was fixed at 0.5 mm. The experiments were planned using the full factorial method based on the design of experiments (DOEs). The 3-level of each parameter is selected for designing the experimental layout, and 27 experiments were performed under dry conditions to record tool flank wear. The threshold of flank wear is taken as VB01, i.e., 0.1 mm of the flank wear. The ML technique ANN with 3-18-2-1 architecture is used for developing the TWM in the ball end milling process.
2 Methods and methodology
2.1 Tool wear
By altering the shape and qualities of the raw material, the manufacturing technology is a series of steps used to turn raw materials into finished goods. Tool wear is unavoidable; therefore, it is crucial to get the most out of it by using ways of compensating for it and controlling the pace at which they wear. The three main factors that contribute to tool wear are abrasion, chip adhesion, and diffusion. These frequently co-occur and take the following typical forms: crater wear, flank wear, thermal cracking, chipping, and plastic deformation. Flank wear is the extensively used wear characteristic in metal cutting, which is characterized by the wear land’s width of the flank. The wear land is categorized into three zones: Zone A, Zone B, and Zone C, as shown in Figure 1. Zone C (VBC) is the curved part of the cutting edge corner, and zone A (VBA) is the quarter of the length of the worn cutting edge. Notch wear (VBN) occurs in zone N. Wear on the flanks (VBB) is represented by the length between zones A and C. VBB = 0.3 mm and VBmax = 0.6 mm are the recommended average flank wear for regular not regular wear, respectively. Zone B denotes the limit of the flank wear.

Determination of flank wear (ISO 3685).
Flank wear can be determined using signal acquisition, which is based on direct and indirect or online methods. The online method is more suitable for TWM and practical applications. In general, dynamometers, acoustics emission sensors, and accelerometers are utilized in TWM. The TWM system in the present study is based on a combination of TWM system hardware and software, as shown in Figure 2. The hardware section is used to perform data acquisition for tool wear, while the software section is utilized for data analysis, tool wear prediction, and decision-making.

TWM system in the machining process.
2.2 Experimental design and layout
The methodical procedure of planning, conducting, and evaluating controlled experiments in order to produce precise and significant results is known as DOE [31]. Several parameters that could influence experimental results are carefully applied in DOE in order to observe how they influence the response variables. This technique makes it possible to reduce the number of trails needed while optimizing the experimental conditions. There are various techniques, such as response surface methodology, Taguchi, factional factorial, and full factorial, available for implementing the DOE. In the present study, a full factorial method is used for designing the experimental layout. This method systematically explores all possible combinations of parameter levels to comprehensively analyze their impact on a response variable. This method provides an exhaustive understanding of the primary effects and interactions among the parameters, allowing for accurate insights into the experimental system. The full factorial design demonstrates a superior ability to capture intricate interactions among parameters compared to other methodologies. Also, the physical significance of full factorial DOE surpasses other experimental designs due to its exhaustive exploration of all parameter combinations, providing a comprehensive understanding of intricate relationships. The number of experiments in full factorial is highest in comparison to other methods. As a consequence, the augmented number of experiments inherent facilitates a more precise analysis for employing the ML techniques. Ball end milling parameters and their levels are shown in Table 1.
Machining parameters as factors and levels for experiments
| Parameters | Unit | Experimental condition levels | ||
|---|---|---|---|---|
| 1 | 2 | 3 | ||
| Axial depth of cut (A t) | mm | 0.5 | 1 | 1.5 |
| Feed (f) | mm/tooth | 0.1 | 0.15 | 0.2 |
| Rotational speed (S) | rpm | 5,000 | 5,500 | 6,000 |
Using 3-factors and their three levels, an experimental layout using the full factorial was created to conduct the actual experiments. Two responses, tool wear, and surface roughness were recorded for each set of experiments. The experimental layout based on full factorial using 3-factor, 3-level is presented in Table 2.
Full factorial experimental plan
| Sl. no. | Actual cutting parameters | Response | ||
|---|---|---|---|---|
| A t (mm) | f (mm/tooth) | S (rpm) | Tool wear (mm) | |
| 1 | 0.5 | 0.1 | 5,000 | 0.01085 |
| 2 | 0.5 | 0.1 | 5,500 | 0.0121 |
| 3 | 0.5 | 0.1 | 6,000 | 0.01365 |
| 4 | 0.5 | 0.15 | 5,000 | 0.017125 |
| 5 | 0.5 | 0.15 | 5,500 | 0.0225 |
| 6 | 0.5 | 0.15 | 6,000 | 0.02885 |
| 7 | 0.5 | 0.2 | 5,000 | 0.033475 |
| 8 | 0.5 | 0.2 | 5,500 | 0.03875 |
| 9 | 0.5 | 0.2 | 6,000 | 0.042925 |
| 10 | 1 | 0.1 | 5,000 | 0.0446 |
| 11 | 1 | 0.1 | 5,500 | 0.05485 |
| 12 | 1 | 0.1 | 6,000 | 0.056725 |
| 13 | 1 | 0.15 | 5,000 | 0.06245 |
| 14 | 1 | 0.15 | 5,500 | 0.069825 |
| 15 | 1 | 0.15 | 6,000 | 0.072125 |
| 16 | 1 | 0.2 | 5,000 | 0.081825 |
| 17 | 1 | 0.2 | 5,500 | 0.088 |
| 18 | 1 | 0.2 | 6,000 | 0.094925 |
| 19 | 1.5 | 0.1 | 5,000 | 0.10035 |
| 20 | 1.5 | 0.1 | 5,500 | 0.1154 |
| 21 | 1.5 | 0.1 | 6,000 | 0.124775 |
| 22 | 1.5 | 0.15 | 5,000 | 0.127325 |
| 23 | 1.5 | 0.15 | 5,500 | 0.145025 |
| 24 | 1.5 | 0.15 | 6,000 | 0.1752 |
| 25 | 1.5 | 0.2 | 5,000 | 0.189075 |
| 26 | 1.5 | 0.2 | 5,500 | 0.21 |
| 27 | 1.5 | 0.2 | 6,000 | 0.2293 |
2.3 Experimental setup and the workpiece-tool material
The ball end milling slot cutting was conducted on the vertical machining center, V544, Macpower, shown in Figure 3. V544, Macpower has an upper rotational speed of 8,000 rpm, a cutting feed rate of 10,000 mm·min−1, a spindle power of 5.5/7.5 kW, a position accuracy of 0.01 mm, and a repeatability of 0.007 mm. All of the experiments were performed under dry conditions on a Ti6Al4V alloy. Ti6Al4V is the most commonly used titanium alloy under the category of α + β titanium alloy. The machining of Ti6Al4V alloy is very challenging due to its low thermal conductivity, high strength, and increase in ductility at elevated temperature. Machining of Ti6Al4V results in tool wear, tool breakage, premature tool failure, high cutting forces, machine tool vibration, and chatter. In the present study, the Ti6Al4V alloy workpiece is used in the form of a sheet with dimensions 270 mm × 210 mm × 3 mm. A four-fluted, TiAlN monolayer PVD-coated solid carbide ball end milling with a helix angle of 30°, diameter of 10 mm, and tool length of 75 mm. Slot milling cut was done keeping a radial depth of cut (a e) 0.5 mm, as shown in Figure 3. The tool wear for each slot milling cut is recorded using a Mitutoyo toolmaker’s microscope (Figure 3, offline processing), which has a measuring range of 50 mm × 50 mm, with a resolution of 1°, a rotation angle of 360°, and a resolution of 6’. The tool wear of all cutting flutes was recorded, and the average wear is presented in Table 2.
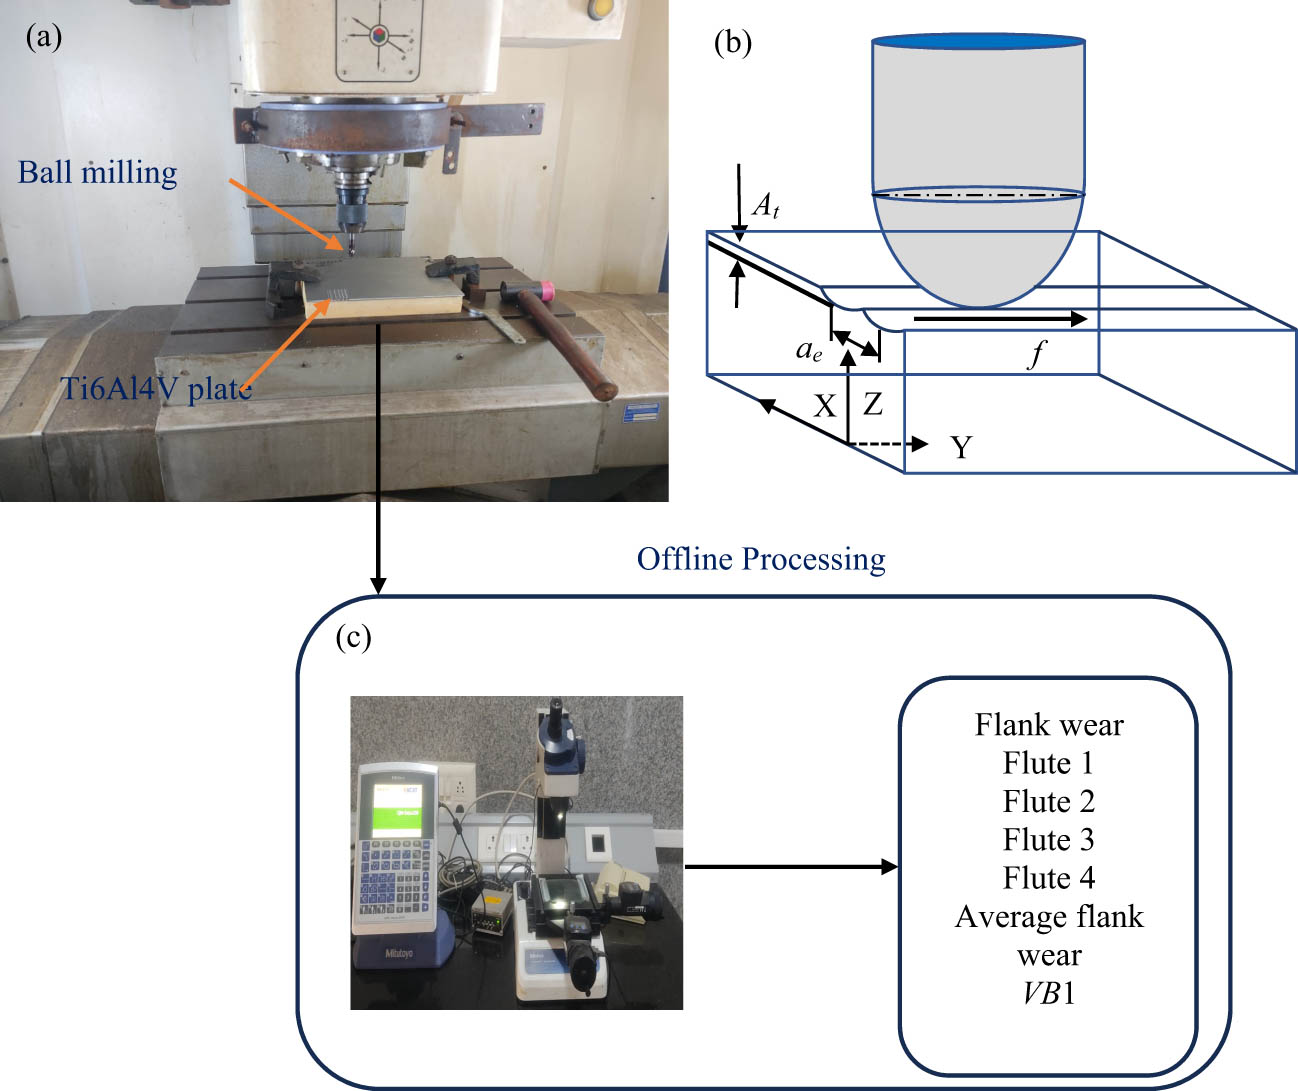
Schematic of the experimental setup: (a) milling machining center with the workpiece, (b) schematic of ball end milling, and (c) tool wear measurement (offline).
2.4 ANN
The ANN is an ML algorithm primarily situated within the realm of supervised learning. Drawing inspiration from the intricate neural structure of the human brain, ANN comprises at least three fundamental layers: the input layer, hidden layer(s), and output layer [32]. Each layer is composed of interconnected neurons. In the process depicted in Figure 4, experimental data are utilized, with a 70% portion reserved for training the network and the remainder for testing its efficacy. The training of the data is used to minimize the error between the predicted values and the actual targets. In this particular research, the logsig function was employed as an activation function in the hidden layers, while linear functions were employed in the output layer. The use of activation functions like the logarithmic sigmoid (logsign) in ANNs for machining tasks primarily introduces non-linearity into the network’s decision-making process. This allows ANNs to model complex relationships between input features and output targets, which is often necessary in machining applications [33,34]. To prevent the activation functions from quickly reaching a saturated state, the network’s weights and biases are initialized to small, random values. MATLAB R2017a was utilized for the simulation and analysis purposes.

Adopted architecture of ANN.
In the present work, a feed-forward ANN architecture was trained to predict tool wear. Given the presence of tool wear on the cutting flutes, a 3-18-2-1 architecture was used for the ANN model. The input parameters for the models included A t, f, and S and the radial depth of cut was kept constant. The number of neurons in the hidden layer was 18 and 2. The Levenberg–Marquardt training method was employed to train the network, with the activation function “logsig” utilized in the hidden layers and “purelin” in the output layer. A learning rate of 0.7 was chosen, and training extended over several thousand epochs. For training the network, 70% of the experimental data was utilized, with the remaining 30% reserved for testing the network’s performance. The architecture of the ANN implemented in MATLAB is illustrated in Figure 5.

Implemented architecture of ANN in MATLAB.
3 Results and discussion
Slot cut was done using the ball end milling cutter as per the experimental plan depicted in Table 2. A total of 27 slots were cut for fixed length and radial depth of cut. The length of each slot was 50 mm. Toll wear was recorded for each slot and is shown in Table 2. The recorded data were further used for parametric analysis and the effect of parameters on the tool wear in ball end milling of the Ti6Al4V alloy. In the present study, VB1, i.e., flank wear of 0.1 mm is taken as the threshold. Any value of tool wear recorded beyond 0.1 mm of flank wear will be deemed as tool wear. These data were further used for developing the model using ANN.
3.1 Analysis of variance (ANOVA) of tool wear
In the present study, ANOVA is used to determine the adequacy of the model in the confidence interval (CI) of 95%. F- and p-tests are employed to check the model’s adequacy. Furthermore, the significance of each parameter was checked using the F- and p-tests. The backward elimination method was used to remove the insignificant terms. ANOVA table for tool wear is shown in Table 3. As shown in Table 3, the developed model is adequate with a high value of coefficient of determination R 2, which is equal to 99.67%. R 2 is the most important statistic that reveals the goodness of fitting among the input and response variables. A higher value of R 2 (near to 1) is desirable. However, a higher value of R 2 does not necessarily explain the variability in the model. This is due to the increase in the value of R 2 with increasing number of variables irrespective of the significance level of the term. It may also be increased by adding insignificant terms to the model [35,36]. Thus, R 2-adj. is preferred over the R 2, which is not affected by adding insignificant terms to the model. From Table 3, it can be observed that the value of R 2-adj. is 98.94%, which is very close to unity. Thus, the model is adequate and suitable for further analysis.
ANOVA table of Vb
| Source | DF | Adj SS | Adj MS | F-value | P-value | PC |
|---|---|---|---|---|---|---|
| A t | 2 | 0.082244 | 0.041122 | 2998.50 | 0.000 | 80.6 |
| f | 2 | 0.012713 | 0.006357 | 463.50 | 0.000 | 12.46 |
| S | 2 | 0.001631 | 0.000816 | 59.47 | 0.000 | 01.5 |
| A t × f | 4 | 0.004406 | 0.001101 | 80.31 | 0.000 | 4.3 |
| A t × S | 4 | 0.000787 | 0.000197 | 14.34 | 0.001 | 0.77 |
| f × S | 4 | 0.000097 | 0.000024 | 1.76 | 0.230 | Insignificant |
| Error | 8 | 0.000110 | 0.000014 | |||
| Total | 26 | 0.101987 |
R 2 = 99.89%, R 2adj = 99.65%, and R 2 -pred = 98.77%.
The adequacy of the tool wear model may also be verified from the various residual plots shown in Figure 6. From normal probability vs residual in Figure 6, it is found that the errors are uniformly distributed on the normal line. The residual vs fitted value shows no time trend in the model, which is desirable. The frequency vs residual plot indicates that the frequency of most of the residuals is in the range of −0.004 to 0.004. The highest frequency of the residual has a value of zero. On further analysis, it has been observed that most of the terms in the model are significant with high p-values, except the interaction term f × S. The model is suitable for further analysis and an empirical relation between the ball end milling parameter and tool wear was obtained, as shown in equation (1). The percentage contribution (PC) of each term is depicted in Table 3. A t has the highest contribution in tool wear, amounting to 80.6%, followed by feed, amounting to 12.46%.

Residual plots of tool wear.
In order to study the effect of ball end milling parameters on the tool wear, main effect plots (shown in Figure 7) were obtained, which represent the influence of individual ball end milling parameters on the tool wear. From the main effect plot, it can be observed that the increase in all the ball end milling parameters, i.e., axial depth of cut and feed and rotation speed, increases the tool wear. The rate of increments in tool wear is most sharp with an axial depth of cut followed by feed and rotational speed. When the axial depth of cut is in the range of 1–1.5 mm, tool wear near 1.2 mm was achieved. There is a sharp increase in the tool wear from 1 to 1.2 mm, and it increases further till the tool failure, as shown in Figure 7(a). This may be due to the unique geometry of the ball end milling cutter in which the axial and radial engagement of cutting edges increases with an increase in the axial depth of the cut. This leads to a high chip load at the cutting edges and an increase in the tool wear. From Figure 7(b), it is observed that the tool wear increases with feed. The same observation was found in the case of S. However, the rate of increase in tool wear is lower with an increase in S. Even at the higher rotational speed, tool wear may not be observed as per the present observation. The smaller effect of S on the tool wear may be attributed to the reduced friction between the cutter and the workpiece in the engagement region with increasing rotational speed. Moreover, heat generated during ball end milling operation is also reduced with increasing rotational speed. Reduced heat generation may slow down the wear rate [37].

Main effects plot of tool wear. (a) mean of Vb Vs. depth of cut, (b) mean of Vb Vs. feed, and (c) mean of Vb Vs. rotational speed.
The interaction effects of machining parameters on tool wear are shown in Figure 8. Figure 8 shows that the tool wear increases with an increase of A t, f, and S. The rate of increase in tool wear is dominated in the case of A t followed by f and S. For the interaction term A t × f shown in Figure 8(a), it was observed that the tool wear is more rapid when the depth of cut increases from 1 to 1.5 mm, keeping the feed value at 0.2 mm/tooth. This may be due to the higher axial and radial engagement of the ball end milling cutter with increasing axial depth of cut. This is due to the fact that the effective diameter of the cutting edge in the ball end milling cutter increases with increasing axial depth of the cut [38], thus increasing cutter engagement at a higher value of the feed (0.2 mm/tooth). An increase in feed also results in a higher chip load on the cutting edge and a possible increase in tool wear. The interaction plot of A t × S is shown in Figure 8(b), which reveals that the increase in tool wear is almost the same for RPM 5500 and 6000 with increasing A t . A steady and small change in tool wear was observed for the interaction term f × S. This phenomenon is observed because f × S is insignificant. The interaction plots in Figure 8(a) and (b) seem to be conversing, which is desirable and shows the interaction among the input parameters.

Interaction plot of tool wear. (a) mean of Vb Vs. At × f, (b) mean of Vb Vs. At × S, and (c) mean of Vb Vs. f × S.
Figure 9 depicts Pareto charts of standardized effects for tool wear with 95% confidence intervals. The Pareto chart was utilized to evaluate the impact of each parameter (feed, axial depth of cut, and rotational) on tool wear, as well as any potential primary effects and interaction effects among these factors. With the Pareto charts, the parameters that have a substantial impact on the response are those that fall outside of the vertical line, which represents 95% of the confidence interval. The bar lengths in the charts correspond to the absolute value of the estimated impacts. A positive sign implies that the responses might increase as the parameter value increases, while a negative sign suggests that the responses can decrease as the parameter’s level increases from the lowest to the highest. The parameters are shown in rank order in Figure 9. It is evident from Figure 9 that tool wear is largely affected by A t and increases as A t increases. The most significant parameter is feed, which comes in second, and the third most influential term is the interaction between feed and the A t. The rotational speed is found to fourth rank, which signifies that rotational speed has a lower effect on the tool wear in ball end milling of Ti6Al4V.

Pareto chart of the tool wear.
3.2 Analysis of ANN model results
To assess the accuracy of a trained model, it is imperative to evaluate how closely its predicted values align with the experimental data [39]. This analysis involves scrutinizing both the error and accuracy of the model. To quantify the error, the predicted value (E p) and the corresponding experimental value (E e) are used. The error calculation entails determining the absolute difference between the predicted and experimental values divided by the experimental value. Equation (2) delineates the formula for calculating the error percentage:
where E is the absolute error percentage, E p is the predicted value, and E e is the experimental value.
Accuracy (A) serves as a metric for gauging the proximity of predicted values to experimental ones. It is computed by the experimental value according to equations (3) and (4). The average individual accuracy (Am) is subsequently calculated using equation (3), with n representing the total number of experiments conducted:
Table 4 depicts the experimental and predicted tool wear using ANN in columns 2 and 3 for each experimental run. The corresponding error and accuracy determined using equations (2) and (3) are shown in columns 4 and 5, respectively.
Predicted value of model Vb with error and accuracy
| Sl. no. | Tool wear | |||
|---|---|---|---|---|
| Vb | Vb prediction | Vb error% | Vb accuracy% | |
| 1 | 0.0109 | 0.009288 | 14.40038 | 85.59962 |
| 2 | 0.0121 | 0.012021 | 0.654275 | 99.34572 |
| 3 | 0.0137 | 0.015242 | 11.66183 | 88.33817 |
| 4 | 0.0171 | 0.01848 | 7.911343 | 92.08866 |
| 5 | 0.0225 | 0.022784 | 1.260173 | 98.73983 |
| 6 | 0.0289 | 0.027666 | 4.104362 | 95.89564 |
| 7 | 0.0335 | 0.032271 | 3.596931 | 96.40307 |
| 8 | 0.0388 | 0.037866 | 2.281526 | 97.71847 |
| 9 | 0.0429 | 0.043546 | 1.447103 | 98.5529 |
| 10 | 0.0446 | 0.047253 | 5.949518 | 94.05048 |
| 11 | 0.0549 | 0.052779 | 3.776285 | 96.22371 |
| 12 | 0.0567 | 0.05822 | 2.636207 | 97.36379 |
| 13 | 0.0625 | 0.062955 | 0.808803 | 99.1912 |
| 14 | 0.0698 | 0.06861 | 1.739389 | 98.26061 |
| 15 | 0.0721 | 0.074632 | 3.475626 | 96.52437 |
| 16 | 0.0818 | 0.08027 | 1.900282 | 98.09972 |
| 17 | 0.0880 | 0.087435 | 0.641572 | 99.35843 |
| 18 | 0.0949 | 0.095455 | 0.558616 | 99.44138 |
| 19 | 0.1004 | 0.101291 | 0.937492 | 99.06251 |
| 20 | 0.1154 | 0.111126 | 3.703426 | 96.29657 |
| 21 | 0.1248 | 0.122332 | 1.957785 | 98.04222 |
| 22 | 0.1273 | 0.133322 | 4.709967 | 95.29003 |
| 23 | 0.1450 | 0.147788 | 1.90498 | 98.09502 |
| 24 | 0.1752 | 0.164478 | 6.119807 | 93.88019 |
| 25 | 0.1891 | 0.181035 | 4.252164 | 95.74784 |
| 26 | 0.2100 | 0.203084 | 3.293372 | 96.70663 |
| 27 | 0.2293 | 0.228849 | 0.196788 | 99.80321 |
The prediction capacity of the ANN model with two hidden layers having 18 and 2 neurons in the first and second hidden layers is shown in Figure 10. The R 2 values (regression coefficient) of training and testing are found to be 0.99944 and 0.9974, respectively. The values for training and testing are very close to unity. Moreover, the R 2 value (0.9974) of testing is very close to unity, which reveals that the trained model excellently fits the testing data. This validates the efficiency of the designed ANN model with two hidden layers comprising 18 and 2 neurons for the first and second layers, respectively, in predicting the tool wear in ball end milling of the Ti6Al4V alloy in dry cutting. Furthermore, the average error and average accuracy obtained using the present model are 3.55 and 96.44%, respectively. The average error is less than 5%, which is satisfactory in the ball end milling process. The predicted and experimental values of tool wear (Vb) are plotted in Figure 11. The predicted and experimental tool wear are in good agreement up to the experimental run number of 20. The differences in the experimental and predicted tool wear values that were found to be significant after run number 20 may be due to the high wear rate and catastrophic failure of the ball end milling cutter. The status of the ball end milling cutter before and after run number 20 is shown in Figure 12. From Figure 12, the catastrophic toll wear is clearly visible, which explains the findings of the ANN model.

(a) Training regression plot for the Vb model. (b) Testing regression plot for the Vb model.

Comparative plot of experimental and ANN-predicted tool wear values.

(a) Status of the tool before run number 20 and (b) status of the tool after run number 20.
4 Conclusions
The present study proposed a novel TWM system based on ML and AI that can predict tool wear during the ball end milling of Ti6Al4V alloy and take necessary actions before tool wear and breakage. Three ball end milling parameters, the rotational speed (S), feed (f), and axial depth of cut (A t), were taken as the input parameters for the development of the TWM system in terms of flank wear in ball end milling of the Ti6Al4V alloy. The radial depth of the cut was fixed at 0.5 mm. The experiments were planned using the full factorial DOE for three parameters at three levels. The following conclusions were drawn:
The developed model using full factorial DOE is found to be adequate, with a variability of 98.94%.
An increase in all of the ball end milling parameters (A t, f, and S) increases the tool wear. The rate of increments in tool wear is most sharp with A t followed by f.
The PC of A t is the highest (80.6%), followed by feed (12.46%).
The prediction capacity of the ANN model with two hidden layers having 18 and 2 neurons in the first and second hidden layers, respectively, is very high, with R 2 values of training and testing being 0.99944 and 0.9974, respectively.
The predicted and experimental tool wear are in good agreement up to the experimental run number of 20.
Acknowledgments
This study was supported by the Centre of Excellence in Aerospace and Defence at IITRAM through the research project grant number IITRAM/COE/CAD/22-23/IRP08. The authors would like to express their gratitude to the Institute of Infrastructure Technology Research and Management (IITRAM) and the Manipal Institute of Technology (MIT), MAHE Bengaluru Campus, for providing the required resources and open access support for this work.
-
Funding information: The authors state no funding is involved.
-
Author contributions: Conceptualization: Mithilesh K. Dikshit, Ajit Kumar, and Jay J. Vora. Methodology: Shrimali Mihir Rameshchandra and Din Bandhu. Investigation: Shrimali Mihir Rameshchandra. Data curation: Shrimali Mihir Rameshchandra and Jay J. Vora. Formal analysis: Mithilesh K. Dikshit and Ajit Kumar. Resources: Soumyashree M. Panchal and Din Bandhu. Software: Ajit Kumar, Din Bandhu, and Mithilesh K. Dikshit. Supervision: Mithilesh K. Dikshit and Ajit Kumar. Validation: Shrimali Mihir Rameshchandra, Din Bandhu, and Soumyashree M. Panchal. Writing – Original Draft: Shrimali Mihir Rameshchandra, Mithilesh K. Dikshit, and Ajit Kumar. Writing – Review and Editing: Jay J. Vora, Soumyashree M. Panchal, and Din Bandhu.
-
Conflict of interest: The authors state no conflict of interest.
-
Ethical approval: The conducted research is not related to either human or animal use.
-
Data availability statement: All data generated or analyzed during this study are included in this published article.
References
[1] Zhou, Y., C. Liu, X. Yu, B. Liu, and Y. Quan. Tool wear mechanism, monitoring and remaining useful life (RUL) technology based on big data: A review. SN Applied Sciences, Vol. 4, No. 8, 2022, id. 232.10.1007/s42452-022-05114-9Suche in Google Scholar
[2] Menezes, J., M. A. Rubeo, K. Kiran, A. Honeycutt, and T. L. Schmitz. Productivity progression with tool wear in titanium milling. Procedia Manufacturing, Vol. 5, 2016, pp. 427–441.10.1016/j.promfg.2016.08.036Suche in Google Scholar
[3] Lister, P. M. and G. Barrow. Tool condition monitoring systems. In Proceedings of the Twenty-Sixth International Machine Tool Design and Research Conference: held in Manchester 17th–18th September 1986, Macmillan Education, UK, 1986, p. 271–288.10.1007/978-1-349-08114-1_36Suche in Google Scholar
[4] Stavropoulos, P., A. Papacharalampopoulos, and T. Souflas. Indirect online tool wear monitoring and model-based identification of process-related signal. Advances in Mechanical Engineering, Vol. 12, No. 5, 2020, id. 1687814020919209.10.1177/1687814020919209Suche in Google Scholar
[5] Pimenov, D. Y., A. Bustillo, S. Wojciechowski, V. S. Sharma, M. K. Gupta, and M. Kuntoğlu. Artificial intelligence systems for tool condition monitoring in machining: Analysis and critical review. Journal of Intelligent Manufacturing, Vol. 34, No. 5, 2023, pp. 2079–2121.10.1007/s10845-022-01923-2Suche in Google Scholar
[6] Wang, Q., H. Wang, L. Hou, and S. Yi. Overview of tool wear monitoring methods based on convolutional neural network. Applied Sciences, Vol. 11, No. 24, 2021, id. 12041.10.3390/app112412041Suche in Google Scholar
[7] Munaro, R., A. Attanasio, and A. Del Prete. Tool wear monitoring with artificial intelligence methods: a review. Journal of Manufacturing and Materials Processing, Vol. 7, No. 4, 2023, id. 129.10.3390/jmmp7040129Suche in Google Scholar
[8] Kious, M., A. Ouahabi, M. Boudraa, R. Serra, and A. Cheknane. Detection process approach of tool wear in high speed milling. Measurement, Vol. 43, No. 10, 2010, pp. 1439–1446.10.1016/j.measurement.2010.08.014Suche in Google Scholar
[9] Olsson, M., V. Bushlya, F. Lenrick, and J. E. Ståhl. Evaluation of tool wear mechanisms and tool performance in machining single-phase tungsten. International Journal of Refractory Metals and Hard Materials, Vol. 94, 2021, id. 105379.10.1016/j.ijrmhm.2020.105379Suche in Google Scholar
[10] Ferrando Chacón, J. L., T. Fernández de Barrena, A. García, M. Sáez de Buruaga, X. Badiola, and J. Vicente. A novel machine learning-based methodology for tool wear prediction using acoustic emission signals. Sensors, Vol. 21, No. 17, 2021, id. 5984.10.3390/s21175984Suche in Google Scholar PubMed PubMed Central
[11] Twardowski, P., M. Tabaszewski, M. Wiciak–Pikuła, and A. Felusiak-Czyryca. Identification of tool wear using acoustic emission signal and machine learning methods. Precision Engineering, Vol. 72, 2021, pp. 738–744.10.1016/j.precisioneng.2021.07.019Suche in Google Scholar
[12] Martínez-Arellano, G., G. Terrazas, and S. Ratchev. Tool wear classification using time series imaging and deep learning. The International Journal of Advanced Manufacturing Technology, Vol. 104, No. 9, 2019, pp. 3647–3662.10.1007/s00170-019-04090-6Suche in Google Scholar
[13] Cheng, M., L. Jiao, X. Shi, X. Wang, P. Yan, and Y. Li. An intelligent prediction model of the tool wear based on machine learning in turning high strength steel. Proceedings of the Institution of Mechanical Engineers, Part B: Journal of Engineering Manufacture, Vol. 234, No. 13, 2020, pp. 1580–1597.10.1177/0954405420935787Suche in Google Scholar
[14] Azmi, A. I. Monitoring of tool wear using measured machining forces and neuro-fuzzy modelling approaches during machining of GFRP composites. Advances in Engineering Software, Vol. 82, 2015, pp. 53–64.10.1016/j.advengsoft.2014.12.010Suche in Google Scholar
[15] Moldovan, O. G., S. Dzitac, I. Moga, T. Vesselenyi, and I. Dzitac. Tool-wear analysis using image processing of the tool flank. Symmetry, Vol. 9, No. 12, 2017, id. 296.10.3390/sym9120296Suche in Google Scholar
[16] Fernández-Robles, L., L. Sánchez-González, J. Díez-González, M. Castejón-Limas, and H. Pérez. Use of image processing to monitor tool wear in micro milling. Neurocomputing, Vol. 452, 2021, pp. 333–340.10.1016/j.neucom.2019.12.146Suche in Google Scholar
[17] Thakre, A. A., A. V. Lad, and K. Mala. Measurements of tool wear parameters using machine vision system. Modelling and Simulation in Engineering, Vol. 2019, No. 1, 2019, id. 1876489.10.1155/2019/1876489Suche in Google Scholar
[18] Dutta, R. K., S. Paul, and A. B. Chattopadhyay. The efficacy of back propagation neural network with delta bar delta learning in predicting the wear of carbide inserts in face milling. The International Journal of Advanced Manufacturing Technology, Vol. 31, No. 5, 2006, pp. 434–442.10.1007/s00170-005-0230-7Suche in Google Scholar
[19] Palanisamy, P., I. Rajendran, and S. Shanmugasundaram. Prediction of tool wear using regression and ANN models in end-milling operation. The. International Journal of Advanced Manufacturing Technology, Vol. 37, No. 1, 2008, pp. 29–41.10.1007/s00170-007-0948-5Suche in Google Scholar
[20] Rao, K. V., B. S. N. Murthy, and N. M. Rao. Prediction of cutting tool wear, surface roughness and vibration of work piece in boring of AISI 316 steel with artificial neural network. Measurement, Vol. 51, 2014, pp. 63–70.10.1016/j.measurement.2014.01.024Suche in Google Scholar
[21] Rao, C. S. and R. R. Srikant. Tool wear monitoring – an intelligent approach. Proceedings of the Institution of Mechanical Engineers, Part B: Journal of Engineering Manufacture, Vol. 218, No. 8, 2004, pp. 905–912.10.1243/0954405041486028Suche in Google Scholar
[22] Malhotra, J. and S. Jha. Fuzzy c-means clustering based colour image segmentation for tool wear monitoring in micro-milling. Precision Engineering, Vol. 72, 2021, pp. 690–705.10.1016/j.precisioneng.2021.07.013Suche in Google Scholar
[23] Jain, A. K. and B. K. Lad. A novel integrated tool condition monitoring system. Journal of Intelligent Manufacturing, Vol. 30, No. 3, 2019, pp. 1423–1436.10.1007/s10845-017-1334-2Suche in Google Scholar
[24] Bhat, N. N., S. Dutta, T. Vashisth, S. Pal, S. K. Pal, and R. Sen. Tool condition monitoring by SVM classification of machined surface images in turning. International Journal of Advanced Manufacturing Technology, Vol. 83, No. 9, 2016, pp. 1487–1502.10.1007/s00170-015-7441-3Suche in Google Scholar
[25] Dutta, S., S. K. Pal, and R. Sen. On-machine tool prediction of flank wear from machined surface images using texture analyses and support vector regression. Precision Engineering, Vol. 43, 2016, pp. 34–42.10.1016/j.precisioneng.2015.06.007Suche in Google Scholar
[26] Bhattacharyya, P. and D. Sengupta. Estimation of tool wear based on adaptive sensor fusion of force and power in face milling. International Journal of Production Research, Vol. 47, No. 3, 2009, pp. 817–833.10.1080/00207540701403376Suche in Google Scholar
[27] Kene, A. P. and S. K. Choudhury. Analytical modeling of tool health monitoring system using multiple sensor data fusion approach in hard machining. Measurement, Vol. 145, 2019, pp. 118–129.10.1016/j.measurement.2019.05.062Suche in Google Scholar
[28] Dutta, S., S. K. Pal, and R. Sen. Progressive tool condition monitoring of end milling from machined surface images. Proceedings of the Institution of Mechanical Engineers, Part B: Journal of Engineering Manufacture, Vol. 232, No. 2, 2018, pp. 251–266.10.1177/0954405416640417Suche in Google Scholar
[29] Bhat, N. N., S. Dutta, S. K. Pal, and S. Pal. Tool condition classification in turning process using hidden Markov model based on texture analysis of machined surface images. Measurement, Vol. 90, 2016, pp. 500–509.10.1016/j.measurement.2016.05.022Suche in Google Scholar
[30] Datta, A., S. Dutta, S. K. Pal, and R. Sen. Progressive cutting tool wear detection from machined surface images using Voronoi tessellation method. Journal of Materials Processing Technology, Vol. 213, No. 12, 2013, pp. 2339–2349.10.1016/j.jmatprotec.2013.07.008Suche in Google Scholar
[31] Dikshit, M. K., A. B. Puri, and A. Maity. Optimization of surface roughness in ball-end milling using teaching-learning-based optimization and response surface methodology. Proceedings of the Institution of Mechanical Engineers, Part B: Journal of Engineering Manufacture, Vol. 231, No. 14, 2017, pp. 2596–2607.10.1177/0954405416634266Suche in Google Scholar
[32] SK, T., S. Shankar, and D. K. Tool wear prediction in hard turning of EN8 steel using cutting force and surface roughness with artificial neural network. Proceedings of the Institution of Mechanical Engineers, Part C: Journal of Mechanical Engineering Science, Vol. 234, No. 1, 2020, pp. 329–342.10.1177/0954406219873932Suche in Google Scholar
[33] Lauwers, B., H. J. Kals, and J. P. Kruth. Adaptive control of a machining process using neural networks. Journal of Materials Processing Technology, Vol. 92, 1999, pp. 139–145.Suche in Google Scholar
[34] Kim, G., S. M. Yang, D. M. Kim, S. Kim, J. G. Choi, M. Ku, et al. Bayesian-based uncertainty-aware tool-wear prediction model in end-milling process of titanium alloy. Applied Soft Computing, Vol. 148, 2023, id. 110922.10.1016/j.asoc.2023.110922Suche in Google Scholar
[35] Dikshit, M. K., V. K. Pathak, R. Agrawal, K. K. Saxena, D. Buddhi, and V. Malik. Experimental study on the surface roughness and optimization of cutting parameters in the hard turning using biocompatible TiAlN-coated and uncoated carbide inserts. Surface Review and Letters, 2023, id. 2340002.10.1142/S0218625X23400024Suche in Google Scholar
[36] Dikshit, M. K., V. K. Pathak, B. Bhavani, M. K. Agrawal, V. Malik, and A. Saxena. Optimization of cutting forces in high-speed ball-end milling using fuzzy-based desirability function approach. International Journal on Interactive Design and Manufacturing (IJIDeM), 2023, pp. 1–14.10.1007/s12008-023-01633-wSuche in Google Scholar
[37] Mali, R. A., R. Aiswaresh, and T. V. K. Gupta. The influence of tool-path strategies and cutting parameters on cutting forces, tool wear and surface quality in finish milling of Aluminium 7075 curved surface. International Journal of Advanced Manufacturing Technology, Vol. 108, 2020, pp. 589–601.10.1007/s00170-020-05414-7Suche in Google Scholar
[38] Dikshit, M. K. Determination of force coefficient based on instantaneous forces and linear mechanistic model in ball end milling. Proceedings of the Institution of Mechanical Engineers, Part B: Journal of Engineering Manufacture, Vol. 237, No. 11, 2023, pp. 1704–1715.10.1177/09544054221136515Suche in Google Scholar
[39] Pathak, V. K., C. Nayak, R. Singh, M. K. Dikshit, and T. Sai. Optimizing parameters in surface reconstruction of transtibial prosthetic socket using central composite design coupled with fuzzy logic-based model. Neural Computing and Applications, Vol. 32, 2020, pp. 15597–15613.10.1007/s00521-020-04895-7Suche in Google Scholar
© 2024 the author(s), published by De Gruyter
This work is licensed under the Creative Commons Attribution 4.0 International License.
Artikel in diesem Heft
- Research Articles
- De-chlorination of poly(vinyl) chloride using Fe2O3 and the improvement of chlorine fixing ratio in FeCl2 by SiO2 addition
- Reductive behavior of nickel and iron metallization in magnesian siliceous nickel laterite ores under the action of sulfur-bearing natural gas
- Study on properties of CaF2–CaO–Al2O3–MgO–B2O3 electroslag remelting slag for rack plate steel
- The origin of {113}<361> grains and their impact on secondary recrystallization in producing ultra-thin grain-oriented electrical steel
- Channel parameter optimization of one-strand slab induction heating tundish with double channels
- Effect of rare-earth Ce on the texture of non-oriented silicon steels
- Performance optimization of PERC solar cells based on laser ablation forming local contact on the rear
- Effect of ladle-lining materials on inclusion evolution in Al-killed steel during LF refining
- Analysis of metallurgical defects in enamel steel castings
- Effect of cooling rate and Nb synergistic strengthening on microstructure and mechanical properties of high-strength rebar
- Effect of grain size on fatigue strength of 304 stainless steel
- Analysis and control of surface cracks in a B-bearing continuous casting blooms
- Application of laser surface detection technology in blast furnace gas flow control and optimization
- Preparation of MoO3 powder by hydrothermal method
- The comparative study of Ti-bearing oxides introduced by different methods
- Application of MgO/ZrO2 coating on 309 stainless steel to increase resistance to corrosion at high temperatures and oxidation by an electrochemical method
- Effect of applying a full oxygen blast furnace on carbon emissions based on a carbon metabolism calculation model
- Characterization of low-damage cutting of alfalfa stalks by self-sharpening cutters made of gradient materials
- Thermo-mechanical effects and microstructural evolution-coupled numerical simulation on the hot forming processes of superalloy turbine disk
- Endpoint prediction of BOF steelmaking based on state-of-the-art machine learning and deep learning algorithms
- Effect of calcium treatment on inclusions in 38CrMoAl high aluminum steel
- Effect of isothermal transformation temperature on the microstructure, precipitation behavior, and mechanical properties of anti-seismic rebar
- Evolution of residual stress and microstructure of 2205 duplex stainless steel welded joints during different post-weld heat treatment
- Effect of heating process on the corrosion resistance of zinc iron alloy coatings
- BOF steelmaking endpoint carbon content and temperature soft sensor model based on supervised weighted local structure preserving projection
- Innovative approaches to enhancing crack repair: Performance optimization of biopolymer-infused CXT
- Structural and electrochromic property control of WO3 films through fine-tuning of film-forming parameters
- Influence of non-linear thermal radiation on the dynamics of homogeneous and heterogeneous chemical reactions between the cone and the disk
- Thermodynamic modeling of stacking fault energy in Fe–Mn–C austenitic steels
- Research on the influence of cemented carbide micro-textured structure on tribological properties
- Performance evaluation of fly ash-lime-gypsum-quarry dust (FALGQ) bricks for sustainable construction
- First-principles study on the interfacial interactions between h-BN and Si3N4
- Analysis of carbon emission reduction capacity of hydrogen-rich oxygen blast furnace based on renewable energy hydrogen production
- Just-in-time updated DBN BOF steel-making soft sensor model based on dense connectivity of key features
- Effect of tempering temperature on the microstructure and mechanical properties of Q125 shale gas casing steel
- Review Articles
- A review of emerging trends in Laves phase research: Bibliometric analysis and visualization
- Effect of bottom stirring on bath mixing and transfer behavior during scrap melting in BOF steelmaking: A review
- High-temperature antioxidant silicate coating of low-density Nb–Ti–Al alloy: A review
- Communications
- Experimental investigation on the deterioration of the physical and mechanical properties of autoclaved aerated concrete at elevated temperatures
- Damage evaluation of the austenitic heat-resistance steel subjected to creep by using Kikuchi pattern parameters
- Topical Issue on Focus of Hot Deformation of Metaland High Entropy Alloys - Part II
- Synthesis of aluminium (Al) and alumina (Al2O3)-based graded material by gravity casting
- Experimental investigation into machining performance of magnesium alloy AZ91D under dry, minimum quantity lubrication, and nano minimum quantity lubrication environments
- Numerical simulation of temperature distribution and residual stress in TIG welding of stainless-steel single-pass flange butt joint using finite element analysis
- Special Issue on A Deep Dive into Machining and Welding Advancements - Part I
- Electro-thermal performance evaluation of a prismatic battery pack for an electric vehicle
- Experimental analysis and optimization of machining parameters for Nitinol alloy: A Taguchi and multi-attribute decision-making approach
- Experimental and numerical analysis of temperature distributions in SA 387 pressure vessel steel during submerged arc welding
- Optimization of process parameters in plasma arc cutting of commercial-grade aluminium plate
- Multi-response optimization of friction stir welding using fuzzy-grey system
- Mechanical and micro-structural studies of pulsed and constant current TIG weldments of super duplex stainless steels and Austenitic stainless steels
- Stretch-forming characteristics of austenitic material stainless steel 304 at hot working temperatures
- Work hardening and X-ray diffraction studies on ASS 304 at high temperatures
- Study of phase equilibrium of refractory high-entropy alloys using the atomic size difference concept for turbine blade applications
- A novel intelligent tool wear monitoring system in ball end milling of Ti6Al4V alloy using artificial neural network
- A hybrid approach for the machinability analysis of Incoloy 825 using the entropy-MOORA method
- Special Issue on Recent Developments in 3D Printed Carbon Materials - Part II
- Innovations for sustainable chemical manufacturing and waste minimization through green production practices
- Topical Issue on Conference on Materials, Manufacturing Processes and Devices - Part I
- Characterization of Co–Ni–TiO2 coatings prepared by combined sol-enhanced and pulse current electrodeposition methods
- Hot deformation behaviors and microstructure characteristics of Cr–Mo–Ni–V steel with a banded structure
- Effects of normalizing and tempering temperature on the bainite microstructure and properties of low alloy fire-resistant steel bars
- Dynamic evolution of residual stress upon manufacturing Al-based diesel engine diaphragm
- Study on impact resistance of steel fiber reinforced concrete after exposure to fire
- Bonding behaviour between steel fibre and concrete matrix after experiencing elevated temperature at various loading rates
- Diffusion law of sulfate ions in coral aggregate seawater concrete in the marine environment
- Microstructure evolution and grain refinement mechanism of 316LN steel
- Investigation of the interface and physical properties of a Kovar alloy/Cu composite wire processed by multi-pass drawing
- The investigation of peritectic solidification of high nitrogen stainless steels by in-situ observation
- Microstructure and mechanical properties of submerged arc welded medium-thickness Q690qE high-strength steel plate joints
- Experimental study on the effect of the riveting process on the bending resistance of beams composed of galvanized Q235 steel
- Density functional theory study of Mg–Ho intermetallic phases
- Investigation of electrical properties and PTCR effect in double-donor doping BaTiO3 lead-free ceramics
- Special Issue on Thermal Management and Heat Transfer
- On the thermal performance of a three-dimensional cross-ternary hybrid nanofluid over a wedge using a Bayesian regularization neural network approach
- Time dependent model to analyze the magnetic refrigeration performance of gadolinium near the room temperature
- Heat transfer characteristics in a non-Newtonian (Williamson) hybrid nanofluid with Hall and convective boundary effects
- Computational role of homogeneous–heterogeneous chemical reactions and a mixed convective ternary hybrid nanofluid in a vertical porous microchannel
- Thermal conductivity evaluation of magnetized non-Newtonian nanofluid and dusty particles with thermal radiation