Thermodynamic modeling of stacking fault energy in Fe–Mn–C austenitic steels
-
Xinlong Yang


Abstract
A thermodynamic model to predict the stacking fault energy (SFE) of Fe–Mn and Fe–Mn–C austenite steels based on the two-sublattice method has been developed. The calculated Gibbs free energy change, phase transformation temperature, and SFE are basically coincident with the experiment values. The interfacial energy during face center cubic to hexagonal close packed transformation was determined by a parabolic function of Gibbs free energy change in the concerned systems. The interstitial segregation and the resulting SFE in Fe–Mn–C steels have been clearly revealed. The carbon segregated concentration in the stacking faults is in good agreement with the measured value. Low SFE regions were observed to be located at 12 wt% manganese in the Fe–Mn binary system and at 14 wt% manganese in the Fe–Mn–C ternary system, respectively. The carbon- and manganese-dependent SFE maps were consequentially plotted under different temperatures and grain sizes. For the steels with manganese and carbon range between 10–30 and 0–1.2 wt%, the SFE increases monotonously with temperature increasing. The SFE of Fe–Mn–C steels decreases as grain size increases from 1 to 70 μm. However, for the alloys with more coarse-grained structures, the SFE sensitivity to grain size was not obvious.
1 Introduction and background
Stacking fault energy (SFE) has been regarded as one of the most important thermodynamic parameters in the investigation of deformation mechanisms since the wide use of high alloyed austenitic steels. The strain-hardening behavior of face-centered cubic metals has also been found to be closely related to SFE. According to numerous studies reported, phase transformation-induced plasticity (TRIP) usually occurs at low SFE of less than 12 mJ·m−2, while dislocation planar glide appears at high SFE above 80 mJ·m−2 [1,2,3]. When the SFE values located within the range between 20 and 35 mJ·m−2, an outstanding performance of twinning-induced plasticity (TWIP) in Fe–Mn–Si–Al and Fe–Mn–C–(–Al) austenitic steels was exhibited. [4,5]. The microbands and shear bands induced plasticity in the extremely high manganese and high aluminum steels could also be affected and described by SFE [6,7]. In our previous work, the TWIP effect and strain hardening behavior in Fe–Mn–C austenitic steels have been experimentally investigated, which confirms the importance of SFE in material design and deformation mechanism analysis [8,9,10,11].
Several different models for the SFE calculation of Fe–Mn–C austenite steels for automobiles with extremely high tensile strength and high ductility have been built up. Grässel et al. [3,4] employed a regular solution model in calculating the SFE in Fe–Mn–Si–Al TRIP or TWIP steels, and they pointed out that the critical value for the transition of TRIP to the TWIP effect was about 20 mJ·m−2. Allain et al. [4,5] made a similar model to investigate the correlation between the calculated SFE and the plasticity mechanism in Fe–Mn–C steels, in which the effect of alloyed elements on SFE was theoretically revealed. A subregular solution model to predict SFE was developed by Saeed-Akbari et al. [12] for Fe–Mn–C(–Al) austenite steels, and the results calculated based on different thermodynamic parameters presented by Dew-Hughes and Kaufman [13,14] and Dinsdale [15] were schematically compared. Petrov [16], Petrov and Yakubtsov [17], and Yakubtsov et al. [18] studied the SFE of austenite stainless steels and high manganese steels with carbon and/or nitrogen alloyed by the Bragg-Williams model. Nonlinear relationships were found between SFE and interstitial concentration due to the Suzuki effect. This should be the most obvious difference between the models by Saeed-Akbari et al. [12] and Petrov [16]. Nakano and Jacques [19] built up a new model based on the two-sublattice method to investigate the effect of thermodynamic parameters on SFE calculations in the Fe–Mn and Fe–Mn–C systems. With the parameters taken from SGTE data [15] and Huang’s work [20], the phase transformation temperature and SFE prediction were roughly coincident with experiment values.
1.1 SFE by calculation and experiment
Figure 1 shows the calculated iso-SFE lines in the carbon/manganese (wt%) map at 300 K from different approaches [4,12,19], and straight lines proposed by Schumann [21] to describe the regimes of mechanical HCP and thermal HCP were also plotted. It can be seen the results based on different methods and parameters exhibit diverse characteristics. The SFE gradients in these three maps are found not very similar to one another within the range of 10–35 wt% manganese and 0–1.2 wt% carbon. At a given composition, the SFEs calculated by these three models are not quite equal and even in different ranges. The discrepancy between experiment results by X-ray diffraction, transmission electron microscopy, and embedded atom method and the thermodynamic model is still quite large [22,23,24,25,26,27], as shown in Table 1. It is difficult to distinguish the effective range for the application of these models. Further research, both on experiments and on thermodynamics, is always needed.
![Figure 1
Calculated iso-SFE lines in the carbon/manganese (wt%) map at 300 K (unit: mJ·m−2): (a) by Allain et al. [4], (b) by Saeed-Akbari et al. [12], and (c) by Nakano and Jacques [19]. Straight lines proposed by Schumann to describe the regimes of mechanical HCP and thermal HCP were also plotted [21].](/document/doi/10.1515/htmp-2024-0053/asset/graphic/j_htmp-2024-0053_fig_001.jpg)
SFEs measured by various methods in high manganese steel
| No. | Chemical composition (wt%) | SFE (mJ·m−2) | Method | References |
|---|---|---|---|---|
| 1 | Fe–25Mn–0.15C–0.6Al | 7.75 | XRD | [22] |
| 2 | Fe–25Mn–0.15C–1.5Al | 10.67 | XRD | [22] |
| 3 | Fe–25Mn–0.15C–2.2Al | 15.12 | XRD | [22] |
| 4 | Fe–25Mn–0.15C–3.1Al | 14.95 | XRD | [22] |
| 5 | Fe–25Mn–0.15C–4.8Al | 54.74 | XRD | [22] |
| 6 | Fe–31Mn–0.17C | 17.53 | XRD | [23] |
| 7 | Fe–19Mn–5Cr–0.25C–1.2Al | 21 | TEM node | [24] |
| 8 | Fe–19Mn–5Cr–0.25C–2.5Al | 31 | TEM node | [24] |
| 9 | Fe–19Mn–5Cr–0.25C–3.3Al | 39 | TEM node | [24] |
| 10 | Fe–19Mn–5Cr-0.25C–4.0Al | 47 | TEM node | [24] |
| 11 | Fe–18Mn–0.6C–1.5Al | 26.4 | TEM node | [25] |
| 12 | Fe–18Mn–0.6C–1.5Al | 30.0 | TEM WBDF | [25] |
| 13 | Fe–18Mn–1.3C | 15.0 | TEM WBDF | [26] |
1.2 Calculation method and parameters
The regular solution model [4], subregular solution model [12], Bragg-Williams model [16,17,18], and two-sublattice model [19] have been employed to calculate the Gibbs free energy change during face center cubic (FCC) to hexagonal close packed (HCP) transformation in recent years. In fact, the carbon atoms are usually interstitials corresponding to manganese and iron atoms in the concerned Fe–Mn–C system. In the regular solution model and subregular solution model, however, this lattice characteristic has to be neglected or simplified [4]. With the Bragg-Williams model, the carbon alloying impact on system Gibbs free energy can be fully described, but more parameters are still lacking for high manganese high carbon steels [17,18]. Two sublattice models, with the consideration of the interstitial effect of carbon atoms in the Fe–Mn–C ternary system, have been introduced into the thermodynamic calculation of phase transformation for a long time, but the SFE results reported in Nakano and Jacques’ model are much higher than the experimental and theoretical results from others [19]. The methods to calculate SFE are of great diversity, leading to a large difficulty in validating these models.
Thermodynamic parameters are also different in the reported work during the calculation of SFE. The Gibbs free energy change of pure carbon is not included in the Bragg-Williams model and two-sublattice model but is necessary in the regular solution model and subregular solution model. It is worth noticing that the Gibbs free energy changes during FCC to HCP transformation of pure manganese and ferrite in different models are also of great difference, but all reported models are proved to be able to predict the appreciable result [4,12,19]. Akbari et al. [12] figured out that the SFE values based on Kaufman and co-workers’ parameters [13,14] were believable, while those from the SGTE database [15] were incorrect. Nakano and Jacques [19], however, employed the two-sublattice model to calculate SFE with SGTE parameters [15], and the results were also verified. The correlation between SFE and thermodynamic parameters in the Fe–Mn–C ternary system is still not very clear.
1.3 Interstitials segregation
One important problem that should not be ignored in the calculation of SFE in the Fe–Mn–C system is the interstitial segregation phenomenon, which has been observed evidently in the previous experiment by Petrov [16,17]. The interstitial carbon atoms in the Fe–Mn lattice would segregate to stacking fault regions during deformation (Suzuki atmosphere), leading to the variation of Gibbs free energy [18]. It is found that this important characteristic is not always taken into consideration in the reported models [4,12,19]. It is still necessary to investigate whether the Suzuki effect has a vital impact on Gibbs free energy and the final SFE.
1.4 The present work
The aim of the present work is to make a comparison of the previous SFE models in Fe–Mn–C austenitic steels (Part 1) and to develop a new thermodynamic model to predict the SFE of Fe–Mn and Fe–Mn–C systems based on two-sublattice method (Part 2). The feasibility of thermodynamic parameters, such as free energies of pure materials and alloys, transformation temperature T 0 (FCC to HCP), interfacial energy, grain size, and lattice parameter, are also discussed (Parts 2 and 3). The SFE variation as a function of segregated carbon concentration in stacking faults related to the Suzuki effect is then taken into consideration (Parts 2 and 3). Composition and temperature-dependent SFE maps are consequentially plotted (Part 4). All results have been compared with the previous experimental values, and good agreement has been obtained.
2 Thermodynamic modeling description
As early proposed by Hirth [28] in 1970, the thermodynamic models of SFE in high alloyed steels were reported by Ferreira and Mullner [29], Olson and co-workers [30,31], and Lee and Choi [32]. The SFE can be calculated by the following equation:
where
The molar surface density
where
The lattice parameter of austenite is composition and temperature dependent in the present model, and it can be determined by the following formulas [33,34]:
where
The molar Gibbs free energy change
where
For the current system,
where
with
The molar Gibbs energy of a phase
where
The interaction parameters
The Gibbs free energy related to the magnetic phenomenon was studied by Inden [36] and Hillert and Jarl [37] as follows:
where
According to Gutierrez-Urrutia and Raabe [6],
where
The magnetic transition temperature
where
The function
For
For
As shown by Ishida [39], the Gibbs free energy change due to interstitial segregation could be divided into three parts:
where
It is assumed that the chemical potential of FCC is equal to that of HCP when the equilibrium is reached. For the binary system with one substitutional element and one interstitial element, the following equation can be obtained:
with
Petrov and Yakubtsov [17] employed Ishida’s assumption [39] that the systems were ideal solutions, and the following equation can be obtained for the ternary system:
where
where
Then, the chemical free energy change
The surface free energy change due to the segregated alloying elements in stacking faults was analyzed by Ericsson [40]:
where
According to Suzuki’s study, the elastic free energy change
where
Nakatsu et al. [41] and Lee and Choi [32] suggested that the free energy change linked to the grain sizes could not be neglected particularly below 30 μm, and it can be calculated as follows:
where
3 Calculated SFE in the concerned systems
3.1 Fe–Mn binary system
For the Fe–Mn binary system, the site fraction
The excess molar Gibbs free energy can be shown by
Actually, for Fe–Mn binary systems with no interstitial element alloyed, the present model based on the two-sublattice method can be simplified to a regular solution model. The thermodynamic parameters are presented in Table 2. In fact, most of these parameters are from SGTE data by Dinsdale [15], based on which Huang [20,42] and Djurovic et al. [43] calculated the experimentally verified Fe–C, Mn–C, and Fe–Mn–C phase diagrams.
Thermodynamic parameters for the Fe–Mn–C system (SI units)
|
|
Reference |
|---|---|
|
|
[15] |
|
|
[15] |
|
|
[45] |
|
|
[42] |
|
|
[45] |
|
|
[42] |
|
|
[43] |
|
|
[20] |
|
|
[20] |
|
|
[45] |
|
|
[20] |
|
|
[20] |
|
|
[20] |
|
|
|
|
|
[15] |
|
|
[15] |
|
|
[45] |
|
|
[42] |
|
|
[20] |
|
|
[20] |
|
|
[43] |
|
|
[45] |
|
|
[42] |
|
|
[20] |
The change of Gibbs free energy as a function of manganese content predicted by the present model for the Fe–Mn binary system at 298 K is shown in Figure 2, in which the calculation results from previous studies are also plotted [19,20,32]. The Gibbs free energy change during
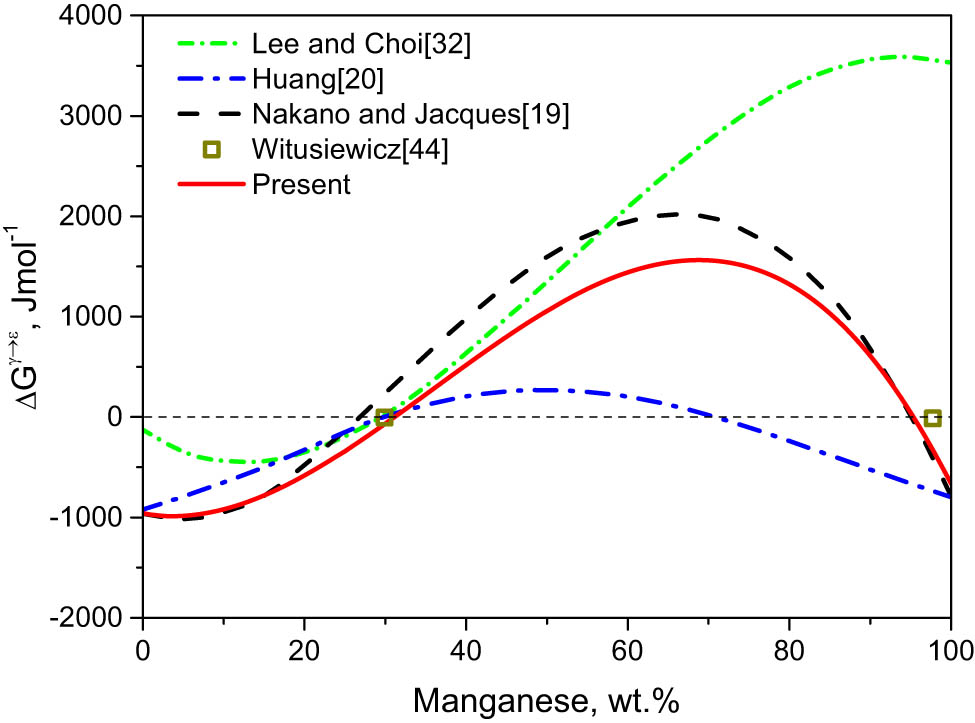
Gibbs free energy change during
Figure 3 shows the relationship of calculated transformation temperature T 0 with manganese content in the Fe–Mn binary system. T 0 is defined as the temperature at which the Gibbs free energy of FCC is equal to that of HCP. As manganese content increases from 0 to 35 wt%, the transformation temperature decreases gradually. It can be seen the predicted T 0 values followed well with the experimental results from previous studies [46,47,48,49].
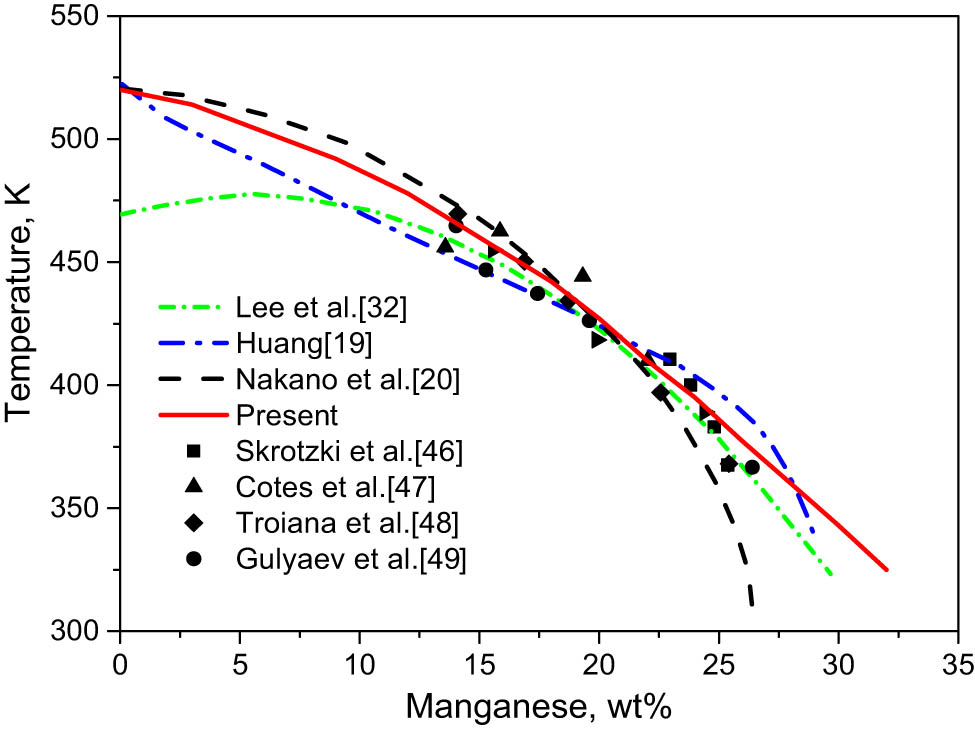
Comparison of calculated and experiment transformation temperature T
0 during
The SFE variation against manganese content in the Fe–Mn system at 298 K is shown in Figure 4. The calculated results by Huang [20], Nakano and Jacques [19], Lee and Choi [32], and Saeed-Akbari et al. [12] and experiment values by Schumann [50], Petrov et al. [51], Volosevich et al. [52] are also presented. SFEs decrease as manganese content increases from 0 to 10 wt% and turn to increase as manganese content increases further. Nakano and Jacques [19] predicted the minimum SFE of about 12 mJ·m−2 appeared at about 5 wt% Mn, while Lee and Choi [32] and Saeed-Akbari et al. [12] found the extreme point of the SFE line was at 13 wt% Mn. Additionally, even the results proposed by Huang [20] and Allain et al. [4] were observed to be monotonic increasing. Schumann [50] presented a sharp SFE curve with the trough point located at 13 wt% Mn. Volosevich et al. [52] experimentally estimated that the minimum SFE of 15 mJ·m−2 corresponds to a Mn content of 22 wt%, and Petrov et al. [51] measured the SFE of Fe–Mn alloys and indicated that the minimum of empirical SFE shift between 20 and 25 wt% Mn related to the specimens’ purity. In the recent work on SFE in high manganese TWIP steels by Pierce et al. [53], the original experimental SFEs on the Fe–Mn system by Schumann [50] and Volosevich et al. [52] were proved to be much higher than the recent calculation and experiment results. The variation trend and the location of the present curve are quite close to that of the values proposed by Lee and Choi [32], Saeed-Akbari et al. [12], and Schumann [50], especially when the Mn concentration is in 10–30 wt%.
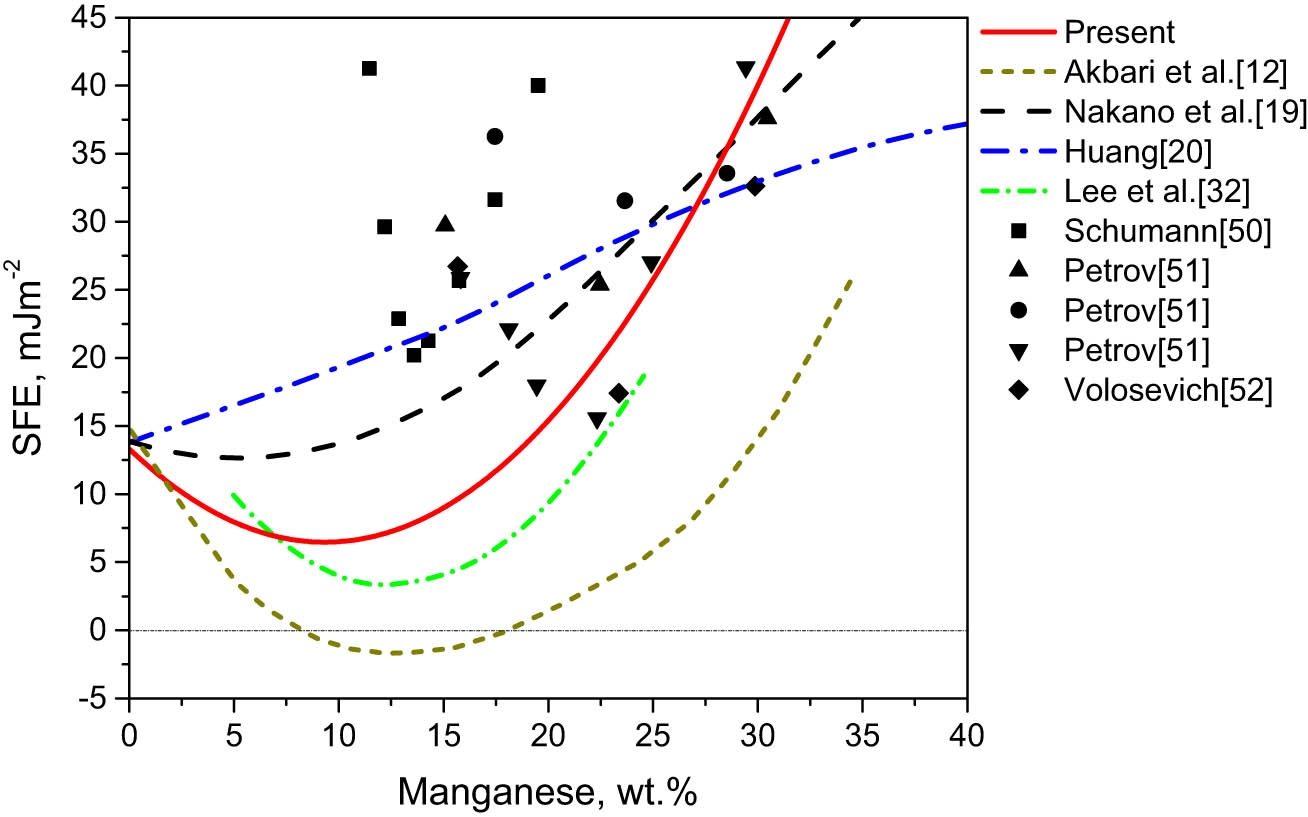
Comparison of calculated and experiment SFE in the Fe–Mn system against Mn content.
Interfacial energy is an important parameter in the thermodynamic model of SFE during phase transformation in the Fe–Mn–C system [4,12,19]. However, no exact value from theory or experiment was proposed in previous studies except inverse calculation [35,53]. Lee and Choi [32] and Allain et al. [4] assumed it to be around 5–15 mJ·m−2, Saeed-Akbari et al. [12] investigated the effect of interfacial energy on SFE within the range from 5 to 20 mJ·m−2, but it was neither composition nor temperature dependent. Nakano and Jacques [19] determined the interfacial energy to be 16 mJ·m−2 to fit the SFE to experimental data in the Fe–Mn binary system. Cotes et al. [35] calculated the interfacial energy as functions of temperature and composition based on experimental results by the reverse method. In the latest experimental and theoretical research by Pierce et al. [53], a Gibbs energy change-dependent interfacial energy was proposed for the Fe–Mn–Al–Si system with a mathematical fitting method. In the present investigation, the interfacial energy during FCC to HCP transformation was determined by the approach of Pierce et al. [53] to fit the pure ferrite SFE to 13 mJ·m−2:
where
3.2 Fe–Mn–C ternary system
All the thermodynamic parameters involved in calculating the SFE in the Fe–Mn–C system are from Table 1. The interaction energy of the interstitial element with stacking faults
where
The change of Gibbs free energy
Figure 5 shows bulk Gibbs free energy change
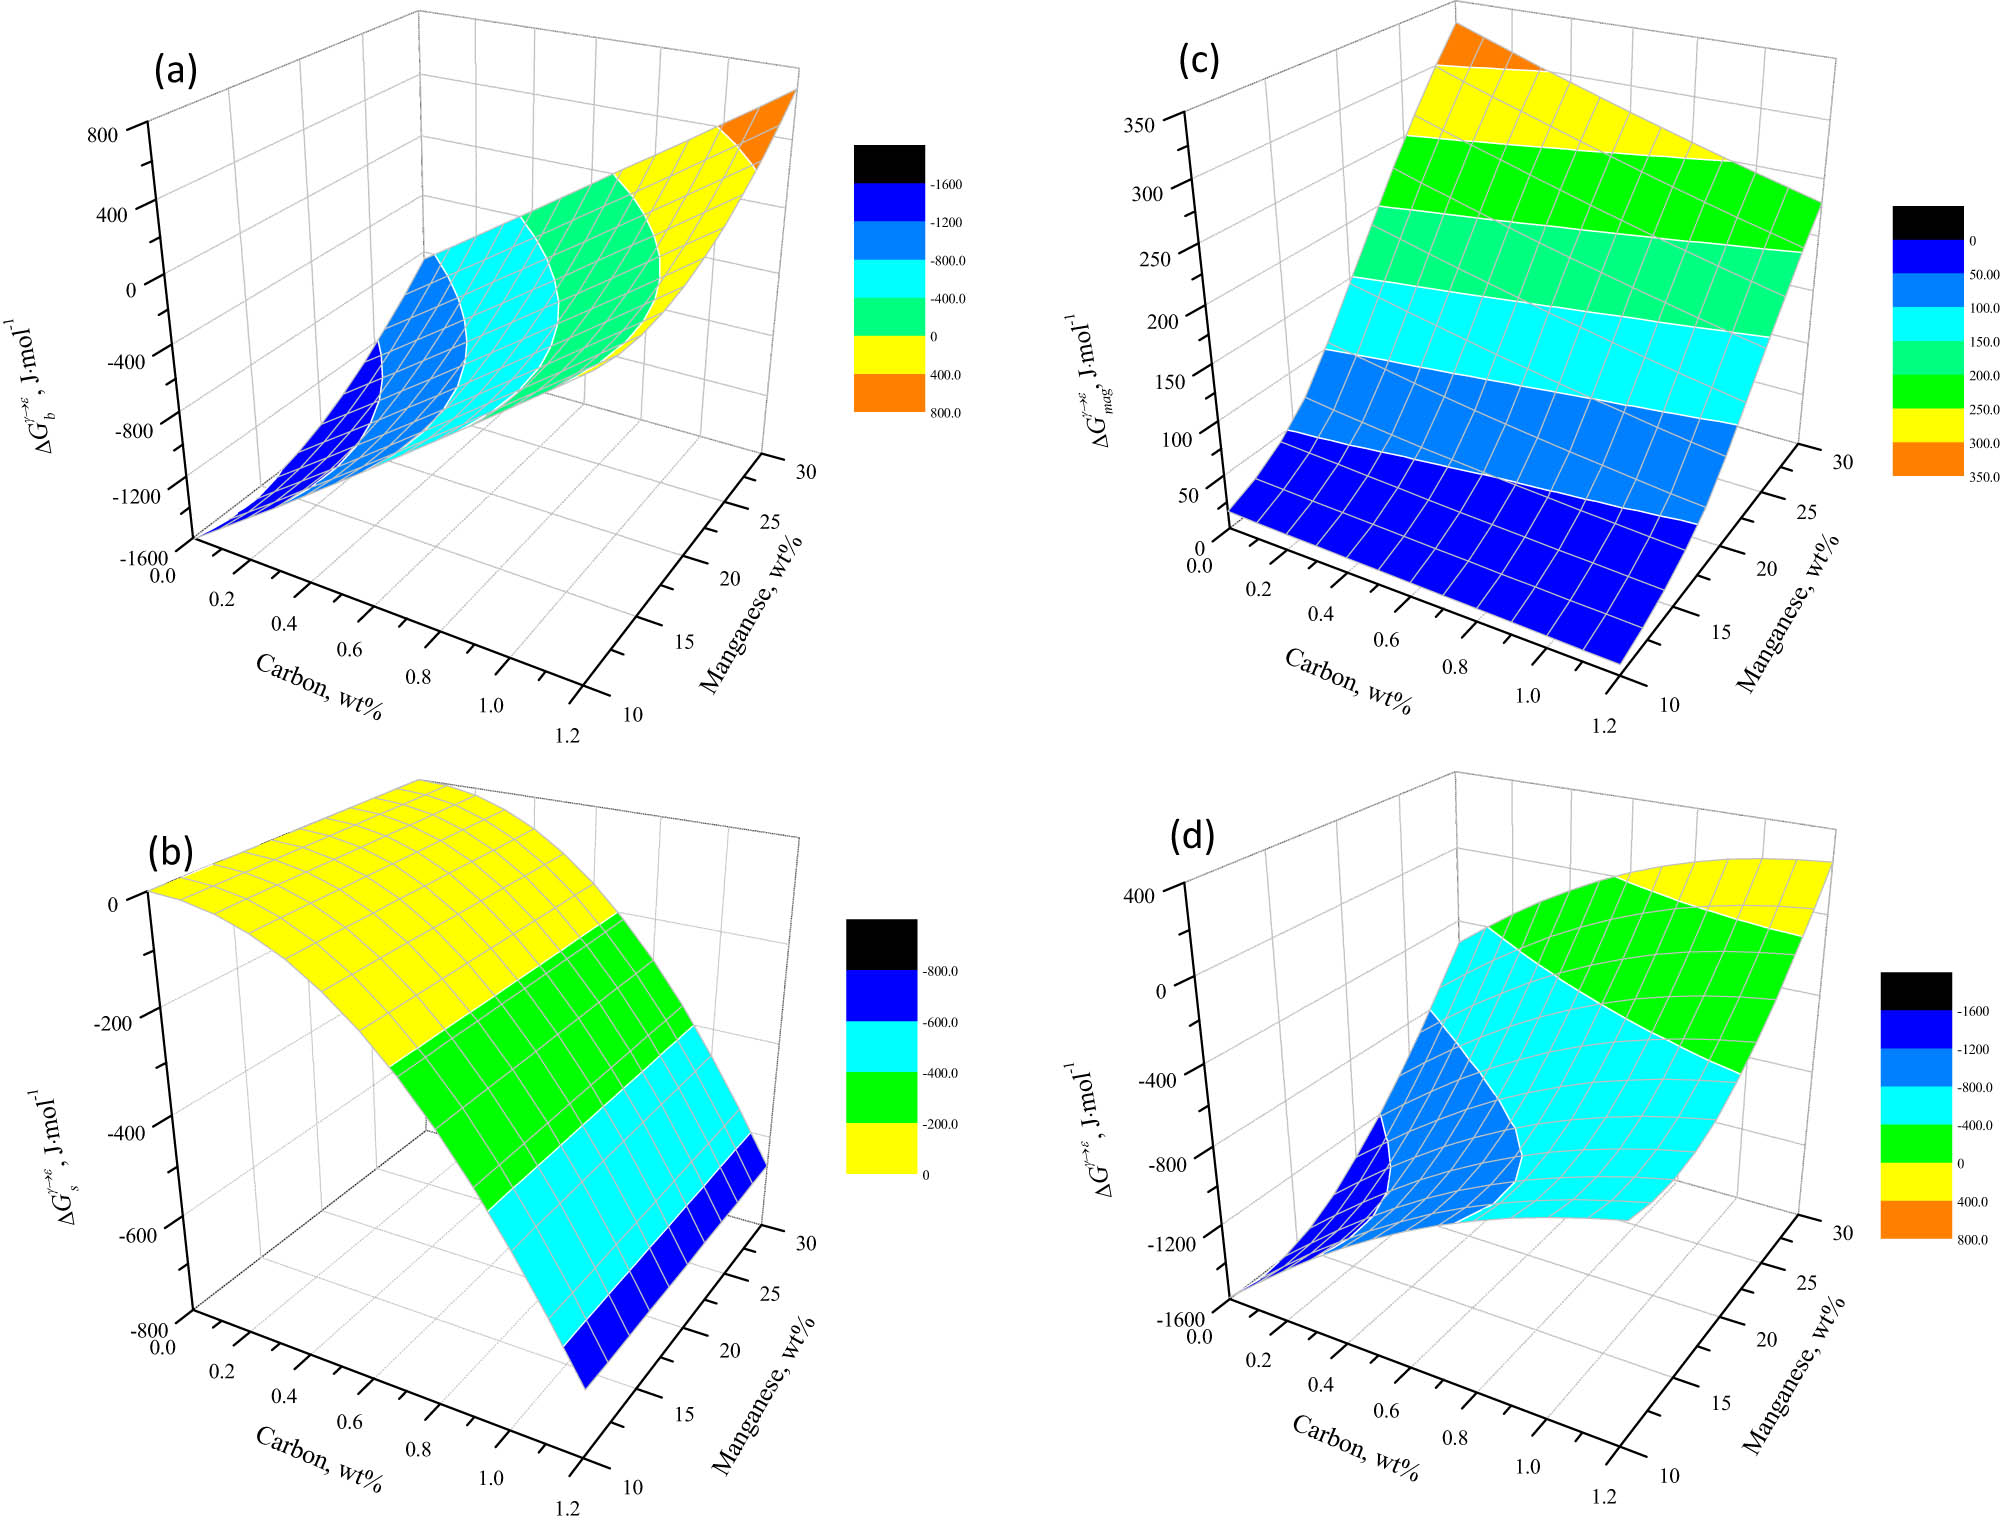
Gibbs free energy change in the Fe–Mn–C system at 298 K: (a)
Figure 6 shows the variation of carbon segregated concentration (equation (19)) in stacking fault regions and the resulting SFEseg against its concentration in the bulk. It can be seen the carbon segregated concentration increases nonlinearly with bulk concentration increasing, leading to a decrease of SFEseg in this composition range. These are similar to the variation characteristics of nitrogen concentration in Fe–18Cr–10Ni–xN stainless steels investigated by Yakubtsov et al. [18].
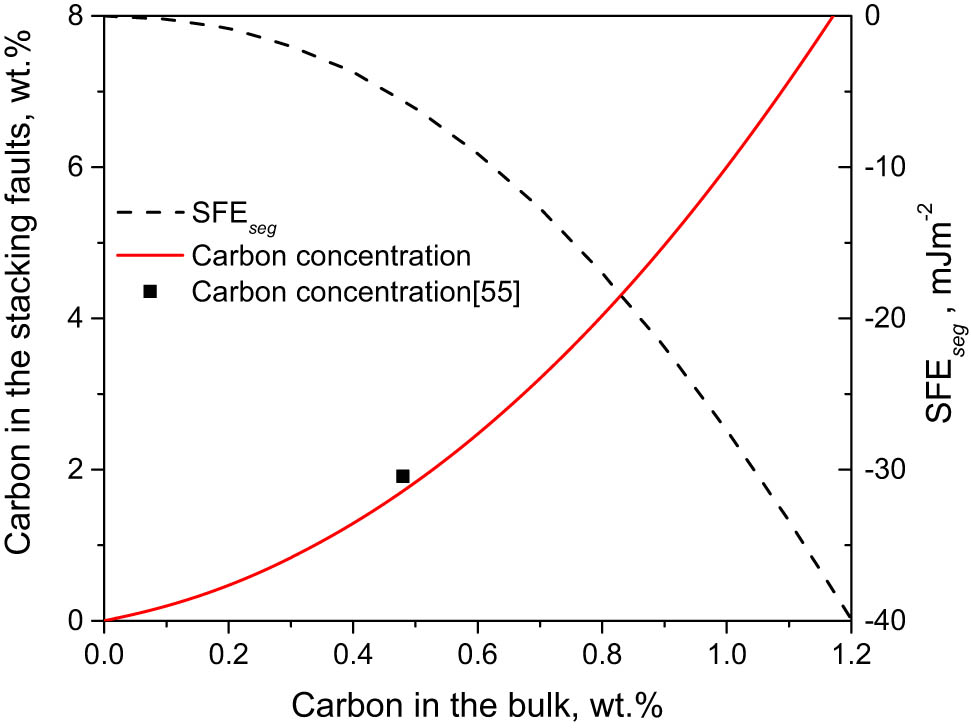
Carbon segregation against its concentration in the bulk, together with the SFE variation in the Fe–22Mn–xC system.
Figure 7 shows the calculated carbon- and manganese-dependent iso-SFE map in the Fe–Mn–C ternary system at 298 K, together with the straight lines criterion for the formation of mechanical or thermal HCP proposed by Schumann [21] and the calculation and experiment values in previous study [3,53,56]. The iso-SFE lines calculated by this model follow Schumann’s lines in large range, which is in good agreement with an activation of the mechanical HCP martensite transformation controlled by SFE values about 10–20 mJ·m−2 with carbon and manganese ranges between 0–0.9 and 10–30 wt%, respectively. Comparing Figure 7 to Figure 1, the SFE gradient against manganese concentration predicted by the present model was similar to that in Allain et al. [4] and Saeed-Akbari et al. [12] work. The SFE gradient against carbon concentration, however, was observed to be different from each other. The SFE calculated by the new sublattice model as the function of carbon concentration was just between the results of Allain et al. [4] and Saeed-Akbari et al. [12] model. It should be noticed that the SFE of a given composition in the Fe–Mn–C system predicted by Nakano et al. research was much higher than that of other approaches, including the present. The lack of consideration for the Suzuki effect should be the main explanation except for the thermodynamic parameters difference. The widely accepted SFE for the TWIP effect in high manganese steels during
![Figure 7
Calculated iso-SFE lines in the Fe–Mn–C system at 298 K. Straight lines proposed by Schumann were also plotted [21].](/document/doi/10.1515/htmp-2024-0053/asset/graphic/j_htmp-2024-0053_fig_007.jpg)
Calculated iso-SFE lines in the Fe–Mn–C system at 298 K. Straight lines proposed by Schumann were also plotted [21].
Deformation mechanism for different Fe–Mn–C steels
| Mn | C | SFE (mJ·m−2) | Mechanism | |
|---|---|---|---|---|
| 1 | 19.74 | 0.46 | 14.0 | TRIP + TWIP |
| 2 | 20.08 | 0.61 | 20.4 | TWIP |
| 3 | 22.28 | 0.42 | 19.4 | TWIP |
| 4 | 22.18 | 0.52 | 23.0 | TWIP |
| 5 | 22.07 | 0.60 | 26.3 | TWIP |
| 6 | 22.03 | 0.73 | 27.4 | TWIP |
| 7 | 23.77 | 0.60 | 33.5 | TWIP |
Saeed-Akbari et al. [12] made a comparison of the iso-SFE maps calculated on the basis of Dew-Hughes and Kaufman [13,14] and Dinsdale [15] at 300 K. Large negative SFE values were found in the range of 10–35 wt% manganese and 0–1.2 wt% carbon when SGTE data [15] were selected. However, in this work, the composition and temperature-dependent SFE calculated based on the SGTE database [15] were found to be coincident with previous modeling and experimental results. It could be inferred that both the thermodynamic calculation method, such as the regular solution model [3,5,6], subregular solution model [12], Bragg-Williams model [16,17,18], and two-sublattice model [19], and the combined parameters [13,14,15] are of influential importance for the modeling accuracy when predicting SFE.
4 SFE variation against temperature and grain size
The dependency of SFEs on temperature and grain size in the Fe–Mn–C system is of significant influence in investigating the deformation mechanism. Based on the thermodynamic model developed in Part 2, the carbon- and manganese-dependent SFE maps at different temperatures are presented in Figure 8. As temperature increases from 300 to 550 K, the SFE of the concerning system increases obviously. A similar variation of SFE in this composition range was demonstrated by Allain et al. [4] and Saeed-Akbari et al. [12]. For a given Fe–22Mn–0.6C austenite steel, the SFE increases from 26 to 70 mJ·m−2 in the above temperature increasing range. This matches the calculated result by Allain et al. [4]. In a new study by Bleck [61], the SFE for Fe–22Mn–0.6 C steel at 300 K is about 24 mJ·m−2, and it increases to 65–70 mJ·m−2 at 550 K, following the prediction by the present model. Mosecker et al. [62] investigated the different deformation mechanisms in austenite steels and revealed that SFE increases monotonically with temperature increasing, totally in line with the data in this work.
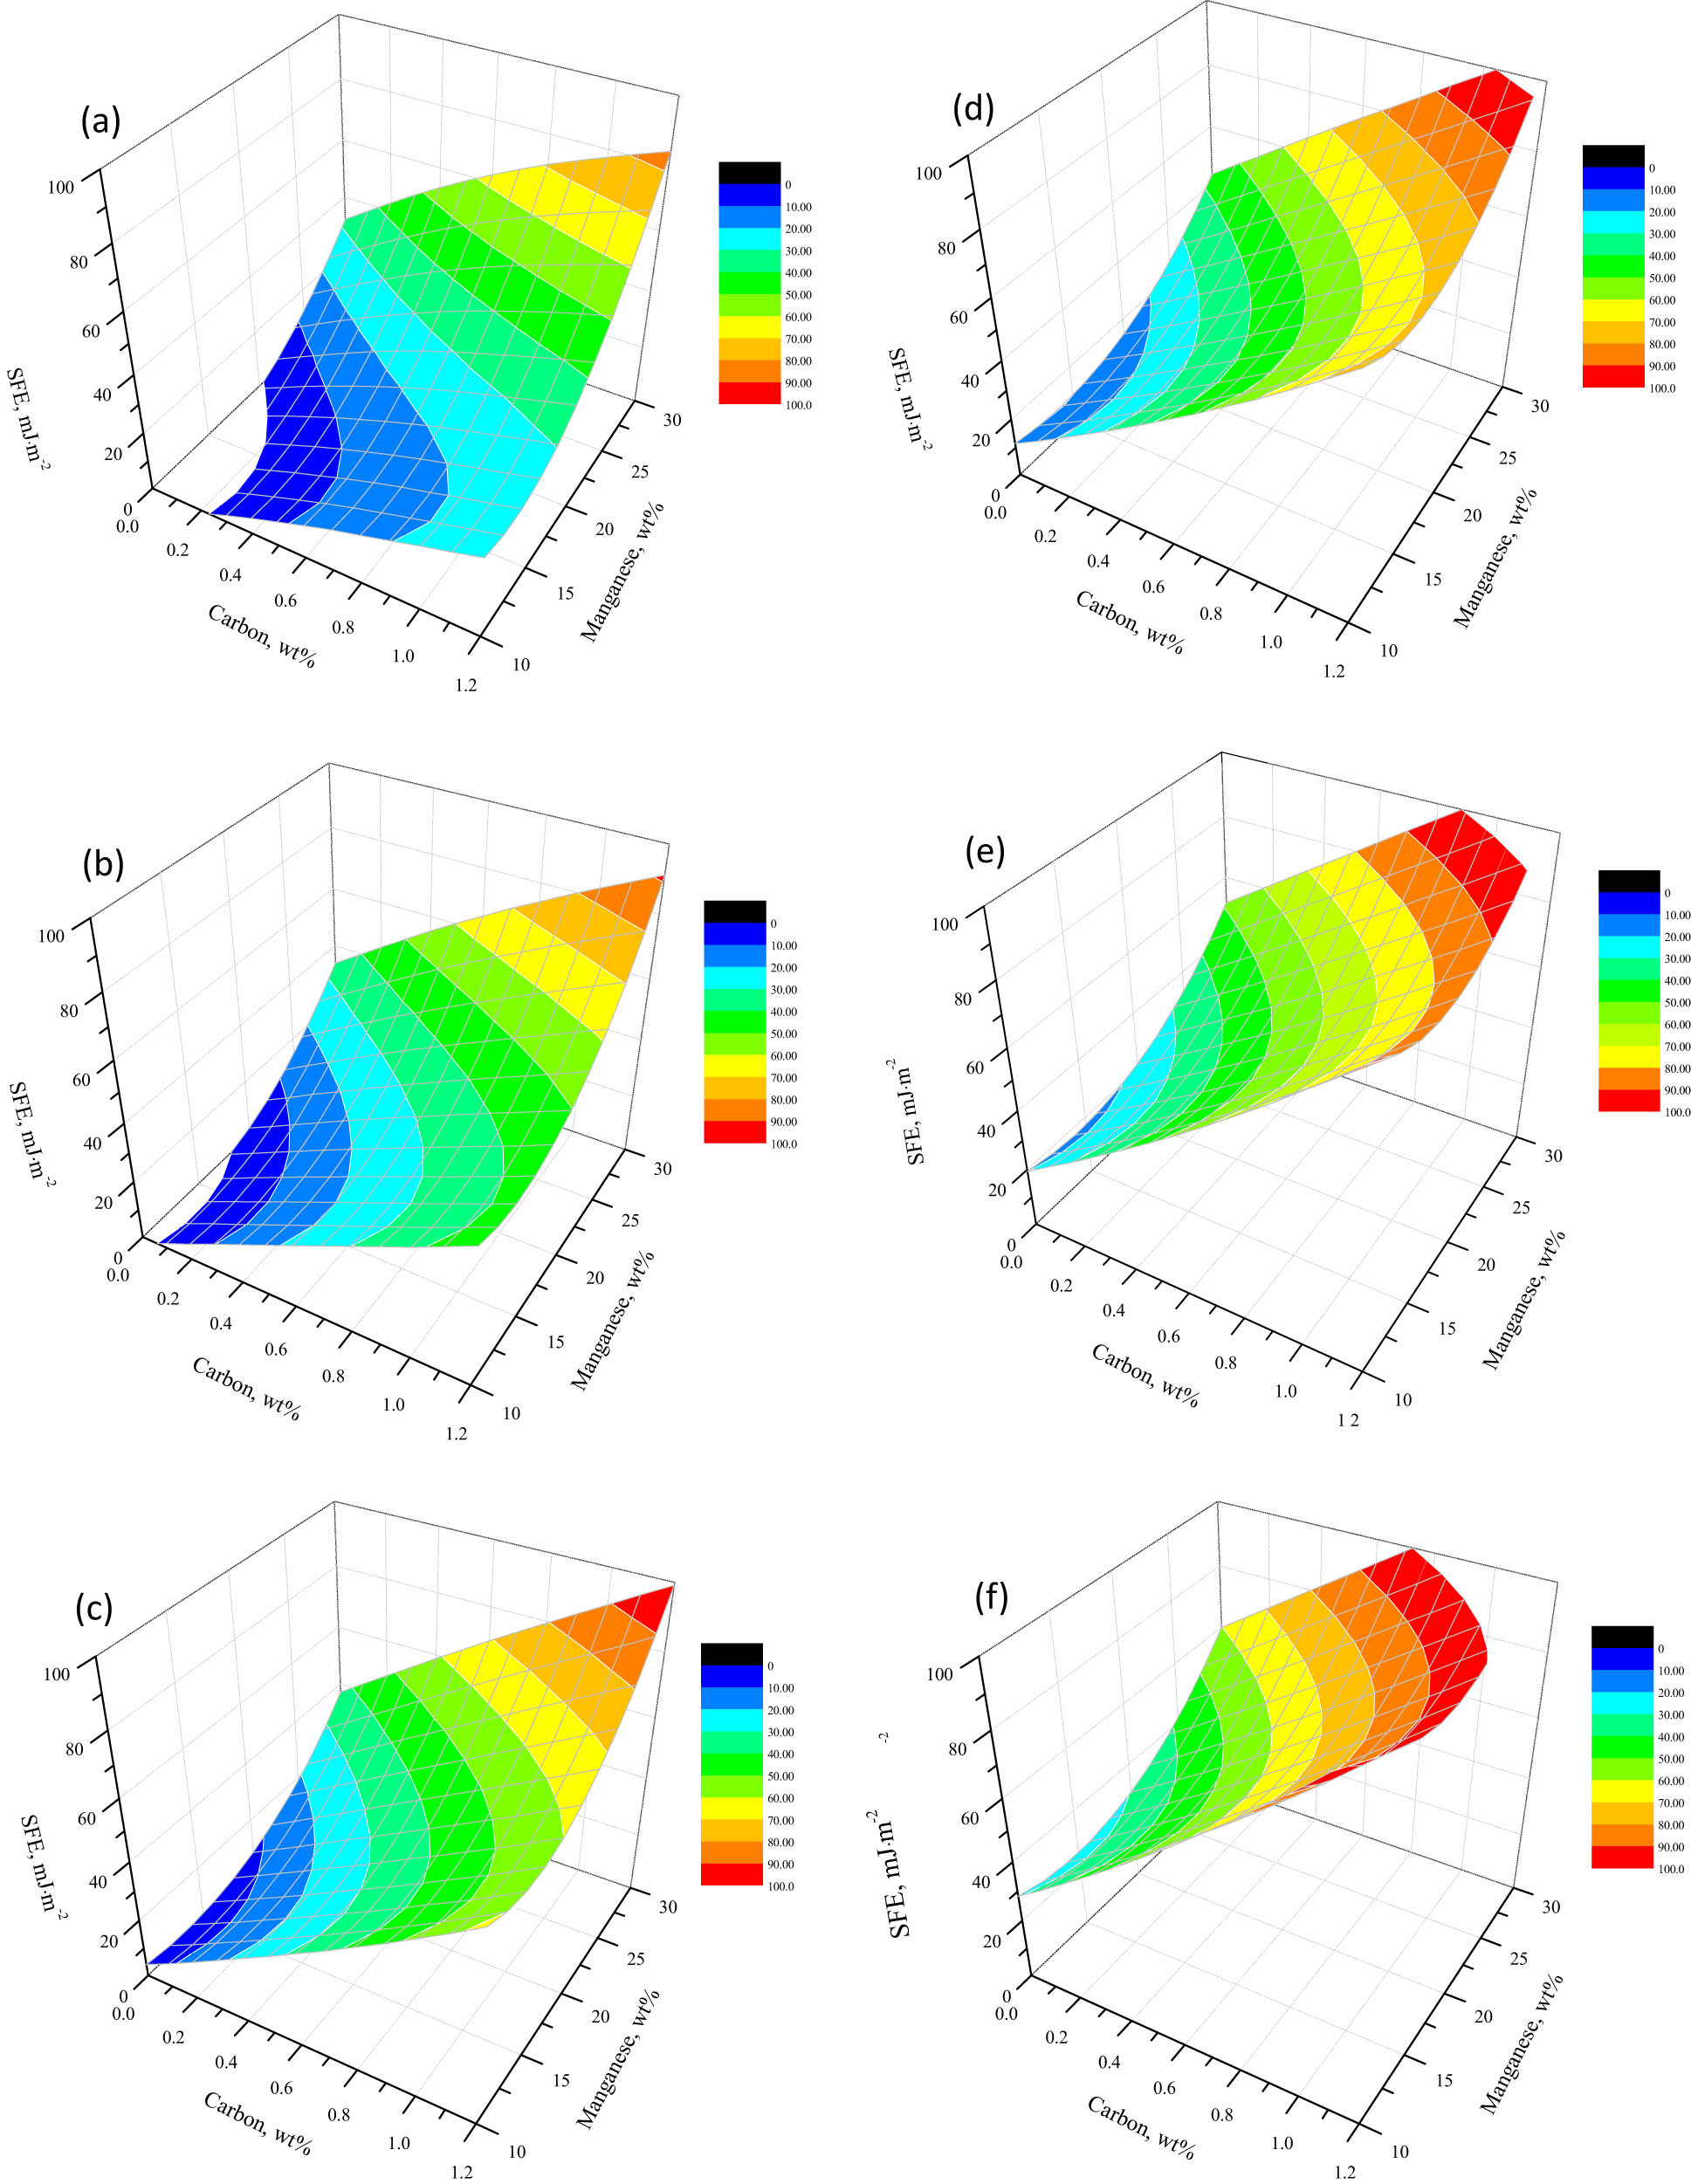
Carbon and manganese-dependent SFE maps at different temperatures: (a) 300 K, (b) 350 K, (c) 400 K, (d) 450 K, (e) 500 K, and (f) 550 K.
Figure 9 shows the carbon- and manganese-dependent SFE maps with different grain sizes. A limited effect of grain size on SFE has been observed. As the grain size in Fe–Mn–C alloys increases from 1 to 70 μm, the SFE gradually decreases. However, the SFE sensitivity to grain size obviously drops when the average diameter exceeds 70 μm. Saeed-Akbari et al. [12] illustrated that the SFE decreased monotonously with grain size increasing between 5 and 50 μm. This is largely in line with the present results. However, for the Fe–Mn–C steels with more coarse-grained structure, the negligible influence of grain size on SFE has been found. For a given Fe–22Mn–0.6C steel, the SFE is about 37 mJ·m−2 for the matrix with a grain size about 1 μm, while it is around 24 mJ·m−2 for the coarse grain sized 70 μm. Lee et al. [63] measured the SFE in Fe–18Mn–0.6C steel with grain sizes of about 10 and 3 μm, and the results were 14 and 27 mJ·m−2, respectively. Considering the experimental error, the smallest and largest difference is about 10 and 20 mJ·m−2, largely consistent with the present results. An interesting phenomenon should be noticed that the twinning behavior can refine the original austenite grain. It means the grain size decreases gradually during deformation when the TWIP effect occurs, and the SFE increases accordingly, suppressing the further activation of twins. It is found that the critical stress for twins increases as grain size decreases [64]. The variation in SFE is also an explanation for the ceases or saturation of twins in the austenite steel.

Carbon and manganese-dependent SFE maps at 300 K with different grain sizes: (a) 1 μm, (b) 10 μm, (c) 30 μm, (d) 50 μm, (e) 100 μm, and (f) 200 μm.
5 Conclusions
The SFE models of Fe–Mn and Fe–Mn–C systems were thermodynamically analyzed in this work. The validation of model prediction by previous experimental results was also carried out. The main conclusions can be drawn as follows:
A new thermodynamic model to predict the SFE of Fe–Mn and Fe–Mn–C austenite steels based on the two-sublattice method has been developed. The calculated Gibbs free energy and transformation temperature during
The interstitial atoms segregation and the resulting SFEseg variation in Fe–Mn–C steels have been revealed. The carbon segregated concentration in the stacking faults is agreed well with the measured value. The Suzuki effect induced SFEseg decreases slightly with carbon concentration increasing, while the total SFE increases in the concerning composition range. The SFE in the Fe–Mn–C ternary system was found to be significantly dependent on the bulk Gibbs free energy change, followed by that of the stacking faults regions.
The carbon- and manganese-dependent SFE maps have been plotted under different temperatures and grain sizes. For the steels with carbon and manganese range between 0–1.2 and 10–30 wt%, respectively, the SFE increases with temperature increasing. The SFE of the Fe–Mn–C system decreases as grain size increases from 1 to 70 μm. However, for the alloys with a more coarse structure, the sensitivity of SFE to grain size was not obvious.
-
Funding information: This work is financially supported by the Fundamental Research Funds for the Central Universities (No. FRF-TP-19-017A3) and the National Nature Science Foundation of China (No. 51874026).
-
Author contributions: Xinlong Yang contributed to the writing and analyzing, and Peng Lan contributed to the idea, revision and data comparison.
-
Conflict of interest: The authors state no conflict of interest.
References
[1] Frommeyer, G., U. Brüx, and P. Neμmann. Supra-ductile and high-strength manganese-TRIP/TWIP steels for high energy absorption purposes. ISIJ Interantional, Vol. 43, 2003, pp. 438–446.10.2355/isijinternational.43.438Suche in Google Scholar
[2] Frommeyer, G. and U. Bruex. Microstructures and mechanical properties of high-strength Fe–Mn–Al–C light-weight TRIPLEX steels. Steel Research International, Vol. 77, 2006, pp. 627–633.10.1002/srin.200606440Suche in Google Scholar
[3] Grässel, O., G. Frommeyer, C. Derder, and H. Hoffmamm. Phase transformations and mechanical properties of Fe–Mn–Si–Al TRIP-steels, Le. Journal de Physique IV, Vol. 7, 1997, pp. 383–388.10.1051/jp4:1997560Suche in Google Scholar
[4] Allain, S., J. P. Chateau, O. Bouaziz, S. Migot, and N. Guelton. Correlations between the calculated stacking fault energy and the plasticity mechanisms in Fe–Mn–C alloys. Materials Science and Engineering: A, Vol. 387, 2004, pp. 158–162.10.1016/j.msea.2004.01.059Suche in Google Scholar
[5] Dumay, A., J. P. Chateau, S. Allain, S. Migot, and O. Bouaziz. Influence of addition elements on the stacking-fault energy and mechanical properties of an austenitic Fe–Mn–C steel. Materials Science and Engineering: A, Vol. 483, 2008, pp. 184–187.10.1016/j.msea.2006.12.170Suche in Google Scholar
[6] Gutierrez-Urrutia, I. and D. Raabe. Microbanding mechanism in a Fe–Mn–C high-Mn twinning induced plasticity steel. Scripta Materialia, Vol. 69, 2013, pp. 53–56.10.1016/j.scriptamat.2013.03.010Suche in Google Scholar
[7] Lee, S. and B. C. De Cooman. Tensile behavior of intercritically annealed 10 pct Mn Multi-phase steel. Metallurgical and Materials Transactions A, Vol. 45, 2014, pp. 709–716.10.1007/s11661-013-2047-6Suche in Google Scholar
[8] Lan, P., L. Song, C. Du, and J. Zhang. Analysis of solidification microstructure and hot ductility of Fe–22Mn–0.7C TWIP steel. Materials Science and Technology, Vol. 30, 2014, pp. 1297–1304.10.1179/1743284714Y.0000000560Suche in Google Scholar
[9] Lan, P. and J. Q. Zhang. Thermophysical properties and solidification defects of Fe–22Mn–0.7C TWIP steel. Steel Research Internationl, Vol. 87, 2015, pp. 250–261. 10.1002/srin.201500022.Suche in Google Scholar
[10] Wang, Y., P. Lan, Y. Li, and J. Zhang. Effect of alloying elements on mechanical behavior of Fe–Mn–C TWIP steel. Journal of Material Engineering, Vol. 43, 2015, pp. 30–38.Suche in Google Scholar
[11] Lan, P., L. Song, C. Du, Y. Li, and J. Zhang. Research progress on stacking fault energy in high manganese TWIP steel. Journal of Iron and Steel Research, Vol. 27, 2015, pp. 1–6.Suche in Google Scholar
[12] Saeed-Akbari, A., J. Imlau, U. Prahl, and W. Bleck. Derivation and variation in composition-dependent stacking fault energy maps based on subregular solution model in high-manganese steels. Metallurgical and Materials Transactions A, Vol. 40, 2009, pp. 3076–3090.10.1007/s11661-009-0050-8Suche in Google Scholar
[13] Dew-Hughes, D. and L. Kaufman. Ternary phase diagrams of the manganese-titaniμm-iron and the alμminμm-titaniμm-iron systems: A comparison of computer calculations with experiment. Calphad, Vol. 3, 1979, pp. 175–203.10.1016/0364-5916(79)90003-8Suche in Google Scholar
[14] Breedis, J. F. and L. Kaufman. The formation of Hcp and Bcc phases in austenitic iron alloys. Metallurgical Transactions, Vol. 2, 1971, pp. 2359–2371.10.1007/BF02814874Suche in Google Scholar
[15] Dinsdale, A. T. SGTE data for pure elements. Calphad, Vol. 15, 1991, pp. 317–425.10.1016/0364-5916(91)90030-NSuche in Google Scholar
[16] Petrov, Y. N. Effect of carbon and nitrogen on the stacking fault energy of high-alloyed iron-based austenite. Zeitschrift für Metallkunde, Vol. 94, 2003, pp. 1012–1016.10.3139/146.031012Suche in Google Scholar
[17] Petrov, Y. U. N. and I. Yakubtsov. Thermodynamic calculation of stacking fault energy for multicomponent alloys With F. C. C. lattice based on iron. The Physics of Metals and Metallography, Vol. 62, 1986, pp. 34–38.Suche in Google Scholar
[18] Yakubtsov, I. A., A. Ariapour, and D. D. Perovic. Effect of nitrogen on stacking fault energy of fcc iron-based alloys. Acta Materialia, Vol. 47, 1999, pp. 1271–1279.10.1016/S1359-6454(98)00419-4Suche in Google Scholar
[19] Nakano, J. and P. J. Jacques. Effects of the thermodynamic parameters of the hcp phase on the stacking fault energy calculations in the Fe–Mn and Fe–Mn–C systems. Calphad, Vol. 34, 2010, pp. 167–175.10.1016/j.calphad.2010.02.001Suche in Google Scholar
[20] Huang, W. An assessment of the Fe–Mn system. Calphad, Vol. 13, 1989, pp. 243–252.10.1016/0364-5916(89)90004-7Suche in Google Scholar
[21] Schμmann, V. H. Martensitische μmwandlung in austenitischen mangan-kohlenstoff-stählen. Neue Hütte, Vol. 17, 1972, pp. 605–609.Suche in Google Scholar
[22] Tian, X., H. Li, and Y. Zhang. Effect of Al content on stacking fault energy in austenitic Fe–Mn–Al–C alloys. Journal of Materials Science, Vol. 43, 2008, pp. 6214–6222.10.1007/s10853-008-2919-0Suche in Google Scholar
[23] Tian, X. and Y. Zhang. Effect of Si content on the stacking fault energy in γ-Fe–Mn–Si–C alloys: Part I. X-ray diffraction line profile analysis. Materials Science and Engineering: A, Vol. 516, 2009, pp. 73–77.10.1016/j.msea.2009.02.031Suche in Google Scholar
[24] Oh, B. W., S. J. Cho, Y. G. Kim, Y. P. Kim, W. S. Kim, and S. H. Hong. Effect of alμminiμm on deformation mode and mechanical properties of austenitic Fe–Mn–Cr-Al-C alloys. Materials Science and Engineering: A, Vol. 197, 1995, pp. 147–156.10.1016/0921-5093(94)09751-8Suche in Google Scholar
[25] Kim, J. and B. C. De Cooman. On the stacking fault energy of Fe–18 Pct Mn–0.6 Pct C–1.5 Pct Al twinning-induced plasticity steel. Metallurgical and Materials Transactions A, Vol. 42, 2011, pp. 932–936.10.1007/s11661-011-0610-6Suche in Google Scholar
[26] Idrissi, H., K. Renard, L. Ryelandt, D. Schryvers, and P. J. Jacques. On the mechanism of twin formation in Fe–Mn–C TWIP steels. Acta Materialia, Vol. 58, 2010, pp. 2464–2476.10.1016/j.actamat.2009.12.032Suche in Google Scholar
[27] He, G., Y. Rong, and Z. Xu. Self-energy and interaction energy of stacking fault in fcc metals calculated by embedded-atom method. Science in China Series E, Vol. 43, 2000, pp. 146–153.10.1007/BF02916884Suche in Google Scholar
[28] Hirth, J. P. Thermodynamics of stacking faults. Metallurgical Transactions, Vol. 1, 1970, pp. 2367–2374.10.1007/BF03038365Suche in Google Scholar
[29] Ferreira, P. J. and P. Müllner. A thermodynamic model for the stacking-fault energy. Acta Materialia, Vol. 46, 1998, pp. 4479–4484.10.1016/S1359-6454(98)00155-4Suche in Google Scholar
[30] Olson, G. B. and M. Cohen. A general mechanism of martensitic nucleation: Part I. General concepts and the FCC → HCP transformation. Metallurgical Transactions A, Vol. 7, 1976, pp. 1897–1904.10.1007/BF02654987Suche in Google Scholar
[31] Adler, P. H., G. B. Olson, and W. S. Owen. Strain hardening of Hadfield manganese steel. Metallurgical and Materials Transactions A, Vol. 17, 1986, pp. 1725–1737.10.1007/BF02817271Suche in Google Scholar
[32] Lee, Y. K. and C. Choi. Driving force for γ → ε martensitic transformation and stacking fault energy of γ in Fe–Mn binary system. Metallurgical and Materials Transactions A, Vol. 31, 2000, pp. 355–360.10.1007/s11661-000-0271-3Suche in Google Scholar
[33] Babu, S. S., E. D. Specht, S. A. David, E. Karapetrova, P. Zschack, M. Peet, et al. In-situ observations of lattice parameter fluctuations in austenite and transformation to bainite. Metallurgical and Materials Transactions A, Vol. 36, 2005, pp. 3281–3289.10.1007/s11661-005-0002-xSuche in Google Scholar
[34] Garcı́a de Andrés, C., F. G. Caballero, C. Capdevila, and H. Bhadeshia. Modelling of kinetics and dilatometric behavior of non-isothermal pearlite-to-austenite transformation in an eutectoid steel. Scripta Materialia, Vol. 39, 1998, pp. 791–796.10.1016/S1359-6462(98)00146-8Suche in Google Scholar
[35] Cotes, S., A. F. Guillermet, and M. Sade. Fcc/Hcp martensitic transformation in the Fe–Mn system: Part II. Driving force and thermodynamics of the nucleation process. Metallurgical and Materials Transactions A, Vol. 35, 2004, pp. 83–91.10.1007/s11661-004-0111-ySuche in Google Scholar
[36] Inden, G. The role of magnetism in the calculation of phase diagrams. Physica B + C, Vol. 103, 1981, pp. 82–100.10.1016/0378-4363(81)91004-4Suche in Google Scholar
[37] Hillert, M. and M. Jarl. A model for alloying in ferromagnetic metals. Calphad, Vol. 2, 1987, pp. 227–238.10.1016/0364-5916(78)90011-1Suche in Google Scholar
[38] Palμmbo, M. Thermodynamics of martensitic transformations in the framework of the CALPHAD approach. Calphad, Vol. 32, 2008, pp. 693–708.10.1016/j.calphad.2008.08.006Suche in Google Scholar
[39] Ishida, K. Direct estimation of stacking fault energy by thermodynamic analysis. Physica Status Solidi, Vol. 36, 1976, pp. 717–728.10.1002/pssa.2210360233Suche in Google Scholar
[40] Ericsson, T. On the Suzuki effect and spinodal decomposition. Acta Metallurgica, Vol. 14, 1966, pp. 1073–1084.10.1016/0001-6160(66)90195-7Suche in Google Scholar
[41] Nakatsu, H., S. Takaki, and T. Tokunaga. Effect of austenite grain size on martensitic transformation in Fe–15mass% Mn alloy. Journal of the Japan Institute of Metals (Japan), Vol. 34, 1993, pp. 858–863.10.2320/jinstmet1952.57.8_858Suche in Google Scholar
[42] Huang, W. A thermodynamic assessment of the Fe–Mn–C system. Metallurgical Transactions A, Vol. 21, 1990, pp. 2115–2123.10.1007/BF02647870Suche in Google Scholar
[43] Djurovic, D., B. Hallstedt, J. von Appen, and R. Dronskowski. Thermodynamic assessment of the Fe–Mn–C system. Calphad, Vol. 35, 2011, pp. 479–491.10.1016/j.calphad.2011.08.002Suche in Google Scholar
[44] Witusiewicz, V. T., F. Sommer, and E. J. Mittemeijer. Reevaluation of the Fe–Mn phase diagram. Journal of Phase Equilibria and Diffusion, Vol. 25, No. 4, 2004, pp. 346–354.10.1361/15477030420115Suche in Google Scholar
[45] Gustafson, P. A thermodynamic evaluation of the Fe–C system. Scandinavian Journal of Metallurgy, Vol. 14, 1985, pp. 259–267.Suche in Google Scholar
[46] Skrotzki, B. and U. Wiech. Influence of austenite strength on martensite start temperature M(S). Steel Research, Vol. 64, 1993, pp. 509–512.10.1002/srin.199301562Suche in Google Scholar
[47] Cotes, S., M. Sade, and A. F. Guillermet. Fcc/Hcp martensitic transformation in the Fe–Mn system: Experimental study and thermodynamic analysis of phase stability. Metallurgical and Materials Transactions A, Vol. 26, 1995, pp. 1957–1969.10.1007/BF02670667Suche in Google Scholar
[48] Troiano, A. R. and F. T. McGuire. A study of the iron-rich iron-manganese alloys. Transactions of American Society for Metals, Vol. 31, 1943, pp. 340–364.Suche in Google Scholar
[49] Gulyaev, A. P., T. F. Volynova, and I. Y. Georgieva. Phase transformations in high-purity Fe–Mn alloys. Metal Science and Heat Treatment, Vol. 20, 1978, pp. 179–182.10.1007/BF00777087Suche in Google Scholar
[50] Schμmann, H. Einfluß der Stapelfehlerenergie auf den Kristallographischen Mmgitterungsmechanismus der Gamma/Alpha-Mmwandlung in Hochlegierten Stählen. Kristall und Technik, Vol. 9, 1974, pp. 1141–1152.10.1002/crat.19740091009Suche in Google Scholar
[51] Petrov, Y. U.N., T. F. Volynova, and I. Yakubtsov. Cold shortness of iron--manganese alloys with different stacking fault energies. Physics of Metals and Metallography, Vol. 68, 1989, pp. 169–172.Suche in Google Scholar
[52] Volosevich, P. U., V. N. Gridnev, and Y. U.N. Petrov. Effect of Mn on the stacking-fault energy of Fe–Mn alloys. Fizika Metallov i Metallovedenie, Vol. 42, 1976, pp. 372–376.Suche in Google Scholar
[53] Pierce, D. T., J. A. Jiménez, J. Bentley, D. Raabe, C. Oskay, and J. E. Wittig. The influence of manganese content on the stacking fault and austenite/ε-martensite interfacial energies in Fe–Mn–(Al-Si) steels investigated by experiment and theory. Acta Materialia, Vol. 68, 2014, pp. 238–252.10.1016/j.actamat.2014.01.001Suche in Google Scholar
[54] Gavrilyuk, V. G. and V. Duz. Interaction of carbon and nitrogen atoms with dislocations in austenite. Fizika Metallov i Metallovedenie, Vol. 64, 1987, pp. 1132–1135.Suche in Google Scholar
[55] Petrov, Y. N. On the carbon distribution at structural imperfections in manganese austenite. Scripta Metallurgica et Materialia, Vol. 29, 1993, pp. 1471–1476.10.1016/0956-716X(93)90339-TSuche in Google Scholar
[56] Koyama, M., T. Sawaguchi, T. Lee, C. S. Lee, and K. Tsuzaki. Work hardening associated with ɛ-martensitic transformation, deformation twinning and dynamic strain aging in Fe–17Mn–0.6 C and Fe–17Mn–0.8 C TWIP steels. Materials Science and Engineering: A, Vol. 528, 2011, pp. 7310–7316.10.1016/j.msea.2011.06.011Suche in Google Scholar
[57] Rémy, L., A. Pineau, and B. Thomas. Temperature dependence of stacking fault energy in close-packed metals and alloys. Materials Science and Engineering, Vol. 36, 1978, pp. 47–63.10.1016/0025-5416(78)90194-5Suche in Google Scholar
[58] Lan, P. and J. Zhang. Tensile property and microstructure of Fe–22Mn–0.5 C TWIP steel. Materials Science and Engineering: A, Vol. 707, 2017, pp. 373–382.10.1016/j.msea.2017.09.061Suche in Google Scholar
[59] Lan, P. and J. Zhang. Serrated flow and dynamic strain aging in Fe–Mn–C TWIP steel. Metallurgical and Materials Transactions A, Vol. 49, 2018, pp. 147–161.10.1007/s11661-017-4421-2Suche in Google Scholar
[60] Lan, P., H. Tang, and J. Zhang. Hot ductility of high alloy Fe–Mn–C austenite TWIP steel. Materials Science and Engineering: A, Vol. 660, 2016, pp. 127–138.10.1016/j.msea.2016.02.086Suche in Google Scholar
[61] Bleck, W. New insights into the properties of high-manganese steel. International Journal of Minerals, Metallurgy and Materials, Vol. 28, No. 5, 2021, pp. 782–796.10.1007/s12613-020-2166-1Suche in Google Scholar
[62] Mosecker, L., D. T. Pierce, A. Schwedt, M. Beighmohamadi, J. Mayer, W. Bleck, et al. Temperature effect on deformation mechanisms and mechanical properties of a high manganese C + N alloyed austenitic stainless steel. Materials Science and Engineering: A, Vol. 642, 2015, pp. 71–83.10.1016/j.msea.2015.06.047Suche in Google Scholar
[63] Lee, S. J., K. Ushioda, and H. Fujii. Evaluation of stacking-fault energy in Fe–Mn based twinning-induced plasticity steels after friction stir welding. Materials Characterization, Vol. 147, 2019, pp. 379–383.10.1016/j.matchar.2018.11.024Suche in Google Scholar
[64] Gutierrez-Urrutia I., S. Zaefferer, and D. Raabe The effect of grain size and grain orientation on deformation twinning in a Fe–22 wt% Mn–0.6 wt.% C TWIP steel. Materials Science and Engineering: A, Vol. 527, No. 15, 2010, pp. 3552–3560.10.1016/j.msea.2010.02.041Suche in Google Scholar
© 2024 the author(s), published by De Gruyter
This work is licensed under the Creative Commons Attribution 4.0 International License.
Artikel in diesem Heft
- Research Articles
- De-chlorination of poly(vinyl) chloride using Fe2O3 and the improvement of chlorine fixing ratio in FeCl2 by SiO2 addition
- Reductive behavior of nickel and iron metallization in magnesian siliceous nickel laterite ores under the action of sulfur-bearing natural gas
- Study on properties of CaF2–CaO–Al2O3–MgO–B2O3 electroslag remelting slag for rack plate steel
- The origin of {113}<361> grains and their impact on secondary recrystallization in producing ultra-thin grain-oriented electrical steel
- Channel parameter optimization of one-strand slab induction heating tundish with double channels
- Effect of rare-earth Ce on the texture of non-oriented silicon steels
- Performance optimization of PERC solar cells based on laser ablation forming local contact on the rear
- Effect of ladle-lining materials on inclusion evolution in Al-killed steel during LF refining
- Analysis of metallurgical defects in enamel steel castings
- Effect of cooling rate and Nb synergistic strengthening on microstructure and mechanical properties of high-strength rebar
- Effect of grain size on fatigue strength of 304 stainless steel
- Analysis and control of surface cracks in a B-bearing continuous casting blooms
- Application of laser surface detection technology in blast furnace gas flow control and optimization
- Preparation of MoO3 powder by hydrothermal method
- The comparative study of Ti-bearing oxides introduced by different methods
- Application of MgO/ZrO2 coating on 309 stainless steel to increase resistance to corrosion at high temperatures and oxidation by an electrochemical method
- Effect of applying a full oxygen blast furnace on carbon emissions based on a carbon metabolism calculation model
- Characterization of low-damage cutting of alfalfa stalks by self-sharpening cutters made of gradient materials
- Thermo-mechanical effects and microstructural evolution-coupled numerical simulation on the hot forming processes of superalloy turbine disk
- Endpoint prediction of BOF steelmaking based on state-of-the-art machine learning and deep learning algorithms
- Effect of calcium treatment on inclusions in 38CrMoAl high aluminum steel
- Effect of isothermal transformation temperature on the microstructure, precipitation behavior, and mechanical properties of anti-seismic rebar
- Evolution of residual stress and microstructure of 2205 duplex stainless steel welded joints during different post-weld heat treatment
- Effect of heating process on the corrosion resistance of zinc iron alloy coatings
- BOF steelmaking endpoint carbon content and temperature soft sensor model based on supervised weighted local structure preserving projection
- Innovative approaches to enhancing crack repair: Performance optimization of biopolymer-infused CXT
- Structural and electrochromic property control of WO3 films through fine-tuning of film-forming parameters
- Influence of non-linear thermal radiation on the dynamics of homogeneous and heterogeneous chemical reactions between the cone and the disk
- Thermodynamic modeling of stacking fault energy in Fe–Mn–C austenitic steels
- Research on the influence of cemented carbide micro-textured structure on tribological properties
- Performance evaluation of fly ash-lime-gypsum-quarry dust (FALGQ) bricks for sustainable construction
- First-principles study on the interfacial interactions between h-BN and Si3N4
- Analysis of carbon emission reduction capacity of hydrogen-rich oxygen blast furnace based on renewable energy hydrogen production
- Just-in-time updated DBN BOF steel-making soft sensor model based on dense connectivity of key features
- Effect of tempering temperature on the microstructure and mechanical properties of Q125 shale gas casing steel
- Review Articles
- A review of emerging trends in Laves phase research: Bibliometric analysis and visualization
- Effect of bottom stirring on bath mixing and transfer behavior during scrap melting in BOF steelmaking: A review
- High-temperature antioxidant silicate coating of low-density Nb–Ti–Al alloy: A review
- Communications
- Experimental investigation on the deterioration of the physical and mechanical properties of autoclaved aerated concrete at elevated temperatures
- Damage evaluation of the austenitic heat-resistance steel subjected to creep by using Kikuchi pattern parameters
- Topical Issue on Focus of Hot Deformation of Metaland High Entropy Alloys - Part II
- Synthesis of aluminium (Al) and alumina (Al2O3)-based graded material by gravity casting
- Experimental investigation into machining performance of magnesium alloy AZ91D under dry, minimum quantity lubrication, and nano minimum quantity lubrication environments
- Numerical simulation of temperature distribution and residual stress in TIG welding of stainless-steel single-pass flange butt joint using finite element analysis
- Special Issue on A Deep Dive into Machining and Welding Advancements - Part I
- Electro-thermal performance evaluation of a prismatic battery pack for an electric vehicle
- Experimental analysis and optimization of machining parameters for Nitinol alloy: A Taguchi and multi-attribute decision-making approach
- Experimental and numerical analysis of temperature distributions in SA 387 pressure vessel steel during submerged arc welding
- Optimization of process parameters in plasma arc cutting of commercial-grade aluminium plate
- Multi-response optimization of friction stir welding using fuzzy-grey system
- Mechanical and micro-structural studies of pulsed and constant current TIG weldments of super duplex stainless steels and Austenitic stainless steels
- Stretch-forming characteristics of austenitic material stainless steel 304 at hot working temperatures
- Work hardening and X-ray diffraction studies on ASS 304 at high temperatures
- Study of phase equilibrium of refractory high-entropy alloys using the atomic size difference concept for turbine blade applications
- A novel intelligent tool wear monitoring system in ball end milling of Ti6Al4V alloy using artificial neural network
- A hybrid approach for the machinability analysis of Incoloy 825 using the entropy-MOORA method
- Special Issue on Recent Developments in 3D Printed Carbon Materials - Part II
- Innovations for sustainable chemical manufacturing and waste minimization through green production practices
- Topical Issue on Conference on Materials, Manufacturing Processes and Devices - Part I
- Characterization of Co–Ni–TiO2 coatings prepared by combined sol-enhanced and pulse current electrodeposition methods
- Hot deformation behaviors and microstructure characteristics of Cr–Mo–Ni–V steel with a banded structure
- Effects of normalizing and tempering temperature on the bainite microstructure and properties of low alloy fire-resistant steel bars
- Dynamic evolution of residual stress upon manufacturing Al-based diesel engine diaphragm
- Study on impact resistance of steel fiber reinforced concrete after exposure to fire
- Bonding behaviour between steel fibre and concrete matrix after experiencing elevated temperature at various loading rates
- Diffusion law of sulfate ions in coral aggregate seawater concrete in the marine environment
- Microstructure evolution and grain refinement mechanism of 316LN steel
- Investigation of the interface and physical properties of a Kovar alloy/Cu composite wire processed by multi-pass drawing
- The investigation of peritectic solidification of high nitrogen stainless steels by in-situ observation
- Microstructure and mechanical properties of submerged arc welded medium-thickness Q690qE high-strength steel plate joints
- Experimental study on the effect of the riveting process on the bending resistance of beams composed of galvanized Q235 steel
- Density functional theory study of Mg–Ho intermetallic phases
- Investigation of electrical properties and PTCR effect in double-donor doping BaTiO3 lead-free ceramics
- Special Issue on Thermal Management and Heat Transfer
- On the thermal performance of a three-dimensional cross-ternary hybrid nanofluid over a wedge using a Bayesian regularization neural network approach
- Time dependent model to analyze the magnetic refrigeration performance of gadolinium near the room temperature
- Heat transfer characteristics in a non-Newtonian (Williamson) hybrid nanofluid with Hall and convective boundary effects
- Computational role of homogeneous–heterogeneous chemical reactions and a mixed convective ternary hybrid nanofluid in a vertical porous microchannel
- Thermal conductivity evaluation of magnetized non-Newtonian nanofluid and dusty particles with thermal radiation