Modeling of large-scale disk perturbation eclipses of UX Ori stars with the puffed-up inner disks
-
Sergey Shulman
 und
Vladimir Grinin
und
Vladimir Grinin

Abstract
Eclipses of UX Ori stars by compact gas–dust clouds and large-scale circumstellar disk perturbations are modeled. A flared disk and a disk with a puffing-up in the dust sublimation zone are considered. The disk puffing-up explains several observed features of eclipses. The linear polarization degree can remain unchanged during the eclipse. There might be no star reddening in the blue and ultraviolet spectral regions. Strong changes (up to
1 Introduction
UX Ori-type stars are a subclass of Herbig Ae/Be stars with deep sporadic brightness minima. These are young stars with spectral types from A to F. They are surrounded by protoplanetary disks slightly inclined to the line of sight. The brightness minima last from several days to several months. The usual depth of the fadings is 2–4
Numerous observations demonstrating such properties of brightness fadings led to important conclusions about the UX Ori stars. Grinin (1988) proposed a model of a star eclipsed by a compact gas–dust cloud. The model assumes that the cloud absorbs the radiation from the star and does not affect the radiation scattered by the circumstellar disk. Such a simple model explains the main features of eclipses. When the direct light from the star is fully absorbed in the cloud, we obtain the maximum eclipse depth. The increase in the contribution of scattered radiation also explains the nonlinear increase in polarization and color changes.
Usually, the compact gas–dust cloud eclipses were simulated for the model with a flared disk. For example, a detailed study of the eclipse properties is given by Natta and Whitney (2000). The nature of the cloud itself is often left out of consideration (we can simply call it “screen”). It could be a structure in the disk wind or outer layers of the disk.
It is worth noting that infrared excesses are observed in the spectrum of UX Ori-type stars, which cannot be obtained within the flared disk model. Natta et al. (2001) proposed a puffed-up disk model. Now there are different models of the disk puffing-up in the dust sublimation zone (Dullemond and Monnier 2010). One of them is a dusty disk wind. So Bans and Königl (2012), using the Safier (1993a, b) disk wind model, explained the infrared excesses in the spectrum of stars. The compact gas–dust cloud eclipse model has limitations. In particular, for one disk model and a fixed observer position, the dependence of the polarization degree and color indices on the fading level will always be the same (with some scatter of values due to scattered radiation fluctuations and observational errors).
Moreover, the compact screen model explains the positional angle changes during the minima when the position angle of intrinsic polarization of the star and the interstellar one does not coincide. But it cannot explain the variations of polarization positional angle observed some time after the eclipse. Significant changes in the position angle after the deep minima were observed during the eclipses of UX Ori (Grinin et al. 1994) and WW Vul (Grinin et al. 1988). The observations of UX Ori deep minima followed by the position angle changes are presented in Figure 1.
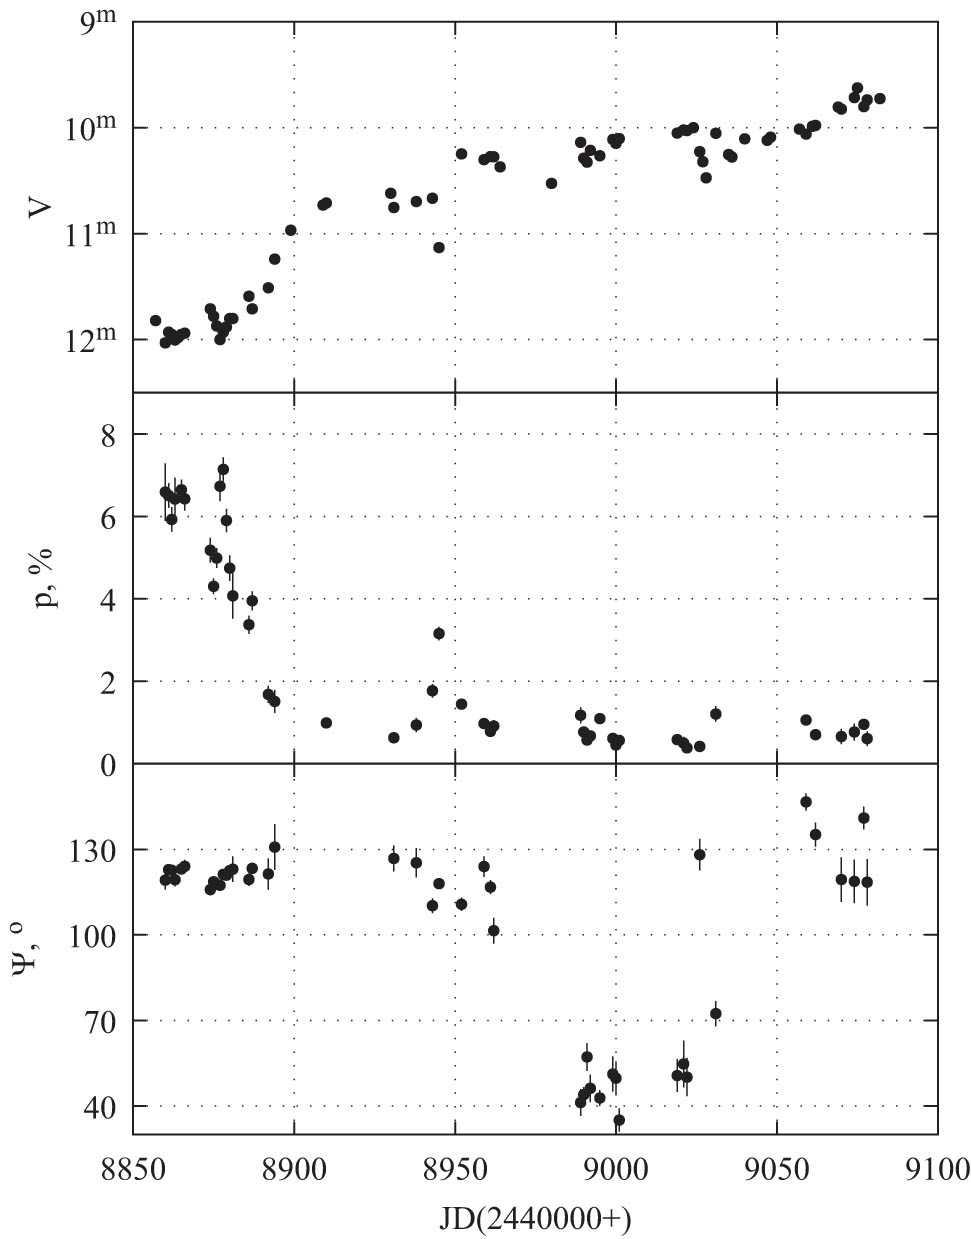
Magnitude (top panel), polarization degree (medium panel), and polarization position angle (lower panel) in the V band during UX Ori long-lasted deep eclipse (Grinin et al. 1994).
The compact cloud eclipse model for a star surrounded by a flared disk can be extended in two ways. The first is the study of a disk puffed-up in the dust sublimation zone. The second is the study of eclipses by extended structures. We have chosen large-scale disk perturbations as these structures. Such perturbations may be caused by various physical processes studied now actively. These can be atmospheric vortices (Godon and Livio 2000, Wolf and Klahr 2002), magneto-rotational instability that lifts charged dust grains above the disk (Turner et al. 2014), as well as instability or asymmetry of accretion and disk wind. We started work on these generalizations in our previous papers (Shulman and Grinin 2019a, b). Here we present the main results and formulate the parametric identification problem for long-lasted deep eclipses of UX Ori and WW Vul. Such eclipses seem to be the most interesting and complicated for the interpretation and study of the disk structure.
2 Model
We consider a model consisting of a star at the coordinate system origin and a circumstellar disk. We use a flared disk, which can have a large-scale perturbation. The disk puffing-up is obtained by adding a dusty wind to the disk. The resulting matter density is the maximum density of the disk and disk wind. It gives a smooth transition between flared disk and wind.
2.1 Flared disk
In the Cartesian coordinate system, the flared disk density is described by the formula
where
2.2 Disk perturbation
Previously we used a one-dimensional perturbation model, where the perturbation shape was a function of a distance from the perturbation center (Shulman and Grinin 2019b). In this study, we use a more general disk perturbation model based on two Gaussian functions. They determine the perturbation shape by distance from the star and azimuth. The resulting perturbation can be extended around the star, which resembles the vortices of cyclones and anticyclones predicted by gas-dynamic models (see, e.g., Godon and Livio 2000, Wolf and Klahr 2002). The disk perturbation height is
where
To add a perturbation to the disk model, we replace (2) with the following one:
The perturbation increases the disk scale height locally, it may lead to a star eclipse.
2.3 Disk puffing-up
We use the Safier (1993a, b) disk wind to obtain a disk puffing-up. Safier (1993b) provides the approximations for several wind models. So we can easily add a dusty wind to the disk. In this work, we restrict ourselves to using only the C wind model. A comparison of different wind models is presented in our previous studies (Shulman and Grinin 2019a, b).
The wind model is described by three main parameters.
The wind density is determined not only by the aforementioned model parameters but also by the mass outflow rate
2.4 Dust properties
We use the same dust parameters as in our previous works (Shulman and Grinin (2019a, b)). The scatterings are simulated using the Henyey–Greenstein phase function with White (1979) approximation for polarization functions. Neglecting circular polarization, we assumed the peak circular polarization equal to 0 and the skew factor equal to 1. We use the absorption coefficient
For simplicity, we assume the matter properties to be constant for the entire model. Table 1 presents dust properties in different spectral bands. It is worth noting that the dust parameters can differ significantly from that adopted in Table 1, mainly due to the heterogeneous structure of the dust particles (ice mantles) and/or their porosity (fluffy dust). The dust properties noticeably affect the simulation results, which should be considered when studying specific systems. In this article, while demonstrating the general properties of the large-scale disk perturbation model, we will restrict ourselves to only one dust model.
The dust properties
|
|
|
|
|
|
|---|---|---|---|---|
| U | 330 | 0.525 | 0.33 | 0.53 |
| B | 273 | 0.53 | 0.37 | 0.53 |
| V | 225 | 0.545 | 0.38 | 0.48 |
| R | 183 | 0.54 | 0.43 | 0.43 |
| I | 133 | 0.525 | 0.5 | 0.38 |
3 Method of calculations
In this study, we use the direction grid enumeration method (DGEM) proposed by one of the authors (Shulman 2018). While the widely used Monte Carlo method assumes simulations of photon packet propagating in random directions and scattering after passing through random optical depths, DGEM uses a uniform grid of directions for modeling the star radiation. We emit a photon packet into each direction of the grid. For every photon packet, we simulate several scatterings after passing through different optical depths so that an equal fraction of the energy is scattered each time. For single scatterings, this approach allows obtaining result significantly faster compared to the simulation of random photon packets. The speed gain can reach one or two orders of magnitude. For multiple scattering, DGEM is not yet so effective. Therefore after the first scattering, we use the Monte Carlo method to simulate multiple scatterings. Combining DGEM for single scatterings with the Monte Carlo method for multiple scatterings turns out to be more efficient than using the Monte Carlo method for all scatterings.
Preliminary calculations showed that the star could be considered a point source of radiation in our problems. Moreover, we can restrict ourselves to modeling only the first four scatterings. These simplifications make very little change in the final result, so their effect can be neglected.
We use an unstructured tetrahedral mesh to approximate the spatial distribution of the matter density. This kind of meshes allows obtaining densification of the mesh in areas with high-density gradients. Consequently, we receive more precise results.
4 Results for eclipse shape
We begin the discussion of the results by considering the dependences of the polarization degree and color indices on the fading level. First, we look at how the results for a puffed-up disk differ from the results for a flared disk in the compact cloud eclipse model. After that, we will compare compact cloud eclipses with eclipses by large-scale disk perturbations for the same disk models.
4.1 Compact cloud eclipses
The compact gas–dust cloud eclipse model has one parameter describing the eclipse. It is the optical depth of a cloud eclipsing a star. Thus, simulating an eclipse, we vary the optical thickness from 0 to infinity. The cloud absorbs the star radiation. The light scattered by the disk does not change. As a result, the disk model and the observer position unambiguously determine the change in the eclipse parameters depending on the optical depth. Since the optical thickness is not obtained in the observations, we consider the dependence of the parameters on the fading level.
4.1.1 Magnitude and polarization
We have simulated compact cloud eclipses for disks with different puffing-ups. Figure 2 shows the dependence of the polarization degree on the fading level for these eclipses. The angle between the disk axis and the direction towards the observer is
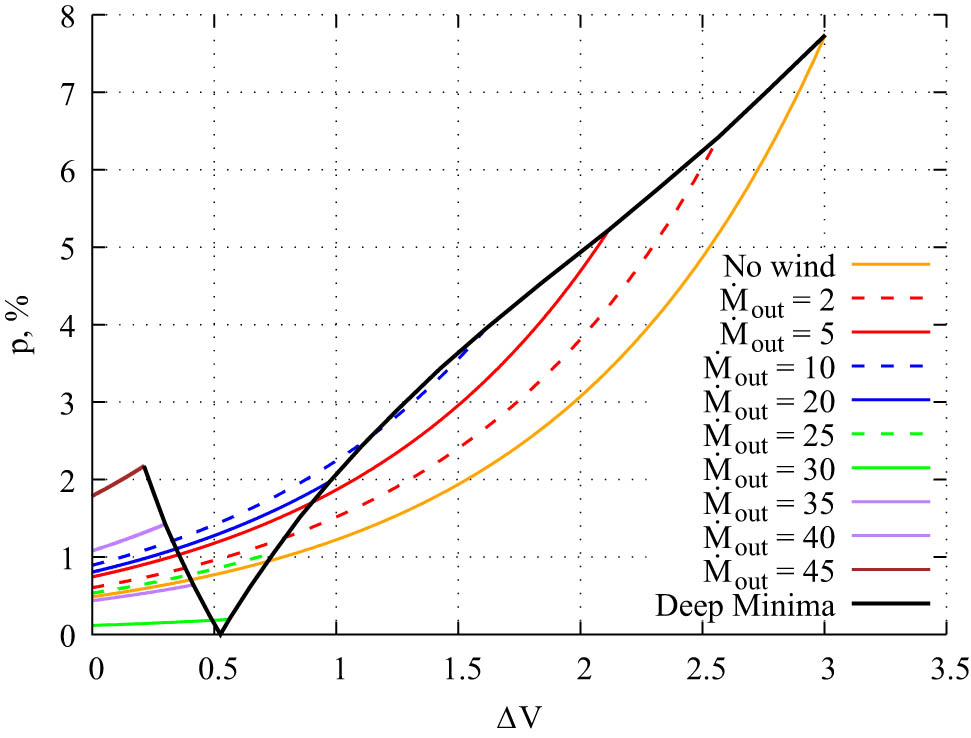
Dependence of the linear polarization degree on the fading level in the V band in the compact screen model for disks with different puffing-ups. The angle between the direction to the observer and the disk axis is
An increase in the mass outflow rate has several important effects. The disk wind scatters the starlight, thereby increasing the contribution of the circumstellar disk to the total system radiation. In addition, we look at the star through the disk wind layers, hence the disk wind obscures the star, decreasing its brightness. As a result, the eclipses become less deep.
The scattering substance geometry is most important for the polarization degree. Its dependence on the mass outflow rate turns out to be more complex than the dependence of the eclipse depth. It consists of three sections. The scattered radiation of a thin disk is polarized perpendicular to the disk plane. Adding a slight puffing-up, we get slightly higher linear polarization degrees than in a flared disk model at the same fading level. With a further increase in the mass outflow rate, the disk becomes thicker, and the polarization degree decreases to zero. After this, the disk becomes thick. Its scattered radiation is polarized along its plane. A further increase in the mass outflow rate leads to an increase in the polarization degree.
In Figure 2, the change in parameters for the deepest eclipse point is shown by the Deep Minima line. Its point with
The various mass outflow rates lead to different polarization degree changes during an eclipse. It is a new model property that was unattainable in the flared disk model. In particular, there may be an eclipse without a change in the linear polarization degree or with a slight increase in it. Rostopchina-Shakhovskaja et al. (2012) observed such an eclipse of WW Vul.
In disk wind models, it is usually assumed that the mass outflow rate is related to the accretion rate. Bans and Königl (2012) estimated the mass outflow rate to be 1–5% of the accretion rate. Mendigutía et al. (2011) and Pogodin et al. (2012) showed that the accretion rate varies up to 0.5 dexes. Then we can assume that the mass outflow rate also has variability. As a result, the disk wind density changes over time. Consequently, the dependence of the polarization degree on the fading level can differ between different eclipses of the same star. Such a scatter of polarization parameters is indeed observed in UX Ori-type stars.
We investigated compact gas–dust cloud eclipses of a star with a puffed disk for different disk parameters (Shulman and Grinin 2019a). Numerically, the results can vary greatly, but the behavior described above remains. The results are weakly dependent on the disk mass and its outer radius. Moreover, the stronger the puffing-up, the less important these parameters are. The inner disk radius (
The optical depth of the disk wind depends on the dust properties. Therefore, the mass outflow rate at which the orientation of the linear polarization plane changes depends on the wavelength. The dust absorption coefficient decreases from the U to I band. Therefore, the rotation of the polarization plane occurs in the U band first and in the I band last. Some stars demonstrate this behavior at the boundary of optics and the near-infrared ranges (Pereyra et al. 2009). Its explanation could be that we have an optically thick disk in the visible spectrum. The scattered radiation polarization is oriented along the disk plane. But in the near-infrared region, the disk is optically thin. Its radiation is polarized perpendicular to its plane. In our model, this feature may present from time to time, depending on the mass outflow rate.
4.1.2 Color indices
The disk puffing-up also affects the change in color indices during an eclipse. Figure 3 demonstrates the results for different disk models. The direct light of the star with a puffed-up disk is partially absorbed in the disk wind. The stronger the disk puffing-up, the less the eclipse depth is. As a result, the part of the track on which the star reddening occurs is reduced. Close to the minima, the color indices track changes weaker. Consequently, we can get an eclipse without the star reddening at all. Its color will change to the blue side from the very beginning of the eclipse. This effect happens earlier in the blue region of the spectrum, where the wind optical depth is higher. Such eclipses of UX Ori star were observed during the ultraviolet observations (Grady et al. 1995).
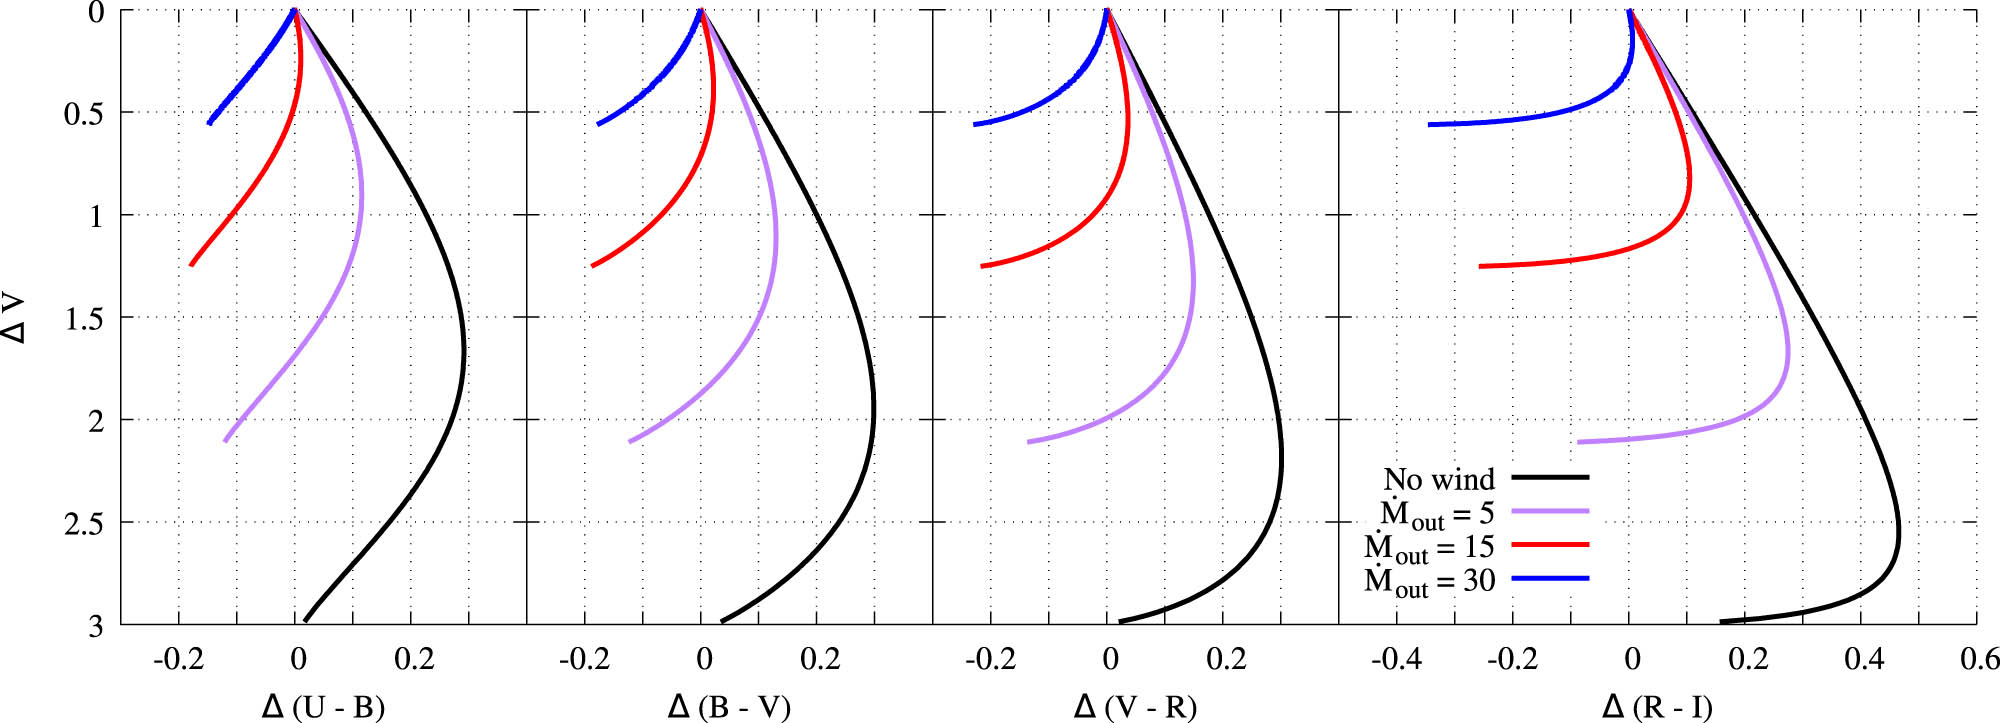
Changes in color indices during eclipses by compact screen for different disk models. The angle between the direction to the observer and the disk axis is
The closest to the minima part of the color indices track for a puffed-up disk does not repeat the corresponding part of the track for a flared disk. Thus, we can take partial star eclipse by the disk wind into account. Then the simulation result shows that the disk puffing also leads to some scatter of the color indices at the same fading level.
4.2 Eclipses by disk perturbations
The model of a star eclipsed by a large-scale disk perturbation is much more complicated than the model of an eclipse by a compact gas–dust cloud. In this model, both the star and the inner regions of the disk are eclipsed. There are more parameters to describe these eclipses. Instead of one (the optical depth of the cloud), we have five parameters characterizing the perturbation shape and its position relative to the observer. For simplicity, in this section, we assume the perturbation center to be between the star and the observer. When the perturbation moves around the star, the described dependences in this section do not change significantly. Changes in the positional angle of linear polarization, for which the perturbation rotation around the star plays a decisive role, will be considered in the next section.
4.2.1 Magnitude and polarization
We simulated eclipses of a star with a flared disk by a large-scale disk perturbation, alternately varying all four perturbation parameters. The dependence on
An increase in the perturbation scale height (
The effect of the perturbation center radius (
To demonstrate some general properties of such eclipses, we chose the dependences on
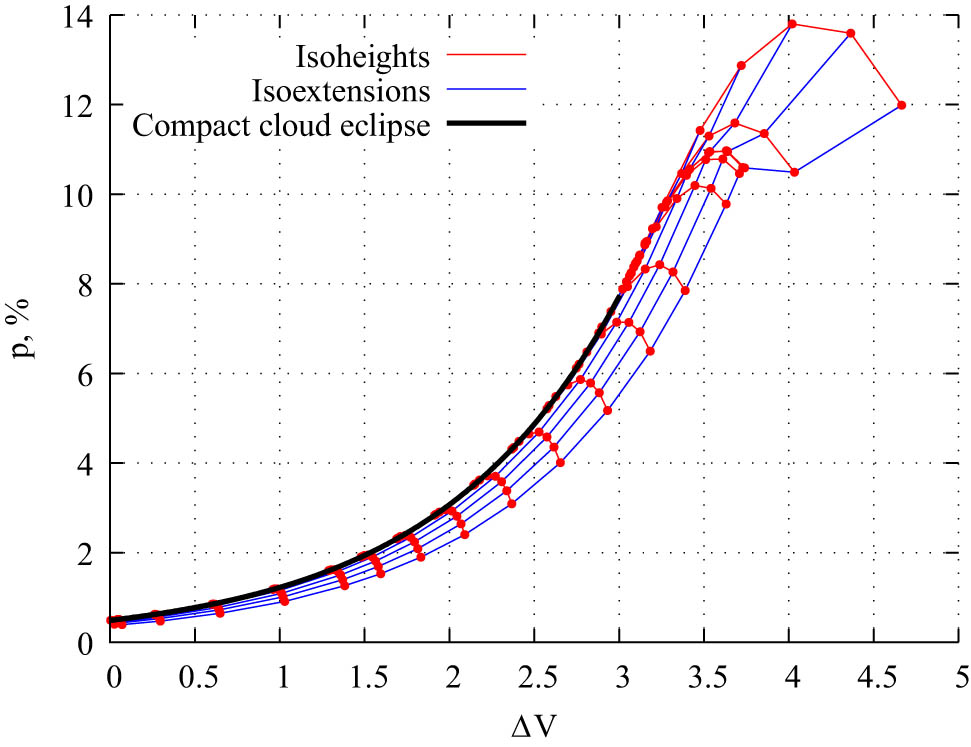
Dependence of the linear polarization degree on the fading level in the V band in the disk perturbation eclipse model for the star with a flared disk. The dots show the simulation results for eclipses with different parameters. Isoheights and isoextensions present results for perturbations with equal
Isoextensions run approximately along with the compact cloud eclipse plot. We have studied the polarization dependence on the fading level during the rotation of a constant-height perturbation. It also goes along the compact cloud eclipse one. It allows us to consider the isoextensions as a simplified model of such an eclipse.
In Figure 5, we present similar results for the flared disk (from Figure 4) and puffed-up disks. The results for puffed-up disks show the same behavior as for the flared one. In the large-scale disk perturbation model, it is possible to obtain a substantially deeper eclipse compared to the compact cloud model. The maximum polarization degree is also significantly higher. The results depend on the wavelength, the disk model, and perturbation parameters. We can roughly conclude that the eclipse depth and the polarization degree increase by a factor of 1.5. However, even larger values are achievable.

In addition, the large-scale perturbation model gives a noticeable spread in the linear polarization degree at one fading level. Usually, in this model, the polarization degree is lower compared to the compact cloud model at the same fading level. However, sometimes you can get a little higher polarization. Near the minimum brightness, the polarization degree spread can be about 1–2% (and even more in corner cases). Rostopchina et al. (2000) observed such a scatter for UX Ori-type stars.
4.2.2 Color indices
An eclipse by a large-scale disk perturbation affects not only the polarization parameters but also the color indices. Figure 6 shows changes in color indices for the same perturbation models as in Figure 5. For ease of comparison with a compact cloud eclipse, we use the same disk model as in Figure 3 and show compact cloud eclipses with thick lines. Eclipses by an extended screen are represented by points and a grid of isoheights and isoextensions. As before, the isoextensions go along the eclipse line as a compact cloud, and the isoheights go perpendicular to it.
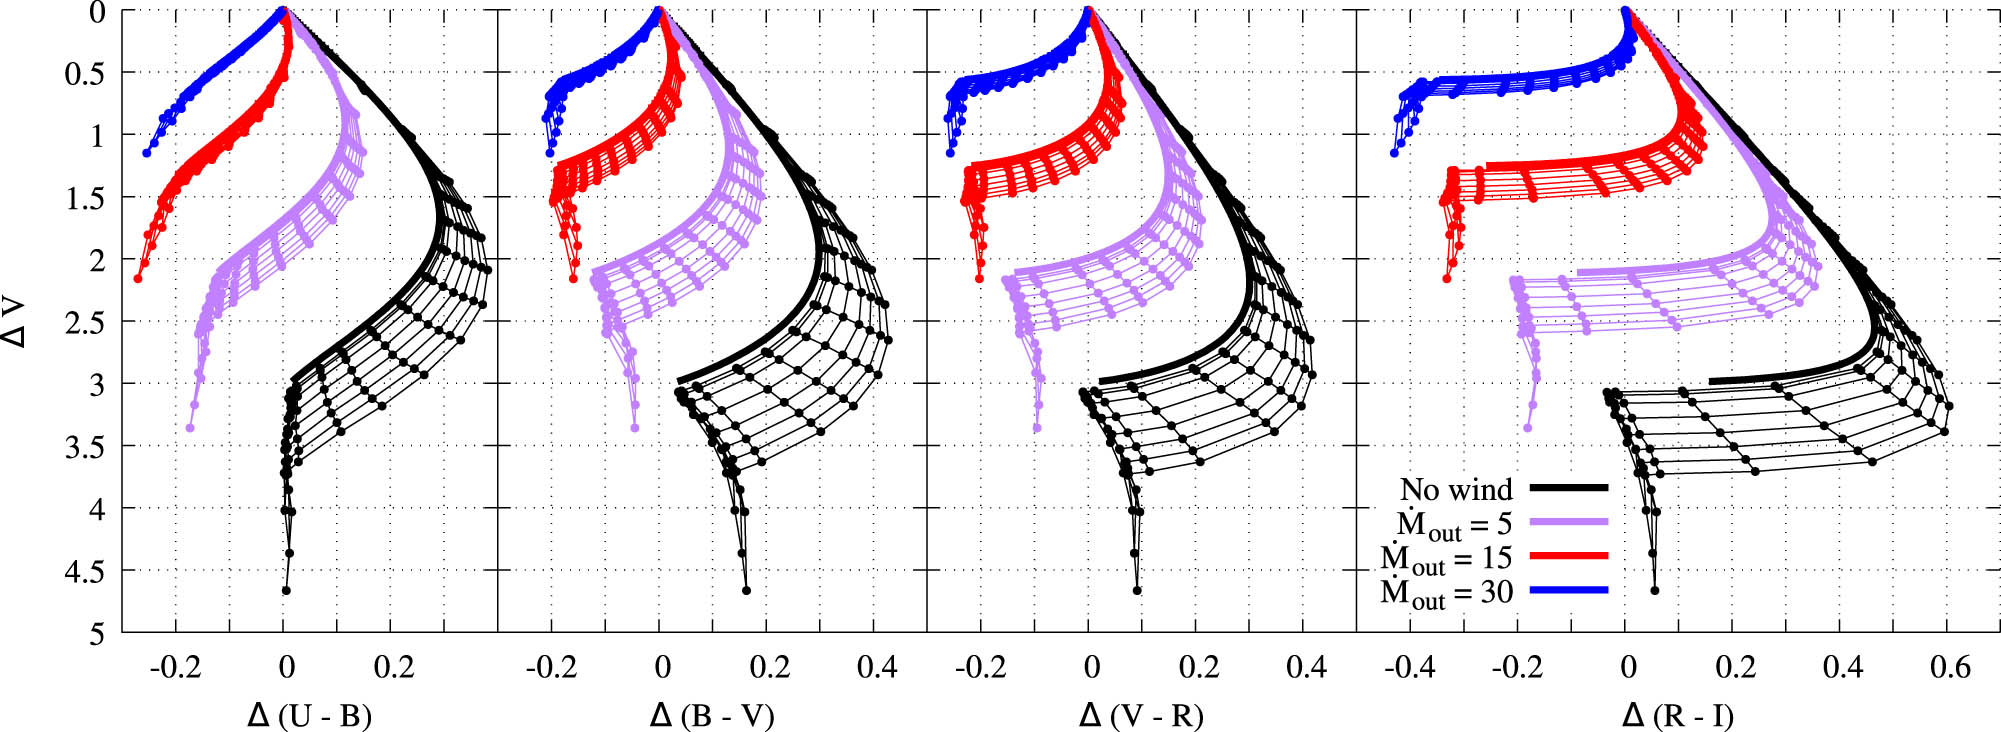
Changes in color indices during the disk perturbation eclipses for the same disk models as in Figure 3. The compact cloud eclipse results are shown with thick lines for comparison.
Compared to a compact cloud eclipse, extended perturbation eclipse results have wider ranges of color indices. In addition, there is a noticeable spread of color indices at one fading level.
Near the brightness minimum, when the eclipse gets deeper than in the compact cloud model, there is an interesting isoextension feature. Until some moment, there is a rather noticeable bluing effect. And then the dependence nature changes. With a further system fading, both a weak bluing and a weak reddening are possible. A deeper eclipse may also have no changes in color indices.
It is worth noting that the initial star reddening is associated with the selective absorption of dust, which is why the star’s light weakens faster in the short-wavelength region of the spectrum. Closer to minima, the star radiation in different spectral bands weakens very strongly. As a result, the difference between them due to selective absorption becomes less significant. Hence, the bluing effect arises. In our model, eclipses can get deeper even when the direct starlight is fully absorbed. In this case, the selective absorption of light scattered in the central regions of the disk plays a prime role. Thus, the line break corresponds to the transition from a star eclipse to an eclipse of the inner disk regions.
5 Eclipse phase dependence
A large-scale disk perturbation revolves around the star. This movement leads to a change in the perturbation location relative to the observer. Consequently, the system radiation parameters change over time. In addition to changes in the magnitude and linear polarization degree, it also allows one to obtain changes in the positional angle of the linear polarization.
The last changes are caused by the perturbed disk asymmetry relative to the direction toward the observer. For a general discussion of the phenomenon’s nature, we can omit the time elapsed after the brightness minimum. Instead of it, we can directly use the observer position longitude
While studying changes in the positional angle, the disk puffing-up is more important than the perturbation shape. With a slight puffing-up, the disk is strongly polarized perpendicular to its plane. Consequently, even a strong disk perturbation is not capable of causing significant changes in the position angle. On the contrary, when the disk turns out to be close to the transition from thin to thick, its radiation is weakly polarized, and the position angle can vary greatly. Figure 7 shows the changes in magnitude, polarization degree, and positional angle (
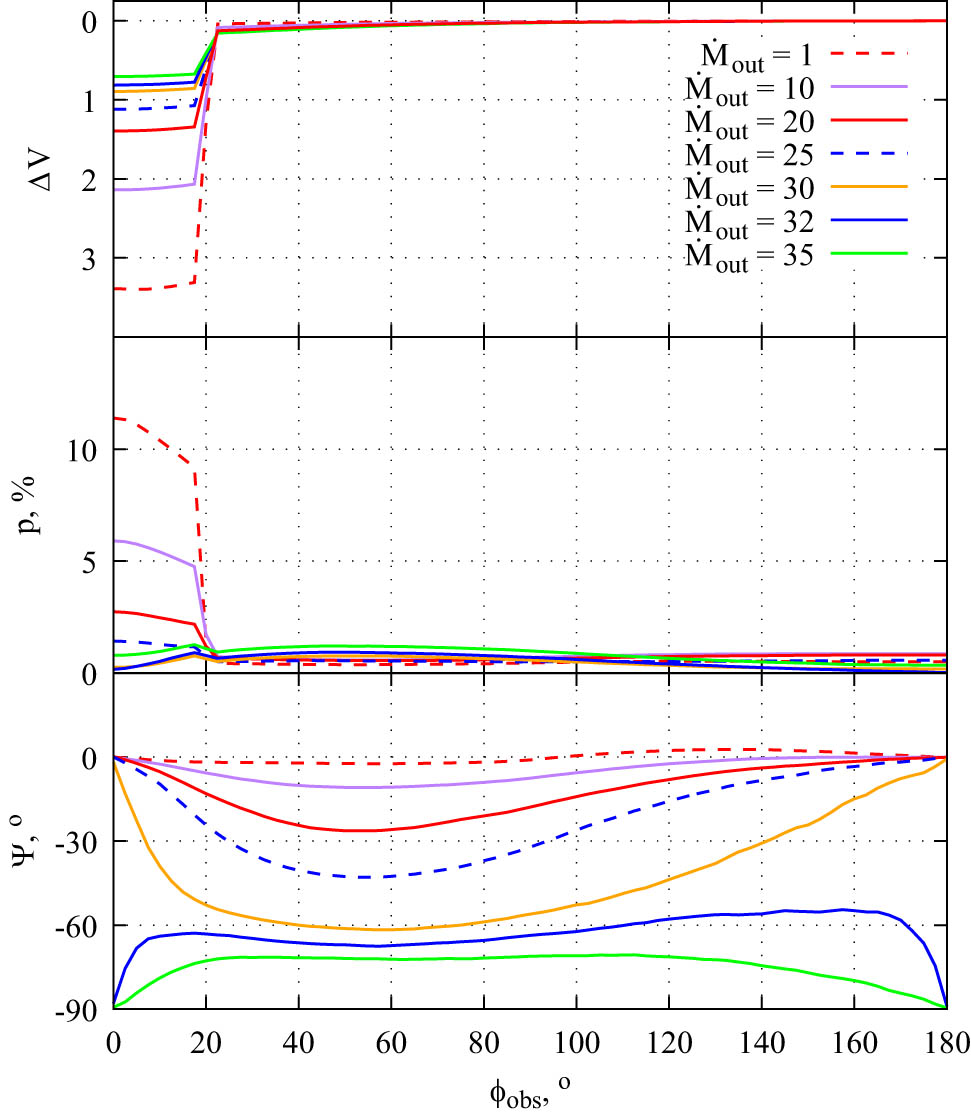
Change in magnitude (top panel), polarization degree (medium panel), and polarization position angle (lower panel) in the V band versus longitude of the observer (
The position angle changes in the flared disk model are insignificant and can reach only a few degrees. For an unperturbed flared disk
It is worth noting that with a significant azimuthal extension, the eclipse can be quite prolonged. In this case, the maximum polarization degree can be achieved not at the point, when the perturbation is exactly between the star and the observer, but be slightly shifted relative to it. A strongly perturbed disk polarization degree changes over time. When the perturbation begins to shift to the side, the disk polarization increases. For small longitudes, this effect prevails over the growth of the contribution of unpolarized radiation from the star.
Figure 8 shows examples of eclipses with different perturbation parameters and mass outflow rates. They demonstrate the above described effect with a polarization maximum shifted from the brightness minimum. We also show a model with an almost unpolarized disk, where the position angle changes reach almost
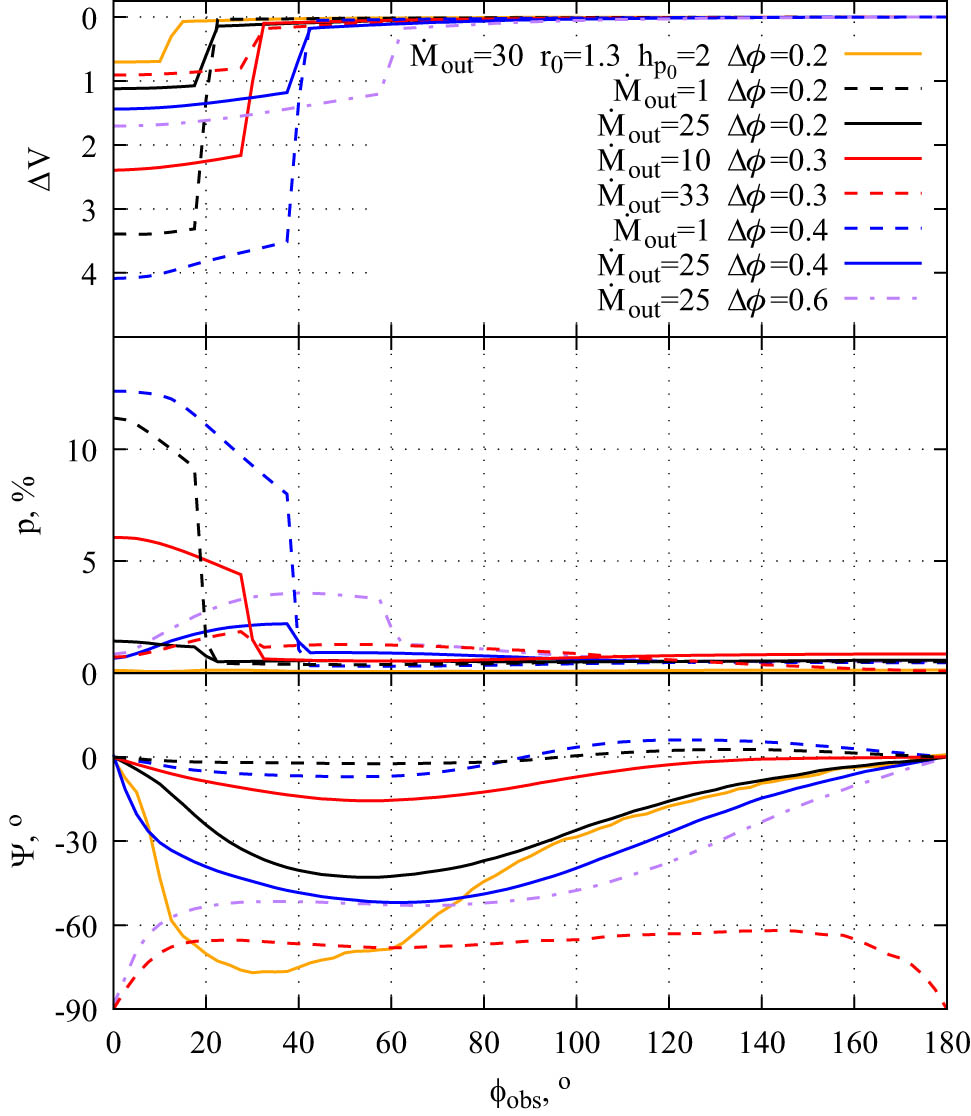
The same as in Figure 7 for various disk perturbations and mass outflow rates. The mass outflow rate is indicated in units of
An extended perturbation can also lead to such a disk shape that the disk appears thick from the perturbation side. At the same time, from the opposite side, it is thin. In this case, the positional angle changes by
We have already noted above that the disk wind influence depends on the spectral band. The same is true for position angle changes. In different spectral bands, our model predicts different amplitudes of changes.
6 Parametric identification of long eclipses
Deep and long-lasted eclipses of UX Ori (Grinin et al. 1994) and WW Vul (Grinin et al. 1988) demonstrated a high polarization degree at the brightness minimum and strong changes in the positional angle after passing through it. The model of a star eclipsed by a large-scale disk perturbation makes it possible to obtain both a high polarization degree and heavy changes in the position angle. At first glance, it seems that this makes it possible to determine the possible disk puffing-up and perturbation parameters, which give the observed eclipses. For simplicity, we can start with a model where the mass outflow rate and the perturbation shape do not change. Actually, the situation turns out to be much more complicated. Using Figures 7 and 8, we can conclude that the higher the polarization degree at the brightness minimum, the smaller the change in the positional angle, and vice versa. Thus, we can obtain the observed eclipse parameters in different models, but not together. Consequently, the first problem is to find out whether it is generally possible to get the observed parameters in one model.
To study this issue, we decided to consider eclipses by perturbations with random parameters. The mass outflow rate was also a random variable. Each parameter is varied over a wide range. The
We have simulated 4,000 random UX Ori eclipses. We filtered out those models where the major change in the positional angle was at the minimum brightness (these are models with a total change in the angle by
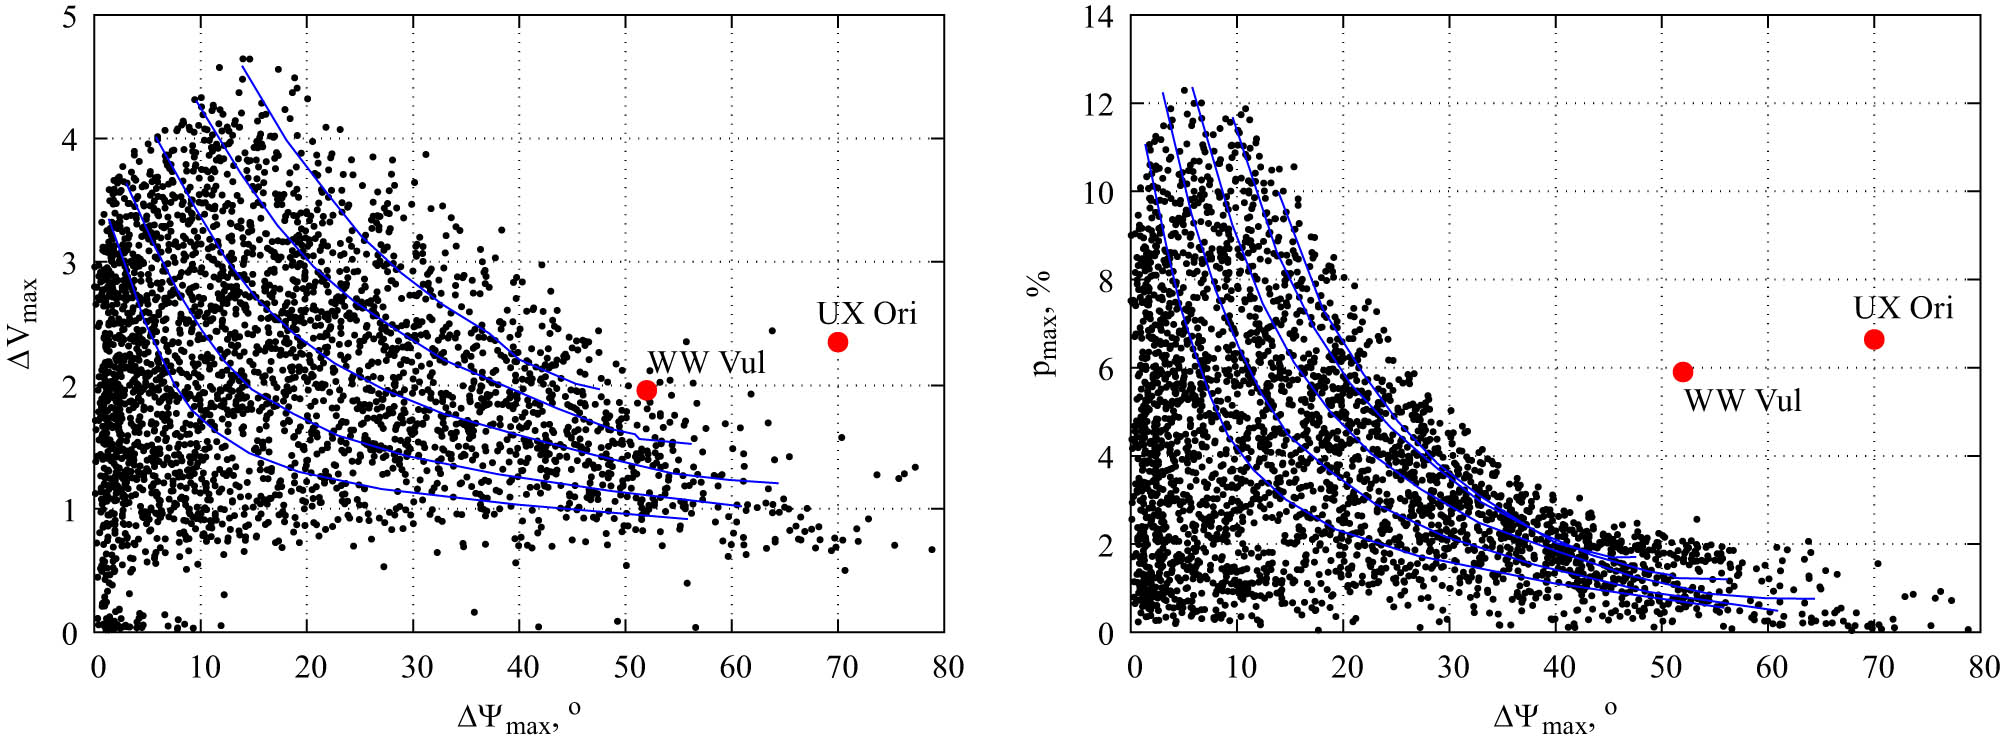
The comparison of the model results (black) with UX Ori and WW Vul observations (red). The left panel shows ratios of maximum fading level and the maximum change in the positional angle after passing through it. The right panel demonstrates ratios of the polarization in the brightness minimum and the maximum change in the positional angle. For several perturbation models with a constant shape, the simulation results with a variable mass outflow rate are shown by blue lines.
We investigated the ratio of the eclipse depth with the change in the positional angle after it and the maximum degree in the minimum brightness with the same angle changes. A model with close to WW Vul observation values of the eclipse depth and changes in the position angle is possible. Observations of UX Ori are outside the range of model possible values. For the relationship between changes in the positional angle and the polarization degree, the situation is even worse – the observations of both stars are far from model results.
For a better understanding of the situation, it is worth discussing the selected ranges of parameters. The mass outflow rate range makes it possible to study all models from a flared disk to a thick disk with a near-zero polarization degree. A further increase in the mass outflow rate will lead to a thicker disk and lighter changes in the position angle. Moreover, stars with too thick disks have a shallow depth of eclipses.
The
The perturbation extension along the azimuth determines the duration of the deep part of the eclipse. With
We considered such perturbation extensions along the radius so that they were noticeably less than
The last variable model parameter is the relative height of the perturbation. Too small values give very shallow minimums, so we started from
From the above, we can conclude that the observations of UX Ori and WW Vul do not fall into the range of possible values because of the model nature. The considered ranges of variation of the model parameters do not limit the model unreasonably. So, we cannot explain the observed eclipses by a model with a constant disk perturbation shape and a mass outflow rate.
The possible ratios of the model parameters have clear dependence on the mass outflow rate. Therefore, in the next step, we propose considering a model with a variable mass outflow rate. To demonstrate this model, we add additional lines in Figure 9. They show parameter ratios corresponding to several fixed perturbation models and variable mass outflow rates.
Thus, there should be a low mass outflow rate at the minimum brightness. It makes a deep eclipse with a high polarization degree possible. Then the mass outflow rate increases, leading to the possibility of heavy changes in the positional angle. In this case, the disk puffing-up partially eclipses the star, which explains the slow recovery of the star’s brightness after the minimum. Finally, the mass outflow rate returns to the initial level. Consequently, the star reaches its initial brightness, and the positional angle of linear polarization takes on its value before the minimum.
This concept also explains one more model difference from the observations. The constant parameter model predicts a heavy change in the position angle before the brightness minimum. These changes before the minima and after it should have comparable amplitude and opposite directions.
When the maximum deviation of the positional angle is reached, the star brightness is lower than before the eclipse. We can explain this by the partial eclipse of the star by the disk wind. The ratio of the maximum changes in the positional angle to the fading level at the same moment can be easily compared to observations. For simplicity, we can assume that a large-scale disk perturbation does not eclipse the star at this moment. So, the weakening of gloss is associated exclusively with the disk wind. If the disk perturbation eclipses the star at this time, then the change in magnitude will only increase.
Figure 10 shows the dependence of the maximum attainable change in the position angle on the mass outflow rate. In our model, for the value observed during UX Ori eclipse, the mass outflow rate is not less than
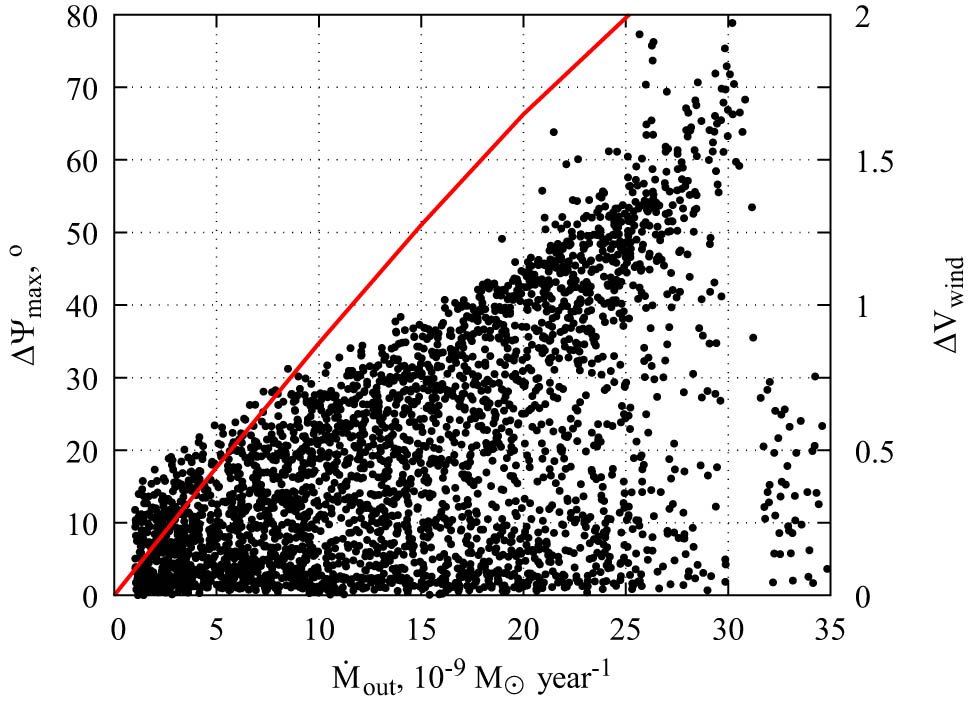
Dependence of the maximum change in the position angle on the mass outflow rate for the eclipse models from Figure 9 (black dots). The red line shows the disk wind eclipse depth depending on the mass outflow rate.
The deep brightness minimum of UX Ori was not very long in comparison with the entire eclipse. In our models, the duration of the minimum strongly depends on two parameters:
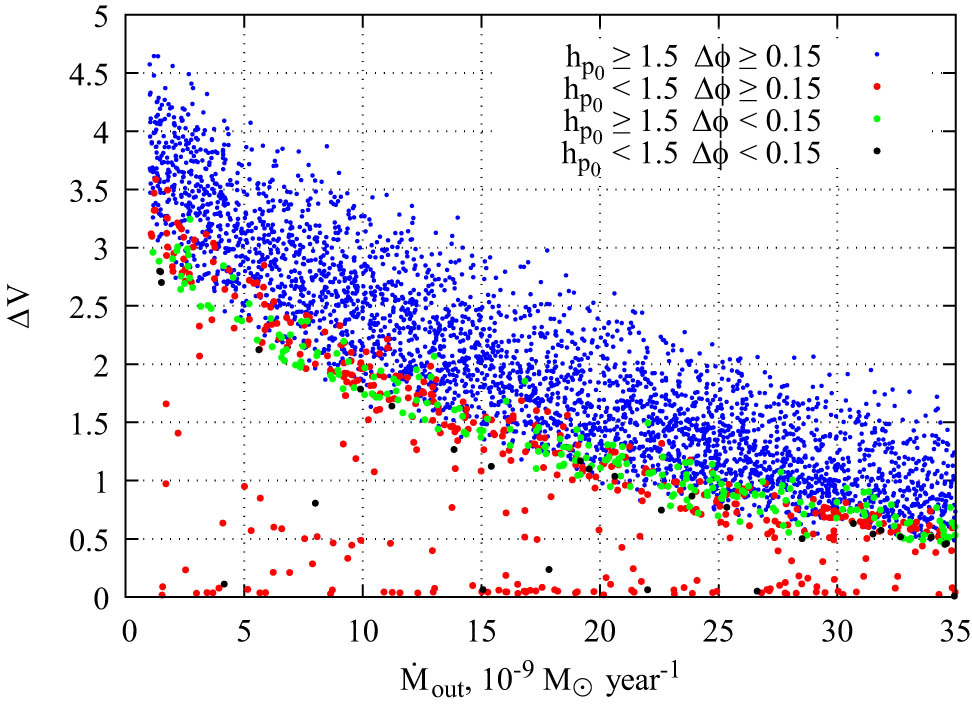
Dependence of the eclipse depth on the mass outflow rate for the eclipse models from Figure 9. The color dots present different ranges of
As a result, we find that the observed phenomena have a complex shape with several key features. They are the minimum depth and duration, the polarization degree at the minimum, changes in the positional angle after the minimum, and a corresponding fading level. We can get any of these parameters separately, but not all of them at once. Models with a constant perturbation shape and a fixed mass outflow rate can not explain the considered eclipse. The model with a variable outflow rate of matter turns out to be noticeably closer to observations, but even in it, we cannot achieve full agreement. If the perturbation parameters are also allowed to change over time, an exact match can be achieved, although questions about the nature of such changes remain. In any case, this is an additional complication of the model and must be done carefully. We plan to devote our subsequent work to further study the perturbation shape and the disk puffing-up.
7 Conclusion
We present our study of UX Ori-type stars eclipses based on our previous works, Shulman and Grinin (2019a,b). We have significantly expanded and generalized the compact gas–dust cloud eclipse model (Grinin 1988). Both previously simulated eclipses of a star with a flared disk and eclipses of a star with a puffed-up disk are considered. In addition to compact cloud eclipses, we studied eclipses by a large-scale disk perturbation that revolves around the star.
We found that the disk puffing-up makes it possible to explain several features of UX Ori-type star eclipses. First of all, eclipses with little or no change in the linear polarization degree. Rostopchina-Shakhovskaja et al. (2012) observed WW Vul eclipse with almost no increase in the polarization degree. Second, the positional angle of linear polarization may differ by
The large-scale disk perturbation eclipse model, the model of a star with a puffed-up disk, and both models together lead to an additional scatter of linear polarization parameters and color indices at the same fading level. It is a widespread feature of the eclipses of UX Ori-type stars (Rostopchina et al. 2000).
An eclipse by a large-scale disk perturbation can lead to a few interesting phenomena. First, such eclipses can be noticeably deeper than eclipses by a compact gas–dust cloud. Also, at the minimum brightness, the polarization degree can be much higher. The effect depends on the disk shape and the dust properties. Generally, we achieve an increase in the depth and polarization degree by a factor of 1.5. In some cases, even a more significant increase may present. Second, the maximum of linear polarization can be slightly shifted from the minimum brightness. It can be reached when the star already begins to restore brightness after the minimum. Third, a heavy change in the linear polarization positional angle may present during the brightness minima and after it. When the positional angle changes at the minimum brightness, the total changes can be as high as
The changes in the positional angle were observed for UX Ori (Grinin et al. 1994) and WW Vul (Grinin et al. 1988). We compared the model results with the observations. Our goal was to determine the possibility of parametric identification for determining the perturbation parameters and the disk puffing-up. We varied all the perturbation parameters and the mass outflow rate, which determines the thickening of the disk. We also looked at several observer positions. At the same time, we limited ourselves to one disk model (UX Ori disk) and one wind model in order to reduce the number of variable parameters.
We considered a model with fixed perturbation parameters and the mass outflow rate. We have determined that, within this model, it is impossible to achieve agreement between the model and the observations. It is impossible to simultaneously obtain a high linear polarization degree at the brightness minimum and the change in the positional angle of about
The model with a variable mass outflow rate made it possible to approach even closer to modeling the observed UX Ori eclipse. Nevertheless, we have not yet been able to achieve full compliance.
The disk wind model of the puffing-up is not the only possible one. There are other puffing-up models. For example, Turner et al. (2014) considered magneto-rotational turbulence, which also leads to disk puffing. It is important to compare how the puffing-up model influences the eclipse properties. If different models give close observable results, or we can distinguish puffing-up models based on the eclipse shape.
Parametric identification of the eclipse model turned out to be a difficult task with many parameters. Some of these parameters must change during an eclipse. In addition, the proposed perturbation model may be poorly suited for this problem and require correction. The identification is important for determining the structures in the inner regions of the circumstellar disks. Few eclipses with such complex positional angle behavior were observed. Monitoring of UX Ori-type stars and detailed observations of such unique eclipses in different spectral bands are necessary for a deeper understanding of the processes in the disks of young stars.
-
Funding information: V. P. Grinin acknowledges the support of Ministry of Science and Higher Education of the Russian Federation under the grant 075-15-2020-780 (N13.1902.21.0039).
-
Author contributions: All authors have accepted responsibility for the entire content of this manuscript and approved its submission.
-
Conflict of interest: The authors state no conflict of interest.
-
Data availability statement: The datasets generated during the current study are available from the corresponding author on reasonable request.
References
Bans A, Königl A. 2012. A disk-wind model for the near-infrared excess emission in protostars. ApJ. 758:100. 10.1088/0004-637X/758/2/100.Suche in Google Scholar
Dullemond CP, Monnier JD. 2010. The inner regions of protoplanetary disks. ARA&A. 48:205–239. 10.10.1146/annurev-astro-081309-130932. Suche in Google Scholar
Godon P, Livio M. 2000. The formation and role of vortices in protoplanetary disks. ApJ. 537:396–404. 10.1086/309019. Suche in Google Scholar
Grady CA, Perez MR, Thé PS, Grinin VP, de Winter D, Johnson SB, et al. 1995. The beta Pictoris phenomenon among young stars. II. UV observations of the Herbig AE star UX Orionis. A&A. 302:472–482. Suche in Google Scholar
Grinin VP. 1988. On the blue emission visible during deep minima of young irregular variables. Sov Astron Lett. 14:27. Suche in Google Scholar
Grinin VP, Kiselev NN, Minikulov NK, Chernova GP. 1988. Linear polarization in deep minima of WW-Vulpeculae. Sov Astron Lett. 14:219. Suche in Google Scholar
Grinin VP, Thé PS, de Winter D, Giampapa M, Rostopchina AN, Tambovtseva LV, et al. 1994. The beta Pictoris phenomenon among young stars. I. The case of the Herbig AE star UX Orionis. A&A. 292:165–174. Suche in Google Scholar
Kim SH, Martin PG, Hendry PD. 1994. The size distribution of interstellar dust particles as determined from extinction. ApJ. 422:164–175. 10.1086/173714. Suche in Google Scholar
Kreplin A, Madlener D, Chen L, Weigelt G, Kraus S, Grinin V, et al. 2016. Resolving the inner disk of UX Orionis. A&A. 590:A96. 10.1051/0004-6361/201628281. Suche in Google Scholar
Mendigutía I, Calvet N, Montesinos B, Mora A, Muzerolle J, Eiroa C, et al. 2011. Accretion rates and accretion tracers of Herbig Ae/Be stars. A&A. 535:A99. 10.1051/0004-6361/201117444. Suche in Google Scholar
Natta A, Prusti T, Neri R, Thi WF, Grinin VP, Mannings V. 1999. The circumstellar environment of UX Ori. A&A. 350:541–552. Suche in Google Scholar
Natta A, Prusti T, Neri R, Wooden D, Grinin VP, Mannings V. 2001. A reconsideration of disk properties in Herbig Ae stars. A&A. 371:186–197. 10.1051/0004-6361:20010334. Suche in Google Scholar
Natta A, Whitney BA. 2000. Models of scattered light in UXORs. A&A. 364:633–640. Suche in Google Scholar
Pereyra A, Girart JM, Magalhães AM, Rodrigues CV, de Araujo FX. 2009. Near infrared polarimetry of a sample of YSOs. A&A. 501:595–607. 10.1051/0004-6361/200809680. Suche in Google Scholar
Pogodin MA, Hubrig S, Yudin RV, Schöller M, González JF, Stelzer B. 2012. Measuring the mass accretion rates of Herbig Ae/Be stars with X-shooter. Astron Nachr. 333:594–612. 10.1002/asna.201211706. Suche in Google Scholar
Rostopchina AN. 1999. The location of UX Ori stars on the Hertzsprung-Russell diagram. Astron Rep. 43:113–118. Suche in Google Scholar
Rostopchina AN, Grinin VP, Shakhovskoi DN, Thé PS, Minikulov NKh. 2000. Photopolarimetric activity of the Ae Herbig star SV Cep. Astron Rep. 44:365–375. 10.1134/1.163860. Suche in Google Scholar
Rostopchina-Shakhovskaja AN, Grinin VP, Shakhovskoi DN. 2012. Unusual recurrent eclipses of the UX Ori star WW Vul. Astrophysics. 55:147–155. 10.1007/s10511-012-9223-z. Suche in Google Scholar
Safier PN. 1993a. Centrifugally driven winds from protostellar disks. I - Wind model and thermal structure. ApJ. 408:115–147. 10.1086/172574.Suche in Google Scholar
Safier PN. 1993b. Centrifugally driven winds from protostellar disks. II. Forbidden-line emission in T Tauri stars. ApJ. 408:148–159. 10.1086/172575. Suche in Google Scholar
Shulman SG. 2018. Three-dimensional heuristic radiation transfer method based on enumeration using the directions grid. Astron Comput. 24:104–116. 10.1016/j.ascom.2018.06.002. Suche in Google Scholar
Shulman SG, Grinin VP. 2019a. Influence of the disk wind on the intrinsic polarization of young stars. Astron Lett. 45:384–395. 10.1134/S1063773719060057. Suche in Google Scholar
Shulman SG, Grinin VP. 2019b. Influence of large-scale perturbations in circumstellar disks on the linear polarization parameters of UX Ori stars. Astron Lett. 45:664–676. 10.1134/S1063773719100062. Suche in Google Scholar
Turner NJ, Benisty M, Dullemond CP, Hirose S. 2014. Herbig stars’ near-infrared excess: an origin in the protostellar diskas magnetically supported atmosphere. ApJ. 780:42, 10.1088/0004-637X/780/1/42. Suche in Google Scholar
White RL. 1979. Polarization in reflection nebulae. I – scattering properties of interstellar grains. ApJ. 229:954–961. 10.1086/157029.Suche in Google Scholar
Wolf S, Klahr H. 2002. Large-scale vortices in protoplanetary disks: on the observability of possible early stages of planet formation. ApJ. 578:L79–L82. 10.1086/344501. Suche in Google Scholar
© 2022 Sergey Shulman and Vladimir Grinin, published by De Gruyter
This work is licensed under the Creative Commons Attribution 4.0 International License.
Artikel in diesem Heft
- Research Articles
- Deep learning application for stellar parameters determination: I-constraining the hyperparameters
- Explaining the cuspy dark matter halos by the Landau–Ginzburg theory
- The evolution of time-dependent Λ and G in multi-fluid Bianchi type-I cosmological models
- Observational data and orbits of the comets discovered at the Vilnius Observatory in 1980–2006 and the case of the comet 322P
- Special Issue: Modern Stellar Astronomy
- Determination of the degree of star concentration in globular clusters based on space observation data
- Can local inhomogeneity of the Universe explain the accelerating expansion?
- Processing and visualisation of a series of monochromatic images of regions of the Sun
- 11-year dynamics of coronal hole and sunspot areas
- Investigation of the mechanism of a solar flare by means of MHD simulations above the active region in real scale of time: The choice of parameters and the appearance of a flare situation
- Comparing results of real-scale time MHD modeling with observational data for first flare M 1.9 in AR 10365
- Modeling of large-scale disk perturbation eclipses of UX Ori stars with the puffed-up inner disks
- A numerical approach to model chemistry of complex organic molecules in a protoplanetary disk
- Small-scale sectorial perturbation modes against the background of a pulsating model of disk-like self-gravitating systems
- Hα emission from gaseous structures above galactic discs
- Parameterization of long-period eclipsing binaries
- Chemical composition and ages of four globular clusters in M31 from the analysis of their integrated-light spectra
- Dynamics of magnetic flux tubes in accretion disks of Herbig Ae/Be stars
- Checking the possibility of determining the relative orbits of stars rotating around the center body of the Galaxy
- Photometry and kinematics of extragalactic star-forming complexes
- New triple-mode high-amplitude Delta Scuti variables
- Bubbles and OB associations
- Peculiarities of radio emission from new pulsars at 111 MHz
- Influence of the magnetic field on the formation of protostellar disks
- The specifics of pulsar radio emission
- Wide binary stars with non-coeval components
- Special Issue: The Global Space Exploration Conference (GLEX) 2021
- ANALOG-1 ISS – The first part of an analogue mission to guide ESA’s robotic moon exploration efforts
- Lunar PNT system concept and simulation results
- Special Issue: New Progress in Astrodynamics Applications - Part I
- Message from the Guest Editor of the Special Issue on New Progress in Astrodynamics Applications
- Research on real-time reachability evaluation for reentry vehicles based on fuzzy learning
- Application of cloud computing key technology in aerospace TT&C
- Improvement of orbit prediction accuracy using extreme gradient boosting and principal component analysis
- End-of-discharge prediction for satellite lithium-ion battery based on evidential reasoning rule
- High-altitude satellites range scheduling for urgent request utilizing reinforcement learning
- Performance of dual one-way measurements and precise orbit determination for BDS via inter-satellite link
- Angular acceleration compensation guidance law for passive homing missiles
- Research progress on the effects of microgravity and space radiation on astronauts’ health and nursing measures
- A micro/nano joint satellite design of high maneuverability for space debris removal
- Optimization of satellite resource scheduling under regional target coverage conditions
- Research on fault detection and principal component analysis for spacecraft feature extraction based on kernel methods
- On-board BDS dynamic filtering ballistic determination and precision evaluation
- High-speed inter-satellite link construction technology for navigation constellation oriented to engineering practice
- Integrated design of ranging and DOR signal for China's deep space navigation
- Close-range leader–follower flight control technology for near-circular low-orbit satellites
- Analysis of the equilibrium points and orbits stability for the asteroid 93 Minerva
- Access once encountered TT&C mode based on space–air–ground integration network
- Cooperative capture trajectory optimization of multi-space robots using an improved multi-objective fruit fly algorithm