Influence of the magnetic field on the formation of protostellar disks
-
 ,
,

Abstract
We numerically model the collapse of magnetic rotating protostellar clouds with mass of 10
1 Introduction
Observations show that stars form in cold dense cores of filamentary interstellar molecular clouds. This protostellar clouds (PSCs) have typical density
The distribution of the specific angular momentum inside PSCs was studied only on large scales of 0.1 pc. The energy of rotation of PSCs is of the order of several percent of the gravitational energy (Goodman et al. 1993, Caselli et al. 2002).
Measurements of the Zeeman effect in the OH lines indicates that PSCs have a magnetic field with strength of
It is believed that gravitationally unstable PSCs undergo gravitational collapse and evolve into class 0 young stellar objects (YSOs hereafter) observed as the IR sources and interpreted as protostars surrounded by dense flattened envelope of gas and dust (Andre et al. 1993). Bipolar outflows are the characteristic feature of class 0 YSOs (Myers et al. 1988, Andre 1995, Galametz et al. 2020).
Studies in the submillimeter range show that the envelopes of class 0 YSOs have a size of 500–12,000 au. The envelopes are flattened along the axis of rotation and/or the magnetic field direction (Wiseman et al. 2001, Maureira et al. 2020). High angular resolution studies of the central regions around protostars in recent years revealed small disks with signs of Keplerian rotation and sizes of 2–300 au (Ohashi et al. 2014, Dunham et al. 2014, Persson et al. 2016, Pineda et al. 2019, Tobin et al. 2020). These disks can be associated with protostellar accretion disks.
The geometry of the magnetic field is quasi-radial and partially quasi-toroidal inside the envelopes of class 0 YSOs (Lee et al. 2019, Hull and Zhang 2019). The angular momentum distribution changes across disk to envelope transition at radii from 1,000 to 10,000 au (Goodman et al. 1993, Ohashi et al. 1997, Caselli et al. 2002, Belloche 2013).
The transition state between the PSC and class 0 YSO is still not possible to observe. To determine the conditions for the formation of protostellar disks, it is important to perform numerical modeling of the initial stages of the collapse of PSCs and to investigate the formation and evolution of the internal structure of the PSC.
In the simulations of the collapse of magnetic rotating PSCs in the ideal MHD approximation, disks are not formed or very small geometrically thick disks are formed, which does not agree with the observations of protostellar disks (Mellon and Li 2008). This is due to the fact that the frozen-in magnetic field transports the specific angular momentum too quickly from the central part of the cloud. This so-called catastrophic magnetic braking can be weakened due to the action of magnetic ambipolar diffusion, Ohmic dissipation, and/or turbulence allowing for the formation of the protostellar disks (Black and Scott 1982, Mouschovias 1991, Hennebelle and Ciardi 2009, Tsukamoto et al. 2017, Zhao et al. 2020). However, the exact conditions for the formation of protostellar disks are not determined because of large difference between the initial conditions and numerical models of the PSC. Modern simulations are mainly concentrated on the accretion stages of the collapse of solar mass PSC (see, e.g., Hennebelle and Fromang 2008, Zhao et al. 2020). Investigation of the initial stages of collapse will make it possible to more accurately determine the conditions for the formation of protostellar disks and come closer to solution of the problem of magnetic braking catastrophe.
Previously, we numerically simulated the isothermal collapse of rotating magnetic PSCs and found that the hierarchical structure of the cloud forms at this stage (Khaibrakhmanov et al. 2021, Kargaltseva et al. 2021). In this paper, we further develop our approach and analyze the efficiency of the magnetic braking at the isothermal stage of the collapse by simulating the collapse for various initial magnetic energies of the cloud. In Section 2, we describe the problem setup and the code Enlil used for simulations. The general picture of the hierarchical structure of the collapsing PSC is outlined in Section 3.1. Dynamics of the collapse in clouds with different initial magnetic energies is investigated in Section 3.2. Section 3.3 analyzes the role of the Ohmic dissipation and magnetic ambipolar diffusion in the evolution of the magnetic flux of the cloud. Section 4 presents main conclusions and discussion of the results.
2 Problem statement and numerical code
We consider a homogeneous spherically symmetric rotating magnetic PSC with mass
The initial state of the cloud is determined by the ratios of thermal, rotational, and magnetic energies of the cloud to the modulus of its gravitational energy:
The simulations are carried out using the two-dimensional MHD code Enlil (Dudorov et al. 1999, Dudorov and Zhilkin 1999). To solve the equations of ideal MHD, the code utilizes the quasi-monotone TVD scheme of the third order of approximation in the spatial variable and the first order of approximation in time. Poison’s equation is solved with an implicit alternating direction method. The generalized Lagrange multiplier method is used to clean up the divergence of the magnetic field. An adaptive moving mesh is used with
3 Results
To investigate the influence of the magnetic field on the collapse, we set the thermal and rotational parameters to
In the following, we use the characteristic time of the collapse of the magnetic rotating PSC
3.1 Hierarchical structure of the collapsing protostellar cloud
First, let us discuss the general picture of the isothermal collapse of the magnetic rotating PSC using run II as a reference. This run with a moderate magnetic field has been analyzed in detail in our previous paper (Kargaltseva et al. 2021).
In Figure 1, we present the structure of the collapsing PSC at the end of the dynamical collapse,
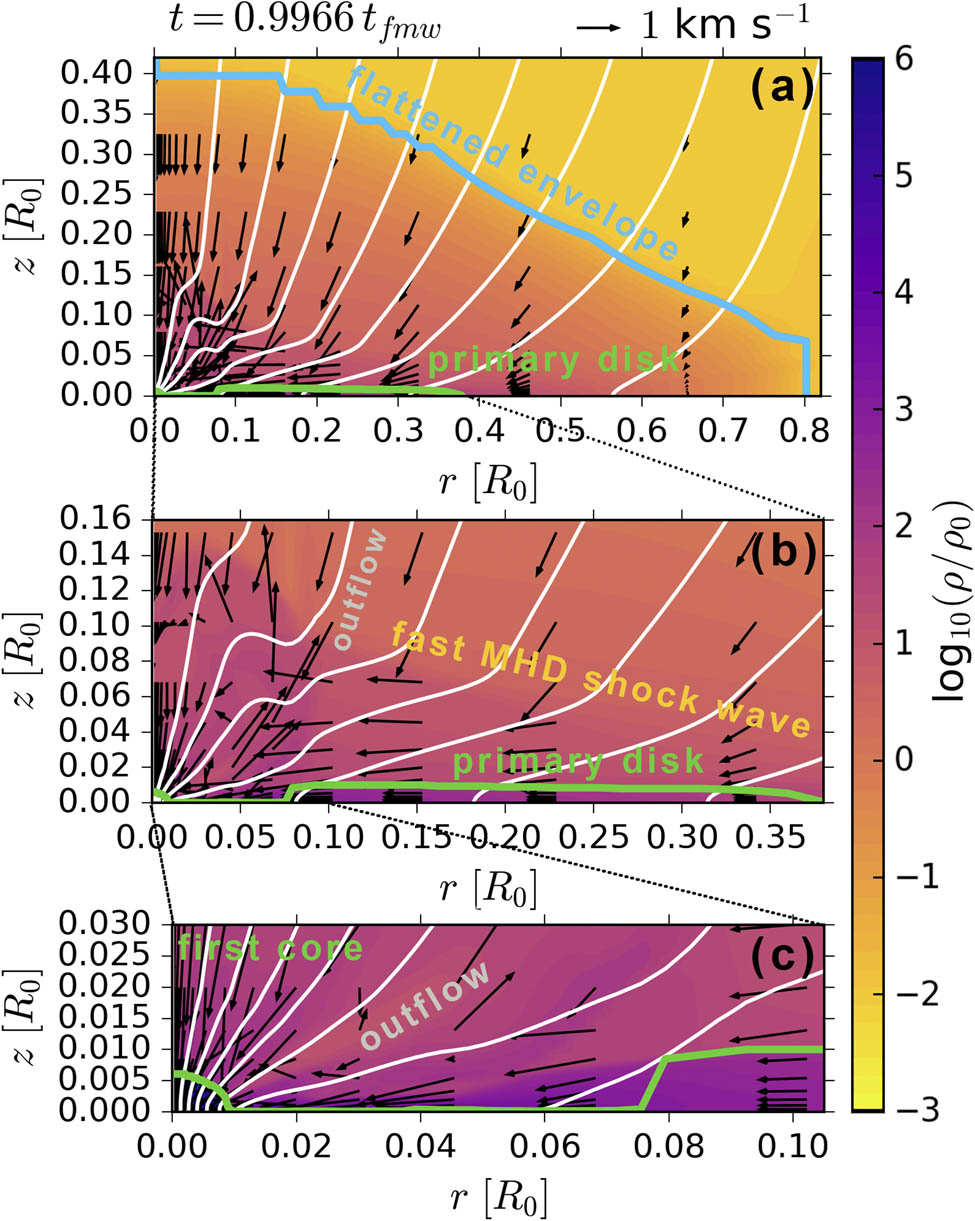
Distribution of density (color filling), velocity field (arrows), and poloidal magnetic field (white lines) in the simulation of the collapse of the magnetic rotating PSC of mass
After the formation of the primary disk, a fast MHD shock wave moves from its boundary nearly upwards (see Figure 1(b)). Magnetic field lines are bent and strong toroidal magnetic field is generated behind the shock wave front.
Soon after the formation of the first core, quasi-magnetostatic equilibrium is violated near its boundary, and an outflow arises in this region, propagating along the lines of the magnetic field (see Figure 1(c)).
According to our simulations, the magnetic field geometry changes through the internal hierarchy of the cloud. The magnetic field has a quasi-radial geometry,
The picture of the collapse discussed earlier demonstrates the leading role of the primary disks in the evolution of the collapsing PSC at the initial stages of collapse. The primary disk is the main reservoir of mass, angular momentum, and magnetic flux feeding the first core and thus determining the characteristics of the protostellar disk forming during further evolution of the system.
3.2 Influence of the magnetic field on the dynamics of the collapse
Let us analyze the effect of the magnetic field on the dynamics of the collapse of rotating magnetic PSCs, paying special attention to the primary disks.
In Figure 2, we demonstrate the structure of the PSC in runs I (left panels), II (middle panels), and III (right panels) at four different time moments after the formation of the primary disk. We plot two-dimensional distribution of the specific angular momentum to investigate the efficiency of magnetic braking in each run.
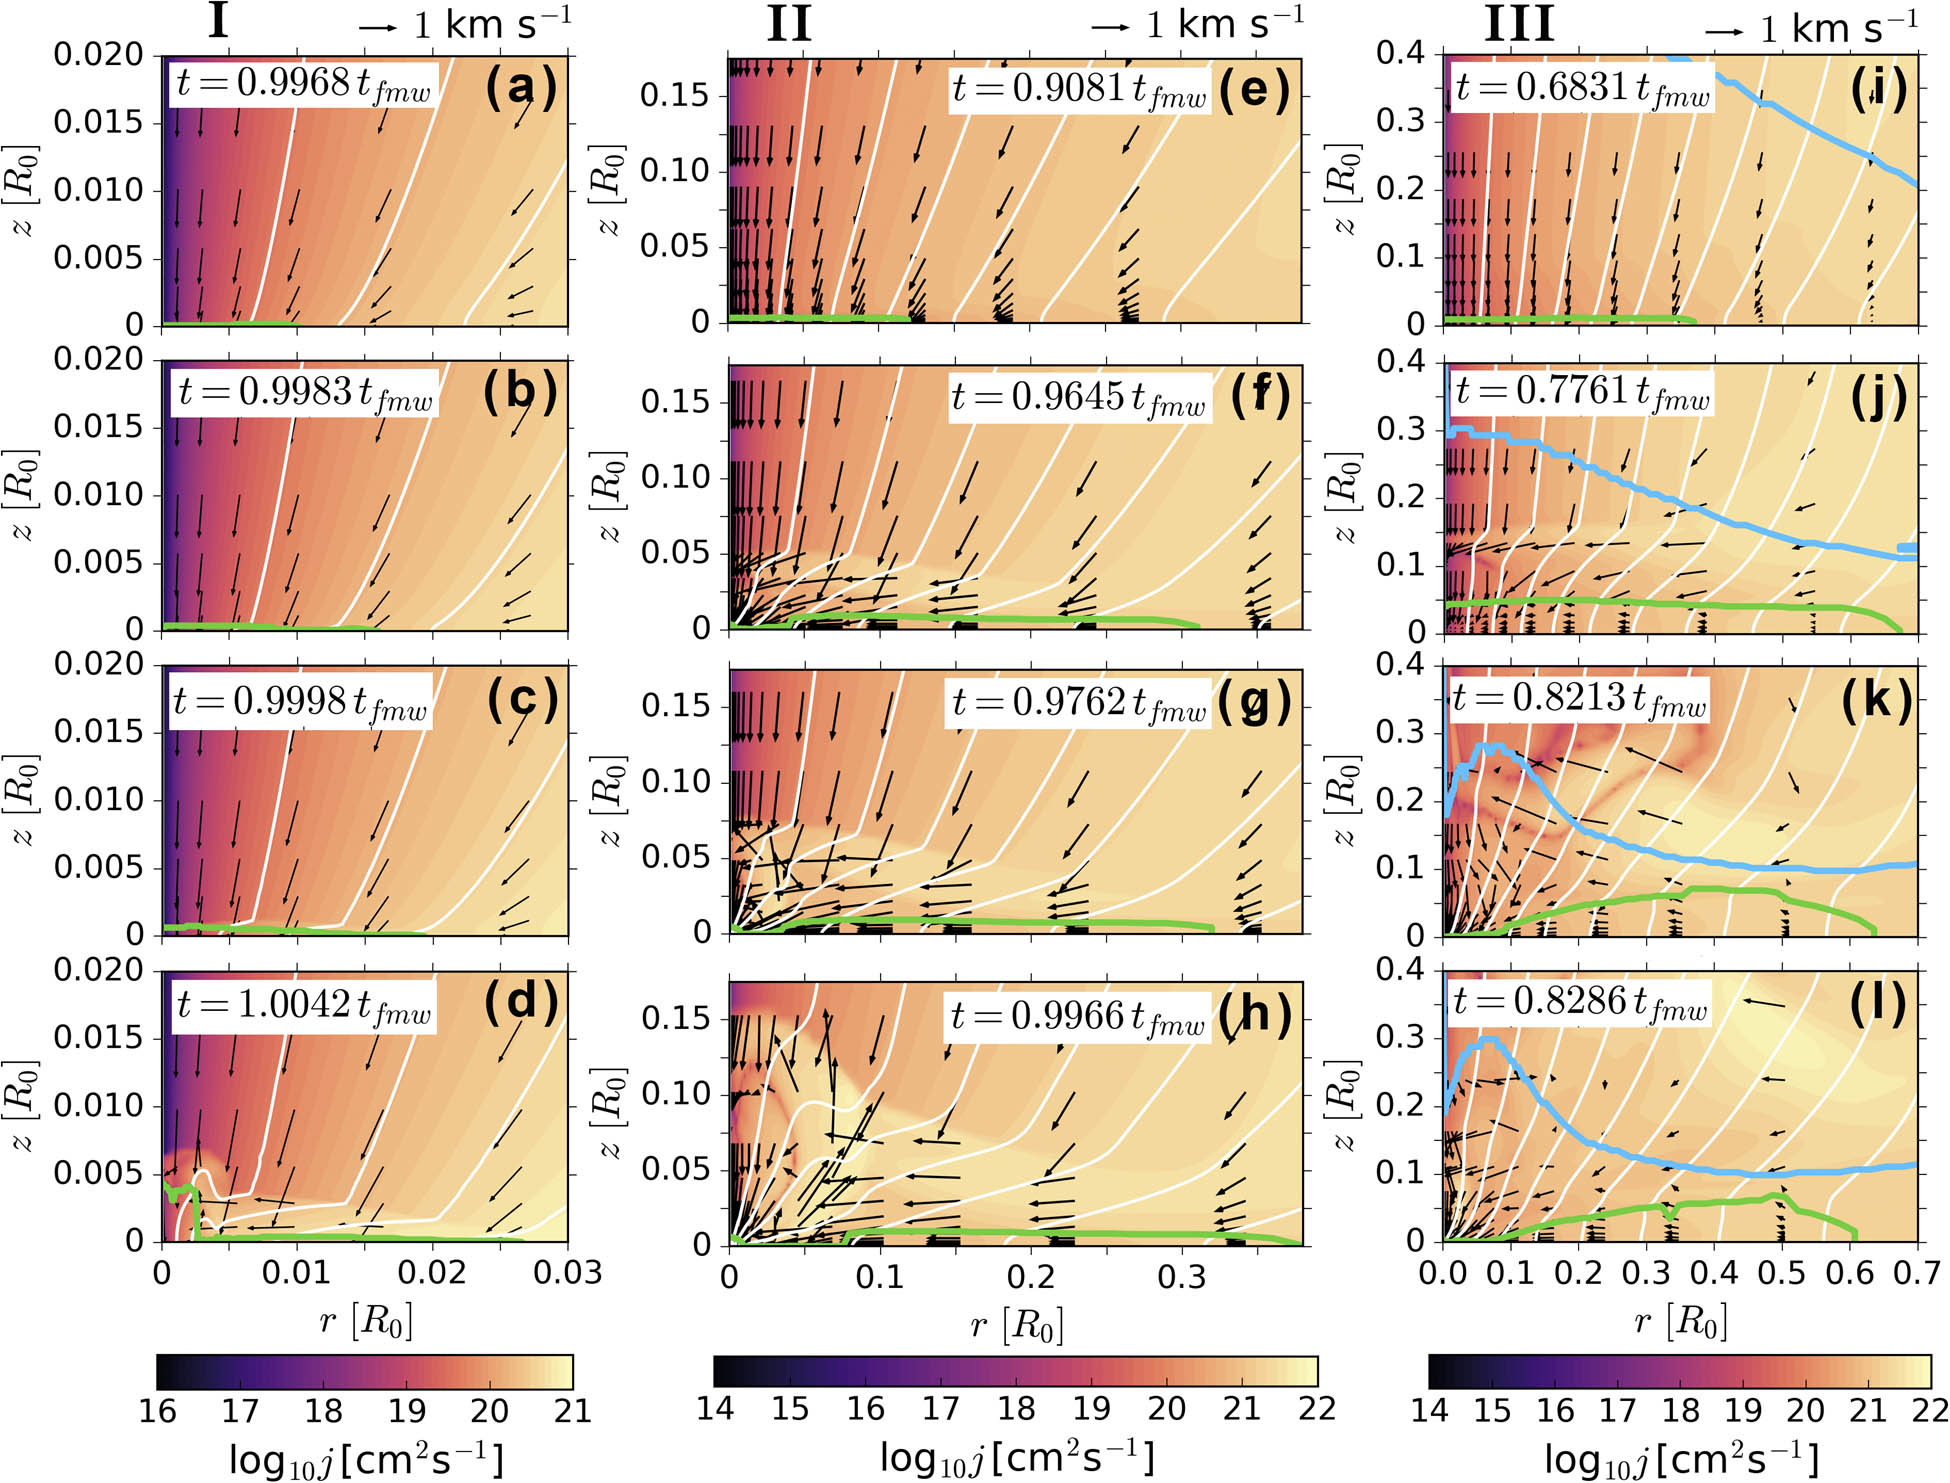
Distribution of the specific angular momentum (color filling), velocity field (arrows), and poloidal magnetic field (white lines) in the simulations with
Figure 2 shows that the hierarchical structure of the collapsing PSC discussed in Section 3.1 forms in all considered runs. During the collapse, primary disks grow in size. For example, the radius of the primary disk in run I increases from
The characteristics of primary disks, dynamics of the outflow, and efficiency of the magnetic braking change with
The size of the region of efficient magnetic braking bounded by the front of the fast MHD shock wave increases with
The size of the outflow region by the end of the dynamical collapse also increases with the increasing role of the magnetic field, since the outflow is driven by the electromagnetic force.
To analyze the dynamics of the collapse in more detail, we plot the profiles of the radial and azimuthal velocities along the equatorial plane for runs I, II, and III in Figure 3.
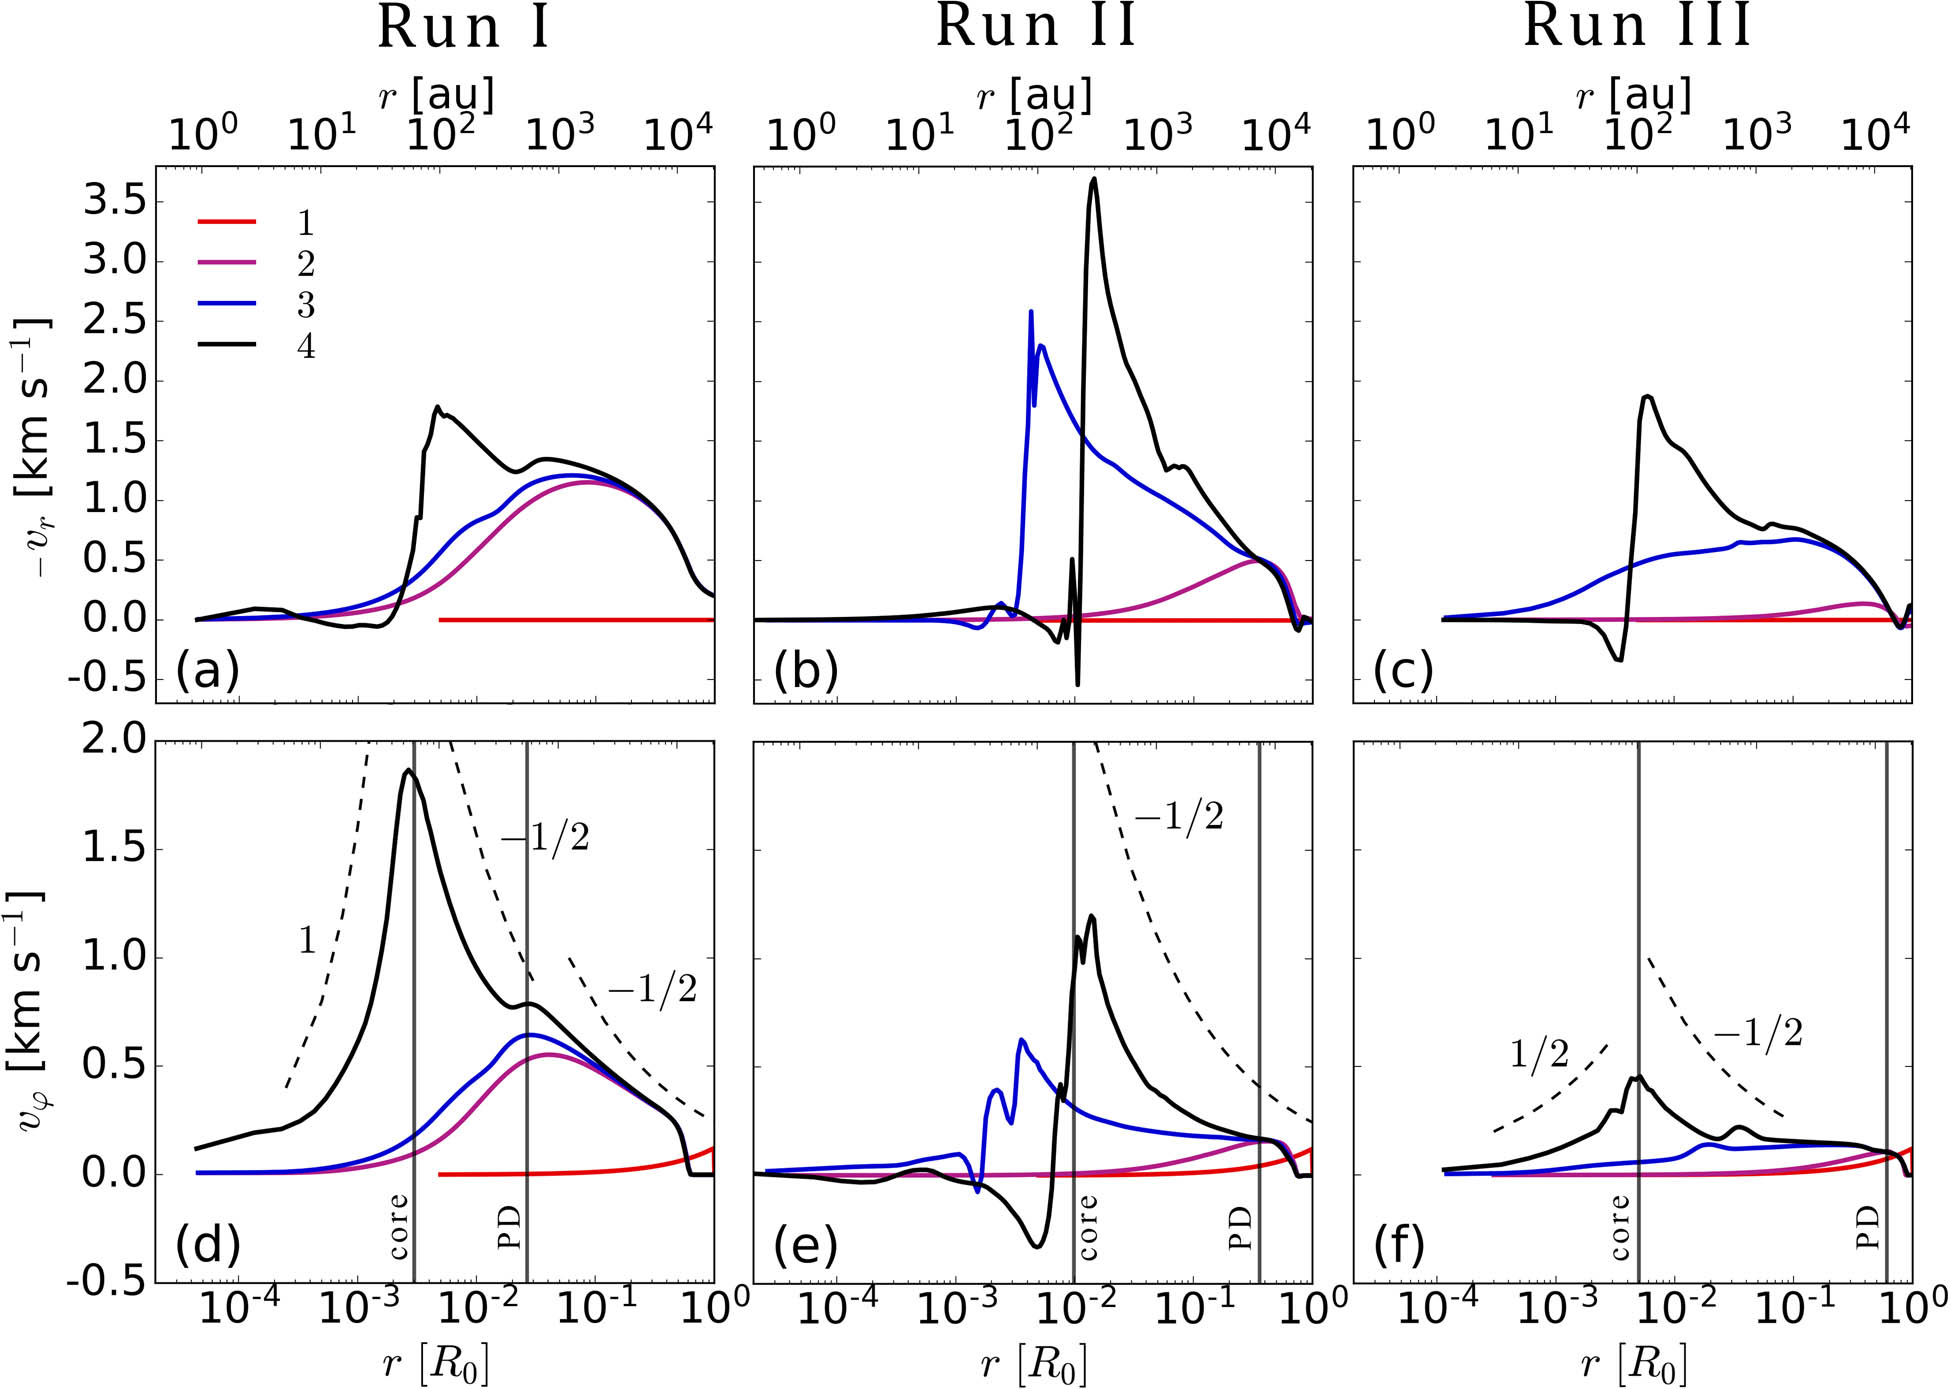
Profiles of radial velocity (
At the initial moment of time (lines 1), the cloud rotates rigidly, so that the azimuthal velocity increases with distance as
The azimuthal velocity becomes comparable to the radial one at the boundary of the first core,
In runs with the moderate magnetic field (Figure 3(b) and (e)) and the strong magnetic field (Figure 3(d) and (f)), the velocity profiles are different from the velocity profiles in the case of weak magnetic field.
In run II , the first core almost does not rotate by the end of the simulation. The region between the first core and the primary disk,
In run III, the first core rotates differentially, but not in the solid state by the end of the simulation. The inner part of the primary disk rotates with the Keplerian speed, while the outer part has almost constant azimuthal velocity. The rotation speed is minimum compared to runs I and II, which implies very efficient magnetic braking of the disk.
In both runs II and III
3.3 Role of dissipative MHD effects
In this section, we analyze the influence of ambipolar diffusion and Ohmic dissipation on the magnetic field strength in the collapsing PSC. We consider run II as a reference one. To investigate the role of the dissipative MHD effects in the evolution of the cloud, we performed runs within the ideal MHD limit, as well as taking into account Ohmic dissipation, magnetic ambipolar diffusion, and both types of diffusion.
The efficiency of magnetic diffusion depends on the level of ionization. In Figure 4, we plot the vertical profiles of the ionization fraction,
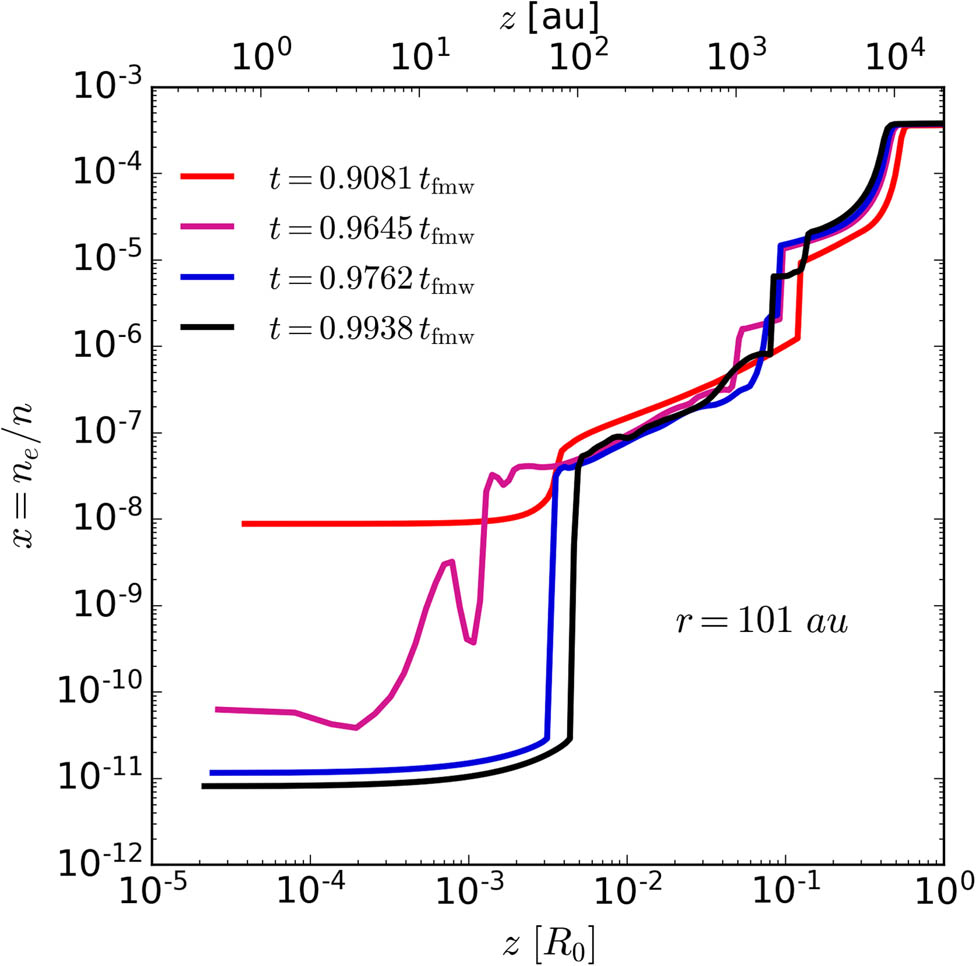
Profiles of the ionization fraction,
In Figure 5, we plot corresponding vertical profiles of the radial component of the magnetic field
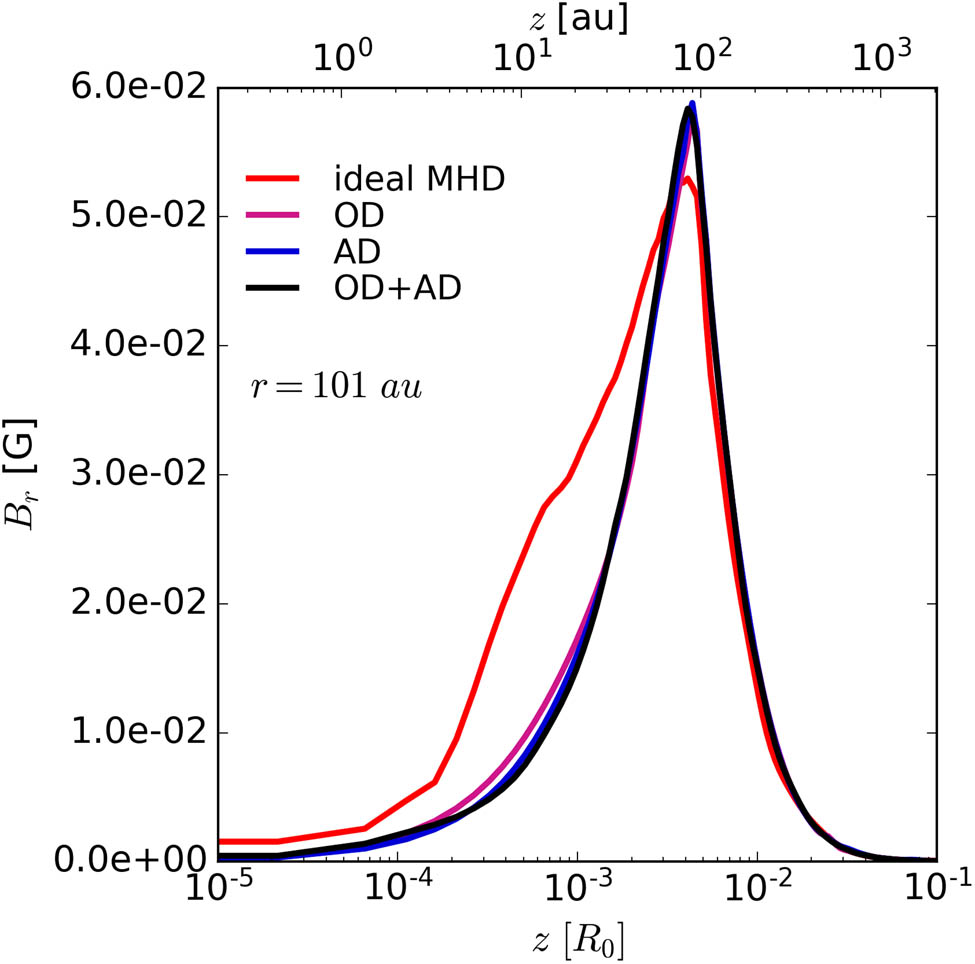
Vertical profiles of the radial component of the magnetic field
Inside the first core, the strength of
4 Conclusions and discussion
We performed numerical simulations of the collapse of rotating magnetic PSCs with mass of
The simulations have shown that the formation of the hierarchical structure of the PSC found in our previous works (Khaibrakhmanov et al. 2021, Kargaltseva et al. 2021) is the universal property of the collapsing rotating magnetic PSCs. The hierarchy consists of flattened cloud’s envelope with the magnetostatic primary disk inside. The first core forms in the central part of the primary disk. The primary disk acts as a reservoir of mass, angular momentum, and magnetic flux for the protostar and further forming protostellar disk. Therefore, the characteristics of primary disks are of great importance from the point of view of protostellar disks formation.
Properties and evolution of the structures at each level of the hierarchy strongly depends on the initial magnetic energy of the cloud. The radius of the primary disk increases with
The efficiency of the magnetic braking increases with the initial magnetic energy of the cloud. The region of magnetic braking lies behind the front of the fast MHD shock wave propagating out of the primary disk’s surface along the initial magnetic field direction. The magnetic field lines are bent behind the shock front and strong toroidal magnetic field is generated, which drives the magnetic braking. This region grows in time as the shock wave travels into the envelope. In the case of weak initial magnetic field,
Rotational evolution of the cloud depends significantly on the
According to our simulations, the size of the outflow region at the end of the dynamical collapse increases with
The “dead” zone with the low ionization fraction,
In future, we plan to develop our approach and investigate the hierarchy of the collapsing rotating magnetic PSCs in application to more realistic initial configurations of the cloud. Construction of the synthetic continuum emission maps and polarization maps of collapsing PSCs on the basis of our simulations will allow to interpret observations of class 0 YSOs and analyze the conditions for the formation of protostellar disks.
Acknowledgements
The authors thank anonymous referee for useful comments.
-
Funding information: This work is financially supported by the Russian Science Foundation (project 19-72-10012).
-
Author contributions: All authors have accepted responsibility for the entire content of this manuscript and approved its submission.
-
Conflict of interest: The authors state no conflict of interest.
References
Andre P, Ward-Thompson D, Barsony M. 1993. Submillimeter continuum observations of rho Ophiuchi A: The candidate protostar VLA 1623 and prestellar clumps. Astrophys J. 406:122. 10.1086/172425Search in Google Scholar
Andre P. 1995. Low-mass protostars and protostellar stages. Astrophys Space Sci. 224(1–2):29. 10.1007/978-94-011-0147-9_6Search in Google Scholar
Belloche A. 2013. Observation of rotation in star forming regions: clouds, cores, disks, and jets. In: Hennebelle P, Charbonnel C, editors. Role and mechanisms of angular momentum transport during the formation and early evolution of stars, Evry Schatzman School 2012. EAS Publications Series. Vol. 62, p. 25. 10.1051/eas/1362002Search in Google Scholar
Bergin EA, Tafalla M. 2007. Cold dark clouds: the initial conditions for star formation. Annu Rev Astron Astrophys. 45(1):339–396. 10.1146/annurev.astro.45.071206.100404Search in Google Scholar
Black DC, Scott EH. 1982. A numerical study of the effects of ambipolar diffusion on the collapse of magnetic gas clouds. Astrophys J. 263:696–715. 10.1086/160541Search in Google Scholar
Carey SJ, Clark FO, Egan MP, Price SD, Shipman RF, Kuchar TA. 1998. The physical properties of the midcourse space experiment galactic infrared-dark clouds. Astrophys J. 508:721–728. 10.1086/306438Search in Google Scholar
Caselli P, Benson PJ, Myers PC, Tafalla M. 2002. Dense cores in dark clouds. XIV. N2H+ (1-0) maps of dense cloud cores. Astrophys J. 572(1):238–263. 10.1086/340195Search in Google Scholar
Crutcher RM. 2012. Magnetic fields in molecular clouds. Annu Rev Astron Astrophys. 50:29–63. 10.1007/BFb0102095Search in Google Scholar
Dudorov AE, Sazonov YuV. 1987. Hydrodynamical collapse of interstellar clouds. IV. The ionization fraction and ambipolar diffusion. Nauchnye Informatsii. 63:68. Search in Google Scholar
Dudorov AE, Zhilkin AG, Kuznetsov OA. 1999. Numerical simulations of the astrophysical MHD flows. Numer Astrophys Astrophys Space Sci Library. 240:389. 10.1007/978-94-011-4780-4_116Search in Google Scholar
Dudorov AE, Zhilkin AG. 1999. MHD-Collapse of protostellar clouds. Astron Astrophys Trans. 19:91–100. 10.1080/10556799908203040Search in Google Scholar
Dudorov AE, Khaibrahmanov SA. 2017. Hierarchical structure of the interstellar molecular clouds and star formation. Open Astron. 26(1):285–292. 10.1515/astro-2017-0428Search in Google Scholar
Dunham MM, Stutz AM, Allen LE, Evans NJ, Fischer WJ, Megeath ST, et al. 2014. The evolution of protostars: Insights from ten years of infrared surveys with Spitzer and Herschel. In: Beuther H, Klessen RS, Dullemond CP, Henning T, editors. Protostars and Planets VI. Tucson: University of Arizona Press. Vol. 914. p. 195–218. 10.2458/azu_uapress_9780816531240-ch009Search in Google Scholar
Galametz M, Maury A, Girart JM, Rao R, Zhang Q, Gaudel M, et al. 2020. An observational correlation between magnetic field, angular momentum and fragmentation in the envelopes of Class 0 protostars?. Astron Astrophys. 644(A47):19. 10.1051/0004-6361/202038854Search in Google Scholar
Girart JM, Rao R, Marrone DP. 2006. Magnetic fields in the formation of sun-like stars. Science. 313(5788):812–814. 10.1126/science.1129093Search in Google Scholar PubMed
Goodman AA, Benson PJ, Fuller GA, Myers PC. 1993. Dense cores in dark clouds. VIII. Velocity gradients. Astrophys J. 406:528–547. 10.1086/172465Search in Google Scholar
Hennebelle P, Fromang S. 2008. Magnetic processes in a collapsing dense core-I. Astron Astrophys. 477:9–24. 10.1051/0004-6361:20078309Search in Google Scholar
Hennebelle P, Ciardi A. 2009. Disk formation during collapse of magnetized protostellar cores. Astron Astrophys. 506(2):L29–32. 10.1051/0004-6361/200913008Search in Google Scholar
Hull CLH, Zhang Q. 2019. Interferometric observations of magnetic fields in forming stars. Front Astron Space Sci. 6:3. 10.3389/fspas.2019.00003Search in Google Scholar
Kargaltseva NS, Khaibrakhmanov SA, Dudorov AE, Zhilkin AG. 2021. Primary disks and their observational appearance in collapsing magnetic rotating protostellar clouds. Bull Lebedev Phys Inst. 48(9):268. 10.3103/S1068335621090050Search in Google Scholar
Khaibrakhmanov SA, Kargaltseva NS, Dudorov AE, Zhilkin AG. 2021. Simulations of the isothermal collapse of magnetic rotating protostellar clouds. Astron Rep. 65(8):693–704. 10.1134/S1063772921090043Search in Google Scholar
Larson RB. 1969. Numerical calculations of the dynamics of collapsing proto-star. Mon Not R Astron Soc. 145:271. 10.1093/mnras/145.3.271Search in Google Scholar
Li H-B. 2021. Magnetic fields in molecular clouds-observation and interpretation. Galaxies. 9(2):41. 10.3390/galaxies9020041Search in Google Scholar
Lee C-F, Kwon W, Jhan K-S, Hirano N, Hwang H-C, Lai S-P, et al. 2019. A Pseudodisk threaded with a toroidal and pinched poloidal magnetic field morphology in the HH 211 protostellar system. Astrophys J. 879(2):101. 10.3847/1538-4357/ab2458Search in Google Scholar
Maureira MJ, Arce HG, Dunham MM, Mardones D, Guzman AE, Pineda JE, et al. 2020. ALMA observations of envelopes around first hydrostatic core candidates. Mon Not R Astron Soc. 499(3):4394. 10.1093/mnras/staa2894Search in Google Scholar
Masunaga H, Inutsuka Sh-i. 2000. A radiation hydrodynamic model for protostellar collapse. II. The second collapse and the birth of a protostar. Astrophys J. 531:350–365. 10.1086/308439Search in Google Scholar
Mellon RR, Li Z-Y. 2008. Magnetic braking and protostellar disk formation: The ideal MHD limit. Astrophys J. 681:1356. 10.1086/587542Search in Google Scholar
Morii K, Sanhueza P, Nakamura F, Jackson JM, Li S, Beuther H, et al. 2021. The ALMA Survey of 70mum Dark High-mass Clumps in Early Stages (ASHES). IV. Star formation signatures in G023.477. eprint arXiv:2109.01231. 10.3847/1538-4357/ac2365Search in Google Scholar
Mouschovias TCh. 1991. Magnetic braking, ambipolar diffusion, cloud cores, and star formation: natural length scales and protostellar masses. Astrophys J. 373:169. 10.1086/170035Search in Google Scholar
Myers PC, Heyer M, Snell RL, Goldsmith PF. 1988. Dense cores in dark clouds. V. CO Outflow. Astrophys J. 324:907–919. 10.1086/165948Search in Google Scholar
Ohashi N, Hayashi M, Ho PTP, Momose M. 1997. Interferometric imaging of IRAS 04368.2557 in the L1527 molecular cloud core: a dynamically infalling envelope with rotation. Astrophys J. 475:211. 10.1086/303533Search in Google Scholar
Ohashi N, Saigo K, Aso Y, Aikawa Y, Koyamatsu S, Machida MN, et al. 2014. Formation of a Keplerian disk in the infalling envelope around L1527 IRS: transformation from infalling motions to Kepler motions. Astrophys J. 796(2):131. 10.1088/0004-637X/796/2/131Search in Google Scholar
Persson MV, Harsono D, Tobin JJ, van Dishoeck EF, Jorgensen JK, Murillo N, et al. 2016. Constraining the physical structure of the inner few 100 AU scales of deeply embedded low-mass protostars. Astron Astrophys. 590(A33):15. 10.1051/0004-6361/201527666Search in Google Scholar
Pineda JE, Zhao B, Schmiedeke A, Segura-Cox DM, Caselli P, Myers PC, et al. 2019. The specific angular momentum radial profile in dense cores: improved initial conditions for disk formation. Astrophys J. 882(2):103. 10.3847/1538-4357/ab2cd1Search in Google Scholar
Tobin JJ, Sheehan PD, Megeath ST, Diaz-Rodriguez AK, Offner SSR, Murillo NM et al. 2020. The VLA/ALMA nascent disk and multiplicity (VANDAM) survey of orion protostars. II. A statistical characterization of class 0 and class i protostellar disks. Astrophys J. 890(2):130. 10.3847/1538-4357/ab6f64Search in Google Scholar
Tsukamoto Y, Okuzumi S, Iwasaki K, Machida MN, Inutsuka S. 2017. The impact of the Hall effect during cloud core collapse: Implications for circumstellar disk evolution. Publ Astron Soc Jpn. 69(6):95. 10.1093/pasj/psx113Search in Google Scholar
Wiseman J, Wootten A, Zinnecker H, McCaughrean M. 2001. The flattened, rotating molecular gas core of protostellar jet HH 212. Astrophys J. 550(1):L87–L90. 10.1086/319474Search in Google Scholar
Zhao B, Tomida K, Hennebelle P, Tobin JJ, Maury A, Hirota T, et al. 2020. Formation and evolution of disks around young stellar objects. Space Sci Rev. 216(3):43. 10.1007/s11214-020-00664-zSearch in Google Scholar PubMed PubMed Central
Zhilkin AG, Pavlyuchenkov YaN, Zamozdra SN. 2009. Modeling of protostellar clouds and their observational properties. Astron Rep. 53(7):590–604. 10.1134/S1063772909070026Search in Google Scholar
© 2022 Natalya S. Kargaltseva et al., published by De Gruyter
This work is licensed under the Creative Commons Attribution 4.0 International License.
Articles in the same Issue
- Research Articles
- Deep learning application for stellar parameters determination: I-constraining the hyperparameters
- Explaining the cuspy dark matter halos by the Landau–Ginzburg theory
- The evolution of time-dependent Λ and G in multi-fluid Bianchi type-I cosmological models
- Observational data and orbits of the comets discovered at the Vilnius Observatory in 1980–2006 and the case of the comet 322P
- Special Issue: Modern Stellar Astronomy
- Determination of the degree of star concentration in globular clusters based on space observation data
- Can local inhomogeneity of the Universe explain the accelerating expansion?
- Processing and visualisation of a series of monochromatic images of regions of the Sun
- 11-year dynamics of coronal hole and sunspot areas
- Investigation of the mechanism of a solar flare by means of MHD simulations above the active region in real scale of time: The choice of parameters and the appearance of a flare situation
- Comparing results of real-scale time MHD modeling with observational data for first flare M 1.9 in AR 10365
- Modeling of large-scale disk perturbation eclipses of UX Ori stars with the puffed-up inner disks
- A numerical approach to model chemistry of complex organic molecules in a protoplanetary disk
- Small-scale sectorial perturbation modes against the background of a pulsating model of disk-like self-gravitating systems
- Hα emission from gaseous structures above galactic discs
- Parameterization of long-period eclipsing binaries
- Chemical composition and ages of four globular clusters in M31 from the analysis of their integrated-light spectra
- Dynamics of magnetic flux tubes in accretion disks of Herbig Ae/Be stars
- Checking the possibility of determining the relative orbits of stars rotating around the center body of the Galaxy
- Photometry and kinematics of extragalactic star-forming complexes
- New triple-mode high-amplitude Delta Scuti variables
- Bubbles and OB associations
- Peculiarities of radio emission from new pulsars at 111 MHz
- Influence of the magnetic field on the formation of protostellar disks
- The specifics of pulsar radio emission
- Wide binary stars with non-coeval components
- Special Issue: The Global Space Exploration Conference (GLEX) 2021
- ANALOG-1 ISS – The first part of an analogue mission to guide ESA’s robotic moon exploration efforts
- Lunar PNT system concept and simulation results
- Special Issue: New Progress in Astrodynamics Applications - Part I
- Message from the Guest Editor of the Special Issue on New Progress in Astrodynamics Applications
- Research on real-time reachability evaluation for reentry vehicles based on fuzzy learning
- Application of cloud computing key technology in aerospace TT&C
- Improvement of orbit prediction accuracy using extreme gradient boosting and principal component analysis
- End-of-discharge prediction for satellite lithium-ion battery based on evidential reasoning rule
- High-altitude satellites range scheduling for urgent request utilizing reinforcement learning
- Performance of dual one-way measurements and precise orbit determination for BDS via inter-satellite link
- Angular acceleration compensation guidance law for passive homing missiles
- Research progress on the effects of microgravity and space radiation on astronauts’ health and nursing measures
- A micro/nano joint satellite design of high maneuverability for space debris removal
- Optimization of satellite resource scheduling under regional target coverage conditions
- Research on fault detection and principal component analysis for spacecraft feature extraction based on kernel methods
- On-board BDS dynamic filtering ballistic determination and precision evaluation
- High-speed inter-satellite link construction technology for navigation constellation oriented to engineering practice
- Integrated design of ranging and DOR signal for China's deep space navigation
- Close-range leader–follower flight control technology for near-circular low-orbit satellites
- Analysis of the equilibrium points and orbits stability for the asteroid 93 Minerva
- Access once encountered TT&C mode based on space–air–ground integration network
- Cooperative capture trajectory optimization of multi-space robots using an improved multi-objective fruit fly algorithm