Evaluation of color matching of three single-shade composites employing simulated 3D printed cavities with different thicknesses using CIELAB and CIEDE2000 color difference formulae
-
Engin Kariper


Abstract
This study assessed the color-matching capability of three single-shade composites that employ simulated resin 3D-printed cavities with different cavity depths using CIELAB and CIEDE2000 formulas. A cylindrical model with standardized cavities was generated. One hundred and fifty blank specimens were fabricated and divided into three groups (n = 50) and then into five subgroups. The five subgroups included four groups of specimens with 0.5, 1, 2, and 4 mm cavities and a control group of specimens without cavities (n = 10). Cavities were filled with Vittra Unique (VU), Omnichroma (OC), and OptiShade (OS). Color measurements were done using a clinical spectrophotometer. The color differences for all composites were calculated as ΔE and ΔE 00 using CIELAB coordinates. The color parameter data were analyzed (α = 0.05). OS had significantly lower ∆E and ∆E 00 values than the other composites for all layer thicknesses (p < 0.05). VU, OC, and OS had the lowest ∆E and ∆E 00 values at 0.5 mm (p < 0.05). Color matching of monochromatic composites decreased as the layer thickness increased. OS achieved the best color matching in this study. Single-shade composites are important for reducing chairside time and gaining confidence in clinical practice. CIELAB and CIEDE2000 color difference formulae can be used in different studies with similar results.
1 Introduction
Resin composites are widely utilized as dental restorative materials due to their esthetics, conservative nature, low cost, and good mechanical properties, making them suitable for many clinical situations [1]. However, significant disadvantages of resin composites are abrasion, microleakage, secondary caries, polymerization shrinkage, water absorption, and color stabilization [2].
Choosing the appropriate color for composite restorations can be challenging due to various environmental and operator-dependent factors. Restoring anterior teeth with direct composites can present a challenge for clinicians due to the significant impact of color layering on the final esthetic outcome [3,4,5]. In addition to the selection of the appropriate shade, the layering of the restoration is dependent on the expertise of the clinician to understand the correlation between the translucency of the composite and the thickness of the applied layer.
The color of resin composite is influenced by pigments that interact with incoming light to produce color [3]. However, achieving color matching with surrounding tissues may require increased translucency and structural color, which is defined as the color produced by the interactions between the incident light and structured materials with different refractive indices and can be a useful tool in achieving this goal [6]. The addition of well-dispersed spherical nanoparticles smaller than 380 nm, the lower limit of visible light, to the restorative material provides structural color in dentistry [7].
The way light interacts with the dentin tubules and enamel hydroxyapatite crystals affects the color of teeth. Therefore, the final color is related to the thickness and curvature of the tooth surfaces by changing the direction of the reflected light [8,9,10,11].
Resins with the ability to shade toward adjacent tooth structures are useful for restorations. The color shift or color adjustment potential of the composite may be attributed to its mixing effect and translucency [12,13,14,15].
The shade of a resin composite is mostly determined by dyes or pigments of the resin matrix, which is referred to as “chemical coloration” [16,17,18]. The color match of the resin composite is influenced by its “blending effect” (BE), which refers to the ability of the composite to reflect and color the surrounding tooth structure, resulting in improved esthetics [19]. Manufacturers and dentists also use the term “chameleon effect” for BE [19,20].
As the thickness of the composite increases, it can become less capable of mimicking adjacent surfaces because the thickness of the composite is closely correlated with the light transmission [8].
Resin composites are the ideal choice for direct restorations in both anterior and posterior teeth due to their superior esthetic and mechanical properties. Resin composites have been associated with several issues. However, with proper technique and material selection, these potential problems can be minimized. It is important to consider the benefits of resin composites, such as their esthetic properties and conservative preparation when selecting a restorative material [21]. Resin composites are highly valued by clinicians due to their ability to shorten chair time and minimize technical sensitivity. The introduction of universal shade composites has simplified the process of selecting shades for composite restorations despite the challenges posed by environmental and operator-related variables [22]. Universal shade composites have a distinct advantage in their enhanced potential for shade adaptation. This is due to the strong interaction between perceptual components and physical components. Notably, this statement is objective and free from any subjective evaluations [1].
The use of resin-based composite for esthetic purposes originated with the introduction of composite kits that provided enhanced physical and optical properties. These kits were integrated with the Vita Classical shade guide to simplify shade selection [23,24].
CIELAB has been the primary system used in dentistry to study color and discoloration. This system calculates color changes (ΔE) using lightness–darkness and red–green and blue–yellow coordinates. + L* represents lightness, − L* represents darkness, + a* represents red, − a* represents green, + b* represents yellow, and − b* represents blue. However, since 2001, the CIE has recommended the use of CIEDE2000 (ΔE 00), a new formula that incorporates the concepts of hue and chroma and thus reinforces the importance of the original concept proposed by Munsell [25].
This study confidently evaluates the color-matching capability of three single-shade composites using simulated 3D-printed cavities with different thicknesses. The evaluation was conducted using CIELAB and CIEDE2000 formulae.
The null hypothesis stated that thickness does not affect color matching and that the use of both the CIELAB and CIEDE2000 color difference formulae would not yield similar color change measurements.
2 Materials and methods
2.1 Specimen preparation
Three types of single-shade universal composites were selected for this study. More information about the universal single-shade resin composites that have been tested and the Formlabs Temporary CB Resin composite (Formlabs, MA, USA) used to prepare standardized blank cavities in this study are presented in Table 1.
Materials used in the study
| Resin composite | Manufacturer | Type | Organic matrix | Inorganic filler | Filler w/V% |
|---|---|---|---|---|---|
| VU | FGM, Joinville, SC, Brazil | Nanohybrid | UDMA, TEGDMA | Active ingredients: photoinitiator composition (APS), co-initiators, stabilizers, and silane. Inactive ingredients: the nanospheres of a complex of silica zirconia | 82/72 |
| OC | Tokuyama, Tokyo, Japan | Supra-nanospherical | UDMA, TEGDMA | 260 nm spherical SiO2–ZrO2 | 79/68 |
| OS | Kerr Corporation, CA, USA | Nanohybrid | Bis-EMA, Bis-GMA, TEGDMA | Barium glass, silica, ytterbium trifluoride | 81/64.5 |
| FormLabs Temporary CB Resin | Formlabs, Somerville, MA, USA | Resin composite | Esterification products of 4,40-isopropylidene diphenol, ethoxylated, and 2-methyl prop-2-enoic acid diphenyl(2,4,6-trimethyl benzoyl)phosphine oxide | ||
Abbreviations: Bis-GMA = bisphenol A-glycidyl methacrylate, TEGDMA = triethylene glycol di methacrylate, UDMA = urethane dimethacrylate, Bis-EMA = bisphenol A ethoxylated dimethacrylate. The data were provided by the manufacturers.
A cylindrical model (diameter = 10 mm; height = 5 mm) with standardized cavities (diameter = 4 mm; height = 0.5, 1, 2, and 4 mm) was generated in TinkerCAD (running online, Autodesk) software (Figure 1).
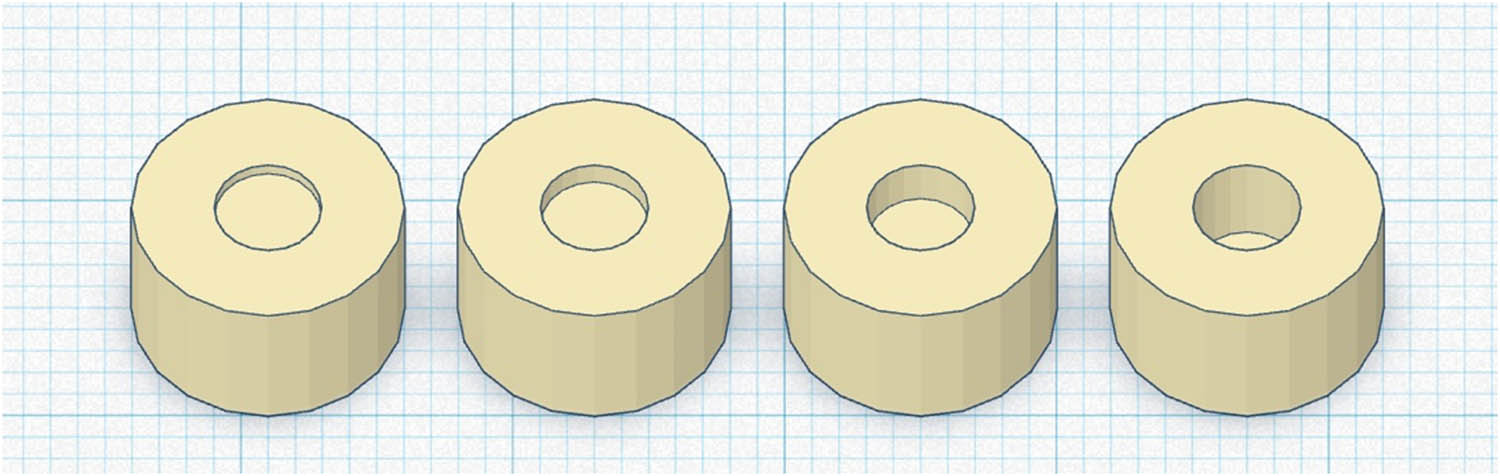
CAD view of specimens in STL format.
The tested specimens were fabricated using temporary crown and bridge (Temporary Crown and Bridge A2 Formlabs Inc., Somerville, MA, USA) resin. The resin was loaded into the PreForm (Formlabs, MA, USA) software. Using the specific exposure time provided by the software for this particular resin, the parameters were set to a layer thickness of 50 μm. Specimens were printed with the resin temperature set to 35°C using the Formlabs 2 automated printer (Formlabs, MA, USA). Formlabs Form Wash (Formlabs, MA, USA), an automatic washer using 99% isopropyl alcohol, was selected for the removal of uncured resin after printing. Post-cure was carried out with FormCure (Formlabs, MA, USA) at 60°C for 20 min, as recommended by the manufacturer [26].
One hundred and fifty blank specimens were fabricated to standardize the initial color according to the manufacturer’s instructions. The prepared specimens were divided into three groups (n = 50) and then into five subgroups (four subgroups, including specimens with 0.5, 1, 2, and 4 mm cavities and a control group of specimens without cavities) within each group (n = 10). Forty specimens of each group were prepared with simulated class I cavities. The cavities had a diameter of 4 mm and heights of 0.5, 1, 2, and 4 mm and were formed by a small cylindrical projection inside the specimens. A thin layer of light-cure adhesive was applied to the cavity walls following the manufacturer’s instructions (Clear S Bond, Kuraray, Tokyo, Japan).
The first group of specimens was filled with Vittra Unique (VU), the second group of specimens was filled with Omnichroma (OC), and the third group of specimens was filled with OptiShade (OS) single-shade universal resin. The filling of 0.5 mm cavities involved the placement of resin composite at a thickness of 0.5 mm. Similarly, 1 mm cavities were filled using a thickness of 1 mm, and 2 mm cavities were filled using a thickness of 2 mm. Then, 4 mm cavities were filled in two layers with a thickness of 2 mm, and all specimens were pressed using a mylar strip and glass slides to achieve a flat surface. The specimens underwent light polymerization for 20 s using a visible, blue, light-emitting diode light device (Valo Cordless Ultradent Products, Inc., South Jordan, UT, USA) (395–480 nm). After curing, the surfaces of the restoration and control groups were polished with 1,500-grit silicon carbide paper and finished with fine and superfine OptiDisc discs (Kerr Corporation, USA) for 30 s each. All specimens were stored in distilled water at 37°C for 24 h to ensure proper preservation.
2.2 Color measurements
Color measurements were obtained using a clinical spectrophotometer (VitaEasyShade® V VITA, Zahnfabrik, Bad Sackingen, Germany) in a custom-made viewing booth with D65 illumination (Master TL-D 90 De Luxe 18 W/965 1SL, Philips, Eindhoven, Netherlands). A custom-made viewing booth with D65 illumination was employed to mitigate the impact of external light sources and to establish a more consistent lighting environment. The spectrophotometer was calibrated for each measurement, with the detector positioned perpendicular to the surface of the sample in front of a white background (Figure 2). The spectrophotometer was set to “single tooth” mode, and the sensor was positioned in the middle of the sample. Three consecutive measurements were taken to record the mean values of L*, a*, and b* for each sample and were utilized for subsequent analysis. The luminance (L*), red–green coordinate (a*), and yellow–blue coordinate (b*) measurements were evaluated using the CIELAB color system.

Schematic representation of the color measurement setup.
The color evaluations were performed with different thicknesses (0.5, 1, 2, and 4 mm) for all three single-shade composites to obtain ΔL*, Δa*, and Δb* values. The following formula represents the total color change: ΔE = [(ΔL*)2 + (Δa*)2 + (Δb*)2]1/2 [27,28].
The ΔE 00 color differences (∆E 00 = [(ΔL*/k L S L)2 + (ΔC*/k C S C)2 + (ΔH*/k H S H)2 + R T. (ΔC*/k C S C) × (ΔH*/kH SH)]0.5) for three different single-shade composites with different thicknesses were calculated using Sharma’s CIEDE2000 color difference formula in an Excel spreadsheet [29].
2.3 Statistical analysis
The study findings were subjected to statistical analysis using the IBM SPSS Statistics 22 program. The suitability of the parameters for the normal distribution was assessed using the Kolmogorov–Smirnov and Shapiro–Wilks tests. The study evaluated the effect of material and depth on ∆E through a two-way analysis of variance (ANOVA) test, followed by the Tukey honestly significant difference test for post hoc analyses. Pearson correlation analysis was used to correlate ∆E 00 with ∆E. The level of significance was set to p < 0.05.
3 Results
When the ∆E value was evaluated in terms of both material and layer thickness, there were statistically significant differences (p = 0.000; p < 0.05). The joint influence of the material and depth had a statistically significant effect on ∆E. Moreover, the joint effect of material and depth on ∆E was also statistically significant (p = 0.000; p < 0.05). Detailed explanations of the results mentioned in Table 2 are provided in Table 3.
Evaluation of the effect of the material and layer thickness on ∆E
| ∆E | Type III sum of squares | df | Mean square | F | p |
|---|---|---|---|---|---|
| Material | 2651.279 | 2 | 1325.639 | 4087.183 | 0.000* |
| Layer thickness | 358.731 | 3 | 119.577 | 368.677 | 0.000* |
| Material × layer thickness | 73.87 | 6 | 12.312 | 37.959 | 0.000* |
Two-way ANOVA test: *p < 0.05.
Df: degree of freedom; F: F-distribution.
Variation in ∆E according to the material and depth
| ∆E VU | ∆E OC | ∆E OS | ||
|---|---|---|---|---|
| Layer thickness | Mean ± SD | Mean ± SD | Mean ± SD | p |
| 0.5 mm | 7.58 ± 0.56Aa | 8.78 ± 0.31Ba | 0.52 ± 0.28Ca | 0.000* |
| 1 mm | 12.03 ± 1.27Ab | 11.94 ± 0.54Ab | 0.59 ± 0.23Ba | 0.000* |
| 2 mm | 13.84 ± 0.62Ac | 12.11 ± 0.54Bb | 2.36 ± 0.46Cb | 0.000* |
| 4 mm | 13.61 ± 0.41Ac | 13.54 ± 0.57Ac | 3.36 ± 0.25Bc | 0.000* |
| p | 0.000* | 0.000* | 0.000* |
Two-way ANOVA test: *p < 0.05.
SD: standard deviation.
Note: Different capital letters in the lines indicate the difference between the materials. Small letters in the columns indicate the difference between the depths.
Based on the two-way ANOVA test, OS had significantly lower ∆E values than the other composites at all layer thicknesses (p < 0.05). VU and OC values showed no significant difference in ∆E values at layer thicknesses of 1 and 4 mm, while at layer thicknesses of 0.5 and 2 mm, all monochromatic composites had statistically different ∆E values (p < 0.05) (Figure 3).
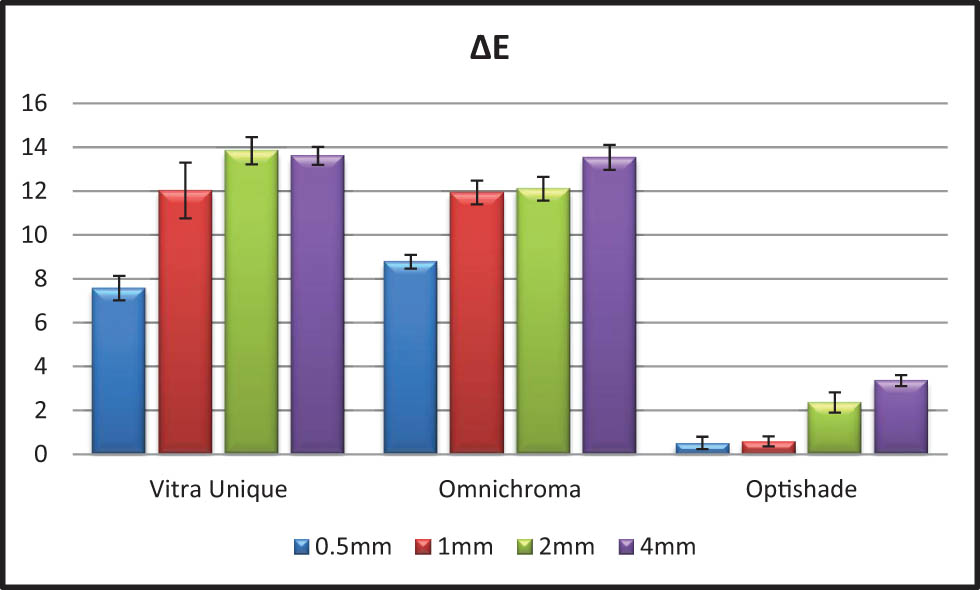
∆E values materials with different layer thicknesses.
An evaluation of the ∆E values of each material in different layers reveals that all materials had lower values at a thickness of 0.5 mm than other layer thicknesses. For VU and OS, the ∆E values were lower at 1 mm than at 2 and 4 mm, while for OC, the values at 1 and 2 mm were lower than at 4 mm (p < 0.05).
The two-way ANOVA indicates that ∆E 00 significantly varied regarding both material and layer thicknesses. Additionally, the combined effect of factors on ∆E 00 was found to be significant (p < 0.05). Detailed explanations of the results listed in Table 4 are provided in Table 5.
Evaluation of the effect of material and depth on ∆E 00
| ∆E 00 | Type III sum of squares | df | Mean square | F | p |
|---|---|---|---|---|---|
| Material | 778.853 | 2 | 389.427 | 2678.855 | 0.000* |
| Layer thickness | 169.806 | 3 | 56.602 | 389.363 | 0.000* |
| Material × layer thickness | 28.861 | 6 | 4.81 | 33.089 | 0.000* |
Two-way ANOVA test: *p < 0.05.
Df: degree of freedom; F: F-distribution.
Variation in ∆E 00 according to the material and depth
| ∆E 00 | ||||
|---|---|---|---|---|
| VU | OC | OS | ||
| Layer thickness | Mean ± SD | Mean ± SD | Mean ± SD | p |
| 0.5 mm | 3.86 ± 0.33Aa | 4.46 ± 0.20Ba | 0.29 ± 0.12Ca | 0.000* |
| 1 mm | 6.75 ± 0.89Ab | 6.62 ± 0.36Ab | 0.37 ± 0.12Ba | 0.000* |
| 2 mm | 7.95 ± 0.43Ac | 6.96 ± 0.34Bb | 1.62 ± 0.33Cb | 0.000* |
| 4 mm | 7.95 ± 0.27Ac | 7.74 ± 0.37Ac | 2.26 ± 0.15Bc | 0.000* |
| p | 0.000* | 0.000* | 0.000* | |
Two-way ANOVA test: *p < 0.05.
SD: standard deviation.
Note: Different capital letters in the lines indicate the difference between the materials. Small letters in the columns indicate the difference between the depths.
As demonstrated in Table 5, the findings revealed that all observed ΔE 00 values for VU, OC, and OS 4 mm products exceeded the established thresholds of detectability and acceptability, i.e., 0.8 and 1.8, respectively. However, this was not the case for OS with thicknesses of 0.5, 1, and 2 mm [30].
Based on the two-way ANOVA, OS had significantly lower ∆E 00 values at a thickness of 0.5 mm than at other thicknesses, and all materials had significantly lower values at a thickness of 0.5 mm than at other layer thicknesses (p < 0.05). Additionally, OS had significantly lower ∆E 00 values than the other composites at all thicknesses (p < 0.05). There was no significant difference between VU and OC at thicknesses of 1 and 4 mm. However, at a thickness of 2 mm, VU exhibited higher values than OC (p < 0.05) (Figure 4).

∆E 00 values for materials with different layer thicknesses.
The color difference values determined by both CIELAB and CIEDE2000 formulae at all thicknesses (0.5, 1, 2, and 4 mm) were statistically similar (Figure 5). The Pearson correlation test revealed a positive and statistically significant relationship between ∆E 00 and ∆E in each of the three single-shade composites at every depth (0.5, 1, 2, and 4 mm), with the exception of VU at 1 and 4 mm. There was no statistically significant relationship between ∆E 00 and ∆E for VU at depths of 1 and 4 mm (p < 0.05) (Table 6).

Values of ∆E ab and ∆E 00 in composites of varying thicknesses.
Correlation of ∆E 00 and ∆E in different materials and depths
| Material | Depth | ∆E 00 – ∆E | |
|---|---|---|---|
| Vitra Unique | 0.5 mm | r | 0.987 |
| p | 0.001* | ||
| 1 mm | r | 0.130 | |
| p | 0.720 | ||
| 2 mm | r | 0.634 | |
| p | 0.049* | ||
| 4 mm | r | −0.052 | |
| p | 0.887 | ||
| OC | 0.5 mm | r | 0.984 |
| p | 0.001* | ||
| 1 mm | r | 0.989 | |
| p | 0.001* | ||
| 2 mm | r | 0.992 | |
| p | 0.001* | ||
| 4 mm | r | 0.988 | |
| p | 0.001* | ||
| OS | 0.5 mm | r | 0.945 |
| p | 0.001* | ||
| 1 mm | r | 0.882 | |
| p | 0.001* | ||
| 2 mm | r | 0.992 | |
| p | 0.001* | ||
| 4 mm | r | 0.933 | |
| p | 0.001* |
Pearson correlation analysis: *p < 0.05.
4 Discussion
In dentistry research, color comparison requires considering various factors, including underlying color, storage conditions, the instrument used for the measurement, the background used for readings, the color-changing method, and the color difference evaluation formula (such as CIELAB or CIEDE2000) used for calculating color changes [25]. However, failure to report or reproduce all criteria in future studies will result in conflicting and incomparable data in the literature [25]. According to the International Commission on Illumination (CIE), color differences can be quantified using both CIELAB and CIEDE2000 (∆E ab and ∆E 00) [16,31].
To capture color parameters relevant to human color perception in all three regions of the color space, the CIE established the L* a* b* color space in 1978. The system utilizes the values of a* and b* as chromaticity coordinates and L* as a lightness value, which is proportional to the Munsell scale [31]. To further improve the CIELAB formula, which measures the difference between two colors, the CIE developed CIEDE2000, a more intricate formula, in 2001. Comparative studies of CIELAB and CIEDE2000 have shown that CIEDE2000 is a more reliable measure than CIELAB. According to these reports, the CIEDE2000 formula almost precisely reflects color differences as perceived by human eyes, as proven by the nearly identical results of the observer [29,32,33]. While CIELAB is the most commonly employed technique, CIEDE2000 is a more sophisticated and complex system that yields results that are more consistent with visual results [29,34].
The quality of color matching between dental restorations and/or adjacent natural teeth is largely contingent upon the degree and axis of the color difference. The smallest color difference that can be perceived by an observer is referred to as the just-noticeable difference or perceptibility threshold (PT). A 50:50% PT denotes a scenario in which 50% of the observers discern a discrepancy in color between two objects, whereas the remaining 50% perceive no such difference. Similarly, the difference in color that is deemed acceptable for 50% of the observers corresponds to a 50:50% acceptability threshold (AT). In other words, 50% of the observers would consider the dental restoration to require color correction, while the other 50% would consider the color difference acceptable. The difference between these two thresholds is referred to as industry tolerance and indicates the extent to which we can deviate from the perceptible difference while still achieving an acceptable color match. The results obtained from studies investigating the effects of PT and AT have been variable, with differing outcomes reported in different studies conducted over a number of years [35,36]. The values are determined through the utilization of the CIELAB formula. Different surfaces may not be directly comparable with the results obtained from this formula and, therefore, should be interpreted with caution. Additionally, it is important to avoid comparing results obtained using the CIEDE2000 formula with those obtained using the CIELAB formula [25].
Both systems, CIELAB and CIEDE2000, were employed and compared in the present study. At a thickness of 0.5 mm, when ∆E 00 and ∆E values were examined, both systems had statistically significantly higher color change values with OC than with VU and OS. Although the CIEDE2000 color measurement system is a more sensitive calculation method, all statistically significant values for all thicknesses (0.5, 1, 2, and 4 mm) showed the same results performed with CIELAB and CIEDE2000 in this study. The statistical results were the same, although different numerical values were obtained in the two measurement systems, possibly because the same L*, a*, and b* values are used in both systems.
To achieve a good color match, it is necessary to ensure color harmony by taking reinforcements from the walls and floor of the applied cavity [16]. In this study, simulated 3D-printed resin cavities in color A2 were produced, and the color matching of monochromatic composites in different layer thicknesses was examined. The straight-line color transmission properties and diffusion balance of the resin composite affect the color matching with the underlying tooth or material. The color matching of the resin composite with the underlying tooth develops due to the reflection from the cavity floor and cavity walls. Additionally, the filler content of the composite affects whether the color transmits in a straight or diffuse manner [16]. The possible advantages offered by supra-nanotechnology are most likely seen in resin composites shaded with structural color. These composites may experience fewer color changes over time due to a reduction in photochemical degradation and discoloration. It could be argued that the pattern of filler particles matches the wavelengths of visible light [16].
Manufacturers claim that OC is a composite with the capability of matching any shade by incorporating uniformly sized, 260 nm supra-nanospherical fillers into the composite, which provides a red-to-yellow color as surrounding light passes through the resin structure [1]. OS achieved the lowest ∆E 00 and ∆E values, indicating a better BE than OC, which may be attributed to the filler content or the fact that OS offers three shades (light, medium, and dark) instead of one shade.
The influence of the color surrounding the specimen and its thickness were evaluated. When the outer cavity shade was A1, the color difference values tended to decrease as the thickness increased, as demonstrated by VU testing. Conversely, the color difference values for the other shades increased as the thickness increased [8]. The present study demonstrated comparable findings with Barros et al.; as the thickness increased, ΔE 00 values correspondingly increased for shade A2 [8].
The color of dental composites is produced by the reflection of specific wavelengths and by existing pigments [7,37]. Instead of pigments, animals such as peacocks and butterflies present their colors due to photonic crystals, which affect light propagation by periodically changing the refractive index [38]. This phenomenon can be achieved in dental composites by reflecting light at a specific wavelength using filler particles of a specific size and shape [37]. According to the manufacturer, OC is a pigment-free, single-shade composite. The optical features of the resin composite are managed by chromatic technology, which is related to the color features of the surrounding structural properties. To improve the ability to match the color of natural teeth, 260 nm spherical fillers are used to create a color from red to yellow [37]. The increased transparency of OC after polymerization increases its ability to change color.
The increased transparency after polymerization increases the ability to change color, as shown by color matching in VU. It has been observed that composites with high color-matching potential allow for satisfactory esthetic restorations and can compensate for failures related to color selection. The advanced polymerization system (APS) used by VU could have led to better performance in terms of color change [39]. The utilization of APS technology as a transparent photoinitiator in VU may have potentially resulted in an improved color change. Additionally, the product is free of bisphenol A-glycidyl methacrylate (Bis-GMA) and contains triethylene glycol dimethacrylate (TEGDMA), urethane dimethacrylate (UDMA), and a smaller quantity of camphorquinone, as indicated by the manufacturer. The BE for VU is influenced by the surrounding color, with a greater BE occurring when the surrounding color of VU was light (A1); increased thickness led to cavity hues, and thick layer composites were employed [8]. This study partially agrees with the results of Barros et al., who obtained an enhanced BE. In the current research, only A2 was used as the surrounding color for VU, and ∆E 00 values increased as the thickness increased. Our findings indicate that the surrounding color affects the BE, decreasing as the color becomes darker [8].
While color-matching studies commonly use composite layers thicker than 2 mm, some parts of the upper incisor’s incisal edge are less than 2 mm thick. Additionally, the impact of the dark background in the oral cavity becomes more prominent as the composite’s translucency is enhanced [40]. Therefore, when conducting research or clinical procedures, it is important to acknowledge that the transparency of single-shade composites increases after polymerization. Single-shade composites are typically used in thin layers for anterior restorations, where the oral cavity, which may appear darker in color, is reflected in the background. In the posterior region, they are applied in thicker layers and are usually supported by enamel and dentin rather than the oral cavity, which has a lighter background.
The BE was found to increase with increasing translucency [19]. When Bis-GMA, UDMA, and TEGDMA monomers were examined, it was observed that Bis-GMA had higher translucency, which increased as the amount of monomer increased. There is a correlation between the refractive indices of unfilled resin mixtures and those of cured composites between the color and translucency of conventional composites and those of low-shrinkage composites [41]. In addition, monomer content in resin composites affects color matching. Bis-GMA monomers display less color alteration than TEG-DMA and more color alteration than UDMA and Bis-EMA due to the formation of a rigid network [42]. OS containing Bis-GMA exhibited the lowest ΔE and ∆E 00 levels, which is consistent with previous research in this study [1,42]. The higher ΔE and ∆E 00 levels of VU and OC may depend on their partial content of TEGDMA and UDMA monomers. However, these results may depend on the filler content and adaptive response technology (ART) of OS. The manufacturer states that the primary filler in OS is derived from molecular suspension, which consists of spherical silica and zirconia particles. OS has an average filler ratio of 50 nm [43,44]. ART is a two-component system that comprises zirconia and silica nanoparticles arranged to reveal distinctive optical properties [44].
OS exhibits light diffusion properties that are similar to those of natural enamel. Enamel reflects light diffusely at shorter wavelengths. It reflects light specularly at longer wavelengths [44]. The zirconia and silica particles work in tandem to imitate this characteristic, leading to a more coherent restoration or the “chameleon effect.” The manufacturer claims that OS provides optimum opacity to imitate tooth structure, effectively hides the underlying background color, and blends well with the adjacent dentition, resulting in a more natural-looking restoration. This could be attributed to the variance in average particle sizes within the OS. Better polishability and smoother surfaces are attributed to a smaller average particle size.
The differences in ΔE values observed in this study could be attributed to variations in the types and sizes of inorganic and organic fillers, as well as the differences in color reflection systems [3]. The structural color and translucency of composites can be influenced by a variety of factors, including the refractive index of the organic matrix and filler content [3,45].
The null hypothesis is partially rejected due to the effect of thickness on color-matching scores and is partially accepted because the CIELAB and CIEDE scores produced similar results.
This study has certain limitations. It was conducted in vitro, and clinical conditions may vary. The translucency and the degree of conversion of the composites used in the study were not evaluated, the spectrophotometer used in the study may have introduced errors, and more detailed results may be obtained with different instruments. Additionally, since all cavities were produced from standard 3D printed resin in the present study, enamel and dentin tissue in each tooth under clinical conditions will differ. Furthermore, varying outcomes may result when the diameter of the composite samples is altered. Hence, further research is required to validate the results of this study.
5 Conclusion
The study suggests that there were differences in the absolute values calculated using the CIELAB and CIEDE2000 color difference formulae, although the difference was not statistically significant. Furthermore, the study found that the BE of OS was superior to that of OC and VU with different thicknesses.
Acknowledgments
The authors are grateful for the reviewers’ valuable comments that improved the manuscript.
-
Funding information: The authors state no funding involved.
-
Author contributions: Engin Kariper and Aylin Cilingir contributed equally to this work. All authors have accepted responsibility for the entire content of this manuscript and approved its submission.
-
Conflict of interest: The authors state no conflict of interest.
-
Data availability statement: The data sets generated during and/or analyzed during the current study are available from the corresponding author on reasonable request.
References
[1] de Abreu, J. L. B., C. S. Sampaio, E. B. Benalcázar Jalkh, and R. Hirata. Analysis of the color matching of universal resin composites in anterior restorations. Journal of Esthetic and Restorative Dentistry, Vol. 33, No. 2, 2021, pp. 269–276.10.1111/jerd.12659Search in Google Scholar PubMed
[2] Barot, T., D. Rawtani, and P. Kulkarni. Nanotechnology-based materials as emerging trends for dental applications. Reviews on Advanced Materials Science, Vol. 60, No. 1, 2021, pp. 173–189.10.1515/rams-2020-0052Search in Google Scholar
[3] Barros, M. S., P. F. D. Silva, M. L. C. Santana, R. M. F. Bragança, and A. L. Faria-e-Silva. Effects of surrounding and underlying shades on the color adjustment potential of a single-shade composite used in a thin layer. Restorative Dentistry & Endodontics, Vol. 48, No. 1, 2023, pp. 1–10.10.5395/rde.2023.48.e7Search in Google Scholar PubMed PubMed Central
[4] Reis, A., C. Higashi, and A. D. Loguercio. Re-anatomization of anterior eroded teeth by stratification with direct composite resin. Journal of Esthetic and Restorative Dentistry, Vol. 21, No. 5, 2009, pp. 304–316.10.1111/j.1708-8240.2009.00281.xSearch in Google Scholar PubMed
[5] Pontons-Melo, J. C., A. Y. Furuse, and J. Mondelli. A direct composite resin stratification technique for restoration of the smile. Quintessence International, Vol. 42, No. 3, 2011, pp. 205–211.Search in Google Scholar
[6] Nagi, R. K., D. E. Montanari, M. H. Bartl, S. Zobl, W. Salvenmoser, T. Schwerte, et al. Physics of structural colors. Reports on Progress in Physics, Vol. 71, No. 7, 2008, id. 076401.10.1088/0034-4885/71/7/076401Search in Google Scholar
[7] Arai, Y., H. Kurokawa, T. Takamizawa, A. Tsujimoto, M. Saegusa, M. Yokoyama, et al. Evaluation of structural coloration of experimental flowable resin composites. Journal of Esthetic and Restorative Dentistry, Vol. 33, No. 2, 2021, pp. 284–293.10.1111/jerd.12674Search in Google Scholar PubMed
[8] Barros, M. S., P. F. Damaseeno Silva, M. L. Carregosa Santana, R. M. Fontes De Bragança, E. Faria, and A. L. Silva. Effect of surrounded shade and specimen’s thickness on color adjustment potential of a single-shade composite. Brazilian Dental Journal, Vol. 33, No. 5, 2022, pp. 126–132.10.1590/0103-6440202204973Search in Google Scholar PubMed PubMed Central
[9] Elgendy, H., R. R. Maia, F. Skiff, G. Denehy, and F. Qian. Comparison of light propagation in dental tissues and nano-filled resin-based composite. Clinical Oral Investigations, Vol. 23, No. 1, 2019, pp. 423–433.10.1007/s00784-018-2451-9Search in Google Scholar PubMed
[10] Ilie, N. and G. Furtos. A Comparative Study of Light Transmission by Various Dental Restorative Materials and the Tooth Structure. Operative Dentistry, Vol. 45, No. 4, 2020, pp. 442–452.10.2341/19-037-LSearch in Google Scholar PubMed
[11] Villarroel, M., N. Fahl, A. M. De Sousa, and O. B. De Oliveira. Direct esthetic restorations based on translucency and opacity of composite resins. Journal of Esthetic and Restorative Dentistry, Vol. 23, No. 2, 2011, pp. 73–87.10.1111/j.1708-8240.2010.00392.xSearch in Google Scholar PubMed
[12] Trifkovic, B., J. M. Powers, and R. D. Paravina. Color adjustment potential of resin composites. Clinical Oral Investigations, Vol. 22, No. 3, 2018, pp. 1601–1607.10.1007/s00784-017-2260-6Search in Google Scholar PubMed
[13] Pereira Sanchez, N., J. M. Powers, and R. D. Paravina. Instrumental and visual evaluation of the color adjustment potential of resin composites. Journal of Esthetic and Restorative Dentistry, Vol. 31, No. 5, 2019, pp. 465–470.10.1111/jerd.12488Search in Google Scholar PubMed
[14] Kobayashi, S., M. Nakajima, K. Furusawa, A. Tichy, K. Hosaka, and J. Tagami. Color adjustment potential of single-shade resin composite to various-shade human teeth: Effect of structural color phenomenon. Dental Materials Journal, Vol. 40, No. 4, 2021, pp. 1033–1040.10.4012/dmj.2020-364Search in Google Scholar PubMed
[15] Ismail, E. H. and R. D. Paravina. Color adjustment potential of resin composites: Optical illusion or physical reality, a comprehensive overview. Journal of Esthetic and Restorative Dentistry, Vol. 34, No. 1, 2022, pp. 42–54.10.1111/jerd.12843Search in Google Scholar PubMed
[16] Chen, F., Y. Toida, R. Islam, A. Alam, A. F. M. A. Chowdhury, and M. Yamauti. et al. Evaluation of shade matching of a novel supra-nano filled esthetic resin composite employing structural color using simplified simulated clinical cavities. Journal of Esthetic and Restorative Dentistry, Vol. 33, No. 6, 2021, pp. 874–883.10.1111/jerd.12671Search in Google Scholar PubMed
[17] Paravina, R. D., S. Westland, M. Kimura, J. M. Powers, and F. H. Imai. Color interaction of dental materials: blending effect of layered composites. Dental Materials, Vol. 22, No. 10, 2006, pp. 903–908.10.1016/j.dental.2005.11.018Search in Google Scholar PubMed
[18] De Oliveira, D. C. R. S., L. R. De Menezes, A. Gatti, L. Correr Sobrinho, J. L. Ferracane, and M. A. C. Sinhoreti. Effect of nanofiller loading on cure efficiency and potential color change of model composites. Journal of Esthetic and Restorative Dentistry, Vol. 28, No. 3, 2016, pp. 171–177.10.1111/jerd.12189Search in Google Scholar PubMed
[19] Paravina, R. D., S. Westland, F. H. Imai, M. Kimura, and J. M. Powers. Evaluation of blending effect of composites related to restoration size. Dental Materials, Vol. 22, No. 4, 2006, pp. 299–307.10.1016/j.dental.2005.04.022Search in Google Scholar PubMed
[20] Chu, S. J., R. D. Trushkowsky, and R. D. Paravina. Dental color matching instruments and systems. Review of clinical and research aspects. Journal of Dentistry, Vol. 38, 2010, pp. e2–e16.10.1016/j.jdent.2010.07.001Search in Google Scholar PubMed
[21] Cilingir, A. and E. Kariper. Color match evaluation using instrumental method for three single-shade resin composites before and after in-office bleaching. Reviews on Advanced Materials Science, Vol. 62, No. 1, 2023, id. 20220334.10.1515/rams-2022-0334Search in Google Scholar
[22] Tavares, B., F. França, R. Basting, B. Turssi, and T. Amaral. Effect of bleaching protocols on surface roughness and color change of high- and low-viscosity bulk-fill composite resins. Acta Odontológica Latinoamericana, Vol. 33, No. 2, 2020, pp. 59–68.10.54589/aol.33/2/059Search in Google Scholar
[23] Dietschi, D. and N. Fahl. Shading concepts and layering techniques to master direct anterior composite restorations: an update. British Dental Journal, Vol. 221, No. 12, 2016, pp. 765–771.10.1038/sj.bdj.2016.944Search in Google Scholar
[24] Iyer, R. S., V. R. Babani, P. Yaman, and J. Dennison. Color match using instrumental and visual methods for single, group, and multi-shade composite resins. Journal of Esthetic and Restorative Dentistry, Vol. 33, No. 2, 2021, pp. 394–400.10.1111/jerd.12621Search in Google Scholar
[25] De Oliveira, D. C. R. S., A. P. A. Ayres, M. G. Rocha, M. Giannini, R. M. Puppin Rontani, J. L. Ferracane, et al. Effect of different in vitro aging methods on color stability of a dental resin-based composite using CIELAB and CIEDE2000 color-difference formulas. Journal of Esthetic and Restorative Dentistry, Vol. 27, No. 5, 2015, pp. 322–330.10.1111/jerd.12155Search in Google Scholar
[26] Atria, P. J., D. Bordin, F. Marti, V. V. Nayak, J. Conejo, E. Benalcázar Jalkh, et al. 3D-printed resins for provisional dental restorations: Comparison of mechanical and biological properties. Journal of Esthetic and Restorative Dentistry, Vol. 34, No. 5, 2022, pp. 804–815.10.1111/jerd.12888Search in Google Scholar
[27] Tanaka, A., M. Nakajima, N. Seki, R. M. Foxton, and J. Tagami. The effect of tooth age on colour adjustment potential of resin composite restorations. Journal of Dentistry, Vol. 43, No. 2, 2015, pp. 253–260.10.1016/j.jdent.2014.09.007Search in Google Scholar
[28] Commission Internationale de l’Eclairage. CIE Technical Report. Colorimetry, 3rd edn. CIE Central Bureau, Vienna, Austria, 2004, p. 15.Search in Google Scholar
[29] Sharma, G., W. Wu, and E. N. Dalal. The CIEDE2000 color-difference formula: Implementation notes, supplementary test data, and mathematical observations. Color Research and Application, Vol. 30, No. 1, 2005, pp. 21–30.10.1002/col.20070Search in Google Scholar
[30] Perroni, A. P., F. J. Barbon, E. T. Chaves, S. Alberton da Silva, R. R. de Moraes, and N. Boscato. Exploring the influence of tooth, ceramic, and resin luting agent variations on laminate veneer optical characteristics: a prospective clinical investigation. Clinical Oral Investigations, Vol. 28, No. 12, 2024, id. 639.10.1007/s00784-024-06032-3Search in Google Scholar
[31] Gómez-Polo, C., M. P. Muñoz, M. C. Lorenzo Luengo, P. Vicente, P. Galindo, and A. M. Martín Casado. Comparison of the CIELab and CIEDE2000 color difference formulas. Journal of Prosthetic Dentistry, Vol. 115, No. 1, 2016, pp. 65–70.10.1016/j.prosdent.2015.07.001Search in Google Scholar
[32] Melgosa, M. Testing CIELAB‐based color‐difference formulas. Color Research and Application, Vol. 25, No. 1, 2000, pp. 49–55.10.1002/(SICI)1520-6378(200002)25:1<49::AID-COL7>3.3.CO;2-WSearch in Google Scholar
[33] Vaizoğlu, G. A., N. Ulusoy, and L. G. Alagöz. Effect of coffee and polishing systems on the color change of a conventional resin composite repaired by universal resin composites: an in vitro study. Materials (Basel), Vol. 16, No. 17, 2023, id. 6066.10.3390/ma16176066Search in Google Scholar PubMed PubMed Central
[34] Fernández Millán, D., M. Gallas Torreira, and V. Alonso de la Peña. Using a repositioning splint to determine reproducibility in the color registers of a dental spectrophotometer. Journal of Esthetic and Restorative Dentistry, Vol. 32, No. 1, 2020, pp. 19–25.10.1111/jerd.12532Search in Google Scholar PubMed
[35] Ishikawa-Nagai, S., A. Yoshida, M. Sakai, J. Kristiansen, and J. D. Da Silva. Clinical evaluation of perceptibility of color differences between natural teeth and all-ceramic crowns. Journal of Dentistry, Vol. 37, 2009, pp. e57–e63.10.1016/j.jdent.2009.04.004Search in Google Scholar PubMed
[36] Paravina, R. D., M. M. Pérez, and R. Ghinea. Acceptability and perceptibility thresholds in dentistry: A comprehensive review of clinical and research applications. Journal of Esthetic and Restorative Dentistry, Vol. 31, No. 2, 2019 Mar, pp. 103–112.10.1111/jerd.12465Search in Google Scholar PubMed
[37] Yamaguchi, S., O. Karaer, C. Lee, T. Sakai, and S. Imazato. Color matching ability of resin composites incorporating supra-nano spherical filler producing structural color. Dental Materials, Vol. 37, No. 5, 2021, pp. e269–e275.10.1016/j.dental.2021.01.023Search in Google Scholar PubMed
[38] Joannopoulos, J. D., S. G. Johnson, J. N. Winn, and R. D. Meade. Photonic crystals: Molding the flow of light. Photonic crystals: Molding the flow of light, 2nd edn., Princeton University Press, Princeton, 2008.Search in Google Scholar
[39] Pedrosa, M., S. da, F. N. Nogueira, V. Baldo, O. de, and I. S. Medeiros. Changes in color and contrast ratio of resin composites after curing and storage in water. The Saudi Dental Journal, Vol. 33, No. 8, 2021, pp. 1160–1165.10.1016/j.sdentj.2021.02.002Search in Google Scholar PubMed PubMed Central
[40] Barros, M. S., P. F. D. Silva, M. L. C. Santana, R. M. F. Bragança, and A. L. Faria-E-Silva. Background and surrounding colors affect the color blending of a single-shade composite. Brazilian Oral Research, Vol. 37, 2023, id. e035.10.1590/1807-3107bor-2023.vol37.0035Search in Google Scholar PubMed
[41] Suh, Y. R., J. S. Ahn, S. W. Ju, and K. M. Kim. Influences of filler content and size on the color adjustment potential of nonlayered resin composites. Dental Materials Journal, Vol. 36, No. 1, 2017, pp. 35–40.10.4012/dmj.2016-083Search in Google Scholar PubMed
[42] Ersöz, B., S. Karaoğlanoğlu, E. A. Oktay, and N. Aydin. Resistance of Single-shade Composites to Discoloration. Operative Dentistry, Vol. 47, No. 6, 2022, pp. 686–692.10.2341/21-156-LSearch in Google Scholar PubMed
[43] Yılmaz Atalı, P., B. Doğu Kaya, A. Manav Özen, B. Tarçın, A. A. Şenol, E. Tüter Bayraktar, et al. Assessment of micro-hardness, degree of conversion, and flexural strength for single-shade universal resin composites. Polymers, Vol. 14, No. 22, 2022, id. 4987.10.3390/polym14224987Search in Google Scholar PubMed PubMed Central
[44] OptiShadeTM Technical Bulletin.Search in Google Scholar
[45] Oivanen, M., F. Keulemans, S. Garoushi, P. K. Vallittu, and L. Lassila. The effect of refractive index of fillers and polymer matrix on translucency and color matching of dental resin composite. Biomaterial Investigations in Dentistry, Vol. 8, No. 1, 2021, pp. 48–53.10.1080/26415275.2021.1906879Search in Google Scholar PubMed PubMed Central
© 2025 the author(s), published by De Gruyter
This work is licensed under the Creative Commons Attribution 4.0 International License.
Articles in the same Issue
- Review Articles
- Utilization of steel slag in concrete: A review on durability and microstructure analysis
- Technical development of modified emulsion asphalt: A review on the preparation, performance, and applications
- Recent developments in ultrasonic welding of similar and dissimilar joints of carbon fiber reinforcement thermoplastics with and without interlayer: A state-of-the-art review
- Unveiling the crucial factors and coating mitigation of solid particle erosion in steam turbine blade failures: A review
- From magnesium oxide, magnesium oxide concrete to magnesium oxide concrete dams
- Properties and potential applications of polymer composites containing secondary fillers
- A scientometric review on the utilization of copper slag as a substitute constituent of ordinary Portland cement concrete
- Advancement of additive manufacturing technology in the development of personalized in vivo and in vitro prosthetic implants
- Recent advance of MOFs in Fenton-like reaction
- A review of defect formation, detection, and effect on mechanical properties of three-dimensional braided composites
- Non-conventional approaches to producing biochars for environmental and energy applications
- Review of the development and application of aluminum alloys in the nuclear industry
- Advances in the development and characterization of combustible cartridge cases and propellants: Preparation, performance, and future prospects
- Recent trends in rubberized and non-rubberized ultra-high performance geopolymer concrete for sustainable construction: A review
- Cement-based materials for radiative cooling: Potential, material and structural design, and future prospects
- A comprehensive review: The impact of recycling polypropylene fiber on lightweight concrete performance
- A comprehensive review of preheating temperature effects on reclaimed asphalt pavement in the hot center plant recycling
- Exploring the potential applications of semi-flexible pavement: A comprehensive review
- A critical review of alkali-activated metakaolin/blast furnace slag-based cementitious materials: Reaction evolution and mechanism
- Dispersibility of graphene-family materials and their impact on the properties of cement-based materials: Application challenges and prospects
- Research progress on rubidium and cesium separation and extraction
- Research Articles
- Investigation of the corrosion performance of HVOF-sprayed WC-CoCr coatings applied on offshore hydraulic equipment
- A systematic review of metakaolin-based alkali-activated and geopolymer concrete: A step toward green concrete
- Evaluation of color matching of three single-shade composites employing simulated 3D printed cavities with different thicknesses using CIELAB and CIEDE2000 color difference formulae
- Novel approaches in prediction of tensile strain capacity of engineered cementitious composites using interpretable approaches
- Effect of TiB2 particles on the compressive, hardness, and water absorption responses of Kulkual fiber-reinforced epoxy composites
- Analyzing the compressive strength, eco-strength, and cost–strength ratio of agro-waste-derived concrete using advanced machine learning methods
- Tensile behavior evaluation of two-stage concrete using an innovative model optimization approach
- Tailoring the mechanical and degradation properties of 3DP PLA/PCL scaffolds for biomedical applications
- Optimizing compressive strength prediction in glass powder-modified concrete: A comprehensive study on silicon dioxide and calcium oxide influence across varied sample dimensions and strength ranges
- Experimental study on solid particle erosion of protective aircraft coatings at different impact angles
- Compatibility between polyurea resin modifier and asphalt binder based on segregation and rheological parameters
- Fe-containing nominal wollastonite (CaSiO3)–Na2O glass-ceramic: Characterization and biocompatibility
- Relevance of pore network connectivity in tannin-derived carbons for rapid detection of BTEX traces in indoor air
- A life cycle and environmental impact analysis of sustainable concrete incorporating date palm ash and eggshell powder as supplementary cementitious materials
- Eco-friendly utilisation of agricultural waste: Assessing mixture performance and physical properties of asphalt modified with peanut husk ash using response surface methodology
- Benefits and limitations of N2 addition with Ar as shielding gas on microstructure change and their effect on hardness and corrosion resistance of duplex stainless steel weldments
- Effect of selective laser sintering processing parameters on the mechanical properties of peanut shell powder/polyether sulfone composite
- Impact and mechanism of improving the UV aging resistance performance of modified asphalt binder
- AI-based prediction for the strength, cost, and sustainability of eggshell and date palm ash-blended concrete
- Investigating the sulfonated ZnO–PVA membrane for improved MFC performance
- Strontium coupling with sulphur in mouse bone apatites
- Transforming waste into value: Advancing sustainable construction materials with treated plastic waste and foundry sand in lightweight foamed concrete for a greener future
- Evaluating the use of recycled sawdust in porous foam mortar for improved performance
- Improvement and predictive modeling of the mechanical performance of waste fire clay blended concrete
- Polyvinyl alcohol/alginate/gelatin hydrogel-based CaSiO3 designed for accelerating wound healing
- Research on assembly stress and deformation of thin-walled composite material power cabin fairings
- Effect of volcanic pumice powder on the properties of fiber-reinforced cement mortars in aggressive environments
- Analyzing the compressive performance of lightweight foamcrete and parameter interdependencies using machine intelligence strategies
- Selected materials techniques for evaluation of attributes of sourdough bread with Kombucha SCOBY
- Establishing strength prediction models for low-carbon rubberized cementitious mortar using advanced AI tools
- Investigating the strength performance of 3D printed fiber-reinforced concrete using applicable predictive models
- An eco-friendly synthesis of ZnO nanoparticles with jamun seed extract and their multi-applications
- The application of convolutional neural networks, LF-NMR, and texture for microparticle analysis in assessing the quality of fruit powders: Case study – blackcurrant powders
- Study of feasibility of using copper mining tailings in mortar production
- Shear and flexural performance of reinforced concrete beams with recycled concrete aggregates
- Advancing GGBS geopolymer concrete with nano-alumina: A study on strength and durability in aggressive environments
- Leveraging waste-based additives and machine learning for sustainable mortar development in construction
- Study on the modification effects and mechanisms of organic–inorganic composite anti-aging agents on asphalt across multiple scales
- Morphological and microstructural analysis of sustainable concrete with crumb rubber and SCMs
- Structural, physical, and luminescence properties of sodium–aluminum–zinc borophosphate glass embedded with Nd3+ ions for optical applications
- Eco-friendly waste plastic-based mortar incorporating industrial waste powders: Interpretable models for flexural strength
- Bioactive potential of marine Aspergillus niger AMG31: Metabolite profiling and green synthesis of copper/zinc oxide nanocomposites – An insight into biomedical applications
- Preparation of geopolymer cementitious materials by combining industrial waste and municipal dewatering sludge: Stabilization, microscopic analysis and water seepage
- Seismic behavior and shear capacity calculation of a new type of self-centering steel-concrete composite joint
- Sustainable utilization of aluminum waste in geopolymer concrete: Influence of alkaline activation on microstructure and mechanical properties
- Optimization of oil palm boiler ash waste and zinc oxide as antibacterial fabric coating
- Tailoring ZX30 alloy’s microstructural evolution, electrochemical and mechanical behavior via ECAP processing parameters
- Comparative study on the effect of natural and synthetic fibers on the production of sustainable concrete
- Microemulsion synthesis of zinc-containing mesoporous bioactive silicate glass nanoparticles: In vitro bioactivity and drug release studies
- Special Issue on Recent Advancement in Low-carbon Cement-based Materials - Part II
- Investigating the effect of locally available volcanic ash on mechanical and microstructure properties of concrete
- Flexural performance evaluation using computational tools for plastic-derived mortar modified with blends of industrial waste powders
- Foamed geopolymers as low carbon materials for fire-resistant and lightweight applications in construction: A review
- Autogenous shrinkage of cementitious composites incorporating red mud
- Special Issue on AI-Driven Advances for Nano-Enhanced Sustainable Construction Materials
- Advanced explainable models for strength evaluation of self-compacting concrete modified with supplementary glass and marble powders
- Analyzing the viability of agro-waste for sustainable concrete: Expression-based formulation and validation of predictive models for strength performance
- Special Issue on Advanced Materials for Energy Storage and Conversion
- Innovative optimization of seashell ash-based lightweight foamed concrete: Enhancing physicomechanical properties through ANN-GA hybrid approach