The phase inversion mechanism of the pH-sensitive reversible invert emulsion from w/o to o/w
-
Fei Liu
 ,
Yanling Wang
,
Yanling Wang

Abstract
Alteration in the environmental conditions will cause a reversed reaction between o/w emulsion and w/o emulsion that has similar advantages of different liquids form on the reversible invert emulsion. The reversible phase inversion of the emulsion has a benefit of dealing with drilling cutting, so the reversible invert emulsion also can be thought used as a drilling fluid. The phase inversion from w/o emulsion to o/w emulsion can be divided into three stages. They are w/o emulsion, w/o/w emulsion, and o/w emulsion. In the w/o emulsion stage, the structure appeared among water droplets when the percentage of the HCl solution (5%) was less than 0.375%. In the w/o/w emulsion stage, the structure among water droplets existed at the beginning of this stage; however, the internal phase and the external phase can interchange their positions during the process. In the third stage, the structures among droplets of the emulsion would be broken and the degree of the dispersion of the oil droplet in the emulsion would increase. The changes in the microstructure, conductivity, electrical stability, standing stability, and the viscosity of the emulsion, which have edified among droplets in the process from w/o emulsion to o/w emulsion, were studied. The result of the microstructure microscopic observation agrees with the result of the electrical stability and viscosity experiments. Moreover, the internal phase and the external phase can interchange positions during the process.
1 Introduction
An emulsion is a dispersed system wherein a liquid phase (also termed the internal or dispersed phase) is fragmented into droplets and suspended or dispersed in a second phase (termed the external or continuous phase) that is essentially immiscible in the first phase [1]. Most often, the emulsion is either water in oil emulsion (w/o) or oil in water emulsion (o/w), although more complex morphologies such as multiple emulsions can also be prepared under specific conditions [2,3,4,5,6]. Stability against coalescence is usually provided by an emulsifier [7,8]. The emulsifiers can be a molecular surfactant, solid particles, or a combination of surfactants and particles. Emulsions stabilized by surfactants are the most widely used emulsions [9].
The inversion of an emulsion, as the name implies, is a transition from one physical arrangement to another [10]. Flipping an emulsion from one type to the other is a difficult task. For instance, oil-based muds have complex w/o emulsions and are used as drilling fluids in oil and gas extraction to carry the drilling cuttings out of the well. For environmental reasons, cuttings must be separated from the mud and cleaned. Inverting the emulsion can certainly help to meet these requirements [11,12]. The understanding of the inversion process of the emulsions is thus of major importance in the oil industry. This practical example shows the importance of developing emulsion systems, which exhibit the appropriate emulsion type for a specific application. Experimentally, this can be suitably achieved by changing physicochemical parameters, referred to as field variables, such as temperature (ethoxylated emulsifiers are well known to be temperature sensitive), oil chain length, type or size of both the hydrophobic and hydrophilic moieties of the emulsifier, and electrolyte type and concentration [13,14,15].
The reversible invert emulsion [16,17,18], as the name implies, is an emulsion that can be reversibly inverted among different styles. The reversible invert emulsion can invert from w/o (o/w) emulsion to o/w (w/o) emulsion and vice versa. The reversible invert emulsion is one kind of invert emulsion, but the invert emulsion is not declared as a reversible invert emulsion. The reversible invert emulsion offers a possibility for the reusable working fluid that is environmentally suitable than the general working fluid. The working fluid used in the drilling as mentioned earlier is reversible invert emulsion, but only its first period is inverted from w/o emulsion to o/w emulsion. There are huge economic benefits and environmental benefits if it can be used as a reversible invert emulsion in the future [19].
Many studies have been done about the different types of reversible invert emulsions. The important reversible invert emulsions studied are pH-responsive reversible invert emulsion [20,21,22,23,24,25], temperature-responsive reversible invert emulsion [26], salt concentration-responsive reversible invert emulsion [27], light-responsive reversible invert emulsion [12], and emulsifier mixtures responsive reversible invert emulsion [28].
Arvind and Syed [20] discussed the systematic design, the development, and the testing of novel emulsifiers for innovative invert emulsion drilling fluids. The use of innovative emulsifier chemistry has produced novel invert emulsion fluids, which address the environmental and the performance and cost-related issues in drilling operations. Marchal et al. [26] described how a versatile amphiphilic diblock copolymer can form o/w or w/o emulsions depending on the pH and temperature. Binks and Jhonny [27] have studied the inversion of an emulsion stabilized solely by ionizable nanoparticles, whose type is simply affected by either a change in the pH or the salt concentration. Porcar et al. [12] found the light-induced control of the type (oil or water continuous medium) of emulsions stabilized by an appropriate combination of two polyelectrolyte surfactants. Binks and Lumsdon [28] studied the emulsions containing equal volumes of toluene and water stabilized by the nanometer-sized silica particles alone. It was observed that the transitional inversion, from o/w and vice versa, can be achieved by using a mixture of two particle types of different wettability. Also, most studies focus on the macroscopic properties and the factors affecting the reversible inversion of the emulsion [17,29,30,31,32]. However, the study of the change of the microstructure during a reversible inversion has not been exploited very much.
2 Materials and methodology
2.1 Materials
The deionized water was obtained through purifying water by an ion-exchange method. A hydraulic oil with a minimum kinematic viscosity of 4.14 mm2 s−1 was used as the oil component of the invert drilling fluid. A primary alkyl amine surfactant was purchased from Jianglai Biological Technology Company and was used as received. Some amount of the diluted HCl was used in the experimental process (in a mass fraction of 5%).
2.2 Methodology
In this article, an experiment was performed to study the change of the emulsion microstructure during an inversion process from w/o to o/w of pH-sensitive reversible emulsion with structures among fluid droplets. A primary alkyl amine surfactant is used as an emulsifier, and the HCl solution (5%) and the NaOH solution (5%) are used as acid and alkali, respectively. First, the percentage of the HCl solution (5%) and the NaOH solution (5%) is determined as 1.0%, which can guarantee the reversible invention that happened for the reversible invert emulsion, which we know from the previous studies. The results obtained from the changing percentage of the HCl solution (5%) (under a stirring time of 5 min) and the stirring time (with a 5% of the HCl solution) can be used to draw a relationship between the changing microstructure during the inversion process. The macroscopic property of the emulsion-like conductivity measurements, electrical stability, viscosity, and emulsion stability was also analyzed with the result of the optical microscopic observations during the inversion process. Optical microscopy was used to see the difference between the emulsion’s microstructure after adding a different percentage of the HCl solution and the different stirring time. The inversion process during which the microstructure of the emulsion would change from w/o emulsion to w/o/w emulsion and finally change into o/w emulsion at the end of this process can be seen. Thus, studying the change of the micro-structure of the pH-sensitive reversible emulsion, in which structure exist among droplets, near the phase inversion point from w/o to o/w.
2.3 Characterization of emulsion
2.3.1 Conductivity
The conductivity of the emulsions was measured using a digital conductivity meter immediately after preparation. The emulsions were classified according to their conductivities. A high conductivity indicated an o/w emulsion or w/o/w emulsion, and a low (immeasurable) conductivity (<1 µS cm−1) indicated a w/o emulsion or o/w/o emulsion. These results were confirmed using the “drop test,” in which a drop of a water-soluble (or oil-soluble) dye was added to the emulsion, and its ease of dispersion was monitored by visual inspection. Relatively rapid dispersion indicated that the continuous phase of the emulsion was the same as the diluent (either water or oil).
2.3.2 Optical microscopy
A drop of the diluted emulsion was placed on a microscope slide and viewed using an optical microscope fitted with a digital camera. This technique was used to observe the microstructure of emulsion.
2.3.3 Electrical stability
Electrical stability was measured by an electrical stability tester, which is used mainly to measure the relative stability of w/o emulsion. Water is not continuous in a w/o emulsion, and the voltage would keep rising until the emulsion is broken and that the current could be measured. On the contrary, the water is continuous in the o/w emulsion and the current could be measured at a very low voltage. High electrical stability measured number means high stability of the emulsion. The style of the emulsion also can be measured by electrical stability.
2.3.4 Viscosity
Viscosity was measured by the viscometer. The viscosity represented the closeness of the structure among droplets. The change of the microstructure observed should agree with the changing trend of the viscosity. The viscosity and the microstructure of the emulsion were used to infer the change during the phase inversion of the reversible invert emulsion.
2.3.5 Emulsion stability
The emulsion was transferred into a stoppered glass tube with an internal diameter glass diameter of 2 cm and a length of 19 cm to observe the phase behavior of the dispersions 24 h after preparation at 25°C. The bottom of the vessels also could not be seen clearly from a normal photograph and need light behind the vessels to help vessels be seen clearly. The stability of the emulsions to creaming and coalescence was assessed by monitoring the positions of the water–emulsion and emulsion–oil interfaces, respectively, with time [33].
3 Results and discussion
3.1 Performance of the reversible invert emulsion fluids
The reversible invert performance was conducted through the distribution test, the conductivity experiment, and the electrical stability experiment. The initial w/o emulsion have high electrical stability of 130 V, after treating the w/o emulsion with HCl solution, it inverts successfully into an o/w with a conductivity of 80 µS cm−1 and an electrical stability of 1 V, after adding 1% NaOH solution to the o/w emulsion, it was observed that the emulsion inverts into a w/o emulsion with the electrical stability increased from 1 to 115 V and the conductivity also reduced from 80 to 0 μS cm−1. This process is demonstrated in Figure 1.
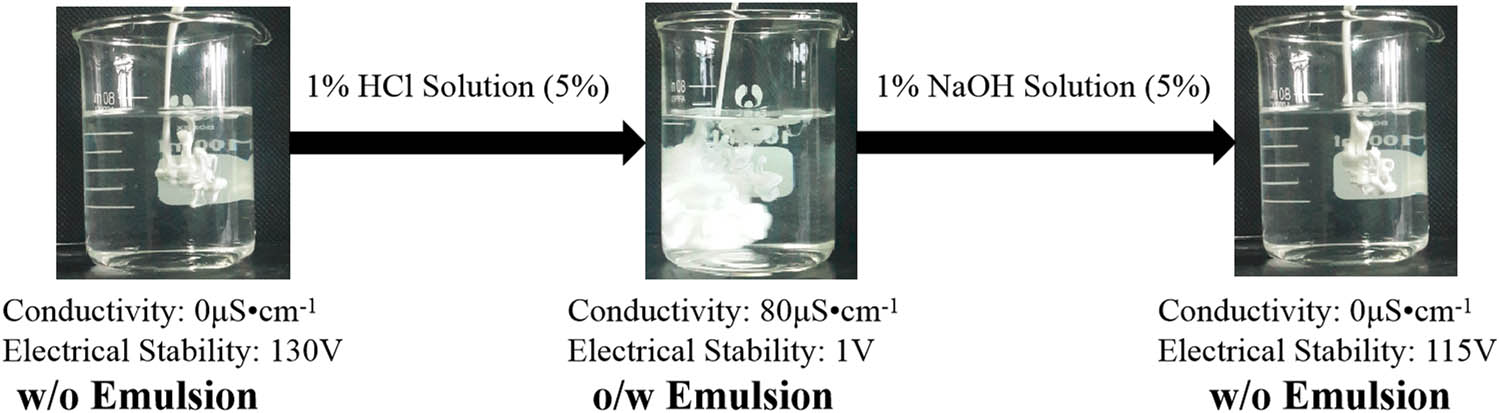
Reversible invert performance test result.
3.2 The change of microstructure of reversible invert emulsion during w/o to o/w
The phase inversion point was known by the change in the conductivity and electrical stability of the emulsion when the stirring time was kept at 5 min during the experiment (Figure 2). The emulsion was still w/o emulsion when the percentage of the HCl solution is 0.3625 because the conductivity and the electrical stability were 0 µS cm−1 and 151 V, respectively, at that instance. The emulsion will become o/w emulsion when the percentage of the HCl solution (5%) is 0.375% because the conductivity and the electrical stability are 2 µS cm−1 and 1 V, respectively.

The relationship among the conductivity, the electrical stability, and the percentage of HCl solution (5%).
From Figure 2, it was observed that the w/o began to change into an o/w emulsion when the percentage of the HCl was more than 0.375%. The viscosity of the emulsion, when the percentage of HCl was 0.375%, increased sharply and decreased during this process. The change of w/o emulsion to o/w emulsion process of the reversible inversion emulsion can be divided into three stages relying on the result of the following studies below.
3.2.1 The first stage of the inversion process – w/o emulsion
The change of the emulsion microstructure following the change of the HCl solution (5%) adding percentage was studied (under a stirring time 5 min) in the first stage (Figure 3). There are structures among droplets when the percentage of the HCl solution (5%) is less than 0.375%. The closeness of the structure among droplets would first increase and then decrease following the increase of the percentage of the HCl solution (5%), and the most closed structure among water droplets emerged at the point when the percentage of the HCl solution (5%) is 0.2% (Figure 4). The result of the microstructure observation agrees with the result of the viscosity experiment. Also, the water droplet size would first decrease and then increase following the increasin of the percentage of the HCl solution, and the overall least water droplet size emerged at the point when the percentage of the HCl solution is 0.2%. The electrical stability number also has a tendency that first increasing and then decreasing follow the increase of the percentage of the HCl solution, and the highest electrical stability number emerged at the point that the percentage of the HCl solution is 0.2% (Figure 2), which means the droplets of the emulsion have overall least volume at this point. The result of the microstructure observation agrees with the result of the electrical stability experiment.
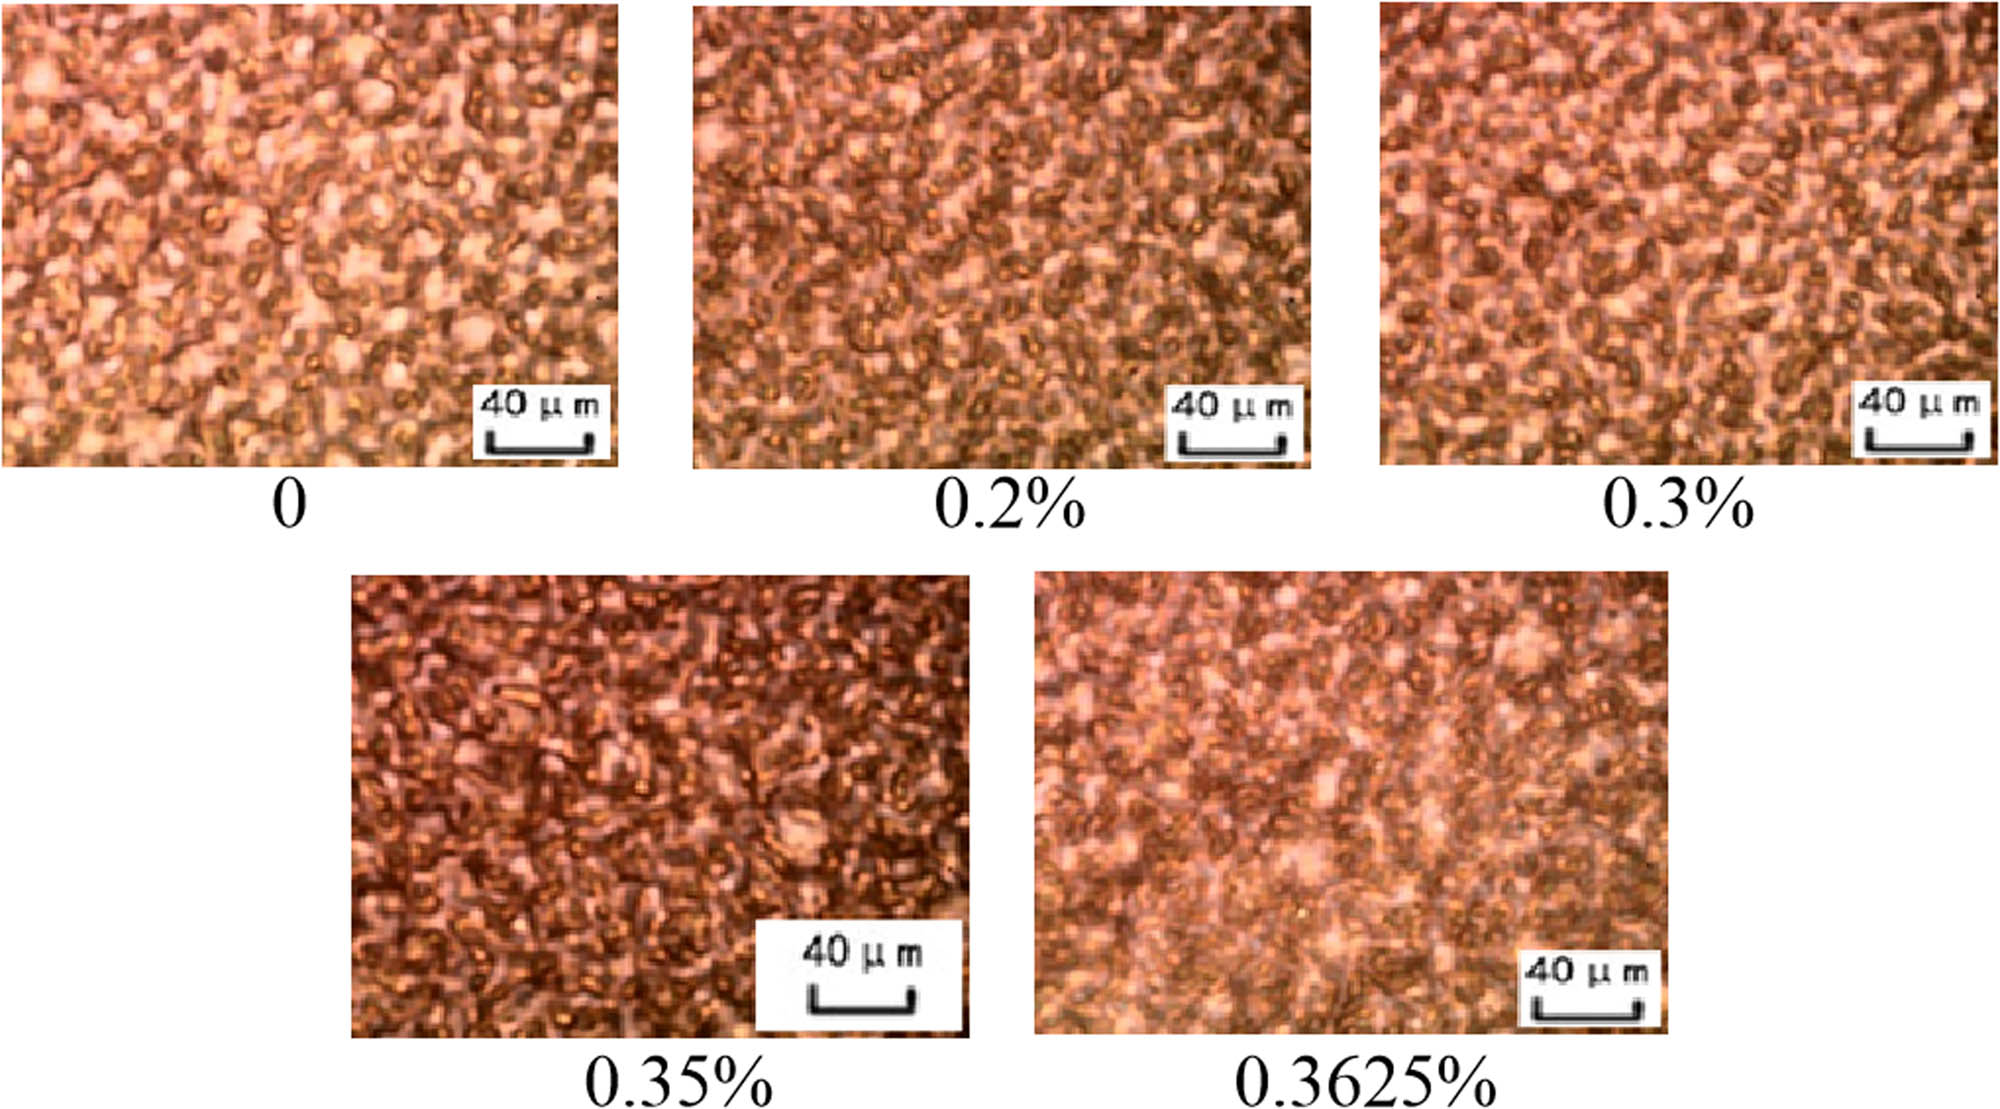
The relationship among the microstructure and the percentage of HCl solution (5%; less than 0.3625%) in the first stage of the process – w/o emulsion.

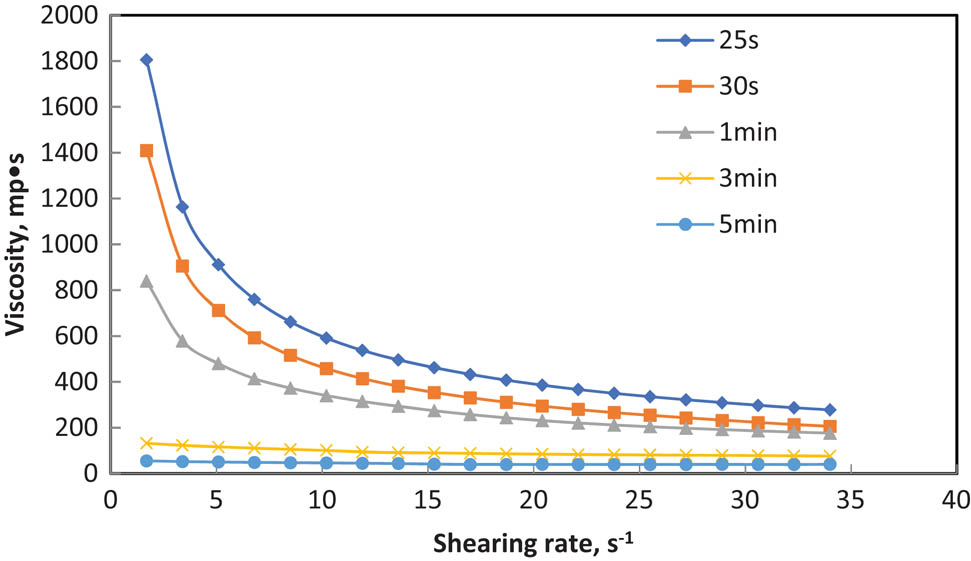
The relationship among the viscosity, the shearing rate, and the percentage of the HCl solution (5%; less than 0.3625%).
It was also observed that the adding percentage of the HCl solution increasing, cause the tightness of the structure among the water droplets in the w/o emulsion firstly rise and then fall down. The same action was observed in terms of the stability of the structure among the water droplets (Figure 5). The volume of the upper oil first decreased and then increased. More amount of the upper oil was observed at the point when the HCl solution is 0.2%. The resultant microstructure agreed with the changing trend of the volume of the upper oil. Furthermore, no bottom water was observed at this stage, which infers that the stability of the emulsion is so good that the water droplets were still intact after 24 h.

Photograph of emulsions with different percentages of the HCl solution (5%; the percentage is from 0 to 0.3625% and the stirring time is 5 min) after 24 h of preparation.
3.2.2 The second stage – w/o/w emulsion
The structure still exist among the water droplets in the emulsion system at the beginning of this stage, the water droplet in the oil phase coalesced into continuous phase and breaking the continuous oil into oil droplet following an increase in the stirring time. The internal phase and the external phase interchanged positions during the process. The oil droplet size became less as the stirring time was increased. The w/o/w emulsion would change into o/w emulsion at the end of this stage.
The style of the emulsion was w/o/w emulsion when the stirring time is 5 s. The structure among the water droplets in the w/o emulsion is very tight and hard to be broken, so the structure also exist among the water (w2) droplets in the w2/o/w1 emulsion (Figure 6). After stirring for 5 s, it was observed that the emulsion moved into a transition state, which is very unstable. The coalescence between the droplets was observed through the change in the image of the emulsion microstructure under a microscope (Figure 7). The viscosity of the emulsion dropped due to the coalescence caused by easily breaking the water droplets. The viscosity of the freshly prepared emulsion and the emulsion standing for 1 h agreed to the phenomenon that the coalescence of the oil droplets can be easily broken during the standing process (Figure 8).

The relationship between the microstructure and the percentage of HCl solution (5%; the percentage of the HCl solution (5%) is 0.375%) in the second stage of the process—w/o/w emulsion.

The change of the microstructure image of the emulsion after 5 s stirring (the percentage of the HCl solution (5%) is 0.375%) during 1 h standing.

The contrast of the viscosity of the emulsion after 5 s stirring (the percentage of the HCl solution (5%) is 0.375%) between freshly prepared emulsion and 1 h later.
Second, the oil droplets with different kinds of microstructures coexisted in the emulsion because the emulsion was in the transitional zone. The microstructure was same at a stirring time of 10 and 15 s. When stirred for 20 s, the large oil droplets were separated into smaller oil droplets with continuous water phase. Different kinds of oil microstructure existed in the emulsion in the transition zone (Figure 9).

The microstructure of the emulsion (the percentage of the HCl solution (5%) is 0.375% and the stirring time is 20 s).
Finally, the o/w emulsion had a structure among the oil droplets when the stirring time was 25 s. The structure was unstable and broke down after standing for a 1 h (Figure 6). The viscosity of the emulsion declined during the standing agreed with the phenomenon that the structure among oil droplets was broken during the standing procedure.
3.2.3 The third stage – o/w emulsion
The final stage of the inversion can be divided into two processes. In the first process, the structure among droplets of the emulsion would be broken following an increase of the stirring time. It was observed that the dispersion of the oil droplet in the emulsion would become better (Figure 10). The conductivity of the emulsion increased due to the broken structures among the droplets of the emulsion (Figure 11). The broken structures caused a continuity in the water phase of the emulsion. Also, the viscosity of the emulsion dropped following the breaking of the structure among the water droplets (Figure 12). The results obtained at this stage agreed with the results of the conductivity experiment and viscosity experiments.

The relationship between the microstructure and the stirring time (the percentage of the HCl solution (5%) is 0.375% and the stirring time is between 25 s and 5 min).

The relationship between the conductivity and the stirring time (the percentage of the HCl solution (5%) is 0.375%).
The relationship among the viscosity, shearing rate, and the stirring time (the percentage of the HCl solution (5%) is 0.375%).
The second part of the final stage was characterized by a drop in the viscosity at the beginning. The viscosity then increased following an increase in the changing trend in the volume of the droplets of the emulsion. The minimum viscosity also emerged at the point when the HCl solution is 0.4% (Figure 13). The probability of collision among water droplets increased when the water droplet becomes bigger and the viscosity of the emulsion increased in this process (Figure 14). The conductivity of the emulsion increased slowly because of the increasing ion concentration due to the increase in the percentage of the HCl solution.

The relationship among the viscosity, the shearing rate, and the percentage of the HCl solution (5%; from 0.375% to 1.0%).

The relationship between the microstructure and the percentage of HCl solution (5%; from 0.375% to 1.0%).
The stability of the emulsion was conducted by monitoring for 24 h after mixing with different percentages of HCl solutions (Figure 15). With the increase in the percentage of the HCl solution, there was no upper oil at the beginning of this period (the HCl solution between 0.375% and 0.7%) because of the high stability of the oil droplet. The upper oil emerged when the HCl solution is more than 0.8% due to the increasing oil droplet size. The results of the microstructure observation agreed with the changing trend of the volume of the upper oil.

Photograph of emulsions with different percentages of the HCl solution (5%; percentage from 0.375% to 1.0%, and stirring time is 5 min) after 24 h of preparation.
3.3 pH sensitivity characterization
The pH of the emulsion was different at different percentages of the HCl solution (Figure 16). When the HCl solution is more than 0.375%, the emulsion system was observed in an acidic medium and the emulsifier existed as an oil-in-water emulsifier, which could stabilize the oil-in-water emulsion. When HCl was less than 0.375%, the emulsion system was observed to be in an alkaline medium and the emulsifier formed can stabilize the water-in-oil emulsion.

The change in the pH following the change in the percentage of the HCl solution.
3.4 Discussion
The deeper understanding of the three stages during the w/o emulsion to o/w emulsion process of the reversible inversion emulsion relies on the result of the studies (Figure 17).
In the first stage, first, what can be seen through the optical microscopy was the closeness degree of the structures among water droplets would first increase and then decrease following the increase of the percentage of the HCl solution (5%) and the most closely structure among water droplets emerged when the percentage of the HCl solution (5%) is 0.2%. The result of the microstructure observation agreed with the result of the viscosity experiment and the changing trend of the volume of the upper oil phase and bottom water phase. Second, the water droplet size would first decrease and then increase following the increase of the percentage of the HCl solution (5%), and the least water droplet size emerged at the point when the percentage of the HCl solution (5%) is 0.2%. The result of the microstructure observation agreed with the result of the electrical stability experiment.
In the second stage, the structure among water droplets existed at the beginning of this stage, and the water droplets in the oil phase coalesce into the continuous phase breaking the continuous oil into oil droplets following the increase in the stirring time. The internal phase and the external phase can interchange positions during the process. The w/o/w emulsion would change into o/w emulsion at the end of this stage. The result of the viscosity experiment of the emulsion agrees with the phenomenon that the coalescence of the oil droplet would be easily broken during the standing.
In the third stage, the structure among oil droplets of the emulsion would be broken following the increase in the stirring time (the percentage of the HCl solution (5%) is 0.375%) and the oil droplets dispersion degree in the emulsion would become better. The viscosity of the emulsion system would decrease following the destruction of the structure among water droplets of the emulsion. The results of the microstructure observation agreed with the result of the conductivity experiment and the viscosity experiment. The oil droplet size would first fall down and then rise up following the increase in the percentage of the added HCl solution (5%) (stirring time is 5 min) and the minimum oil droplet size emerged in the point when the percentage of the HCl solution (5%) is 0.4%. In this part, the percentage of the HCl solution (5%) is more than 0.375%. The viscosity of the emulsion also would first decrease and then increase following the changing trend of the volume of the oil droplets of the emulsion and the minimum viscosity also emerged when the percentage of the HCl solution (5%) is 0.4%. The result of the microstructure observation agrees with the result of the viscosity experiment.

The diagram of three stages during the w/o emulsion to o/w emulsion process of the reversible inversion emulsion.
4 Conclusion
From the experimental study, the following conclusions were made.
Increasing the percentage of HCl would cause an alteration in the closeness of the structure among the droplets in the system and hence affecting the microstructure of the emulsion.
The percentage of the HCl solution in the system will also affect the viscosity of the emulsion and hence affect the microstructure of the emulsion.
The optimum level of the HCl solution (0.2%) in the emulsion system will give a higher volume of emerged oil, and it can be deduced that the changing trend of the volume of the upper oil affects the microstructure of the emulsion.
The electrical stability of the microstructure is also related to the amount of the acid solution in the emulsion system.
Increasing the stirring time will also increase the stability of the oil droplets in the system as the breakage of the structure among the oil droplets causes more free oil droplets to accumulate in the emulsion.
Acknowledgments
This work was sponsored by Youth Innovation Team Science and Technology Development Program of Shandong Province Higher Educational Institutions (2019KJA024), Scientific Research Starting Fund from Shengli College China University of Petroleum (KQ2019-007), Shandong Postdoctoral Innovation Talent Support Program, and Youth Natural Science Foundation of Shandong Province.
References
[1] Robert AG, John CH, Vaynberg KA. Insight into the inversion mechanism of an inverse polymer emulsion. Langmuir. 2008;24(22):12727–9.10.1021/la8013656Suche in Google Scholar
[2] Grossiord JL, Seiller M. Multiple emulsions structure, properties, and applications. Paris: Editions de Sante; 1998.Suche in Google Scholar
[3] Garti N, Bisperink C. Double emulsions: progress and applications. Curr Opin Colloid Interface Sci. 1998;3:657–67.10.1016/S1359-0294(98)80096-4Suche in Google Scholar
[4] Becher P. Encyclopedia of emulsion technology, vol. 1: basic theory. New York: Marcel Dekker Inc.; 1983.Suche in Google Scholar
[5] Goran TV, Richard AW. Manufacture of large uniform droplets using rotating membrane emulsification. J Colloid Interface Sci. 2006;299:396–402.10.1016/j.jcis.2006.01.061Suche in Google Scholar
[6] Marianna RG, Veronique S, Choplin L, Salager JL. Emulsion inversion from abnormal to normal morphology by continuous stirring without internal phase addition: effect of surfactant mixture fractionation at extreme water–oil ratio. Colloids Surf A. 2006;288:151–7.10.1016/j.colsurfa.2006.03.034Suche in Google Scholar
[7] Zhang J, Li L, Wang J, Sun H, Xu J, Sun D. Double inversion of emulsions induced by salt concentration. Langmuir. 2012;28(17):6769–75.10.1021/la300695vSuche in Google Scholar
[8] Salager JL, Marquez L, Pena A, Rondon M, Silva F, Tyrode E. Current phenomenological know-how and modeling of emulsion inversion. Ind Eng Chem Res. 2000;39:2665–76.10.1021/ie990778xSuche in Google Scholar
[9] Binks BP. Modern aspects of emulsion science. Cambridge, UK: The Royal Society of Chemistry; 1998.10.1039/9781847551474Suche in Google Scholar
[10] Becher P. Encyclopedia of emulsion technology, vol 2: application. New York: Marcel Dekker Inc.; 1985.Suche in Google Scholar
[11] Hua GY, Shu FC, Xiang XJ, Shi MY. Preparation and evaluation of the reversible oil based drilling fluid. Adv Fine Petrochem. 2009;10(11):8–11.Suche in Google Scholar
[12] Porcar I, Perrin P, Tribet C. UV-visible light: a novel route to tune the type of an emulsion. Langmuir. 2001;17(22):6905–9.10.1021/la010955aSuche in Google Scholar
[13] Perrin P, Millet F, Charleux B. Physical chemistry of polyelectrolytes: surfactant science series. New York, Marcel Dekker Inc.; 2000.Suche in Google Scholar
[14] Davis HT. Factors determining emulsion type: hydrophile–lipophile balance and beyond. Colloids Surf A. 1994;91:9–24.10.1016/0927-7757(94)02929-6Suche in Google Scholar
[15] Shahriar S. Effect of mixing protocol on formation of fine emulsions. Chem Eng Sci. 2006;61:3009–17.10.1016/j.ces.2005.10.071Suche in Google Scholar
[16] Wayne F, Mark B, Salah AH, Roberto A, Mathew S. Hot oil and gas wells can be stimulated without acids. SPE 86522; 2004.Suche in Google Scholar
[17] Price-Smith C, Parlar M, Kelkar S, Brady M, Hoxha B, Tibbles RJ, et al. Laboratory development of a novel, synthetic oil-based reservoir drilling and gravel-pack fluid system that allows stimultaneous gravel-packing and cake-cleanup in open-hole completions. SPE 64399; 2000.10.2118/64399-MSSuche in Google Scholar
[18] Dalmazzone C, Follotec AL, Audibert-Hayet A, Allan T, Poitrenaud H. Development of an optimized formulation for cleaning water injection wells drilled with oil-based systems. SPE 107632; 2007.10.2118/107632-MSSuche in Google Scholar
[19] Popov SG. The innovative approach to use of emulsion drilling fluid-reversible inverted drilling fluid. SPE 168661; 2013.10.2118/168661-RUSuche in Google Scholar
[20] Arvind P, Syed A. New opportunities for the drilling industry through innovative emulsifier chemistry. SPE 80247; 2003.Suche in Google Scholar
[21] Yang F, Niu Q, Lan Q, Sun D. Effect of dispersion pH on the formation and stability of pickering emulsions stabilized by layered double hydroxides particles. J Colloid Interface Sci. 2007;306:285–95.10.1016/j.jcis.2006.10.062Suche in Google Scholar PubMed
[22] Read ES, Fujii S, Amalvy JI, Randall DP, Armes DP. Effect of varying the oil phase on the behavior of pH-responsive latex-based emulsifiers: demulsification versus transitional phase inversion. Langmuir. 2004;20:7422–9.10.1021/la049431bSuche in Google Scholar PubMed
[23] Fujii S, Cai Y, Weaver JVM, Armes SP. Syntheses of shell cross-linked micelles using acidic abc triblock copolymers and their application as pH-responsive particulate emulsifiers. J Am Chem Soc. 2005;127:7304–5.10.1021/ja050049aSuche in Google Scholar PubMed
[24] Lan Q, Liu C, Yang F, Liu S, Xu J, Sun D. Synthesis of bilayer oleic acid-coated Fe3O4 nanoparticles and their application in pH-responsive pickering emulsions. J Colloid Interface Sci. 2007;310:260–9.10.1016/j.jcis.2007.01.081Suche in Google Scholar PubMed
[25] Ali S, Luyster M, Patel A. Dual purpose reversible reservoir drill-in fluid provides the perfect solution for drilling and completion efficiency of a reservoir. SPE/IADC 104110; 2006.10.2118/104110-MSSuche in Google Scholar
[26] Marchal F, Roudot A, Pantoustier N, Perrin P, Daillant J, Guenoum P. Emulsion stabilization and inversion using a pH- and temperature-sensitive amphiphilic copolymer. J Phys Chem B. 2007;111:13151–5.10.1021/jp0749827Suche in Google Scholar PubMed
[27] Binks BP, Jhonny AR. Inversion of emulsion stabilized solely by ionizable nanoparticles. Angew Chem Int Ed. 2005;44:441–4.10.1002/anie.200461846Suche in Google Scholar PubMed
[28] Binks BP, Lumsdon SO. Transitional phase inversion of solid-stabilized emulsions using particle mixtures. Langmuir. 2000;16:3748–56.10.1021/la991427qSuche in Google Scholar
[29] Patel AD. Reversible invert emulsion drilling fluids – a quantum leap in technology. SPE 47772; 1998.10.2118/47772-MSSuche in Google Scholar
[30] Salager JL, Forgiarini A, Marquez L, Pena A, Pizzino A, Rodriguez MP, et al. Using emulsion inversion in industrial processes. Adv Colloid Interface Sci. 2004;108/109:259–72.10.1016/j.cis.2003.10.008Suche in Google Scholar PubMed
[31] Zambrano N, Tyrode E, Mira I, Marquez L, Rodriguez MP, Salager JL. Emulsion catastrophic inversion from abnormal to normal morphology: 1 effect of the water-to-oil ratio rate of change on the dynamic inversion frontier. Ind Eng Chem Res. 2003;42:50–56.10.1021/ie0205344Suche in Google Scholar
[32] Mira I, Zambrano N, Tyrode E, Marquez L, Salager JL. Emulsion catastrophic inversion from abnormal to normal morphology: 2 effect of the stirring intensity on the dynamic inversion frontier. Ind Eng Chem Res. 2003;42:57–61.10.1021/ie020535wSuche in Google Scholar
[33] Wang J, Yang F, Li C, Liu S, Sun D. Double phase inversion of emulsions containing layered double hydroxide particles induced by adsorption of sodium dodecyl sulfate. Langmuir. 2008;24:10054–61.10.1021/la8001527Suche in Google Scholar PubMed
© 2020 Fei Liu et al., published by De Gruyter
This work is licensed under the Creative Commons Attribution 4.0 International License.
Artikel in diesem Heft
- Regular Articles
- Model of electric charge distribution in the trap of a close-contact TENG system
- Dynamics of Online Collective Attention as Hawkes Self-exciting Process
- Enhanced Entanglement in Hybrid Cavity Mediated by a Two-way Coupled Quantum Dot
- The nonlinear integro-differential Ito dynamical equation via three modified mathematical methods and its analytical solutions
- Diagnostic model of low visibility events based on C4.5 algorithm
- Electronic temperature characteristics of laser-induced Fe plasma in fruits
- Comparative study of heat transfer enhancement on liquid-vapor separation plate condenser
- Characterization of the effects of a plasma injector driven by AC dielectric barrier discharge on ethylene-air diffusion flame structure
- Impact of double-diffusive convection and motile gyrotactic microorganisms on magnetohydrodynamics bioconvection tangent hyperbolic nanofluid
- Dependence of the crossover zone on the regularization method in the two-flavor Nambu–Jona-Lasinio model
- Novel numerical analysis for nonlinear advection–reaction–diffusion systems
- Heuristic decision of planned shop visit products based on similar reasoning method: From the perspective of organizational quality-specific immune
- Two-dimensional flow field distribution characteristics of flocking drainage pipes in tunnel
- Dynamic triaxial constitutive model for rock subjected to initial stress
- Automatic target recognition method for multitemporal remote sensing image
- Gaussons: optical solitons with log-law nonlinearity by Laplace–Adomian decomposition method
- Adaptive magnetic suspension anti-rolling device based on frequency modulation
- Dynamic response characteristics of 93W alloy with a spherical structure
- The heuristic model of energy propagation in free space, based on the detection of a current induced in a conductor inside a continuously covered conducting enclosure by an external radio frequency source
- Microchannel filter for air purification
- An explicit representation for the axisymmetric solutions of the free Maxwell equations
- Floquet analysis of linear dynamic RLC circuits
- Subpixel matching method for remote sensing image of ground features based on geographic information
- K-band luminosity–density relation at fixed parameters or for different galaxy families
- Effect of forward expansion angle on film cooling characteristics of shaped holes
- Analysis of the overvoltage cooperative control strategy for the small hydropower distribution network
- Stable walking of biped robot based on center of mass trajectory control
- Modeling and simulation of dynamic recrystallization behavior for Q890 steel plate based on plane strain compression tests
- Edge effect of multi-degree-of-freedom oscillatory actuator driven by vector control
- The effect of guide vane type on performance of multistage energy recovery hydraulic turbine (MERHT)
- Development of a generic framework for lumped parameter modeling
- Optimal control for generating excited state expansion in ring potential
- The phase inversion mechanism of the pH-sensitive reversible invert emulsion from w/o to o/w
- 3D bending simulation and mechanical properties of the OLED bending area
- Resonance overvoltage control algorithms in long cable frequency conversion drive based on discrete mathematics
- The measure of irregularities of nanosheets
- The predicted load balancing algorithm based on the dynamic exponential smoothing
- Influence of different seismic motion input modes on the performance of isolated structures with different seismic measures
- A comparative study of cohesive zone models for predicting delamination fracture behaviors of arterial wall
- Analysis on dynamic feature of cross arm light weighting for photovoltaic panel cleaning device in power station based on power correlation
- Some probability effects in the classical context
- Thermosoluted Marangoni convective flow towards a permeable Riga surface
- Simultaneous measurement of ionizing radiation and heart rate using a smartphone camera
- On the relations between some well-known methods and the projective Riccati equations
- Application of energy dissipation and damping structure in the reinforcement of shear wall in concrete engineering
- On-line detection algorithm of ore grade change in grinding grading system
- Testing algorithm for heat transfer performance of nanofluid-filled heat pipe based on neural network
- New optical solitons of conformable resonant nonlinear Schrödinger’s equation
- Numerical investigations of a new singular second-order nonlinear coupled functional Lane–Emden model
- Circularly symmetric algorithm for UWB RF signal receiving channel based on noise cancellation
- CH4 dissociation on the Pd/Cu(111) surface alloy: A DFT study
- On some novel exact solutions to the time fractional (2 + 1) dimensional Konopelchenko–Dubrovsky system arising in physical science
- An optimal system of group-invariant solutions and conserved quantities of a nonlinear fifth-order integrable equation
- Mining reasonable distance of horizontal concave slope based on variable scale chaotic algorithms
- Mathematical models for information classification and recognition of multi-target optical remote sensing images
- Hopkinson rod test results and constitutive description of TRIP780 steel resistance spot welding material
- Computational exploration for radiative flow of Sutterby nanofluid with variable temperature-dependent thermal conductivity and diffusion coefficient
- Analytical solution of one-dimensional Pennes’ bioheat equation
- MHD squeezed Darcy–Forchheimer nanofluid flow between two h–distance apart horizontal plates
- Analysis of irregularity measures of zigzag, rhombic, and honeycomb benzenoid systems
- A clustering algorithm based on nonuniform partition for WSNs
- An extension of Gronwall inequality in the theory of bodies with voids
- Rheological properties of oil–water Pickering emulsion stabilized by Fe3O4 solid nanoparticles
- Review Article
- Sine Topp-Leone-G family of distributions: Theory and applications
- Review of research, development and application of photovoltaic/thermal water systems
- Special Issue on Fundamental Physics of Thermal Transports and Energy Conversions
- Numerical analysis of sulfur dioxide absorption in water droplets
- Special Issue on Transport phenomena and thermal analysis in micro/nano-scale structure surfaces - Part I
- Random pore structure and REV scale flow analysis of engine particulate filter based on LBM
- Prediction of capillary suction in porous media based on micro-CT technology and B–C model
- Energy equilibrium analysis in the effervescent atomization
- Experimental investigation on steam/nitrogen condensation characteristics inside horizontal enhanced condensation channels
- Experimental analysis and ANN prediction on performances of finned oval-tube heat exchanger under different air inlet angles with limited experimental data
- Investigation on thermal-hydraulic performance prediction of a new parallel-flow shell and tube heat exchanger with different surrogate models
- Comparative study of the thermal performance of four different parallel flow shell and tube heat exchangers with different performance indicators
- Optimization of SCR inflow uniformity based on CFD simulation
- Kinetics and thermodynamics of SO2 adsorption on metal-loaded multiwalled carbon nanotubes
- Effect of the inner-surface baffles on the tangential acoustic mode in the cylindrical combustor
- Special Issue on Future challenges of advanced computational modeling on nonlinear physical phenomena - Part I
- Conserved vectors with conformable derivative for certain systems of partial differential equations with physical applications
- Some new extensions for fractional integral operator having exponential in the kernel and their applications in physical systems
- Exact optical solitons of the perturbed nonlinear Schrödinger–Hirota equation with Kerr law nonlinearity in nonlinear fiber optics
- Analytical mathematical schemes: Circular rod grounded via transverse Poisson’s effect and extensive wave propagation on the surface of water
- Closed-form wave structures of the space-time fractional Hirota–Satsuma coupled KdV equation with nonlinear physical phenomena
- Some misinterpretations and lack of understanding in differential operators with no singular kernels
- Stable solutions to the nonlinear RLC transmission line equation and the Sinh–Poisson equation arising in mathematical physics
- Calculation of focal values for first-order non-autonomous equation with algebraic and trigonometric coefficients
- Influence of interfacial electrokinetic on MHD radiative nanofluid flow in a permeable microchannel with Brownian motion and thermophoresis effects
- Standard routine techniques of modeling of tick-borne encephalitis
- Fractional residual power series method for the analytical and approximate studies of fractional physical phenomena
- Exact solutions of space–time fractional KdV–MKdV equation and Konopelchenko–Dubrovsky equation
- Approximate analytical fractional view of convection–diffusion equations
- Heat and mass transport investigation in radiative and chemically reacting fluid over a differentially heated surface and internal heating
- On solitary wave solutions of a peptide group system with higher order saturable nonlinearity
- Extension of optimal homotopy asymptotic method with use of Daftardar–Jeffery polynomials to Hirota–Satsuma coupled system of Korteweg–de Vries equations
- Unsteady nano-bioconvective channel flow with effect of nth order chemical reaction
- On the flow of MHD generalized maxwell fluid via porous rectangular duct
- Study on the applications of two analytical methods for the construction of traveling wave solutions of the modified equal width equation
- Numerical solution of two-term time-fractional PDE models arising in mathematical physics using local meshless method
- A powerful numerical technique for treating twelfth-order boundary value problems
- Fundamental solutions for the long–short-wave interaction system
- Role of fractal-fractional operators in modeling of rubella epidemic with optimized orders
- Exact solutions of the Laplace fractional boundary value problems via natural decomposition method
- Special Issue on 19th International Symposium on Electromagnetic Fields in Mechatronics, Electrical and Electronic Engineering
- Joint use of eddy current imaging and fuzzy similarities to assess the integrity of steel plates
- Uncertainty quantification in the design of wireless power transfer systems
- Influence of unequal stator tooth width on the performance of outer-rotor permanent magnet machines
- New elements within finite element modeling of magnetostriction phenomenon in BLDC motor
- Evaluation of localized heat transfer coefficient for induction heating apparatus by thermal fluid analysis based on the HSMAC method
- Experimental set up for magnetomechanical measurements with a closed flux path sample
- Influence of the earth connections of the PWM drive on the voltage constraints endured by the motor insulation
- High temperature machine: Characterization of materials for the electrical insulation
- Architecture choices for high-temperature synchronous machines
- Analytical study of air-gap surface force – application to electrical machines
- High-power density induction machines with increased windings temperature
- Influence of modern magnetic and insulation materials on dimensions and losses of large induction machines
- New emotional model environment for navigation in a virtual reality
- Performance comparison of axial-flux switched reluctance machines with non-oriented and grain-oriented electrical steel rotors
- Erratum
- Erratum to “Conserved vectors with conformable derivative for certain systems of partial differential equations with physical applications”