Diallel analysis of length and shape of rice using Hayman and Griffing method
-
Agus Riyanto


Abstract
Length and shape of rice are important physical qualities that determine public acceptance of a variety and determine the price. Improvement of length and shape of rice requires information on the genetic parameters of these traits. Diallel analysis is one of the methods usually used to estimate the genetic parameters of a trait. The purpose of this study was to estimate the genetic parameters of length and shape of rice using full diallel analysis. The plant material used was a full diallel cross-population of six rice genotypes, namely, Basmati Pakistan, Basmati Delta 9, Inpago Unsoed 1, Inpari 31, Koshihikari, and Tarabas. Thirty-six genotypes consisting of parents, F 1 and F 1reciprocal, were planted using a randomized block design with three replications. The data of rice grain length and length:width ratio were used for diallel analysis using the Hayman and Griffing method-1. The results showed additive and non-additive gene action influencing the length and shape of rice. The effect of the additive gene action was greater than the non-additive gene action, while both broad-sense heritability and narrow-sense heritability were high, revealed that the selection of these traits at the early generation using the pedigree selection method may be considered. Length and shape of rice were not affected by the female parent cytoplasm so that F 2 and F 2reciprocal populations may be combined into one population the next generation.
1 Introduction
Rice (Oryza sativa L.) is one of the major food crops in the world. Nearly 50% of the world population consumes rice as the staple food; therefore, it has an important role in global food security [1,2]. Indonesia is the world’s third largest rice producer, and it is also one of the world’s main rice consumers [3]. More than 80% of Indonesian people consume rice as a staple food, and it contributes 62.1% of the energy intake [4]. It is the main source of income of approximately 18 million household farmers [5]. It also has strategic value from economic, environmental, social, and political aspects [6,7]. Therefore, rice self-sufficiency in Indonesia is required to fulfill the needs.
The government’s program for rice self-sufficiency has four main targets, that is, to increase the national production, to stabilize the domestic prices and reserve stocks, and to minimize imports [8]. Improving yield potential of rice varieties through plant breeding plays an important role to increase the national production. High yielding rice varieties contributed to 56% of the national rice production [6]. Thus, rice breeding in Indonesia aims to develop high yielding varieties that are in accordance with ecosystem conditions, social, cultural, and community interests [9].
Yield still is the main target of rice development; however, rice grain quality is now getting more attention due to increasing awareness of its importance [10]. Rice grain quality determines the market price, consumer acceptability of a variety, and consumer acceptability of a variety and becomes the second goal of rice plant breeding after yield [11,12]. High yielding varieties with high rice grain quality are easy for farmers to adopt [13].
Grain quality consists of rice length, rice shape, rice translucency, and rice chalkiness. Rice quality directly affects consumer acceptance. Consumers determine the rice quality first from grain quality, that is, rice appearance, length and shape of rice, which is followed by cooking quality and taste [14,15]. Hence, length and shape of rice determine the level of rice market demands and price [16]. Therefore, breeding rice varieties that encompass desirable length and shape of rice became a major concern for rice breeders in Indonesia.
A rice breeding program begins with increasing genetic diversity by crossing rice genotypes with wide genetic differences, followed by the traits selection of interest. The effectiveness of plant breeding programs increases in conjunction with scientific research that expands knowledge of plant genetic information [17]. An effective and efficient breeding program is determined by the genetic information that controls the inheritance of traits under study [18,19]. Sometimes selection in segregation populations results in low-quality progenies to fulfill breeding objectives [20]. Hence, it is necessary to know genetic information of traits before determining a breeding and selection method [21]. Diallel analysis is one of the manners to obtain genetic information for grain quality traits in rice such as length and shape of grain.
Diallel analysis is a mating design, which involves mating a set of parents in all possible combinations, to produce a set of F 1 progeny [22,23]. This method is useful to obtain genetic information that controls the inheritance of traits under study in early generation [24,25]. It is also the quickest method for understanding the genetic control of the inheritance of quantitative traits [26].
Diallel analysis can be carried out using Hayman and Griffing methods. Hayman’s method can be used to study gene action, genetic components, and heritability [27], whereas Griffing’s method [28] is used to estimate general combining ability (GCA), specific combining ability (SCA), and reciprocal effects. Also, it can be used to calculate additive and non-additive effects. Hayman and Griffing methods are often used together for interpretation of complementary data [21]. Hayman and Griffing methods have been used (either one or both) to obtain genetic information of plant traits. It has been widely used to study genetic parameters of length and shape of rice [29–41]. The results of the study show various conclusions. Furthermore, this research is rarely performed in Indonesia [42]. The present research was conducted to study genetic components of F 1 population from a cross of six parents with various lengths and shapes of rice. The purpose of this study was to estimate the genetic parameters of length and shape of rice using the full diallel analysis.
2 Materials and methods
2.1 Location of the experiment
A field experiment was conducted at the experimental farm of Agriculture Faculty, Jenderal Soedirman University, Purwokerto, Central Java, Indonesia. This location is at coordinates 7°24′28.7″LS and 109°15′13.3″N, and it is at an altitude of 112 m above the sea level. The experiment was carried out from June 2019 to December 2019.
2.2 Plant material
Six rice genotypes, i.e., Basmati Delta 9, Basmati Pakistan, Inpari 31, Inpago Unsoed 1, Koshihikari, and Tarabas rice, were used as the parents in this study. These parents have different origins and have various length and shape of rice (Table 1). The research material used consisted of 36 rice genotypes, which were developed from full diallel crosses among six parents. It consists of 6 parents, 15F 1, and 15F 1reciprocal.
Six rice genotypes used for diallel mating design
| No. | Genotype | Length and shape of rice | Origin |
|---|---|---|---|
| 1 | Basmati Delta 9 | Extra-long, slender | India |
| 2 | Basmati Pakistan | Extra-long, slender | Pakistan |
| 3 | Inpari 31 | Long, medium | Indonesia |
| 4 | Inpago Unsoed 1 | Medium, medium | Indonesia |
| 5 | Koshihikari | Short, round | Japan |
| 6 | Tarabas | Short, round | Indonesia |
2.3 Experimental design
The experimental design was a randomized complete block design with three replications. Seeds of 36 genotypes were sown in a seed box for 2 weeks, followed by transplanting to 35 cm × 40 cm polybags containing 8 kg of inceptisol soil. Each polybag consisted of one plant per genotype. Recommendations for rice cultivation and plant protection were adopted. Fertilizer applications of 0.4 g N/polybag and 1.0 g N-P-K/polybag was applied twice i.e., 10 days and 20 days after transplanting.
2.4 Data collection and analysis
At maturity, panicles were harvested from parents and all generations individually. Panicles were subjected as samples of length and shape of rice. The shape of rice is determined by rice length-to-width ratio [43]. Therefore, the observed trait in this study is rice length, width, and length-to-width ratio measured with help of digital caliper. Data collected were used for diallel analysis to estimate the genetic parameters of length and shape of rice. Diallel analysis was perfomed according to Hayman and Griffing method-1 [44] and the results were calculated using the software Microsoft® Excel.
Analysis of variance for F 1 in full diallel crosses
Analysis of variance for F 1 in full diallel crosses for length and shape of rice followed the statistical model
(1)where m is the general mean, T ij is the effect of i × jth genotype, b k is the effect of kth block,
Genetic components of variation
Genetic components of variation were calculated using the following formulas:
where W r is the covariance between parents and their offspring, V r is the variance of each array, Cov(W r ,V r ) is the covariance of (W r ,V r ), and Var(V r ) is the variance of V r .
where V 0L0 is the variance of parents and E is the environmental variance.
where V 0L0 is the variance of parents, W 0L01 is the covariance between the parents and the arrays, V 1L1 is the mean variance of the arrays, n is the number of parents, and E is the environmental variance.
where V 1L1 is the mean variance of the arrays, V 0L1 is the variance of the mean of arrays, and E is the environmental variance.
where V 0L0 is the variance of parents, W 0L01 is the covariance between the parents and the arrays, n is the number of parents, and E is the environmental variance.
where (M L1 − M L0)2 is the difference between the mean of the parents and the mean of their n 2 progeny, n is the number of parents, and E is the environmental variance.
where Error SS is the sum square of error, Rep. SS is the sum square of replication, r is the number of replications, and c is the number of errors.
where H 1 is the dominance variance and D is the additive genetic variance.
where H 1 is the dominance variance and H 2 is the proportion of positive or negative genes in the parent.
where D is the additive genetic variance, H 1 is the dominance variance, and F is the mean covariance of additive and dominance.
where h 2 is the dominance effect and H 2 is the proportion of positive or negative genes in the parent.
where (W r + V r ) is the parental order of dominance, Y r is the parental measurement, Cov(W r + V r ) is the covariance of (W r + V r ), Var(W r + V r ) is the variance of (W r + V r ), and Var(Y r ) is the variance of Y r.
where D is the additive genetic variance, H 1 is the dominance variance, H 2 is the proportion of positive or negative genes in the parent, F is the mean covariance of additive and dominance, and E is the environmental variance.
where D is the additive genetic variance, H 1 is the dominance variance, H 2 is the proportion of positive or negative genes in the parent, F is the mean covariance of additive and dominance, and E is the environmental variance.
2.5 Combining ability analysis
The statistical model for the analysis variance of combining ability that was used was as follows:
where Y
ij
is the mean of i × jth genotype, m is the general mean, g
i
is the general combing ability (gca) effect of ith parent, g
j
is the general combing ability (gca) effect of jth parent, S
ij
is the interaction, i.e., SCA effect, r
ij
is the reciprocal effect, and
where Y i. is the total mean value of ith genotype cross, Y .j is the total mean value of jth genotype selfing, n is the number of parents, and Y is the grand total.
where Y ij is the mean of i × jth genotype, Y ji is the mean of j × ith genotype, Y i. is the total of mean value of ith genotype cross, Y .i is the total of mean value of ith genotype selfing, Y j. is the total of mean value of jth genotype cross, Y .j is the total of mean value of jth genotype selfing, n is the number of parents, and Y is the grand total.
where Y ij is the mean of i × jth genotype and Y ji is the mean of j × ith genotype.
3 Results and discussion
3.1 Analysis of variance for genotypes
Analysis of variance showed significant difference among genotypes for length and shape of rice grain (Table 2). Similar findings were also reported by Bano and Singh [39] and Hijam et al. [37]. Significantly different in the analysis of variance among genotypes is a requirement for estimating genetic parameters using diallel analysis [44]. Thus, significant differences among the genotypes for length and shape of rice indicate that they are suitable for further genetic studies.
Analysis of variance for F 1 in a full diallel cross for length and shape of rice
| Source of variation | Degrees of freedom | Mean square | |
|---|---|---|---|
| Rice length (mm) | Rice shape | ||
| Block | 2 | 0.06 | 0.01 |
| Genotype | 35 | 3.16* | 1.51* |
| Error | 70 | 0.04 | 0.02 |
*Significantly different at the level of 5%.
3.2 Genetic components of variation
3.2.1 Gene interaction
The values of regression coefficient of b(W r , V r ) for length and shape of rice (1.20 and 1.15, respectively) were not significantly different from one (Table 3). Similar results reported by Bano and Singh [39] for kernel length before cooking (rice length) and kernel length/breadth ratio before cooking (rice length). The value of regression of coefficient of b(W r , V r ) may be used to determine the gene interaction of a trait. Based on t test, a significantly different value of b(W r , V r ) from one indicates gene interaction, while a non-significantly different value of b(W r , V r ) from one reflected no gene interaction [44]. It means that there is no interaction between genes controlling length and shape of rice in this study.
Estimates of genetic components of variation for length and shape of rice
| Genetic components | Rice length (mm) | Rice shape |
|---|---|---|
| b(W r , V r ) | 1.20ns | 1.15ns |
| D | 2.72* | 1.36* |
| H 1 | 0.26* | 0.19* |
| H 2 | 0.25* | 0.17* |
| F | 0.44* | 0.33* |
| h 2 | −0.01ns | 0.04ns |
| E | 0.01ns | 0.01ns |
| (H 1/D)1/2 | 0.31 | 0.38 |
| H 2/4H 1 | 0.23 | 0.22 |
| Kd/Kr | 1.71 | 1.95 |
| h 2/H 2 | −0.03 | 0.22 |
| r[(W r + V r ),Y r ] | 0.69 | 0.89 |
| h 2 bs | 0.99 | 0.99 |
| h 2 ns | 0.94 | 0.91 |
| Ratio of h 2 ns:h 2 bs | 0.95 | 0.92 |
*Significantly different at the level of 5%, ns = not significantly different.
3.2.2 Additive (D) and dominance (H 1) variance
Additive (D) and dominance (H 1) variance were significantly different for length and shape of rice (Table 3). Significantly different values of the components D and H 1 indicated the importance of both additive and non-additive gene action in the expression of traits [45], so that length and shape of rice are influenced by both additive and non-additive types of gene action. Similar findings were also observed by Kato [29], Fu et al. [31], Daradjat and Rumanti [42], Kumar et al. [32,33], Rafii et al. [30], and Senthil Kumar and Mudhalvan [38] for length and size of rice.
The results showed the value of additive variance (D) for length and shape of rice is 2.72 and 1.36, respectively, and the value of dominance variance (H 1) for length and shape of rice is 0.26 and 0.19, respectively (Table 3). These showed that the influence of additive variance is greater than dominance variance (D > H 1) for length and shape of rice. Higher magnitude of additive variance (D) indicated the greater role of additive gene action, while dominance variance indicated the greater importance of non-additive gene action vice versa [40,45]. The value of the additive variance, which is greater than the dominance variance, indicates the increasing importance of additive gene action [32,33]. This means that in this study, length and shape of rice are more influenced by additive gene action than non-additive gene action. These results are in accordance with the findings of Kato [29] and Thattil and Perera [46] for length and size of rice. However, Daradjat and Rumanti [42] and Senthil Kumar and Mudhalvan [38] reported that the non-additive gene action dominated over additive gene action for length and size of rice.
3.2.3 Gene distribution in the parents
Gene distribution in the parents can be determined by H 2 values. The results showed that the H 2 values for length and shape of rice were significantly different (Table 3). This indicates that the genes determining the inheritance of length and shape of rice are not evenly distributed among the parents. Genes controlling length and shape of rice that are not evenly distributed in parents have also been reported [38].
Proportion of positive genes to negative genes is indicated by the value of H 1 component against H 2 component. The value of H 1 is greater than the H 2 indicating the number of positive genes would be higher than negative genes. On contrary, the value of the H 1 is smaller than H 2 reflecting that the number of positive genes would be fewer than the negative genes [21,47]. Table 3 shows that the value of H 1 is 0.26 and 0.19, respectively, and the value of H 2 is 0.27 and 0.17, respectively, for length and shape of rice. It shows that the value of H 1 is greater than H 2 for length and shape of rice, meaning that positive genes are more involved in determining length and shape of rice than negative genes. The results were in agreement with those of Raju et al. [40].
Proportion of positive genes to negative genes in all parents also can be seen from ratio of H 2/4H 1. Values lower than 0.25 indicate that positive and negative genes are not present in unequal proportions in the parents [45,48]. The results showed the value of H 2/4H 1 for length and shape of rice is 0.23 and 0.22, respectively (Table 3). They were lower than 0.25, reflecting the unequal distribution of positive and negative genes in the parents. Similar findings were reported by previous studies [38,39,40].
3.2.4 Dominance level
The influence of dominance can be seen from the value of mean degree of dominance as estimated by (H 1/D)1/2. A value (H 1/D)1/2 more than 1 indicates over dominance, while a value (H 1/D)1/2 between 0 and 1 indicates partial dominance (Hayman, 1954). Table 3 shows the value (H 1/D)1/2 of length and shape of rice is less than 1 (0.31 and 0.38, respectively), which indicated the existence of partial dominance in these traits. Rice length controlled by a partial dominance gene was also reported by Kato [29].
3.2.5 Dominance effect
Dominance effect is indicated by the h 2 value. Table 3 shows that h 2 values were not significantly different for length and shape of rice. This indicated no difference in average deviation of F 1 from most parents [47].
3.2.6 Environmental variance
Table 3 shows that environmental variance exhibited no significant influence on length and shape of rice. This reflected no influence of environmental factor on the expression of the traits studied [45]. Therefore, it is known that the expression of length and shape of rice is more influenced by genetic than environment effects.
3.2.7 Proportion of dominant gene to recessive gene
Proportion of dominant genes to recessive genes is shown by F component and Kd/Kr ratio. The positive value of F component reflects a greater number of dominant genes than recessive genes in the parent [47,49]. A ratio of Kd/Kr greater than one indicates more dominant genes in the parent; conversely, the ratio of Kd/Kr smaller than one indicated more recessive genes in the parent [44]. The results showed a positive value of F component, and a ratio of Kd/Kr of the length and shape of rice is greater than one (1.71 and 1.95, respectively) (Table 3), which indicated more dominant genes in the parent for length and shape of rice. The same finding was reported by Raju et al. [40].
3.2.8 Number of gene groups
Component of h 2/H 2 gives an indication of the number of gene groups that control a trait. The h 2/H 2 values of length and shape of rice are −0.03 and 0.22, respectively, lower than one. The ratio smaller than one indicated the involvement of single gene or one group of genes, which are responsible for their genetic control [45]. As a result, length and shape of rice are controlled by at least a single group of genes.
3.2.9 Direction and order of dominance
The positive value of the correlation between (W r + V r ) and Y r and close to unity indicates that dominant alleles have predominantly negative effects, i.e., acting in the direction of lower yields [50]. A positive value is obtained in the correlation (W r + V r ) and Y r for length and shape of rice (Table 3). That is, in length and shape of rice, the dominant genes cause the rice to be short and round.
The direction and order of dominance can be seen in the value (W r + V r ) component. Based on the value (W r + V r ) in Table 4, the dominance order of length and shape of rice was Inpago Unsoed 1, Koshihikari, Tarabas, Basmati Delta 9, and Basmati Pakistan. This is reinforced by the graph of the relationship between the covariance (W r ) and variance (V r ) in Figures 1 and 2.
Value (W r + V r ) of length and shape of rice
| Genotypes | Rice length | Rice shape |
|---|---|---|
| Basmati Delta 9 | 2.32 | 1.30 |
| Basmati Pakistan | 2.46 | 1.43 |
| Inpari 31 | 1.99 | 0.93 |
| Inpago Unsoed 1 | 1.00 | 0.37 |
| Koshihikari | 1.75 | 0.69 |
| Tarabas | 1.87 | 0.73 |
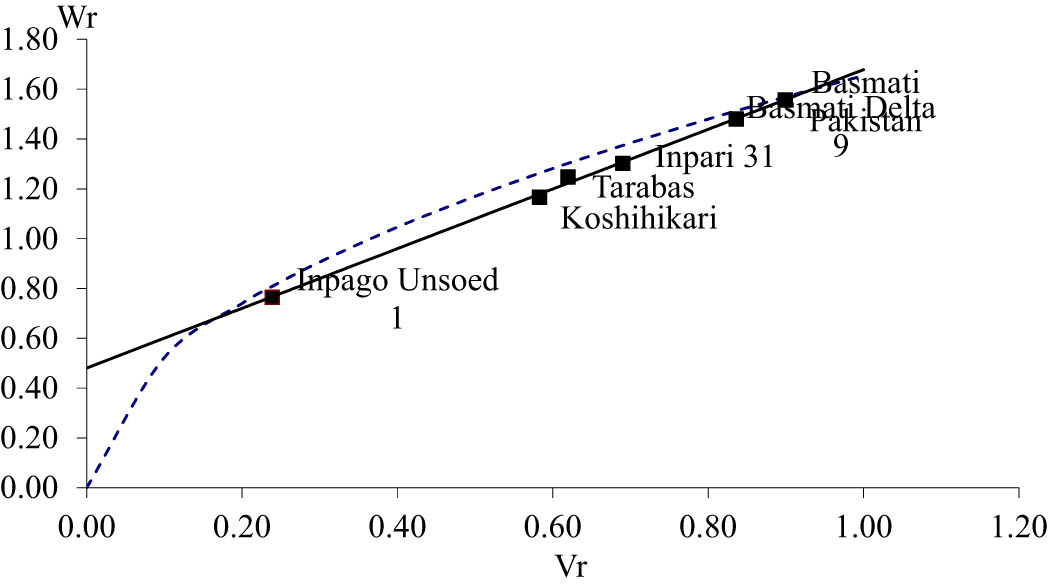
Covariance (W r ) and variance (V r ) graph of rice length.
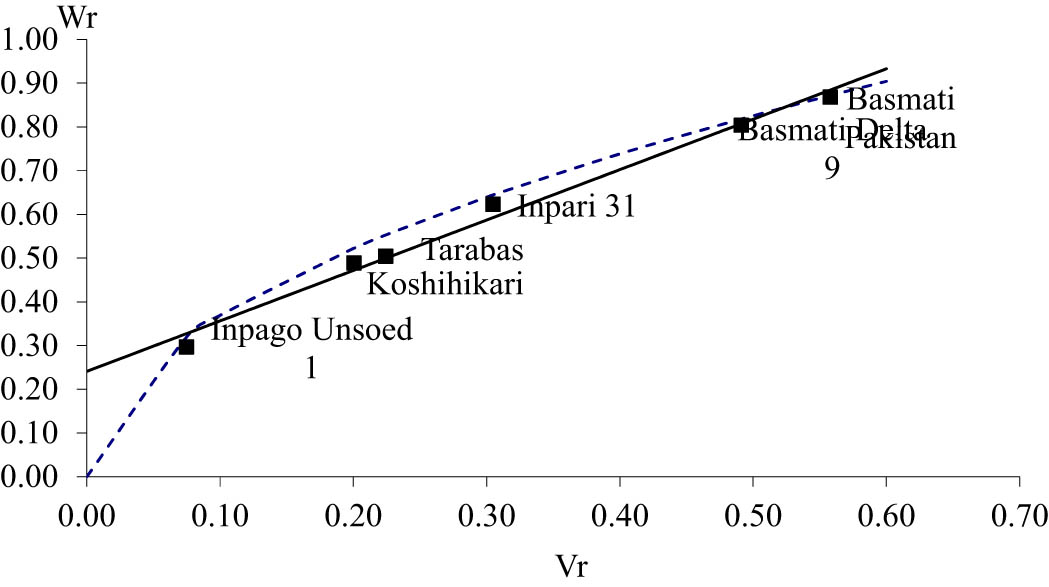
Covariance (W r ) and variance (V r ) graph of rice shape.
Distribution of parental array points along the regression line reflected genetic diversity of a trait [51]. The array point was scattered along the regression line for length and shape of rice, indicating genetic diversity for these traits. The position of the parents on the graph of the relationship between the covariance (W r ) and variance (V r ) reflects the order of dominance. The position of parent which is closer to zero point indicating it is the most dominant genes [47,50]. Inpago Unsoed 1 is the closest to zero, reflecting that this parent has the mostly dominant genes for length and shape of rice. Mostly, Basmati Pakistan contains a recessive gene for length and shape of rice since it is the farthest from zero. Basmati, which has extra-long and slender rice, contains the most recessive gene, and this means that the gene controlling long and slender rice is recessive to the short and round rice gene. This result is in agreement with the findings of Kato [29], Murai and Kinoshita [41], and Ali et al. [52].
The straight line intercepted the vertical axis (W r ) above the origin for length and shape of rice (Figures 1 and 2). The straight line that intercepted the vertical axis (W r ) above the origin indicated partial dominance of the genes controlling a trait [21,50,51]. This reveals that length and shape of rice were controlled by a partial dominant gene as described previously. Partial dominance results in the appearance of each trait having a tendency to approach the mid-parent value and not having overdominance, which exceeds the best parent [53]. This is reflected in the h 2 value of length and shape of rice, which is not significantly different, so that there is no difference between the F 1 average and the parents’ average.
3.2.10 Heritability
Broad sense heritability (h 2 bs) estimates for length and shape of rice are similar to 0.99. Narrow sense heritability (h 2 ns) estimates for these traits are 0.94 and 0.91, respectively (Table 3). Values of heritability more than 0.5 are categorized as high (Stansfield, 1991); thus, broad-sense heritability (h 2 bs) for length and shape of rice is categorized as high heritability. Similar findings were reported by previous studies [54].
The estimated value of broad-sense heritability indicates the relative contribution of genetic factors to the variation of the observed trait [55]. A high broad-sense heritability value indicates that traits are more influenced by genetic than environmental factors [56]. In this study, broad-sense heritability estimate of length and shape of rice is high, indicating the influence of genetic was greater than environmental factors. Low influence of environmental factors was also reflected in the non-significant environmental variance observed in Table 3.
Narrow sense heritability estimates indicate the role of additive gene action in a trait. Estimates of narrow-sense heritability indicate more additive gene action than non-additive gene action [4,57,58,59]. In this study, the narrow sense heritability estimate of length and shape of rice was high, meaning that additive gene action played a more important role than non-additive gene action.
Ratio of narrow-sense heritability and broad-sense heritability reflects the role of additive and non-additive gene action in a trait. The ratio value closer to one indicates the total genetic variance of a trait is caused by additive gene action [60]. Table 3 shows that the ratio of narrow-sense heritability and broad-sense heritability is 0.95 for rice length and 0.92 for rice shape, respectively. This indicates that additive gene action determines size and shape of rice more than non-additive gene action as previously described. Traits that have high additive variance and heritability in the F 1 population may be selected using individual selection. Individual selection may be applied to traits that have additive variance and high heritability in the F 1 population [21] so that the selection of length and shape of rice may be carried out using individual selection such as pedigree. This finding was in agreement with that of Raju et al. [40].
3.3 Combining ability estimation of length and shape of rice
Gene action and cytoplasm influence of the female parent for a trait can be predicted through combining ability. Variances of GCA, SCA, and reciprocals were obtained from diallel analysis of Griffing method-1. Variances of GCA and SCA are associated with non-additive and additive gene actions, respectively [61,62,63]. Reciprocal variance is useful for knowing the effect of female parent cytoplasm of a trait [64].
GCA is endorsed to additive gene action, and SCA is mainly attributed to non-additive gene action [59,65]. This study shows significant effects of GCA and SCA on length and shape of rice (Table 5). The significant GCA and SCA indicated the importance of both additive and non-additive gene actions in the expression of these traits. This finding was in agreement with that of Singh et al. and Soni et al. [66,67].
Analysis of variance of combining ability and GCA:SCA ratio of length and shape of rice
| Source of variance | Degree of freedom | Mean square | |
|---|---|---|---|
| Rice length | Rice shape | ||
| GCA | 5 | 6.909* | 3.154* |
| SCA | 15 | 0.138* | 0.092* |
| Reciprocal | 15 | 0.020ns | 0.006ns |
| Error | 70 | 0.015 | 0.007 |
| GCA:SCA ratio | 50.060 | 34.280 | |
*Significantly different at the level of 5%, ns = not significantly different.
The magnitude of the effect of additive gene action and non-additive gene action on a trait can be determined from GCA:SCA ratio [68]. A high GCA:SCA ratio indicates that additive gene action plays a more important role in the expression of a trait than non-additive gene action [69]. Ratio of GCA:SCA greater than one indicates that additive gene action has more influence on the expression of a trait, and conversely, a GCA:SCA ratio less than one reflected that non-additive gene action has more influence on the expression of a trait [70]. In this study, ratio of GCA:SCA of length and shape of rice is greater than one (50.060 and 32.280, respectively) (Table 5), indicating that additive gene action is more influential than non-additive gene action on the expression of these traits. These results agree with the estimation of gene action using the Hayman method as described previously. Additive gene action in length and shape of grain has been previously reported [66,67]. Therefore, the selection of length and shape of grain will be effective using pedigree method [71].
Non-significant reciprocal effects were observed for both length and shape of rice (Table 5). This indicated that there was no influence of the female parent cytoplasm on the inheritance of these traits [64,72] so that the size and shape of the rice are not affected by the female parent cytoplasm.
4 Conclusion
The influence of additive and non-additive gene actions on length and shape of rice was confirmed. The effect of the additive gene action was greater than the non-additive gene action, while both broad-sense heritability and narrow-sense heritability were high. This revealed that the selection of these traits at the early generation using the pedigree selection method may be considered. Length and shape of rice were not affected by the female parent cytoplasm so that F 2 and F 2reciprocal populations might be combined into one population in the next selection generation.
Acknowledgments
A part of this work was supported by the Applied research scheme of Research and community services at Jenderal Soedirman University.
-
Funding information: Part of this work was supported by competitive research Grant of Research and community Services Institute, Jenderal Soedirman University.
-
Conflict of interest: The authors state no conflict of interest.
-
Data availability statement: All data generated or analyzed during this study are included in this published article and its supplementary information file.
References
[1] Haryanto TAD, Adi EBM, Riyanto A, Susanti D, Hidayat P. Genetic studies on grain protein content and some agronomic characters of rice by halfdiallel crossing system. Asian J Appl Sci. 2017;5(2):461–6.10.24203/ajas.v5i2.4753Suche in Google Scholar
[2] Bandumula N. Rice Production in Asia: key to global food security. Proc Natl Acad Sci India Sect B - Biol Sci. 2018;88(4):1323–8.10.1007/s40011-017-0867-7Suche in Google Scholar
[3] Connor M, de Guia AH, Pustika AB, Sudarmaji, Kobarsih M, Hellin J. Rice farming in Central Java, Indonesia – adoption of sustainable farming practices, impacts and implications. Agronomy. 2021;11(5):1–14.10.3390/agronomy11050881Suche in Google Scholar
[4] NafisahRoza, C, Yunani N, Hairmansis A, Rostiati T, Jamil A. Genetic variabilities of agronomic traits and bacterial leaf blight resistance of high yielding rice varieties. Indones J Agric Sci. 2020;20(2):43–54.10.21082/ijas.v20n2.2019.p43-54Suche in Google Scholar
[5] Haryanto TAD, Suwarto, Riyanto A, Susanti D, Farid N, Kantun IN, et al. Variability of grain protein content in improved upland rice genotypes and its response to locations. Electron J Plant Breed. 2011;2(2):200–8.Suche in Google Scholar
[6] Syahri SR, Somantri RU. The use of improved varieties resistant to pests and diseases to increase national rice production. J Litbang Pert. 2016;35(1):25–36 (in Indonesian).10.21082/jp3.v35n1.2016.p25-36Suche in Google Scholar
[7] Mariyono J. Rice production in Indonesia: policy and performance. Asia Pac J Public Adm. 2014;36(2):123–34.10.1080/23276665.2014.911489Suche in Google Scholar
[8] Nuryanti S, Hakim DB, Siregar H, Sawit MH. Political economic analysis of rice self-sufficiency in Indonesia. Indones J Agric Sci. 2017;18(2):77–86.10.21082/ijas.v18n2.2017.p77-86Suche in Google Scholar
[9] Susanto U, Daradjat AA, Suprihatno B. Advance in lowland rice breeding in Indonesia. J Litbang Pertan. 2003;22(3):125–31 (in Indonesian).Suche in Google Scholar
[10] Riyanto A, Haryanto TAD, Hidayat P. Genetic parameter and analysis of traits interrelationship in F2 rice generation of Inpago Unsoed 1 X Basmati Delta 9. Am J Sustain Agric. 2021;15(1):15–28.Suche in Google Scholar
[11] Jewel Z, Patwary A, Maniruzzaman S, Barua R, Begum S. Physico-chemical and genetic analysis of aromatic rice (Oryza sativa L.) germplasm. Agric. 2011;9(1–2):82–8.10.3329/agric.v9i1-2.9482Suche in Google Scholar
[12] Juliano BO. Rice chemistry and quality. Manila: International Rice Research Institute; 2008. p. 480Suche in Google Scholar
[13] Nugraha Y. Inheritance of grain elongation of local rice varieties. Penelit Pertan Tanam Pangan. 2007;26(1):1–7 (in Indonesian).Suche in Google Scholar
[14] Li J, Thomson M, McCouch SR. Fine mapping of a grain-weight quantitative trait locus in the pericentromeric region of rice chromosome 3. Genetics. 2004;168(4):2187–95.10.1534/genetics.104.034165Suche in Google Scholar PubMed PubMed Central
[15] Yuan P-R, Kim H, Chen Q-H, Ju H-G, Ji S-D, Ahn S-N. Mapping QTLs for grain quality using an introgression line population from a cross between Oryza sativa and O. rufipogon. J Crop Sci Biotechnol. 2010;13(4):205–12.10.1007/s12892-010-0094-8Suche in Google Scholar
[16] Aslam K, Arif M. SSR analysis of chromosomes 3 and 7 of rice (Oryza sativa L.) associated with grain length. Pak J Bot. 2014;46(4):1363–73.Suche in Google Scholar
[17] Fehr WR. Principles of Cultivar Development: Theory and Technique. Vol. 1. IOWA, USA: Macmillan Publishing Company; 1991. p. 536Suche in Google Scholar
[18] Atnaf M, Tesfaye K, Dagne K. Hayman’ s diallel analysis to study genetic parameters of phenological traits in common bean (Phaseolus vulgaris). Int J Agric Sci Nat Resour. 2014;1(4):65–71.Suche in Google Scholar
[19] Chamundeswari N, Satyanarayana PV, Reddy KR, Suryanarayana Y. Estimates of genetic components in diallel crosses for yield and yield contributing characters in rice (Oryza sativa L.). Int J Sci Env Technol. 2016;5(6):3951–6.Suche in Google Scholar
[20] Asfaliza R, Rafii M, Saleh G, Omar O, Puteh A. Combining ability and heritability of selected rice varieties for grain yield. Aust J Crop Sci. 2012;6(12):1718–23.Suche in Google Scholar
[21] Syukur M, Sujiprihati S, Yunianti R. Analysis using Hayman method to study genetic parameters of yield components in pepper (Capsicum annuum L.). HAYATI J Biosci. 2010;17(4):183–8. 10.4308/hjb.17.4.183.Suche in Google Scholar
[22] Chahal GS, Gosal SS. Principles and procedures of plant breeding: Biotechnological and conventional approaches. New Delhi: Narosa Publishing House; 2003. p. 604Suche in Google Scholar
[23] Viana JMS, Cruz CD, Cardoso AA. Theory and analysis of partial diallel crosses. Genet Mol Biol. 1999;22(4):591–9.10.1590/S1415-47571999000400021Suche in Google Scholar
[24] Murtaza N. Study of gene effects for boll number, boll weight, and seed index in cotton. J Cent Eur Agric. 2005;6(3):255–62.Suche in Google Scholar
[25] Khan AS, Habib I. Gene action in five parent diallel cross of spring wheat (Triticum aestivum L.). Pakistan. J Biol Sci. 2003;6(23):1945–8.10.3923/pjbs.2003.1945.1948Suche in Google Scholar
[26] Nair B, Ghorade RB. Griffing and Hayman’s diallel analyses of variance for shoot fly resistance traits in sorghum. Plant Arch. 2016;16(2):705–14.Suche in Google Scholar
[27] Hayman BI. The theory and analysis of diallel crosses. Genetics. 1954;39(6):789–809.10.1093/genetics/39.6.789Suche in Google Scholar PubMed PubMed Central
[28] Griffing B. Concept of general and specific combining ability in relation to diallel crossing systems. Aust J Biol Sci. 1956;9(4):463.10.1071/BI9560463Suche in Google Scholar
[29] Kato T. Diallel analysis of grain size of rice (Oryza sativa L). Jpn J Breed. 1989;39:39–45. http://www.mendeley.com/research/geology-volcanic-history-eruptive-style-yakedake-volcano-group-central-japan/.10.1270/jsbbs1951.39.39Suche in Google Scholar
[30] Rafii MY, Zakiah MZ, Asfaliza R, Haifaa I, Latif MA, Malek MA. Grain quality performance and heritability estimation in selected F1 rice genotypes. Sains Malaysiana. 2014;43(1):1–7.10.1155/2014/308042Suche in Google Scholar
[31] Fu F, Wang F, Huang W, Peng H, Wu Y, Huang D. Genetic analysis on grain characters in hybrid rice. Acta AgronSin. 1994;20(1):39–45.Suche in Google Scholar
[32] Kumar S, Singh HB, Sharma JK. Mode of gene action for grain yield, its components and grain quality traits in non-segregating generation (F1) of rice. ORYZA-An Int J Rice. 2008;45(2):152–5.Suche in Google Scholar
[33] Kumar S, Singh H, Sharma J. Gene action for grain yield, its components and quality traits in hill rice (Oryza sativa L.) varieties. Indian J Genet Plant Breed. 2007;67(3):275–7.Suche in Google Scholar
[34] Kiani G. Analysis of combining ability in rice varieties for quantitative traits. Not Bot Horti Agrobot Cluj-Napoca. 2019;11(3):436–9.10.15835/nsb11310449Suche in Google Scholar
[35] Chakraborty R, Chakraborty S, Dutta BK, Paul SB. Combining ability analysis for yield and yield components in bold grained rice (Oryza sativa L.) of Assam. Acta Agron. 2009;58(1):9–13.Suche in Google Scholar
[36] Devi KR, Parimala K, Venkanna V, Lingaiah N, Hari Y. Gene action and combining ability for yield and quality traits in rice (Oryza sativa L.). Int J Curr Microbiol Appl Sci. 2018;7(1):2834–43.10.20546/ijcmas.2018.701.338Suche in Google Scholar
[37] Hijam C, Singh NB, Laishram JM. Diallel analysis of yield and its important components in aromatic rice (Oryza sativa L.). Indian J Agric Res. 2019;53(1):67–72.10.18805/IJARe.A-5141Suche in Google Scholar
[38] Senthil Kumar N, Mudhalvan S. Genetic analysis in rice (Oryza sativa) for grain yield and its component characters. Plant Arch. 2018;18(2):1447–50.Suche in Google Scholar
[39] Bano DA, Singh SP. Genetic studies of yield and quality traits in aromatic rice genotypes through Hayman’s approach. Oryza-An Int J Rice. 2019;56(4):361–7.10.35709/ory.2019.56.4.3Suche in Google Scholar
[40] Raju CHS, Krishna L, Raju CHD, Vanisree S, Reddy PN, Reddy BB. Genetic studies of quantitative traits through Hayman’ s approach in rice. Oryza. 2011;48(4):314–8.Suche in Google Scholar
[41] Murai M, Kinoshita T. Diallel analysis of traits concerning yield in rice. Jpn J Breed. 1986;36:7–15. http://www.mendeley.com/research/geology-volcanic-history-eruptive-style-yakedake-volcano-group-central-japan/.10.1270/jsbbs1951.36.7Suche in Google Scholar
[42] Daradjat AA, Rumanti AI. Inheritance and heritability of the size and shape of rice grain (Oryza sativa L.). Penelit Pertan Tanam Pangan. 2002;21(2):1–4 (in Indonesian).Suche in Google Scholar
[43] Takeda K. Inheritance of grain size and its implications for rice breeding. In: Proceeding of Second International Rice Genetic Symposium. Manila: International Rice Research Institute; 1991. p. 181–9.10.1142/9789812814272_0018Suche in Google Scholar
[44] Singh RK, Chaudhary BD. Biometrical methods Quant Genet Anal. New Delhi: Kalyani Publishers; 1979. p. 318Suche in Google Scholar
[45] Quamruzzaman A, Salim MMR, Akhter L, Rahman MM, Chowdhury MAZ. Heterosis, combining ability and gene action for yield in bottle gourd. Am J Plant Sci. 2020;11(5):642–52.10.4236/ajps.2020.115048Suche in Google Scholar
[46] Thattil MP, Perera ALT. Evaluation of yield and grain quality characters in rice hybrids using diallel genetic design. Trop Agric Research. 1991;3:65–76.Suche in Google Scholar
[47] Yunianti R, Sastrosumarjo S, Sujiprihati S, Surahman M, Hidayat SH. Diallel analysis of chili (Capsicum annuum L.) resistance to Phytophthora capsici Leonian. J Agron Indones. 2011;39(3):168–72.Suche in Google Scholar
[48] Agustina M, Sutjahjo SH, Trikoesoemaningtyas, Jagau Y. Genetic parameter estimation on upland rice agronomic characters in ultisols through diallel analysis. HAYATI J Biosci. 2005;12(3):98–102 (in Indonesian).10.1016/S1978-3019(16)30333-3Suche in Google Scholar
[49] Kumar S, Singh HB, Sharma JK. Combining ability analysis for grain yield and other associated traits in rice. Oryza. 2007;44(2):108–14.Suche in Google Scholar
[50] Sousa JA, de Maluf WR. Diallel analyses and estimation of genetic parameters of hot pepper (Capsicum chinense Jacq.). Sci Agric. 2003;60(1):105–13.10.1590/S0103-90162003000100016Suche in Google Scholar
[51] Singh S. Diallel studies and heritability estimates using Hayman’s approach in Ocimum spp. Acta. Sci Agric. 2020;4(11):16–22.10.31080/ASAG.2020.04.0909Suche in Google Scholar
[52] Ali SS, Yasin SI, Latif T. Genetic control of grain length and shape in Basmati lines of rice (Oryza sativa L.). J Agric Res. 2014;52(1):25–34.Suche in Google Scholar
[53] Istiqlal MRA, Syukur M, Wahyu Y. Diallel analysis for genetic parameters study of yield component in pepper (Capsicum annuum L.) using Hayman method. J Agron Indones. 2014;42(2):125–31.Suche in Google Scholar
[54] Chunhai S, Zongthan S. Inheritance and improvement of grain shape in Indica rice. Chin J Rice Sci. 1995;9(1):27–32.Suche in Google Scholar
[55] Chozin M, Sumardi, Sudjamiko S, Barchia MF. Genetic variability and traits association analyses on F2 generations for determination of selection criteria in Indonesian inland swamp rice breeding. Aust J Crop Sci. 2017;11(5):535–41.10.21475/ajcs.17.11.05.p317Suche in Google Scholar
[56] Raghavendra P, Hittalmani S. Genetic parameters of two BC2F1 populations for development of superior male sterile lines pertaining to morpho-floral traits for aerobic rice (Oryza sativa L.). SAARC J Agric. 2016;13(2):198–213.10.3329/sja.v13i2.26580Suche in Google Scholar
[57] Zare M, Choukan R, Bihamta M, Heravan EM, Kamelmanesh M. Gene action for some agronomic traits in maize (Zea mays L.). Crop Breed J. 2011;1(2):133–41.Suche in Google Scholar
[58] Priyanka K, Jaiswal HKH. Genetic analysis of yield and yield contributing traits in Boro rice (Oryza sativa L.) over environments. Bangladesh J Agric Res. 2017;42(3):457–66.10.3329/bjar.v42i3.34504Suche in Google Scholar
[59] El-Malky MM, Al-Daej M. Studies of genetic parameters and cluster analysis of some quantitative characters through diallel analysis of rice (Oryza sativa L.). Vegetos. 2018;31(1):1–10.Suche in Google Scholar
[60] Parkes EY, Fregene M, Dixon A, Boakye-Peprah B, Labuschagne MT. Combining ability of cassava genotypes for cassava mosaic disease and cassava bacterial blight, yield and its related components in two ecological zones in Ghana. Euphytica. 2013;194(1):13–24.10.1007/s10681-013-0936-9Suche in Google Scholar
[61] Rojas BA, Sprague GF. A Comparison of variance components in corn yield trials: III. general and specific combining ability and their interaction with locations and years 1. Agron J. 1952;44(9):462–6.10.2134/agronj1952.00021962004400090002xSuche in Google Scholar
[62] Bassuony NN, Zsembeli J. Inheritance of some flag leaf and yield characteristics by half-diallel analysis in rice crops (Oryza sativa L.). Cereal Res Commun. 2021;49(3):503–10. 10.1007/s42976-020-00115-z.Suche in Google Scholar
[63] Sprague GF, Tatum LA. General vs specific combining ability in single crosses of corn. Agron J. 1942;34(10):923–32.10.2134/agronj1942.00021962003400100008xSuche in Google Scholar
[64] Rukundo P, Shimelis H, Laing M, Gahakwa D. Combining ability, maternal effects, and heritability of drought tolerance, yield and yield components in sweetpotato. Front Plant Sci. 2017;7:1–14.10.3389/fpls.2016.01981Suche in Google Scholar PubMed PubMed Central
[65] Ray S, Islam AA, Rasul M, Saikat M, Ahmed J. Combining Ability for yield related traits of Boro rice (Oryza sativa L.). Ann Bangladesh Agric. 2022;25(1):23–31.10.3329/aba.v25i1.58152Suche in Google Scholar
[66] Soni RK, Koli N, Kumar M, Tak Y, Aarif M, Meena C, et al. Studies on combining ability for grain yield and related traits in advanced breeding lines in rice (Oryza sativa L.). Pharma Innov J. 2021;10(12):146–7.Suche in Google Scholar
[67] Singh V, Dwivedi D, Khan N, Verma R, Kumar M, Jena D, et al. Combining ability analysis for yield and contributing traits in short duration rice (Oryza sativa L.). Oryza. 2020;57(4):271–6.10.35709/ory.2020.57.4.2Suche in Google Scholar
[68] Calle F, Perez JC, Gaitán W, Morante N, Ceballos H, Llano G, et al. Diallel inheritance of relevant traits in cassava (Manihot esculenta Crantz) adapted to acid-soil savannas. Euphytica. 2005;144(1–2):177–86.10.1007/s10681-005-5810-ySuche in Google Scholar
[69] Baker RJ. Issues in diallel analysis. Crop Sci. 1978;18(4):533–6.10.2135/cropsci1978.0011183X001800040001xSuche in Google Scholar
[70] Abdel-Moneam MA, Sultan MS, Sadek SE, Shalof MS. Combining abilities for yield and yield components in diallel crosses of six new yellow maize inbred lines. Int J Plant Breed Genet. 2015;9(2):86–94.10.3923/ijpbg.2015.86.94Suche in Google Scholar
[71] Aamer S, Ibrahim H. Assessment of combining ability for some grain yield and quality traits in rice (Oryza sativa L.) by using Griffing method and biplot analysis. J Plant Prod. 2020;11(12):1615–23.10.21608/jpp.2020.149834Suche in Google Scholar
[72] Sujiprihati S, Yunianti R, Syukur M. Undang. Estimation of heterosis and combining ability for yield components of six chili (Capsicum annuum L.) genotypes in full diallel crosses. Bul Agron. 2007;35(1):28–35 (in Indonesian).Suche in Google Scholar
© 2023 the author(s), published by De Gruyter
This work is licensed under the Creative Commons Attribution 4.0 International License.
Artikel in diesem Heft
- Regular Articles
- The impact of COVID-19 pandemic on business risks and potato commercial model
- Effects of potato (Solanum tuberosum L.)–Mucuna pruriens intercropping pattern on the agronomic performances of potato and the soil physicochemical properties of the western highlands of Cameroon
- Machine learning-based prediction of total phenolic and flavonoid in horticultural products
- Revamping agricultural sector and its implications on output and employment generation: Evidence from Nigeria
- Does product certification matter? A review of mechanism to influence customer loyalty in the poultry feed industry
- Farmer regeneration and knowledge co-creation in the sustainability of coconut agribusiness in Gorontalo, Indonesia
- Lablab purpureus: Analysis of landraces cultivation and distribution, farming systems, and some climatic trends in production areas in Tanzania
- The effects of carrot (Daucus carota L.) waste juice on the performances of native chicken in North Sulawesi, Indonesia
- Properties of potassium dihydrogen phosphate and its effects on plants and soil
- Factors influencing the role and performance of independent agricultural extension workers in supporting agricultural extension
- The fate of probiotic species applied in intensive grow-out ponds in rearing water and intestinal tracts of white shrimp, Litopenaeus vannamei
- Yield stability and agronomic performances of provitamin A maize (Zea mays L.) genotypes in South-East of DR Congo
- Diallel analysis of length and shape of rice using Hayman and Griffing method
- Physicochemical and microbiological characteristics of various stem bark extracts of Hopea beccariana Burck potential as natural preservatives of coconut sap
- Correlation between descriptive and group type traits in the system of cow’s linear classification of Ukrainian Brown dairy breed
- Meta-analysis of the influence of the substitution of maize with cassava on performance indices of broiler chickens
- Bacteriocin-like inhibitory substance (BLIS) produced by Enterococcus faecium MA115 and its potential use as a seafood biopreservative
- Meta-analysis of the benefits of dietary Saccharomyces cerevisiae intervention on milk yield and component characteristics in lactating small ruminants
- Growth promotion potential of Bacillus spp. isolates on two tomato (Solanum lycopersicum L.) varieties in the West region of Cameroon
- Prioritizing IoT adoption strategies in millennial farming: An analytical network process approach
- Soil fertility and pomelo yield influenced by soil conservation practices
- Soil macrofauna under laying hens’ grazed fields in two different agroecosystems in Portugal
- Factors affecting household carbohydrate food consumption in Central Java: Before and during the COVID-19 pandemic
- Properties of paper coated with Prunus serotina (Ehrh.) extract formulation
- Fertiliser cost prediction in European Union farms: Machine-learning approaches through artificial neural networks
- Molecular and phenotypic markers for pyramiding multiple traits in rice
- Natural product nanofibers derived from Trichoderma hamatum K01 to control citrus anthracnose caused by Colletotrichum gloeosporioides
- Role of actors in promoting sustainable peatland management in Kubu Raya Regency, West Kalimantan, Indonesia
- Small-scale coffee farmers’ perception of climate-adapted attributes in participatory coffee breeding: A case study of Gayo Highland, Aceh, Indonesia
- Optimization of extraction using surface response methodology and quantification of cannabinoids in female inflorescences of marijuana (Cannabis sativa L.) at three altitudinal floors of Peru
- Production factors, technical, and economic efficiency of soybean (Glycine max L. Merr.) farming in Indonesia
- Economic performance of smallholder soya bean production in Kwara State, Nigeria
- Indonesian rice farmers’ perceptions of different sources of information and their effect on farmer capability
- Feed preference, body condition scoring, and growth performance of Dohne Merino ram fed varying levels of fossil shell flour
- Assessing the determinant factors of risk strategy adoption to mitigate various risks: An experience from smallholder rubber farmers in West Kalimantan Province, Indonesia
- Analysis of trade potential and factors influencing chili export in Indonesia
- Grade-C kenaf fiber (poor quality) as an alternative material for textile crafts
- Technical efficiency changes of rice farming in the favorable irrigated areas of Indonesia
- Palm oil cluster resilience to enhance indigenous welfare by innovative ability to address land conflicts: Evidence of disaster hierarchy
- Factors determining cassava farmers’ accessibility to loan sources: Evidence from Lampung, Indonesia
- Tailoring business models for small-medium food enterprises in Eastern Africa can drive the commercialization and utilization of vitamin A rich orange-fleshed sweet potato puree
- Revitalizing sub-optimal drylands: Exploring the role of biofertilizers
- Effects of salt stress on growth of Quercus ilex L. seedlings
- Design and fabrication of a fish feed mixing cum pelleting machine for small-medium scale aquaculture industry
- Indicators of swamp buffalo business sustainability using partial least squares structural equation modelling
- Effect of arbuscular mycorrhizal fungi on early growth, root colonization, and chlorophyll content of North Maluku nutmeg cultivars
- How intergenerational farmers negotiate their identity in the era of Agriculture 4.0: A multiple-case study in Indonesia
- Responses of broiler chickens to incremental levels of water deprivation: Growth performance, carcass characteristics, and relative organ weights
- The improvement of horticultural villages sustainability in Central Java Province, Indonesia
- Effect of short-term grazing exclusion on herbage species composition, dry matter productivity, and chemical composition of subtropical grasslands
- Analysis of beef market integration between consumer and producer regions in Indonesia
- Analysing the sustainability of swamp buffalo (Bubalus bubalis carabauesis) farming as a protein source and germplasm
- Toxicity of Calophyllum soulattri, Piper aduncum, Sesamum indicum and their potential mixture for control Spodoptera frugiperda
- Consumption profile of organic fruits and vegetables by a Portuguese consumer’s sample
- Phenotypic characterisation of indigenous chicken in the central zone of Tanzania
- Diversity and structure of bacterial communities in saline and non-saline rice fields in Cilacap Regency, Indonesia
- Isolation and screening of lactic acid bacteria producing anti-Edwardsiella from the gastrointestinal tract of wild catfish (Clarias gariepinus) for probiotic candidates
- Effects of land use and slope position on selected soil physicochemical properties in Tekorsh Sub-Watershed, East Gojjam Zone, Ethiopia
- Design of smart farming communication and web interface using MQTT and Node.js
- Assessment of bread wheat (Triticum aestivum L.) seed quality accessed through different seed sources in northwest Ethiopia
- Estimation of water consumption and productivity for wheat using remote sensing and SEBAL model: A case study from central clay plain Ecosystem in Sudan
- Agronomic performance, seed chemical composition, and bioactive components of selected Indonesian soybean genotypes (Glycine max [L.] Merr.)
- The role of halal requirements, health-environmental factors, and domestic interest in food miles of apple fruit
- Subsidized fertilizer management in the rice production centers of South Sulawesi, Indonesia: Bridging the gap between policy and practice
- Factors affecting consumers’ loyalty and purchase decisions on honey products: An emerging market perspective
- Inclusive rice seed business: Performance and sustainability
- Design guidelines for sustainable utilization of agricultural appropriate technology: Enhancing human factors and user experience
- Effect of integrate water shortage and soil conditioners on water productivity, growth, and yield of Red Globe grapevines grown in sandy soil
- Synergic effect of Arbuscular mycorrhizal fungi and potassium fertilizer improves biomass-related characteristics of cocoa seedlings to enhance their drought resilience and field survival
- Control measure of sweet potato weevil (Cylas formicarius Fab.) (Coleoptera: Curculionidae) in endemic land of entisol type using mulch and entomopathogenic fungus Beauveria bassiana
- In vitro and in silico study for plant growth promotion potential of indigenous Ochrobactrum ciceri and Bacillus australimaris
- Effects of repeated replanting on yield, dry matter, starch, and protein content in different potato (Solanum tuberosum L.) genotypes
- Review Articles
- Nutritional and chemical composition of black velvet tamarind (Dialium guineense Willd) and its influence on animal production: A review
- Black pepper (Piper nigrum Lam) as a natural feed additive and source of beneficial nutrients and phytochemicals in chicken nutrition
- The long-crowing chickens in Indonesia: A review
- A transformative poultry feed system: The impact of insects as an alternative and transformative poultry-based diet in sub-Saharan Africa
- Short Communication
- Profiling of carbonyl compounds in fresh cabbage with chemometric analysis for the development of freshness assessment method
- Special Issue of The 4th International Conference on Food Science and Engineering (ICFSE) 2022 - Part I
- Non-destructive evaluation of soluble solid content in fruits with various skin thicknesses using visible–shortwave near-infrared spectroscopy
- Special Issue on FCEM - International Web Conference on Food Choice & Eating Motivation - Part I
- Traditional agri-food products and sustainability – A fruitful relationship for the development of rural areas in Portugal
- Consumers’ attitudes toward refrigerated ready-to-eat meat and dairy foods
- Breakfast habits and knowledge: Study involving participants from Brazil and Portugal
- Food determinants and motivation factors impact on consumer behavior in Lebanon
- Comparison of three wine routes’ realities in Central Portugal
- Special Issue on Agriculture, Climate Change, Information Technology, Food and Animal (ACIFAS 2020)
- Environmentally friendly bioameliorant to increase soil fertility and rice (Oryza sativa) production
- Enhancing the ability of rice to adapt and grow under saline stress using selected halotolerant rhizobacterial nitrogen fixer