Changes in the course of constant loading consolidation in soil with modeled granulometric composition contaminated with petroleum substances
-
Piotr Stajszczak
 ,
Paweł Dobak
,
Paweł Dobak

Abstract
The effect of contamination with petroleum substances (A1 jet fuel and 15W40 mineral oil) on the compressibility and consolidation of mixtures of ice-dammed clay and aeolian sand was determined in a Barden–Rowe consolidometer adapted for liquid-phase contamination tests. The deterioration of the filtration capacity of the contaminated soil medium relative to the non-contamination condition is reflected by the mobilization of higher values of pore pressure u b and pore water pressure parameter C CL in the course of consolidometer tests. As a consequence, lower values of the compressibility modulus M 0 and the consolidation coefficient c v are obtained in relation to the results of uncontaminated samples. This generally indicates changes in the consolidation parameters of the soil medium in the presence of the tested contaminants. Methodologically, a delay in the onset of the steady-state phase of constant loading (CL) consolidation was observed in contaminated soils. This provides a rationale for programming the tests at lower values of the CL rate. At the same time, the unified model characterization of C CL–T CL allows us to assess the reliable nature of the results. This allows one to recommend CRL (constant rate of loading) tests as a reliable tool for determining the consolidation properties of cohesive soils in the design of soil isolation barriers.
1 Introduction
Research conducted so far on the influence of petroleum products on the behavior of mineral soils clearly indicate that these compounds significantly modify the geological and engineering properties of fine-grained soils [1,2,3,4]. However, these results very often do not clearly indicate the direction of changes in the values of parameters describing the filtration and consolidation properties of fine-grained soils contaminated with hydrocarbons [5,6,7,8]. An increase in the coefficient of permeability values and coefficient of consolidation, observed after fine-grained soil contamination with hydrocarbons, can be explained by the flocculation of clay minerals, an apparent change in the grain size distribution and the changes occurring in the total soil porosity [9,10]. On the other hand, petroleum products show higher viscosity than water. Therefore, their presence in the pores of the soil will reduce the effective porosity, which can lead to a decrease in the values of the parameters describing the filtration and consolidation properties of fine-grained soils [11,12].
Uniaxial consolidation tests carried out under continuous load (CL) increase conditions (CL-type) make it possible to assess changes in the permeability of the investigated soil due to the mandatory measurement of pore pressure throughout the test. Based on the assumptions of Terzaghi’s consolidation theory [13], model characterizations of pore pressure changes have been determined, which also enables an analysis of the reliable nature of the results obtained [14,15,16,17]. These standards have so far been investigated in studies of naturally structured soils and on soil pastes, the characteristics of which better fit the theoretical assumptions [18,19,20,21,22]. The development of geoengineering applications creates the need to extend the discussed methodology to the study of soils with used modeled structures, among other things, as ground isolation barriers, which are subjected to the influence of various contaminants [23,24,25,26,27,28,29].
For the development of this research methodology, it is also necessary to assess the impact of contamination of the pore space on changes in the model characteristics of the course of CL consolidation (including one of the options – constant rate load [CRL] tests with a CL increase). The soil materials used are usually mixtures of clay and silt fractions that provide the required insulation and a uniformly distributed sandy fraction, the contribution of which improves the geotechnical properties of the subsurface (increasing stiffness and strength) [30]. In the design of such materials, it is important to optimize the composition of mixtures and mutual adjustment of consolidation test programs to it. In tests aimed at evaluating the properties of the soil under conditions of contamination, it is necessary to take into account the selection of the correct speed of load application, discrepancies in the course of CL consolidation in relation to the characteristics of uncontaminated soils, changes in compressibility and pore water flow conditions [31,32].
2 Materials and methods
The soil material used in the preparation of soil mixtures comes from exposures in Mazovia (Poland). These are Quaternary ice-dammed clays (Plecewice) and aeolian sands from Międzyborów near Żyrardów.
Periglacial ice-dammed clays deposited during the Vistula glaciation are developed as varved clays composed of alternating stratum of bright (with a higher proportion of silty fraction) and dark (more clayey) layers. They occur at the land surface along the edge of the Warsaw-Blonie terrace and form a continuous complex, from Plecewice to Kampinos [33]. The clays were sampled from a quarry of ceramic raw material in such a way as to characterize annual sedimentation cycles involving bright and dark layers.
Sands are dune material and their selection for mixing was dictated primarily by granulometric and mineral homogeneity. They were deposited at the turn of the Pleistocene and Holocene as a result of aeolian processes that formed a dune complex in the Żyrardów region [34].
The granulometric composition of the raw materials and the soil mixtures prepared is shown in Figure 1.

Particle size distribution curves of the natural dammed clay, aeolian sand and soil mixture unpolluted and contaminated by fuel products. M UP – unpolluted soil mixture; M Jet A1 2% – soil mixture polluted with Jet A1 aviation fuel, contaminant content 2%, M Jet A1 10% – soil mixture polluted with Jet A1 aviation fuel, contaminant content 10%; M OM 2% – soil mixture polluted with mineral oil 15W40, contaminant content 2%.
Before preparing the soil mixture, the aeolian sand was dried at 105°C. At the same time, samples of ice-dammed clay were subjected to a procedure consisting of the following steps:
grinding the intact samples into smaller pieces,
flooding the sample with deionized water, hand mixing and homogenization – the mixing of the soil was completed when a homogeneous soil paste was obtained,
drying the soil paste at room temperature.
Next, in accordance with the adopted research program, soil mixtures were prepared where the proportion of ice-dammed clay did not exceed 27–28% of the total weight of the solid phase of the mixture. The homogenization of the material to ensure model test conditions first required repeated manual mixing. The prepared material was poured with deionized water so that the obtained moisture content of the soil mixtures corresponded to a value of about 1.0–1.1w L. After another thorough mixing, the prepared samples were placed in Teflon-lined rigid cylinders and consolidated for 4–5 weeks under a constant load of 20 kPa.
The effect of petroleum-derived substances on the behavior of soil mixtures was determined by mixing in assumed proportions with Jet A1 aviation fuel or 15W40 mineral oil. The petroleum products used in the study (Table 1) have different physical and chemical properties (viscosity, density), so it was possible to evaluate the effect of the type of contaminants on changes in the consolidation and filtration properties of contaminated soils. In the adopted research program, petroleum products were poured into the soil mixture samples in appropriate proportions. The content of jet aviation A1 fuel in the tested samples was 2 and 10% of the total weight of the soil skeleton, while the content of 15W40 mineral oil did not exceed 2% of the weight of the soil skeleton. Petroleum products were added to the prepared clay–sand mixtures after manual homogenization was completed. They were then left in tightly closed containers for a period of 4–5 weeks, after which they were flooded with deionized water. Soil samples were contaminated with petroleum products in the air-dry state. This fact reinforced the role of the adsorption of contaminants on the surface of the soil skeleton. For this reason, it is assumed that during the water flooding stage petroleum substances were not replaced in the porous space by deionized water. Further preparation procedure included initial consolidation in cylinders, just like uncontaminated soil.
Selected physical parameters of petroleum products
| Characteristics | Aviation fuel JET A1 | Mineral oil 15W40 | Water |
|---|---|---|---|
| Color | Light yellow | Brownish-yellow | Colorless |
| Physical state at room temperature | Liquid | Liquid | Liquid |
| Density [g/cm3] | 0.77–0.84 | 0.88 | 1.00 |
| Kinematic viscosity [mm2/s] | 1.2–1.7; temperature: 20–40°C | 13.5–16.3; temperature: 100°C | 1.0; temperature: 20°C |
| Flash-point [oC] | >38 | >215 | — |
| Water solubility | Insoluble and not miscible | Insoluble and not miscible | — |
| Dielectric constant | ∼2 | ∼2 | ∼80 |
For consolidation tests under CL increment conditions in a Barden–Rowe consolidometer [35,36], cylindrical specimens with dimensions of 6.34 cm and a height of 2.50 cm were cut from the soil material. The measuring system of the apparatus was modified for testing in situations where the liquid phase of the sample is contaminated (Figure 2). Interfaces were placed in the backpressure and pore pressure supply system to prevent contaminants from entering the downstream part of the consolidometer measurement system.

Measurement of fluid-phase pressure using a consolidometer dedicated to CRL testing of fine-grained soils contaminated with hydrocarbons. Red lines: elements preserving measuring system against contaminations.
In selected cases, small cubic samples of uncontaminated soil mixtures (1 cm3) were also taken from the consolidated material for microstructure investigations using a scanning electron microscope (SEM).
The physical properties of the tested soil material (Table 2) were also determined in accordance with PN-EN ISO 17892-1:2015 [37], PN-EN ISO 17892-2:2015 [38], PN-EN ISO 17892-4:2017 [39] and PN-EN ISO 17892-12:2018 [40] (only uncontaminated samples), as well as with optional consideration of classification according to PN-B-04481:1988 [41] and PN-EN ISO 14688-1,2:2018 [42,43].
Physical parameters of tested soils
| Parameter | Ice-dammed clays from Plecewice | Aeolian sand from Międzyborów | Mixture of clay and sand not contaminated with hydrocarbons | Mixture of clay and sand contaminated with JET A1 aviation fuel | Mixture of clay and sand contaminated with mineral oil 15W40 |
|---|---|---|---|---|---|
| w [%] | 27.7–32.4 | 2.7–2.9 | 21.2–22.7 | 23.5–29.5 | 21.8–22.3 |
| w p [%] | 25.7–28.5 | — | 9.1–9.7 | — | — |
| w L [%] | 70.2–79.6 | — | 23.1–24.5 | — | — |
| I L [−] | 0.01–0.13 | — | 0.86–0.88 | — | — |
| I C [−] | 0.87–0.99 | − | 0.12–0.14 | − | − |
| ρ s [Mg/m3] | 2.67–2.72 | 2.65 | 2.69 | ||
| ρ [Mg/m3] | 1.88–1.92 | — | 2.03–2.05 | 1.87–2.03 | 1.92–2.01 |
| n [−] | 0.44–0.48 | — | 0.36–0.38 | 0.38–0.45 | 0.38–0.41 |
| e [−] | 0.78–0.91 | — | 0.57–0.60 | 0.62–0.83 | 0.61–0.69 |
| f i [%] | 72–84 | 0 | 15 | 15–16 | 13 |
| f π [%] | 15–27 | 0 | 9 | 6–7 | 9 |
| f p [%] | 0–1 | 100 | 76 | 78 | 78 |
| C U [−] | — | 2.3–2.4 | — | — | — |
| Hydrocarbon content in the pores of soil [%] | 0.0 | 0 | 0 | 2 and 10 | 2 |
| Name of soil acc. to PN-EN ISO 14688-1:2018-05 | CLAY | Fine to medium SAND | Medium sandy CLAY | ||
w – moisture content, w p – plastic limit, w L – liquid limit, I L – liquidity index, I c – consistency index, ρ s – particle density, ρ– bulk density, n – porosity, e – void ratio, f i – clay fraction, f π – silt fraction, f p – sand fraction, C U – coefficient of uniformity.
3 Methodology for CL consolidation studies and interpretation of the results
In the CRL consolidometric tests carried out, constant stress rates of 100 and 200 kPa/h for the soil mixtures and 50 and 100 kPa/h for the uncontaminated paste of ice-dammed clay were used. The adoption of different loading velocities in the tests of ice-dammed clay paste and soil mixture arises from the different permeabilities of the tested soils. The loading velocity applied in the CRL test has an impact on the mobilization of the pore pressure and should be determined for each soil individually. Adopting a loading velocity that is too high during a CRL test can lead to a recession of the CL consolidation course. If the test soil sample is loaded too slowly, the determined values of the coefficient of consolidation and coefficient of permeability will be overestimated.
Determination of compressibility and soil consolidation parameters requires analysis of mutual relations of three groups of physical quantities (Table 3) changed in the course of the test:
direct results of measurements: vertical load (σ stress), uniaxial strain (δh or ε), and pore water pressure u b measured at the lower base of the sample,
compressibility modulus M 0 and consolidation coefficient c v determined by methods dedicated to CL testing – equations (8) and (9) in Table 3,
dimensionless indicators of CL test phases: pore water pressure parameter C CL and relative consolidation time T CL – equations (10) and (12) in Table 3.
Parameters defining consolidation of fine-grained soils during CRL test
| Parameter | Formula | Unit | Number | |
|---|---|---|---|---|
| Direct measured and calculated parameters | Current time during the test | t | [s] | (1) |
| Stress | σ | [kPa] | (2) | |
| Initial height of the sample | H 0 | [m] | (3) | |
| Current height of the sample (length of vertical drainage) | H | [m] | (4) | |
| Pore water pressure | u b | [kPa] | (5) | |
| Strain |
|
[−] | (6) | |
| Compressibility and consolidation parampara tests | Effective stress |
|
[kPa] | (7) |
| Modulus of compressibility |
|
[MPa] | (8) | |
| Coefficient of consolidation |
|
[m2/s] | (9) | |
| Indicators of test phases | Parameter of the pore water pressure |
|
[−] | (10) |
| Specific time of consolidation |
|
[s] | (11) | |
| Relative consolidation time |
|
[−] | (12) | |
Changes in the values of the above parameters can be optionally analyzed in the course of each test as a function of time t of the ongoing test, the increasing stress σ and also the relative consolidation time T CL. However, the parameter T CL requires a prior determination of the coefficient of consolidation c v. T CL values are useful for determining the non-steady and steady phase boundaries of CL tests.
A key issue in the interpretation of consolidometer investigation is the designation of the test’s steady-state phase, in which the determined parameters are treated as authoritative. An initial indicator of the non-steady-state phase is the characterization of changes in pore pressure values. However, the stabilization of pore pressure, expected according to the theoretical model, occurs only when assuming a constant value of the specific time of consolidation t (T = 1). The changes of the pore pressure u b against the real-time are depend on the velocity of increase stress and properties of tested soil. It can be noted at the same rates of stress increase that higher values of pore pressure u bmax are obtained in soils with lower permeability, characterized by lower consolidation coefficients (Figure 3a). The considered changes in the pore pressure against the relative consolidation time show that under model conditions, when T CL = 2, there is a stabilization of the pore pressure, i.e., a steady-state phase begins (Figure 3b).

Theoretical model of pore water pressure parameters against the increasing of stress (a and c) and relative consolidation time (b and d) (for CRL tests).
Converting the obtained u b values to the dimensionless pore water pressure parameter C CL, one obtains the T CL–C CL relationship, which is standardized for all CRL tests, from which it follows that the steady-state limit T CL = 2 corresponds to the dimensionless value C CL = 0.24 (Figure 3c). The theoretical invariability (Figure 3d) of this relationship at different test speeds and for different characteristics of the soil consolidation parameters shows that the value C CL = 0.24 can be treated as one of the alternative criteria for the steady-state limit [16]. No prior determination of the value of the consolidation coefficient c v and the conventional consolidation time t (T = 1) is required in this approach.
The above-described dependencies derived from the theoretical model are the background for the evaluation and interpretation of the obtained experimental results: ε, M 0, u b, and c v as a function of increasing σ. At the same time, the graphs of these relationships indicate the locations corresponding to the boundary of the transient and steady-state phases determined on the basis of the criterion C CL = 0.24.
4 Test results
The purpose of the presented consolidometric tests is to determine not only the compressibility and consolidation parameters of the tested soil mixtures but also the prediction of changes in the insulating capacity of the tested soil under contamination conditions. Hence, against the background of the course and phases of the CL consolidation test, the characteristics obtained will be discussed: normal strain, pore pressure, compressibility and consolidation coefficient.
4.1 Microstructure
Soil mixtures before the start of CRL tests show a matrix microstructure. This type of microstructure is characterized by the random occurrence of silt and sand fraction grains in a homogeneous clay mass that forms a matrix. In the obtained SEM images, the identification features of the matrix microstructure were well documented. The grains of the silt and sand fraction in the tested soil samples are stuck chaotically in the clay mass. There are also often visible depressions, which are traces of grains that were removed during the preparation of samples for observation in an electron microscope (Figure 4a and b). The clay mass forming the matrix is characterized by loose packing. Contacts of clay particles in individual microaggregates can be described as face–face (F–F) and edge–edge (E–F). The pores are mainly inter-aggregate, isometric in shape with no clear orientation.

Microstructure of uncontaminated soil mixtures before (a, b) and after (c, d) CRL test performed with a loading velocity of 100 kPa/h. 1 – matrix, 2 – depressions left by grains of sand and silt, 3 – microaggregates and 4 – pores. Magnifications: (a) ×95, (b) ×800, (c) ×75 and (d) ×500.
After the CRL test, the microstructure of the clay and sand mixtures, as in the tests of unloaded samples, shows the characteristics of a matrix microstructure (Figure 4c and d). The dominant type of contacts after loading is edge–edge contacts. The pores between the structural elements of the soil skeleton are mostly inter-microaggregate and assume anisometric shapes. The clay matrix, after the CRL tests, is tightly packed and does not show any directional orientation.
4.2 Compressibility
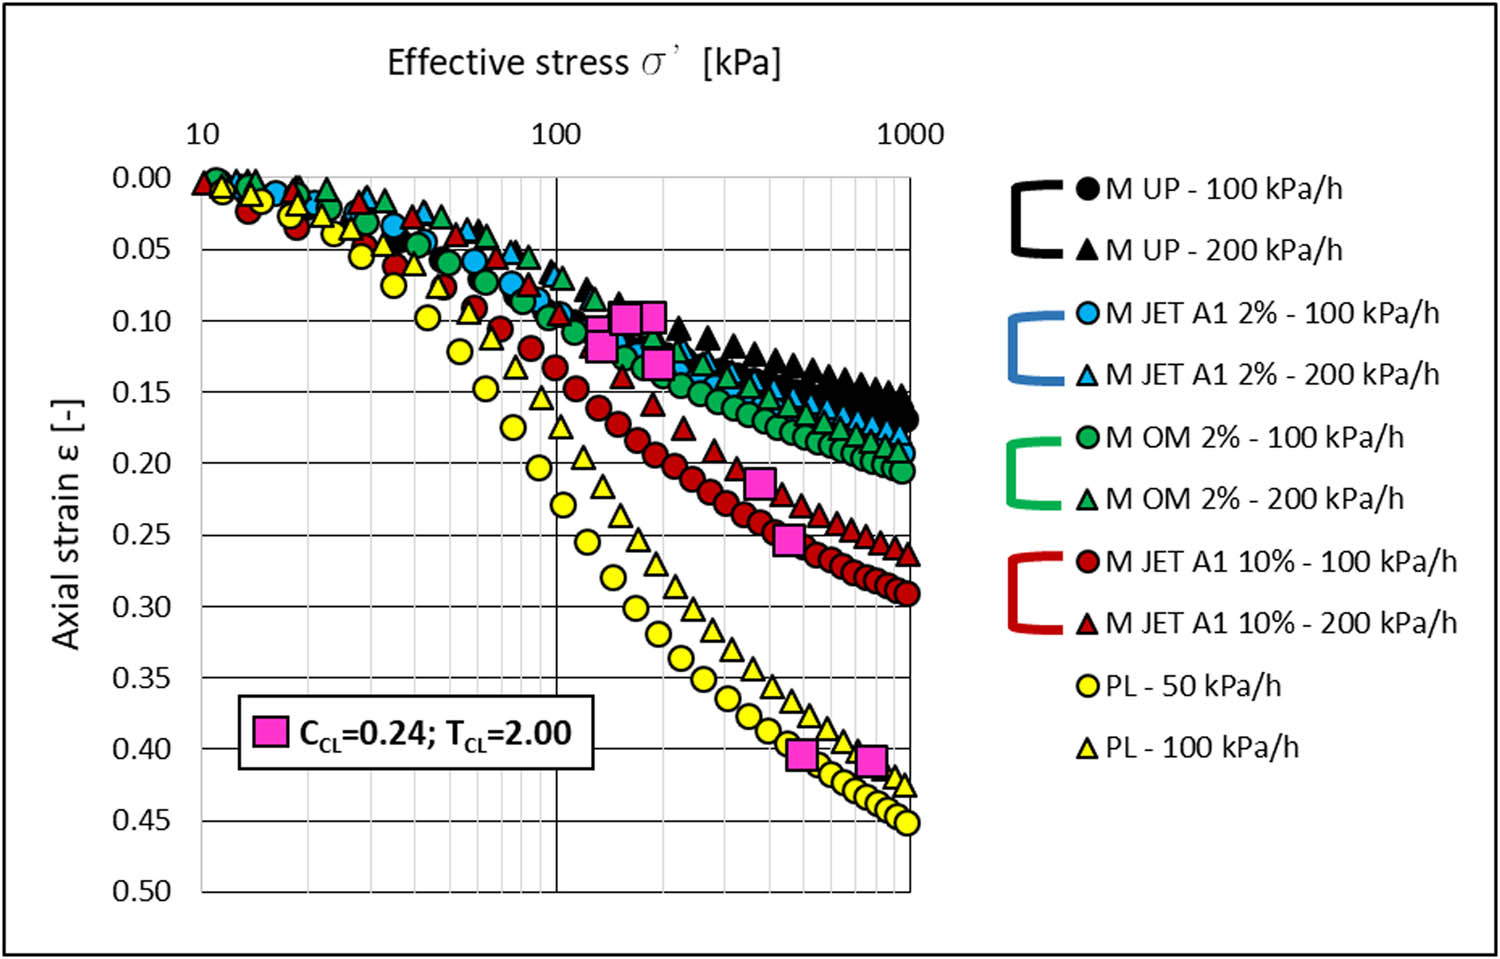
The axial strain (Figure 5) of the tested soil pastes was initially significant and showed similar dependencies; ε on σ in the range from 0 to 200 kPa in both non-contaminated and 2% contaminated mixtures. This quasi-uniform characteristic belonged to the transient phase in the analyzed CRL studies. At 10% contamination as in the uncontaminated clay paste, the phase boundary occurs at higher stresses. At the same time, with increasing stress, strain variation is marked. The highest values were recorded in uncontaminated clay with natural granulometric composition and the lowest in uncontaminated mixtures.

Strain curves obtained during CRL tests for unpolluted pastes (UP) and for soil mixture contaminated by fuel. M UP – unpolluted soil mixture; M Jet A1 2% –soil mixture polluted with Jet A1 aviation fuel, contaminant content 2%; M Jet A1 10% – soil mixture polluted with Jet A1 aviation fuel, contaminant content 10%; M OM 2% – soil mixture polluted with mineral oil 15W40, contaminant content 2%; PL – soil paste prepared from ice-dammed clay (Plecewice region, Poland).
A small 2% contamination with both light aviation fuel and mineral oil results in some increase in strain relative to the uncontaminated mixture. In contrast, 10% contamination yielded a significant increase in strain. This illustrates the effect of the type and proportion of contamination on the reduction of mutual resistance (friction) of the solid-phase components. Thus, the effects of contamination can be seen as a kind of “lubricant” action that promotes remodeling and thickening of the structure.
However, a factor that reduces the recorded deformation is the use of higher load growth rates generating higher pore pressure values. The nature of partial dissipation of pore pressure results in lower total strain in CL tests. Hence, at higher loading rates and higher pore pressure values, deformation is lower than in reference constant load tests (incremental loading [IL] tests).
The dependence of strain on the value and history of the load makes it possible of compacting the structure increasingly limited as the test progresses. Undoubtedly, this is influenced by the significant initial deformation of the tested pastes. This is expressed by significant changes in the slope of σ–ε diagrams. Linear relationship between the values of total stress and axial strain appears the later the higher the proportion of contamination and clay fraction content in the investigated soil material. This is another effect confirming the role of contaminants in reducing the friction between particles and grains of the soil skeleton.
The factors and conditions analyzed above are fully reflected in the changes in the parameters: compressibility modulus M 0 (Figure 6) and strain slope in log σ′–ε (Figure 7).

Modulus of compressibility obtained during CRL tests for unpolluted pastes (UP) and for soil mixture contaminated by fuel. M UP – unpolluted soil mixture; M Jet A1 2% – soil mixture polluted with Jet A1 aviation fuel, contaminant content 2%; M Jet A1 10% – soil mixture polluted with Jet A1 aviation fuel, contaminant content 10%; M OM 2% – soil mixture polluted with mineral oil 15W40, contaminant content 2%; PL – soil paste prepared from ice-dammed clay (Plecewice region, Poland).
Changes of strain slope in log σ′–ε dependence during CRL tests of soil paste. M UP – unpolluted soil mixture’ M Jet A1 2% – soil mixture polluted with Jet A1 aviation fuel, contaminant content 2%; M Jet A1 10% – soil mixture polluted with Jet A1 aviation fuel, contaminant content 10%; M OM 2% – soil mixture polluted with mineral oil 15W40, contaminant content 2%; PL – soil paste prepared from ice-dammed clay (Plecewice region, Poland).
The values of the compressibility modulus are initially small at high strains but when σ exceeds about 150 kPa, there is already significant stiffening of the material expressed by an intense linear increase in the compressibility modulus. The highest rate of quasi-linear increase of M 0 as a function of σ was recorded in uncontaminated mixtures and the lowest in pastes prepared exclusively from varve clay. The compressibility moduli of contaminated mixtures are between these extreme lines. However, the illustration of deformability changes expressed in terms of modulus values is less clear than the above-discussed characteristics of ε changes and also classical graphs prepared in the log σ–ε system.
The δε/δlog σ′ gradients after exceeding the actual “pre-consolidation” stress of the prepared paste (20 kPa) do not show a sharp break but change gently (“S” shaped), documenting the progressive strengthening of paste stiffness with continuously increasing load. Thus, such characteristics can be considered to be peculiar to the plastic and viscous behavior of materials lacking genetic structural bonds in relation to soils with intact structures.
4.3 Pore pressure
Changes in the pore water pressure during consolidometric tests of soil mixtures (Figure 8a and b) also reflect distinct behavior from model solutions (Figure 3a and c). They are both the course and value of the changes in u b showing a dependence on the composition of the soil material, contamination and the applied loading rate.

The distribution of pore pressure (a) and parameter of pore water pressure (b) during CRL tests of unpolluted pastes (UP) and soil mixture contaminated by hydrocarbons. M UP – unpolluted soil mixture; M Jet A1 2% – soil mixture polluted with Jet A1 aviation fuel, contaminant content 2%; M Jet A1 10% – soil mixture polluted with Jet A1 aviation fuel, contaminant content 10%; M OM 2% – soil mixture polluted with mineral oil 15W40, contaminant content 2%; PL – soil paste prepared from ice-dammed clay (Plecewice region, Poland).
With regard to the characteristics of the course of u b changes during the tests, all samples initially recorded a rapid increase in the pore pressure u b consistent with the model. After reaching the highest u bmax value, a rather significant decrease in u b values, inconsistent with the model solution, was observed. Subsequently, u b changes were already smaller, sometimes with local oscillations. Nevertheless, the tendency to decrease u b values, although fading, was observed until the end of the study, also at C CL values >0.24. The above characteristics are significant and separate from the model changes in pore pressure dissipation conditions in the study of soft-plastic soils with disturbed structures.
The initial increase in the pore pressure may be indicative not only of the transient phase of the test but also of the decreasing permeability of a soil medium intensively deforming under increasing load. However, high values of the pore pressure can cause structural transformations, among others, in the form of the formation of additional privileged drainage paths. Such effects were noted in the microstructural image from the SEM [44]. A macroscopic record of the effects associated with the formation of new drainage pathways can be a significant reduction in pore pressure values. Later, these effects are less marked but do not lead to the full stabilization of drainage conditions expected in theory, despite changes in compressibility resulting from increasing “packing” of the structure under increasing load.
The effects presented quantitatively depend on the characteristics of the soil material. In uncontaminated ice-dammed clay paste with natural mineral and granulometric composition, pore pressure values are the highest, and C CL > 0.24 is recorded at σ > 500 kPa (Figure 8a and b). In studies of contaminated soil mixtures, the pore pressure was lower and its changes more often showed irregularities. Values of C CL > 0.24 were observed after σ exceeded the values of 150–200 kPa. In contrast, the smallest values of pore pressure were recorded in uncontaminated soil mixtures while the character of the test course changes described above was preserved.
A factor that affects pore pressure characteristics is also the soil loading speed. The use of higher loading speeds generates higher pore pressure values. Differences obtained by using doubled loading speeds were most significant in the uncontaminated soil material. In contrast, a lower sensitivity of pore pressure changes conditioned by loading velocities was observed in mixtures contaminated with petroleum substances. Presumably, this may be due to the conditions of easier remodeling of the structural system when contaminants reduce the resistance to displacement of grains and soil particles. Moreover, an important role in the analysis of the impact of the loading velocity on the generated pore pressure values is also the type of petroleum product with which the fine-grained soil was contaminated. As can be seen in Figure 8a, contamination of soil mixtures with aviation fuel Jet A1 significantly decreases the influence of the load rate on the u b values, while contamination with mineral oil 15W40 does so to a lesser extent. This fact should be explained by the significant viscosity and therefore lower mobility of mineral oil in the soil pores compared to Jet A1 aviation fuel.
4.4 Coefficient of consolidation
The reliability of this parameter significantly depends on the phase of the test. In the initial, undetermined phase, when pore pressure is mobilized, the values of the consolidation coefficient are the highest but with the progress of the test they significantly decrease. This nature of the changes indicates the unreliability of the c v in this phase.
In the theoretical solution, according to the classical Terzaghi equation, the consolidation coefficient c v is a quasi-constant value. In tests carried out in a wide range of increasing loads, the values of c v are reduced, which results from both theoretical assumptions and numerous experimental results [22,31,32,44,45]. The extent of this reduction should not be significant and depends on changes in soil porosity. In CRL-type tests, changes in c v values are further moderated by the undispersed pressures of the liquid phase in the pores, which additionally sometimes affects the contraction of water flow in the pore space. These complex factors cause the consolidation coefficient c v in soft pastes to exhibit some behavioral modifications to model relationships.
According to formula (9), the calculated c v values initially decrease significantly (Figure 9a). In pastes without petroleum substances or with low (2%) contamination, their stabilization is observed at a load of about 200 kPa, which also corresponds to exceeding the limit of C CL = 0.24. In a mixture with 10% Jet A1 fuel contamination, both stabilization of c v and the limit of C CL = 0.24 occurred later. The graphs of the c v–T CL relationship (Figure 9b) confirm the reliability of the quasi-stabilized c v values in the area defined by T CL > 2 and thus in accordance with the second criterion of the model steady-state phase.

The values of coefficient of consolidation presented in relation to total stress (a) and relative consolidation time (b). Symbols explanations: M UP – unpolluted soil mixture; M Jet A1 2% – soil mixture polluted with Jet A1 aviation fuel, contaminant content 2%; M Jet A1 10% – soil mixture polluted with Jet A1 aviation fuel, contaminant content 10%; M OM 2% – soil mixture polluted with mineral oil 15W40, contaminant content 2%; PL – soil paste prepared from icedammed clay (Plecewice region, Poland).
The previously found dependence of compressibility on contamination and testing speed is also clear in the interrelationship of the consolidation coefficient values of soil mixtures. Uncontaminated mixtures are characterized by the highest values of the consolidation coefficient, so the fastest subsidence under load is expected in such soil material. The presence of contaminants results in a reduction in the consolidation coefficient in the range of up to one order of magnitude. At the same time, the discussed relationships do not exclude various anomalies. The random formation of privileged new filtration paths seems to result in an increase in the consolidation coefficient values in the course of testing.
At low contamination (2%), two factors – the type of petroleum substance and the loading speed – result in a similar range of changes in the consolidation parameter. This is evidenced by the alternating location of the graphs characterizing the behavior of the mixtures: M Jet-A1 and M OM at loading speeds of 100 and 200 kPa/h. Only a 5-fold increase in the fuel contamination of Jet-A1 resulted in a significant reduction in the c v value and a shift of the graphs toward the characteristics of ice-dammed clay with very good insulation. Comparison of the impact of the type of contamination on soil consolidation properties applies to 2% contamination of soil with JET A1 fuel and Mineral Oil 15W40. Evaluation of extrapolation of these trends at higher concentrations of contamination requires further research due to the significantly different physical characteristics of the oil.
5 Discussion and conclusions
The results of this research illustrate the issues involved in determining the effect of contamination on changes in compressibility and consolidation parameters and the methodological aspects of conducting the research.
The tested pastes were, by design, devoid of natural geological structural bonds. Hence, the obtained test results depend only on the granulometric characteristics, the type of contamination, and the conditions (rate) of applying the load. At the same time, the method of preparing paste samples provided very good saturation, which justifies referring to model solutions based on the assumptions of Terzaghi's theory. The practical aspect of the analyzed studies of remolded materials refers to the creation of artificial isolation barriers from shuffled and seasoned soils.
In the conducted studies, both confirmation and quantitative refinement of model deformability and compressibility characteristics were obtained, and discrepancies in consolidation behavior related to the specifics of the tested pastes were recorded.
The compression characteristics of plastic pastes initially show very significant and uniform one-dimensional deformations due to the unconsolidated material. This is confirmed by the nature of the log σ–ε relationship where no clear collapse of the graph is observed. The increase in the compressibility of soil mixtures after contamination with hydrocarbons is explained by changes in soil porosity caused by the flocculation of clay minerals, a decrease in soil permeability as a result of a reduction in effective porosity and an increase in the maximum pore pressure and hydraulic gradient values, which were recorded during each CRL test. The increase in the viscosity of the petroleum product during the CRL test leads to the generation of higher values of pore pressure and higher values of the hydraulic gradient. For this reason, soil mixtures after contamination with mineral oil show higher compressibility than soil samples contaminated with aviation fuel. The nature of compressibility discussed is a rationale for pre-consolidation and compaction treatments in the formation of isolation layers in the subsoil.
The characteristics of pore pressure changes deviate from model solutions. The σ–u b plots, after an initial intensive increase, collapse, and the subsequent course of the plots indicates that an unexpected improvement in drainage conditions probably occurred during the study. This may be due to the absence of cementation bonds in the paste. The increasing pore pressure may cause a local collapse of the structure and the formation of preferential drainage paths in the space of the compacted matrix. Pore pressure maxima in clays and in more heavily contaminated mixtures testify to the role of real (clay) or apparent cohesiveness (the role of contamination). However, after the maximum is reached, there is also the most significant decrease in pore pressure values in such a soil medium. The described effects indicate the distinctness of the behavior of mixtures in relation to soils with the natural structure. The discussed maxima and decreases in pore pressure were observed when C CL < 0.24. Thus, the remodeling of the structure of consolidated mixtures begins in the transient phase, and privileged drainage paths shape the dissipation of pore pressure also in the later course of CRL-type consolidation.
In the steady-state phase (C CL > 0.24), the consolidation coefficient c v values did not change as a function of T CL (relative consolidation time), while they showed some increase as a function of stress, which is not consistent with the model. On the other hand, in the non-steady-state phase, the significant variability of the results of the calculated c v indicates that they are not reliable.
All analyzed characteristics of changes in compressibility and consolidation parameters indicate that the presence of petroleum contaminants in the mixtures caused effects similar to increased cohesiveness. The contaminants appear to reduce frictional resistance between soil skeleton particles, resulting in an increase in compressibility and improved soil insulation.
Increased content of clay particles results in better insulating capacity while it unfavorably prolongs the course of consolidation and increases deformability. In turn, an increase in the share of the sandy fraction increases the values of the consolidation coefficient (decreases isolation) but also causes stiffening expressed by a decrease in one-dimensional deformation and an increase in M 0. The presented results illustrate qualitatively clear trends in changes in soil properties caused by even a small amount of contamination. Extending these characteristics requires a larger quantitative scope of research in relation to specific environmental situations.
The results of the ongoing research program also illustrate the effect of the loading rates adopted on the conditions of compressibility and consolidation characteristics. Applying the load too quickly generates excessive pore pressures and, consequently, causes significant structural changes and shifts the limits of the convincing results. In this situation, one should strive to conduct tests at a lower loading rate, especially in soils that are more clayey and/or contaminated with petroleum substances. This is of particular importance in specific design solutions, where determining the compressibility and consolidation parameters corresponding to the stresses resulting from the thickness of the higher overlying soil or waste layers is required.
Acknowledgements
The authors express great gratitude to the reviewers and editors for their perceptive and knowledgeable suggestions and comments, which led to improving our paper.
-
Funding information: This study was supported by funds from the University of Warsaw – Faculty of Geology: 501-D113-01-1130302 (Department of Engineering Geology, Geomechanics) and 501-D113-01-1130103 (Laboratory of Applied Geology) special program DSM for PhD students.
-
Author contributions: Piotr Stajszczak – 45%, Paweł Dobak – 40%, and Tomasz Szczepański – 15%.
-
Conflict of interest: Authors state no conflict of interest.
References
[1] Ahmed AA, Abdelrahman MT, Iskander GM. Compressibility of contaminated sand with petroleum oil. Proceedings of the 17th International Conference on Soil Mechanics and Geotechnical Engineering. The Academia and Practice of Geotechnical Engineering. Vol. 1. 2009. p. 44–7.Search in Google Scholar
[2] Kermani M, Ebadi T. The effect of oil contamination on the geotechnical properties of fine-grained soils. Soil Sediment Contam Int J. 2012;21:655–71.10.1080/15320383.2012.672486Search in Google Scholar
[3] Echeverri-Ramirez Ó, Valencia-Gonzalez, Toscano-Patino DE, Ordonez-Munoz FA, Arango-Salas C, Osorio-Torres S. Geotechnical behavior of a tropical residual soil contaminated with gasoline. DYNA. 2025;82(190):31–7.10.15446/dyna.v82n190.42161Search in Google Scholar
[4] Izdebska-Mucha D, Trzciński J. Clay soil behavior due to long-term contamination by liquid petroleum fuels: Microstructure and geotechnical properties. Bull Eng Geol Environ. 2021;80:3193–206 (in Polish).10.1007/s10064-020-02084-3Search in Google Scholar
[5] Thornley DM, Wilkinson WB, Parker A. A preliminary investigation of the release of oil from contaminated clays and other fine-grained sediments during consolidation. Q J Eng Geol Hydrogeol. 2006;39:375–90.10.1144/1470-9236/04-042Search in Google Scholar
[6] Singh SK, Srivastava RK, John S. Settlement characteristics of clayey soils contaminated with petroleum hydrocarbons. Soil Sediment Contam. 2008;17:290–300.10.1080/15320380802007028Search in Google Scholar
[7] Nazir AK. Effect of motor oil contamination on geotechnical properties of over consolidated clay. Alex Eng J. 2011;50:331–5.10.1016/j.aej.2011.05.002Search in Google Scholar
[8] Erten MB, El Mohtar CS, Reible DD, Gilbert RB. Consolidation properties of NAPL contaminated sediments. GeoCongress 2012: State of the Art and Practice in Geotechnical Engineering. Oakland, California, USA: 2012. p. 4107–15.10.1061/9780784412121.422Search in Google Scholar
[9] Kaya A, Fang H. The effects of organic fluids on physicochemical parameters of fine-grained soils. Can Geotech J. 2000;37:943–50.10.1139/t00-023Search in Google Scholar
[10] Kaya A, Fang H. Eksperimental evidence of reduction in attractive and repulsive forces between clay particles permeated with organic liquids. Can Geotech J. 2005;42:632–40.10.1139/t04-099Search in Google Scholar
[11] Stajszczak P. Changes in the filtration properties of the sand and clay mixture as a result of contamination with petroleum products in the aspect of mineral insulation barriers. Prz Geol. 2021;69(1):33–42 (in Polish).10.7306/2021.3Search in Google Scholar
[12] Dobak P, Izdebska-Mucha D, Stajszczak P, Wójcik E, Kiełbasiński K, Gawriuczenkow I, et al. Effects of hydrocarbon contamination on the engineering geological properties of Neogene clays and Pleistocene glacial tills from Central Poland. Act Geol Pol. 2022;72(4):529–55.10.24425/agp.2022.142647Search in Google Scholar
[13] Terzaghi K. Erdbaummechanik auf boden physikalischer Grundlage. Leipzig: Deuticke; 1925 (in German).Search in Google Scholar
[14] Minh VC. One dimensional consolidation of soils takin creep into account. Archiwum Hydrotechniki t. XXIV 1977;2:189–203.Search in Google Scholar
[15] Holtz RD, Kovacs WD. An introduction to geotechnical engineering. New Jersey: Prentice-Hall; 1981.Search in Google Scholar
[16] Dobak P. Rola czynnika filtracyjnego w badaniach jednoosiowej konsolidacji gruntów. (The role of the filtration factor in uniaxial consolidation tests of soils). Edition IGSMiE PAN Kraków; 1999 (in Polish).Search in Google Scholar
[17] Dobak P, Kowalczyk S. Consolidation parameters of Neogene green clays from Bełchatow – a study on CL test interpretation. geologija. Liet Mokslų Akademija. 2008;50(Supplement):S20–5. 10.2478/v10056-008-0021-6.Search in Google Scholar
[18] Aboshi H, Yoshikumi H, Maruyama S. Constant loading rate consolidation test. Soils Found. 1970;10(1):43–56.10.3208/sandf1960.10.43Search in Google Scholar
[19] Sinha UN, Bhargava SN. Variation in differential pore water pressure and particle size at different constant rate of loading in an automated consolidation testing system. Geotech Eng. 1991;22:247–56.Search in Google Scholar
[20] Kowalczyk S. Zmiany właściwości filtracyjnych w procesie konsolidacji zielonych iłów beidelitowych z Rowu Kleszczowa. (Changes of filtration properties in consolidatin proces of green beidelite clays from Kleszczów Rift Valley). Ph.D. thesis. Arch Faculty of Geology - University of Warsaw; 2007 (in Polish).Search in Google Scholar
[21] Soumaya B, Kempfert HG. Verformungsverhalten weicher Böden im spannungsgesteuerten Kompressionsversuch. Bautechnik, Berlin 2010;87(2):73–80 (in German).10.1002/bate.201010007Search in Google Scholar
[22] Stajszczak P. Consolidation and filtration properties of Mio-Pliocene clays from the Budy Mszczonowskie region obtained during consolidation tests with constant rate of loading. (Filtracyjno-konsolidacyjne właściwości iłów mio-plioceńskich z rejonu Bud Mszczonowskich w warunkach stale wzrastającego obciążenia). Prz Geol. 2018;66:558–68 (in Polish).10.7306/2018.6Search in Google Scholar
[23] Srivastava RK, Pandey VD. Geotechnical evaluation of oil contaminated soil. Proceedings of GREEN 2. The Second International Symposium on Geotechnics Related to the Enviroment, Poland, Kraków. London: Thomas Telford; 1997.Search in Google Scholar
[24] Choma-Moryl K. Ocena właściwości hydroizolacyjnych gruntów spoistych na podstawie ich plastyczności. (Assessment of waterproofing properties of cohesive soils on the basis of their plasticity). Materiały z X konferencji “Współczesne problemy hydrogeologii”. Vol. 2; 2001 Wrocław (in Polish).Search in Google Scholar
[25] Khamehchiyan M, Charkhabi AH, Tajik M. Effects of crude oil contamination on geotechnical properties of clayey and sandy soils. Eng Geol. 2007;89:220–9.10.1016/j.enggeo.2006.10.009Search in Google Scholar
[26] Barański M. Wytrzymałość i odkształcalność glin lodowcowych zanieczyszczonych ropopochodnym benzenem na terenie Petrochemii Płock S.A. (Strength and compressibility of glacial tills contaminated with benzene in the area of Petrochemia Płock S.A.). Ph.D. thesis. Arch Faculty of Geology - University of Warsaw; 2000 (in Polish).Search in Google Scholar
[27] Rahman ZA, Hamzah U, Taha MR, Ithnain NS, Ahmad N. Influence of oil contamination on geotechnical properties of basaltic residual soil. Am J Appl Sci. 2010;7(7):954–61.10.3844/ajassp.2010.954.961Search in Google Scholar
[28] Łuczak-Wilamowska B. Uwarunkowania geologiczne składowania odpadów komunalnych. (Geological conditions of municipal waste landfilling). Biul Państw Inst Geol. 2013;455:1–141 Warszawa (in Polish).10.5604/08676143.1114043Search in Google Scholar
[29] Karkush MO, Zaboon AT, Hussien HM. Studying the effects of contamination on the geotechnical properties of clayey soil. Coupled Phenomena in Environmental Geotechnics. Proceedings of the International Symposium, Torino, Italy; 2013. p. 599–608.10.1201/b15004-80Search in Google Scholar
[30] Drągowski A, Łuczak-Wilamowska B. Conditions of applicability of clays as ageological sealing barriers: Example of the clays from Budy Mszczonowskie (central Poland). (Uwarunkowania stosowalności iłów jako izolacyjnych barier geologicznych na przykładzie iłów ze złoża w Budach Mszczonowskich). Prz Geol. 2005;53:687–90 (in Polish).Search in Google Scholar
[31] Janbu N, Tokheim O, Senneset K. Consolidation tests with continuous loading. Proceedings of the 10th International Conference on Soil Mechanics and Foundation Engineering. Vol. 4, Issue 28, Stockholm: 1981; p. 645–54.Search in Google Scholar
[32] Dobak P, Szczepański T, Kowalczyk S. Load velocity influence on changes of soil consolidation and permeability parameters in CL-type tests. Geol Q. 2015;59(2):382–90.10.7306/gq.1178Search in Google Scholar
[33] Haisiga J, Wilanowski S. Szczegółowa Mapa Geologiczna Polski w skali 1:50 000 (Detailed Geological Map of Poland). Arkusz Kampinos (521). PIG-PIB. Warsaw; 2008 (in Polish).Search in Google Scholar
[34] Szalewicz H, Włodek M. Szczegółowa mapa geologiczna Polski 1:50 000 (Detailed Geological Map of Poland), Arkusz Mszczonów (557). Nar Arch Geol. PIG-PIB, Warszawa; 2009 (in Polish).Search in Google Scholar
[35] Rowe PW, Barden L. A new consolidation cell. Geotechnique. 1966;16(2):162–70.10.1680/geot.1966.16.2.162Search in Google Scholar
[36] Head KH. Manual of soil laboratory testing. London: Pentch Press; 1986.Search in Google Scholar
[37] PN-EN ISO 17892-1:2015-02. Geotechnical investigation and testing – Laboratory testing of soil – Part 1: Determination of water content.Search in Google Scholar
[38] PN-EN ISO 17892-2:2015-02. Geotechnical investigation and testing – Laboratory testing of soil – Part 2: Determination of bulk density; 2015.Search in Google Scholar
[39] PN-EN ISO 17892-4:2017. Geotechnical investigation and testing – Laboratory testing of soil – Part 4: Determination of particle size distribution; 2017.Search in Google Scholar
[40] PN-EN ISO 17892-12:2018-08. Geotechnical investigation and testing – Laboratory testing of soil – Part 12: Determination of liquid and plastic limits; 2018.Search in Google Scholar
[41] PN-88/B-04481:1988. Building soils – Tests of soil samples; 1988 (in Polish).Search in Google Scholar
[42] PN-EN ISO 14688-1:2018-05. Geotechnical investigation and testing – Identification and classification of soil – Part 1: Identification and description; 2018.Search in Google Scholar
[43] PN-EN ISO 14688-2:2018-05. Geotechnical investigation and testing – Identification and classification of soil – Part 2: Principles for a classification; 2018.Search in Google Scholar
[44] Stajszczak P, Dobak P. Pore pressure changes during consolidation tests with the constant rate of loading and their influence on CLconsolidation, as exemplified by selected cohesive soils from central Poland (Zmiany ciśnienia porowego w warunkach stałego wzrostu obciążenia i ich wpływ na konsolidację CL na przykładzie wybranych gruntów spoistych centralnej Polski). Prz Geol. 2021;69:873–83 (in Polish).10.7306/2021.49Search in Google Scholar
[45] Stajszczak P, Dobak P, Gendek K. Changes in the consolidation, seepage and microstructural properties of glacial tills estimated in continuous loading tests. (Zmiany właściwości konsolidacyjnych, filtracyjnych i mikrostrukturalnych glin lodowcowych w przebiegu badań konsolidacji z ciągłym wzrostem obciążenia). Prz Geol. 2020;68:843–52 (in Polish).10.7306/2020.36Search in Google Scholar
© 2023 the author(s), published by De Gruyter
This work is licensed under the Creative Commons Attribution 4.0 International License.
Articles in the same Issue
- Regular Articles
- Diagenesis and evolution of deep tight reservoirs: A case study of the fourth member of Shahejie Formation (cg: 50.4-42 Ma) in Bozhong Sag
- Petrography and mineralogy of the Oligocene flysch in Ionian Zone, Albania: Implications for the evolution of sediment provenance and paleoenvironment
- Biostratigraphy of the Late Campanian–Maastrichtian of the Duwi Basin, Red Sea, Egypt
- Structural deformation and its implication for hydrocarbon accumulation in the Wuxia fault belt, northwestern Junggar basin, China
- Carbonate texture identification using multi-layer perceptron neural network
- Metallogenic model of the Hongqiling Cu–Ni sulfide intrusions, Central Asian Orogenic Belt: Insight from long-period magnetotellurics
- Assessments of recent Global Geopotential Models based on GPS/levelling and gravity data along coastal zones of Egypt
- Accuracy assessment and improvement of SRTM, ASTER, FABDEM, and MERIT DEMs by polynomial and optimization algorithm: A case study (Khuzestan Province, Iran)
- Uncertainty assessment of 3D geological models based on spatial diffusion and merging model
- Evaluation of dynamic behavior of varved clays from the Warsaw ice-dammed lake, Poland
- Impact of AMSU-A and MHS radiances assimilation on Typhoon Megi (2016) forecasting
- Contribution to the building of a weather information service for solar panel cleaning operations at Diass plant (Senegal, Western Sahel)
- Measuring spatiotemporal accessibility to healthcare with multimodal transport modes in the dynamic traffic environment
- Mathematical model for conversion of groundwater flow from confined to unconfined aquifers with power law processes
- NSP variation on SWAT with high-resolution data: A case study
- Reconstruction of paleoglacial equilibrium-line altitudes during the Last Glacial Maximum in the Diancang Massif, Northwest Yunnan Province, China
- A prediction model for Xiangyang Neolithic sites based on a random forest algorithm
- Determining the long-term impact area of coastal thermal discharge based on a harmonic model of sea surface temperature
- Origin of block accumulations based on the near-surface geophysics
- Investigating the limestone quarries as geoheritage sites: Case of Mardin ancient quarry
- Population genetics and pedigree geography of Trionychia japonica in the four mountains of Henan Province and the Taihang Mountains
- Performance audit evaluation of marine development projects based on SPA and BP neural network model
- Study on the Early Cretaceous fluvial-desert sedimentary paleogeography in the Northwest of Ordos Basin
- Detecting window line using an improved stacked hourglass network based on new real-world building façade dataset
- Automated identification and mapping of geological folds in cross sections
- Silicate and carbonate mixed shelf formation and its controlling factors, a case study from the Cambrian Canglangpu formation in Sichuan basin, China
- Ground penetrating radar and magnetic gradient distribution approach for subsurface investigation of solution pipes in post-glacial settings
- Research on pore structures of fine-grained carbonate reservoirs and their influence on waterflood development
- Risk assessment of rain-induced debris flow in the lower reaches of Yajiang River based on GIS and CF coupling models
- Multifractal analysis of temporal and spatial characteristics of earthquakes in Eurasian seismic belt
- Surface deformation and damage of 2022 (M 6.8) Luding earthquake in China and its tectonic implications
- Differential analysis of landscape patterns of land cover products in tropical marine climate zones – A case study in Malaysia
- DEM-based analysis of tectonic geomorphologic characteristics and tectonic activity intensity of the Dabanghe River Basin in South China Karst
- Distribution, pollution levels, and health risk assessment of heavy metals in groundwater in the main pepper production area of China
- Study on soil quality effect of reconstructing by Pisha sandstone and sand soil
- Understanding the characteristics of loess strata and quaternary climate changes in Luochuan, Shaanxi Province, China, through core analysis
- Dynamic variation of groundwater level and its influencing factors in typical oasis irrigated areas in Northwest China
- Creating digital maps for geotechnical characteristics of soil based on GIS technology and remote sensing
- Changes in the course of constant loading consolidation in soil with modeled granulometric composition contaminated with petroleum substances
- Correlation between the deformation of mineral crystal structures and fault activity: A case study of the Yingxiu-Beichuan fault and the Milin fault
- Cognitive characteristics of the Qiang religious culture and its influencing factors in Southwest China
- Spatiotemporal variation characteristics analysis of infrastructure iron stock in China based on nighttime light data
- Interpretation of aeromagnetic and remote sensing data of Auchi and Idah sheets of the Benin-arm Anambra basin: Implication of mineral resources
- Building element recognition with MTL-AINet considering view perspectives
- Characteristics of the present crustal deformation in the Tibetan Plateau and its relationship with strong earthquakes
- Influence of fractures in tight sandstone oil reservoir on hydrocarbon accumulation: A case study of Yanchang Formation in southeastern Ordos Basin
- Nutrient assessment and land reclamation in the Loess hills and Gulch region in the context of gully control
- Handling imbalanced data in supervised machine learning for lithological mapping using remote sensing and airborne geophysical data
- Spatial variation of soil nutrients and evaluation of cultivated land quality based on field scale
- Lignin analysis of sediments from around 2,000 to 1,000 years ago (Jiulong River estuary, southeast China)
- Assessing OpenStreetMap roads fitness-for-use for disaster risk assessment in developing countries: The case of Burundi
- Transforming text into knowledge graph: Extracting and structuring information from spatial development plans
- A symmetrical exponential model of soil temperature in temperate steppe regions of China
- A landslide susceptibility assessment method based on auto-encoder improved deep belief network
- Numerical simulation analysis of ecological monitoring of small reservoir dam based on maximum entropy algorithm
- Morphometry of the cold-climate Bory Stobrawskie Dune Field (SW Poland): Evidence for multi-phase Lateglacial aeolian activity within the European Sand Belt
- Adopting a new approach for finding missing people using GIS techniques: A case study in Saudi Arabia’s desert area
- Geological earthquake simulations generated by kinematic heterogeneous energy-based method: Self-arrested ruptures and asperity criterion
- Semi-automated classification of layered rock slopes using digital elevation model and geological map
- Geochemical characteristics of arc fractionated I-type granitoids of eastern Tak Batholith, Thailand
- Lithology classification of igneous rocks using C-band and L-band dual-polarization SAR data
- Analysis of artificial intelligence approaches to predict the wall deflection induced by deep excavation
- Evaluation of the current in situ stress in the middle Permian Maokou Formation in the Longnüsi area of the central Sichuan Basin, China
- Utilizing microresistivity image logs to recognize conglomeratic channel architectural elements of Baikouquan Formation in slope of Mahu Sag
- Resistivity cutoff of low-resistivity and low-contrast pays in sandstone reservoirs from conventional well logs: A case of Paleogene Enping Formation in A-Oilfield, Pearl River Mouth Basin, South China Sea
- Examining the evacuation routes of the sister village program by using the ant colony optimization algorithm
- Spatial objects classification using machine learning and spatial walk algorithm
- Study on the stabilization mechanism of aeolian sandy soil formation by adding a natural soft rock
- Bump feature detection of the road surface based on the Bi-LSTM
- The origin and evolution of the ore-forming fluids at the Manondo-Choma gold prospect, Kirk range, southern Malawi
- A retrieval model of surface geochemistry composition based on remotely sensed data
- Exploring the spatial dynamics of cultural facilities based on multi-source data: A case study of Nanjing’s art institutions
- Study of pore-throat structure characteristics and fluid mobility of Chang 7 tight sandstone reservoir in Jiyuan area, Ordos Basin
- Study of fracturing fluid re-discharge based on percolation experiments and sampling tests – An example of Fuling shale gas Jiangdong block, China
- Impacts of marine cloud brightening scheme on climatic extremes in the Tibetan Plateau
- Ecological protection on the West Coast of Taiwan Strait under economic zone construction: A case study of land use in Yueqing
- The time-dependent deformation and damage constitutive model of rock based on dynamic disturbance tests
- Evaluation of spatial form of rural ecological landscape and vulnerability of water ecological environment based on analytic hierarchy process
- Fingerprint of magma mixture in the leucogranites: Spectroscopic and petrochemical approach, Kalebalta-Central Anatolia, Türkiye
- Principles of self-calibration and visual effects for digital camera distortion
- UAV-based doline mapping in Brazilian karst: A cave heritage protection reconnaissance
- Evaluation and low carbon ecological urban–rural planning and construction based on energy planning mechanism
- Modified non-local means: A novel denoising approach to process gravity field data
- A novel travel route planning method based on an ant colony optimization algorithm
- Effect of time-variant NDVI on landside susceptibility: A case study in Quang Ngai province, Vietnam
- Regional tectonic uplift indicated by geomorphological parameters in the Bahe River Basin, central China
- Computer information technology-based green excavation of tunnels in complex strata and technical decision of deformation control
- Spatial evolution of coastal environmental enterprises: An exploration of driving factors in Jiangsu Province
- A comparative assessment and geospatial simulation of three hydrological models in urban basins
- Aquaculture industry under the blue transformation in Jiangsu, China: Structure evolution and spatial agglomeration
- Quantitative and qualitative interpretation of community partitions by map overlaying and calculating the distribution of related geographical features
- Numerical investigation of gravity-grouted soil-nail pullout capacity in sand
- Analysis of heavy pollution weather in Shenyang City and numerical simulation of main pollutants
- Road cut slope stability analysis for static and dynamic (pseudo-static analysis) loading conditions
- Forest biomass assessment combining field inventorying and remote sensing data
- Late Jurassic Haobugao granites from the southern Great Xing’an Range, NE China: Implications for postcollision extension of the Mongol–Okhotsk Ocean
- Petrogenesis of the Sukadana Basalt based on petrology and whole rock geochemistry, Lampung, Indonesia: Geodynamic significances
- Numerical study on the group wall effect of nodular diaphragm wall foundation in high-rise buildings
- Water resources utilization and tourism environment assessment based on water footprint
- Geochemical evaluation of the carbonaceous shale associated with the Permian Mikambeni Formation of the Tuli Basin for potential gas generation, South Africa
- Detection and characterization of lineaments using gravity data in the south-west Cameroon zone: Hydrogeological implications
- Study on spatial pattern of tourism landscape resources in county cities of Yangtze River Economic Belt
- The effect of weathering on drillability of dolomites
- Noise masking of near-surface scattering (heterogeneities) on subsurface seismic reflectivity
- Query optimization-oriented lateral expansion method of distributed geological borehole database
- Petrogenesis of the Morobe Granodiorite and their shoshonitic mafic microgranular enclaves in Maramuni arc, Papua New Guinea
- Environmental health risk assessment of urban water sources based on fuzzy set theory
- Spatial distribution of urban basic education resources in Shanghai: Accessibility and supply-demand matching evaluation
- Spatiotemporal changes in land use and residential satisfaction in the Huai River-Gaoyou Lake Rim area
- Walkaway vertical seismic profiling first-arrival traveltime tomography with velocity structure constraints
- Study on the evaluation system and risk factor traceability of receiving water body
- Predicting copper-polymetallic deposits in Kalatag using the weight of evidence model and novel data sources
- Temporal dynamics of green urban areas in Romania. A comparison between spatial and statistical data
- Passenger flow forecast of tourist attraction based on MACBL in LBS big data environment
- Varying particle size selectivity of soil erosion along a cultivated catena
- Relationship between annual soil erosion and surface runoff in Wadi Hanifa sub-basins
- Influence of nappe structure on the Carboniferous volcanic reservoir in the middle of the Hongche Fault Zone, Junggar Basin, China
- Dynamic analysis of MSE wall subjected to surface vibration loading
- Pre-collisional architecture of the European distal margin: Inferences from the high-pressure continental units of central Corsica (France)
- The interrelation of natural diversity with tourism in Kosovo
- Assessment of geosites as a basis for geotourism development: A case study of the Toplica District, Serbia
- IG-YOLOv5-based underwater biological recognition and detection for marine protection
- Monitoring drought dynamics using remote sensing-based combined drought index in Ergene Basin, Türkiye
- Review Articles
- The actual state of the geodetic and cartographic resources and legislation in Poland
- Evaluation studies of the new mining projects
- Comparison and significance of grain size parameters of the Menyuan loess calculated using different methods
- Scientometric analysis of flood forecasting for Asia region and discussion on machine learning methods
- Rainfall-induced transportation embankment failure: A review
- Rapid Communication
- Branch fault discovered in Tangshan fault zone on the Kaiping-Guye boundary, North China
- Technical Note
- Introducing an intelligent multi-level retrieval method for mineral resource potential evaluation result data
- Erratum
- Erratum to “Forest cover assessment using remote-sensing techniques in Crete Island, Greece”
- Addendum
- The relationship between heat flow and seismicity in global tectonically active zones
- Commentary
- Improved entropy weight methods and their comparisons in evaluating the high-quality development of Qinghai, China
- Special Issue: Geoethics 2022 - Part II
- Loess and geotourism potential of the Braničevo District (NE Serbia): From overexploitation to paleoclimate interpretation