Study on the thermal properties and insulation resistance of epoxy resin modified by hexagonal boron nitride
-
 and
and

Abstract
To study the effect of doping hexagonal boron nitride (h-BN) on the thermal properties and insulation resistance of epoxy resin (EP) and the mechanism of this effect, h-BN/epoxy composites with h-BN content of 0, 10, 20, 30, and 40 phr were prepared. Meanwhile, the corresponding molecular dynamics model of h-BN/epoxy composites was established, and the thermal conductivity, volume resistivity, glass transition temperature, and microstructure parameters of h-BN/epoxy composites were obtained. When the h-BN content is 40 phr, the thermal conductivity of h-BN/epoxy composite is increased by 138% compared to pure EP, and the glass transition temperature is increased by 76 K. At the same time, doping h-BN will reduce the insulation performance of EP. However, the lowest volume resistivity of h-BN/epoxy composite is still 1.43 × 10¹⁵ Ω·cm, and the EP composite still has good insulation performance. The fraction free volume and mean square displacement of EP decrease with the doping of h-BN, which indicates that h-BN can hinder the movement of molecular segments of EP, which is the reason for the increase in glass transition temperature.
1 Introduction
The oil immersed on-board traction transformer is the heaviest single equipment in the traction system of high-speed electric multiple units (EMUs) (1). Using a dry-type on-board traction transformer instead of the current oil immersed on-board traction transformer can remove the oil tank, insulating oil, and other parts of the oil immersed transformer and achieve the goal of reducing the weight of the EMUs’ traction system. Epoxy resin (EP) has excellent insulation performance and chemical corrosion resistance. So it is widely used as an insulation material in the dry-type transformer (2,3). However, the thermal conductivity of EP is low. Its thermal conductivity is mostly in the range of 0.17–0.21 W/(m·K), which greatly limits heat dissipation from the dry-type transformer (4,5). The loss of dry-type on-board traction transformer is higher than that of dry-type transformer with the same capacity, and the heat dissipation condition of dry-type on-board traction transformer is worse due to the limitation of multiple unit train space, among which the heat dissipation problem of winding is particularly prominent. So higher requirements are put forward for the thermal conductivity of EP (6).
The thermal conductivity of EP can be effectively improved by doping inorganic nanofillers with high thermal conductivity (7,8). In the electrical industry, inorganic nanofillers with high thermal conductivity and good electrical insulation performance such as boron nitride (BN), aluminum nitride, and alumina should be selected to meet insulation requirements (9,10,11,12,13). Among them, hexagonal boron nitride (h-BN) has high intrinsic thermal conductivity, excellent insulation performance, excellent mechanical properties, and high temperature resistance. So h-BN is very much suitable for improving the thermal conductivity of EP in dry-type on-board traction transformers (14).
In recent years, there is an increase in research on EP-modified. Wang et al. (15,16) showed that adding cubic boron nitride and h-BN can improve the thermal conductivity of EP, but adding agglomerated h-BN particles can improve the thermal conductivity better. However, the breakdown strength of BN/EP composite will decrease compared to EP. Martin et al. (17) found that the surface treatment of BN with a high concentration of silane coupling agent can significantly improve the thermal conductivity of BN/EP composites. The thermal conductivity of BN/EP composites can be further improved by about 30% by ball milling of BN. Zhang et al. (18) found that compared to h-BN, adding two-dimensional boron nitride nanosheets (BNNS) can further improve the thermal conductivity of EP. When the content of BNNS is 25 vol%, the thermal conductivity of EP can be increased by 528%, but the dielectric constant and dielectric loss will further increase compared to h-BN. The above research fully shows that adding h-BN can improve the thermal conductivity of EP, and the addition of h-BN will lead to a decrease in the electrical insulation performance of EP. Articles in refs (19–21) explain that the formation of a heat conduction path of h-BN in the matrix is the reason for increasing the thermal conductivity of the composites and enhancing the dispersion of h-BN in the matrix, and that reducing the interfacial thermal resistance between h-BN and the matrix can improve the thermal conductivity of composites. These explanations are based on the results of macro experiments, and not directly found through microstructure parameters. So the micro mechanism is not clear, and the reasons for the change in the macro-performance of EP caused by h-BN are not understood well. Therefore, the micro mechanism behind the effect of h-BN on the thermal properties of EP needs to be studied further.
With the development of computer technology, the molecular dynamics (MD) simulation method is widely used to study the properties of materials (22). MD simulation can not only calculate the macro properties of materials, such as thermal conductivity, mechanical properties, glass transition temperature, and the coefficient of thermal expansion, but also calculate the microstructure parameters such as free volume and mean square displacement (MSD) of materials (23,24,25). Tang et al. (26) combined the experimental with molecular simulation method and found that the thermal stability of the insulation paper modified with polyphenylsilsesquioxane (PPSQ) was better than that of the insulation paper before modification. Furthermore, using the MD simulation method, it was found that PPSQ increased the free volume of the whole system, which led to the more intensive molecular chain bonding of the aramid fiber so that the thermal stability of the modified insulating paper was enhanced. MD simulation method can be very convenient to study the changes in material microstructure parameters, establish the relationship between micro and macro, so as to make a more reasonable explanation of the mechanism of interaction between filler and matrix, and then explain the reasons for the changes in macro properties. Therefore, a combination of the experimental method and the molecular simulation method can comprehensively study the properties of materials.
To study the effect of doping h-BN on the thermal properties and insulation resistance of EP and to analyze the mechanism of the effect, the h-BN/EP composites with h-BN content of 0, 10, 20, 30, and 40 phr (phr means one part of filler per 100 parts of EP by mass) were prepared, and the h-BN/EP composite model corresponding to h-BN content was established. The thermal conductivity and volume resistivity of h-BN/EP composites were measured by experiments. The glass transition temperature, free volume, and MSD of h-BN/EP composites were calculated by MD simulation.
2 Materials and methods
2.1 Materials
EP: bisphenol A epoxy resin E51 (epoxy value 0.51 mol/100 g), provided by Shanghai resin factory. Curing agent: 4,4′-diaminodiphenylsulfone (4,4′-DDS), provided by Shanghai resin factory. h-BN: micron hexagonal boron nitride, flake, average diameter of 10 μm, provided by Henan Shenhua Chemical Co., Ltd.
2.2 Sample preparation
First, EP E51 and curing agent (85 wt% of EP mass) were mixed manually and stirred evenly, and then a certain mass of h-BN (0–40 phr of epoxy mixed system) was added into the mixture. After adding h-BN, the mixture was ultrasonically dispersed at 30°C for 10 min. After ultrasonic dispersion, the mixture was put into an 85°C oil bath and stirred by a high-speed disperser (300 rad/min) for pre-curing for 50 min. Finally, the pre-cured EP mixture was poured into a preheated (85°C) mold, and the mixture was molded (pressure 5 MPa) and cured for 1 h in a flat curing press. Then the composite samples were obtained by curing the mixture for 2 h at 120°C and 160°C, respectively.
2.3 Characterization of samples
After the fracture surface was sprayed with gold, the morphology of the fracture surface was observed by a scanning electron microscope (SEM, quanta FEG 250; FEI Company, USA).
2.4 Thermal conductivity test
The thermal conductivity of the samples was tested by Hot-Disk TPS2200 thermal constant analyzer. The thermal conductivity of samples at room temperature was tested by the transient plane heat source method. The test standard was ISO22007-2.
2.5 Resistivity test
According to GB/T 1410-2006, an SM7120 high resistivity meter was used to test the volume resistivity of the sample. The electrode used in the test had a three electrode structure. The test voltage was 500 V and the ambient temperature was 20°C. The test sample was a circular sample with a diameter of 80 mm and a thickness of 1 mm. During the test, the sample was in close contact with the electrode.
The volume resistivity can be calculated according to Eq. 1:
where ρ v is the volume resistivity, D 1 is the diameter of main electrode, which is 70 mm, t is the thickness of the sample, which is 1 mm, and R v is the volume resistance.
The volume resistance test platform is shown in Figure 1. At this time, the current flowing through the surface of the measured object flows into the power supply inside the high resistance meter through the protective electrode, and the current flowing through the volume direction of the measured object can be correctly measured by the ammeter inside the high resistance meter, so as to calculate the corresponding volume resistance value. Then the volume resistivity can be calculated by Eq. 1. The test time of volume resistivity is 5 min, and the value of volume resistivity is recorded every 1 s. Finally, the median value is taken as the volume resistivity of the corresponding sample.

Principle of volume resistivity measurement.
3 MD simulation
3.1 Establishment of the model
The pure crosslinked EP model and the h-BN/EP model with different h-BN content were established, respectively. Bisphenol A diglycidyl ether (DGEBA) was selected as the EP matrix, and 4,4′-DDS was selected as the curing agent (Figure 2a). Materials Studio 2017 was selected as the molecular simulation software. The model building steps are as follows:
The DGEBA, 4,4′-DDS, and h-BN models were established, respectively. The initial EP model and the h-BN/EP initial model with h-BN content of 10, 20, 30, and 40 phr were established, respectively, by using the amorphous cell module. The parameters of the initial model are shown in Table 1.
Geometric optimization of the initial model (the maximum number of iterations is 5,000 steps) is carried out to reduce the energy of the model. The geometrically optimized model was first optimized at 200 ps under NPT (indicating that the system has a certain number of particles (N), pressure (P), temperature (T)) ensemble, and the temperature was set at 600 K. Then, 200 ps kinetic optimization was carried out at 300 K under NVT ensemble, which means that the system has a certain number of particles (N), volume (V), and temperature (T). The h-BN/EP model needs to fix the h-BN before the above optimization, and then the geometric optimization of the model and the dynamic optimization of the NVT ensemble at 600 K and 200 ps are carried out, respectively. This step is to prevent deformation in the process of h-BN optimization. Finally, the optimized model is shown in Figure 2b, which can be used for subsequent crosslinking reaction.
The crosslinking reaction process is as follows: The crosslinking reaction process of EP is complex, but the main reaction process has two steps (Figure 2c). The first step is the reaction of the epoxy group of the EP monomer molecule with the primary amine of the curing agent molecule, and the second step is the reaction of the secondary amine of the product after the reaction of the epoxy group of the EP monomer molecule with the primary amine of the curing agent molecule in the first step (27,28,29). The initial cutoff distance is 3.5 Å, the maximum cutoff distance is 8 Å, the step size is 0.5 Å, the maximum crosslinking degree is 85%, and the crosslinking temperature is set at 300 K. Finally, the crosslinking model with 80% crosslinking degree is obtained as shown in Figure 2d, which is used for subsequent performance calculation.
The step length involved in the simulation process is set to 1 fs, the pressure is set to 1 atm, the temperature control method is selected Nose, and the pressure control method is Berendsen. The force fields of EP model and h-BN/EP model are calculated by COMPASSII and Universal, respectively, and Ewald and Atom based are selected, respectively, for static force and van der Waals force.

(a) Molecular models of DGEBA and 4,4′-DDS. (b) Pure EP model and h-BN/EP model before crosslink. (c) Crosslink reaction process of EP. (d) Pure EP model and h-BN/EP model after crosslink reaction.
Structural parameters of the initial model
| Content of h-BN (phr) | Atomic number | Cell dimension (x × y × z) (Å) | Density (g/cm3) |
|---|---|---|---|
| 0 | 5080 | 46.8 × 46.8 × 46.8 | 0.6 |
| 10 | 4394 | 37.3 × 37.3 × 37.3 | 1.054 |
| 20 | 4295 | 38.1 × 38.1 × 38.1 | 0.991 |
| 30 | 4596 | 39.2 × 39.2 × 39.2 | 0.998 |
| 40 | 4981 | 40.2 × 40.2 × 40.2 | 1.025 |
To use the model after crosslink for the subsequent parameter calculation, structural optimization and dynamic optimization are needed to eliminate the internal stress of the system. First, the geometry of the model was optimized, and then five cycles of anneal with a total time of 140 ps were carried out in the temperature range of 300–650 K. After cyclic annealing, the model with the lowest potential energy was selected to optimize the dynamics of 200 ps NPT ensemble at 600 K, and then 200 ps NVT ensemble at 300 K. The final model was used for the subsequent molecular simulation.
3.2 Model verification based on thermal conductivity
In MD simulation, the reverse non-equilibrium MD (RNEMD) method is usually used to calculate the thermal conductivity of materials (27,30). According to the RNEMD method (31), the model is evenly divided into several layers (40 layers in total are divided in this study) along a certain direction (z direction is selected in this study). The outermost layer at both ends is called “hot layer,” and the two layers in the middle are called “cold layers” (Figure 3a). By exchanging the kinetic energy between the coldest particles in the hot layer and the hottest particles in the cold layer at each time interval ∆t, the energy ∆E exchange is realized, and the energy flux J is applied to the system:
where A is the area perpendicular to the flux direction and the coefficient 2 is caused by periodic boundary conditions.

(a) Model diagram of RNEMD method. (b) The temperature distribution of the model along the z direction when the temperature gradient is stable.
After many times of energy exchange, a stable temperature gradient is formed in the system, as shown in Figure 3b. Then the corresponding thermal conductivity can be calculated:
where J is the energy flux, dT/dz is the temperature gradient, and a negative sign indicates that the direction of the energy flux is opposite to the gradient.
In the MD calculation, to better divide the layers, the model is extended about three times along the direction of the partition layer (z direction). So it is necessary to establish a separate thermal conductivity calculation model. The specific parameters of the model are shown in Table 2. During the simulation, the force field is universal, the temperature is set to 300 K, the time step is 1 fs, and the time step of each kinetic energy exchange is 150.
Structural parameters of thermal conductivity calculation model
| Content of h-BN (phr) | Atomic number | Cell dimension (x × y × z) (Å) | Density (g/cm3) |
|---|---|---|---|
| 0 | 3598 | 23.2 × 23.2 × 71.5 | 1.188 |
| 10 | 5107 | 26.7 × 28.0 × 73.6 | 1.193 |
| 20 | 4899 | 26.2 × 28.1 × 76.8 | 1.138 |
| 30 | 5189 | 26.1 × 27.8 × 83.2 | 1.156 |
| 40 | 5316 | 24.7 × 29.1 × 83.8 | 1.211 |
3.3 Glass transition temperature
The glass transition temperature (T g) of polymer is the temperature that excites the movement of polymer molecular segments. Macroscopically, it is the critical temperature for the transition of polymer glass state and rubber state (32,33). The mechanical properties, dielectric properties, density, volume, and other parameters of the polymer will change significantly before and after the glass transition temperature. Therefore, it is important to study the effect of changing the content of h-BN on the glass transition temperature of EP.
As the density of polymer will change obviously before and after the glass transition temperature, the glass transition temperature of EP and its composites can be obtained by the curve of polymer density and temperature. In MD calculation, the relationship between material density and temperature is obtained by cooling the model. First, the model was heated to 600 K by 100 ps in an NVT ensemble and by 150 ps in an NPT ensemble at 600 K. Then, the model temperature was gradually reduced to 260 K by 20 K/250 ps cooling rate. At each temperature, the MD of 100 ps in NVT ensemble and 150 ps in NPT ensemble were calculated.
3.4 Free volume
According to the free volume theory, the volume of materials includes the volume occupied by molecules (V o) and the volume not occupied by molecules (V f). The free volume is dispersed in the materials in the form of “holes,” providing space for the movement of molecular chains (34). The fractional free volume (FFV) and the free volume size of amorphous polymer materials affect the properties of polymer materials, such as glass transition temperature. The FFV is calculated as follows:
3.5 MSD
The atoms in the system are always in constant motion. MSD refers to the average square displacement of particles in the system, which can be used to describe the motion ability of molecular segments (35). In the system containing N particles, MSD is defined as:
where R i (t) and R i (0) are the displacement vectors of any atom i in the system at time t and initial time, respectively.
4 Results and discussion
4.1 Sample morphology
The SEM images of pure EP and h-BN/EP composite with 40 phr of h-BN filler are shown in Figure 4. It can be seen from the figure that the cross section of pure EP is very smooth, and the cross section becomes very rough after adding h-BN. Further observation shows that, it can be seen that after adding h-BN, even when the filler content reaches the maximum of 40 phr, h-BN can still be well dispersed in the EP matrix without obvious agglomeration. h-BN fillers are stacked in the EP matrix to form a thermal conduction path, which helps to improve the thermal conductivity of the epoxy.

The SEM image of (a and b) EP and (c and d) h-BN/EP composite with 40 phr h-BN content.
4.2 Thermal conductivity
The thermal conductivity test results of five groups of samples with the same h-BN content are taken as the average value, and the thermal conductivity of h-BN/EP composite with different h-BN content is obtained, as shown in Figure 5. The thermal conductivity of pure EP is 0.2243 W/(m·K), and the thermal conductivity of composites with h-BN filler content of 10, 20, 30, and 40 phr is 0.3035, 0.3772, 0.4134, and 0.5337 W/(m·K), respectively. The thermal conductivity of the composite increases by 35%, 68%, 84%, and 138%, respectively. With the increase of h-BN content, the thermal conductivity of the composite increases gradually.

Thermal conductivity of EP composites with different h-BN content.
When the content of h-BN is 40 phr, the thermal conductivity of the composites is greatly improved. The main reason is that when the content of h-BN is less, h-BN does not fully form a thermal conduction path in the EP matrix. However, the thermal conductivity of the EP composites is slightly improved due to the high thermal conductivity of h-BN itself. When the content of h-BN reaches 40 phr, h-BN forms a thermal conduction path in the EP, which can further improve the thermal conductivity of the EP so that the thermal conductivity of the composite is greatly improved.
The thermal conductivity obtained by MD method is compared with the experimental results, as shown in Table 3. It can be seen from the results that under the same h-BN content, the simulation results are basically the same as the experimental results, and the error is small, which indicates that the MD simulation results are reliable.
Simulation and experimental value of thermal conductivity
| Content of h-BN (phr) | Simulation value (W/(m·K)) | Experimental value (W/(m·K)) |
|---|---|---|
| 0 | 0.2192 | 0.2243 |
| 10 | 0.2992 | 0.3035 |
| 20 | 0.3799 | 0.3772 |
| 30 | 0.4263 | 0.4134 |
| 40 | 0.5508 | 0.5337 |
4.3 Volume resistivity
The volume resistivity test results are shown in Table 4, and the volume resistivity of h-BN/EP composite changes with h-BN content is shown in Figure 6. It can be seen from Figure 6 that with the increase of h-BN content, the volume resistivity of h-BN/EP composite decreases gradually. When the content of h-BN in EP is large, the decreasing trend of the volume resistivity of h-BN/EP composites becomes slow. The volume resistivity of pure EP is 1.49 × 10¹⁷ Ω·cm. When the amount of h-BN reaches 30 phr, the volume resistivity of the composite decreases by an order of magnitude, and the volume resistivity of h-BN/EP composite is 5.86 × 10¹⁵ Ω·cm. When the h-BN content is 40 phr, the volume resistivity of the composite decreases to 1.43 × 10¹⁵ Ω·cm. Compared with pure EP, the volume resistivity of h-BN/EP composite is still very high, and h-BN/EP composite still has good electrical insulation properties.
Volume resistivity of h-BN/EP composites with different h-BN content
| Content of h-BN (phr) | Volume resistivity (Ω·cm) |
|---|---|
| 0 | 1.49 × 10¹⁷ |
| 10 | 4.39 × 10¹⁶ |
| 20 | 3.01 × 10¹⁶ |
| 30 | 5.86 × 10¹⁵ |
| 40 | 1.43 × 10¹⁵ |

Volume resistivity of EP composites with different h-BN content.
4.4 Glass transition temperature
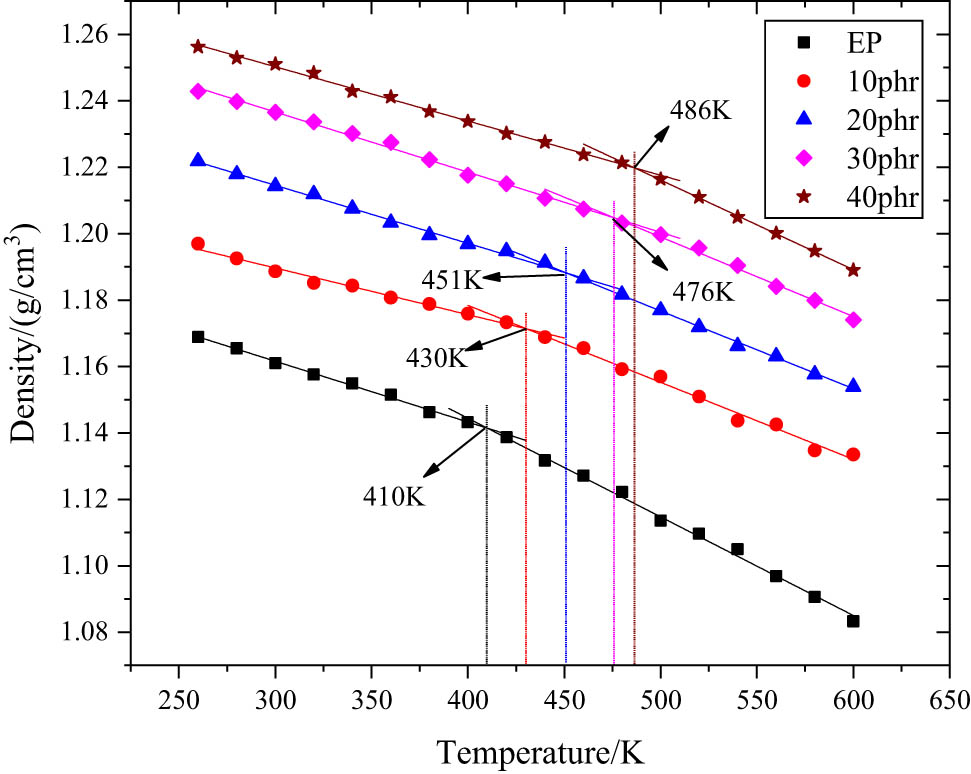
The density of the model corresponding to 18 temperature points is obtained. When the relationship between density and temperature is drawn in a two-dimensional coordinate axis, an obvious decomposition inflection point can be found in the data points. By fitting the data points before and after the inflection point linearly, two different density and temperature curves before and after the glass transition temperature can be obtained. T g is the temperature corresponding to the intersection of the two curves, as shown in Figure 7.
T g fitting results of EP composites with different h-BN content.
The T g of pure EP is 410 K, while the T g of h-BN/EP composites with h-BN content of 10, 20, 30, and 40 phr is 430, 451, 476, and 486 K, respectively. With the increase of h-BN content, the glass transition temperature of EP composites increases gradually. When the content of h-BN is 40 phr, the glass transition temperature of EP composites is 76 K higher than that of pure EP. The main reason is that the addition of h-BN will hinder the movement of molecular segments of EP, and the more obvious blocking effect is with the increase of h-BN content so that higher is the temperature needed to stimulate the movement of molecular segments, resulting in the increase of T g of EP.
4.5 Free volume
The free volume is calculated by the scanning probe method. The probe radius is set to 1 Å by creating Connolly surface and the free volume of h-BN/EP composite model with different h-BN content is obtained. As shown in Figure 8, the free volume distribution of the system is shown in different h-BN content. The blue part in the figure represents the free volume, while the gray part is the free volume surface. It can be seen from the figure that when the content of h-BN is low, the free volume distribution is scattered. With the increase of h-BN content, the free volume distribution area gradually began to gather, and the dispersion became worse. This indicates that h-BN can hinder the molecular chain movement of EP.

Free volume distribution of different model.
The corresponding FFV (Table 5) can be obtained by Eq. 4. It can be seen from the table that the FFV of pure EP is 21%. With the increase of h-BN content, the FFV of h-BN/EP composite decreases gradually. This is mainly because with the addition of h-BN, h-BN occupies part of the free volume of the original EP, resulting in the decrease of FFV of the composite. On the other hand, the decrease of FFV indicates that the movement of molecular segments in h-BN/EP composites is weakened, that is, the addition of h-BN will hinder the motion of molecular segments in EP, and the greater the content of h-BN, the stronger the hindrance.
h-BN/EP composite FFV with different h-BN content
| Content of h-BN (phr) | V o (Å3) | V f (Å3) | FFV (%) |
|---|---|---|---|
| 0 | 42321.58 | 11251.06 | 21.00 |
| 10 | 37796.84 | 8122.13 | 17.69 |
| 20 | 37334.62 | 7589.98 | 16.89 |
| 30 | 40599.37 | 7603.28 | 15.77 |
| 40 | 43682.61 | 7794.24 | 15.14 |
4.6 MSD
The optimized h-BN/EP composite model with different h-BN content was simulated again under the NPT ensemble of 50 ps, and the structure was output every 1 ps. The MSD curves of h-BN/EP composite model with different h-BN content were obtained by MSD analysis of the final 50-frame structure, as shown in Figure 9. It can be seen from the figure that with the increase of h-BN content, the MSD value of h-BN/EP composite decreases, indicating that the addition of h-BN will inhibit the movement of EP molecular segments, and the higher the content of h-BN, the stronger the inhibition.

EP composite MSD with different h-BN content.
5 Conclusion
In this study, the effects of h-BN on the properties of EP were studied by experiments and MD simulation, and the conclusions are as follows:
The addition of h-BN can improve the thermal conductivity of EP. The higher the content of h-BN, the greater the improvement in thermal conductivity. When the content of h-BN is 40 phr, the thermal conductivity of h-BN/EP composite reaches 0.5337 W/(m·K).
The addition of h-BN can increase the glass transition temperature of EP. When the h-BN content is 40 phr, the glass transition temperature is 486 K, which is 76 K higher than that of pure EP.
Adding h-BN can not only improve the thermal properties of EP but also reduce its insulation resistance. When the content of h-BN is 40 phr, the volume resistivity of h-BN/EP composite is about 2 orders of magnitude lower than that of pure EP, but it is still as high as 1.43 × 10¹⁵ Ω·cm. Therefore, the EP composite still has good insulation performance.
With the increase of h-BN content, the FFV of EP will decrease, and the MSD value will also decrease. The higher the content of h-BN, the stronger the blocking effect. This is also the reason for the increase of glass transition temperature of h-BN/EP composites.
-
Funding information: This project was supported by National Natural Science Foundation of China (U1834203), Sichuan Science and Technology Program (Youth Science and Technology Innovation Research Team Project) (2020JDTD0009).
-
Author contributions: Shilin Ding and Shuai Yuan: designed and performed the experiments; Shilin Ding and Shuai Yuan: data curation, formal analysis; Shilin Ding and Xiaofeng Gou: writing – original draft; Dongyang Wang and Fenglin Cai: writing – review and editing; Lei Guo and Haiquan Zhao: funding acquisition. All authors have read and agreed to the published version of the manuscript.
-
Conflict of interest: Authors state no conflict of interest.
-
Data availability statement: The data presented in this study are available on request from the corresponding author.
References
(1) Ronanki D, Singh SA, Williamson SS. Comprehensive topological overview of rolling stock architectures and recent trends in electric railway traction systems. IEEE Trans Transp Electr. 2017;3:1–1.10.1109/TTE.2017.2703583Search in Google Scholar
(2) Wang L, Gao W, Zhang X, Xu S, Ren S, Guo J. Preparation and performance of high thermal conductive epoxy resin composite insulating materials. Insulat Mater. 2021;54(2):20–6.Search in Google Scholar
(3) Wang Y, Liu Y, Wang S, Xu H. The effect of electrothermal aging on the properties of epoxy resin in dry-type transformer. Trans China Electrotech Soc. 2018;33(16):3906–16.Search in Google Scholar
(4) Lin Y, Huang X, Chen J, Jiang P. Epoxy thermoset resins with high pristine thermal conductivity. High Volt. 2017;2(3):139–46.10.1049/hve.2017.0120Search in Google Scholar
(5) Wang Y, Wang S, Huang Y, Yi L, Cai Y. Study on thermal aging characteristics of epoxy resin of dry-type transformer. High Volt Eng. 2018;44(1):187–94.Search in Google Scholar
(6) Guo L, Ding S, Yuan S, Gou X, Wang L, Zhou L. Molecular dynamics simulation of thermo-mechanical properties of hexagonal boron nitride/epoxy resin composites. High Volt Eng. July 2021. Epub ahead of print 2. 10.13336/j.1003-6520.hve.20201456.Search in Google Scholar
(7) Jiang P, Chen J, Huang X. Research status of thermally conductive but electrically insulating polymer nanocomposites. High Volt Eng. 2017;43(9):2791–9.Search in Google Scholar
(8) Du B, Kong X, Xiao M, Li J, Qian Z. Advances in thermal performance of polymer-based composites. Trans China Electrotechnical Soc. 2018;33(14):3149–59.Search in Google Scholar
(9) Huang X, Jiang P, Tanaka T. A review of dielectric polymer composites with high thermal conductivity. IEEE Electr Insul M. 2011;27:8–16.10.1109/MEI.2011.5954064Search in Google Scholar
(10) Meng X, Du B. Review of high thermal conductivity polymer dielectrics for electrical insulation. High Volt. 2016;1(1):34–42.10.1049/hve.2016.0008Search in Google Scholar
(11) Ma A, Chen W, Hou Y, Zhang G. The preparation and cure kinetics researches of thermal conductivity epoxy/AlN composites. Polym-Plast Technol. 2010;49(4):354–8.10.1080/03602550903532091Search in Google Scholar
(12) Sun J, Wang D, Yao Y, Zeng X, Pan G, Huang Y, et al. Boron nitride microsphere/epoxy composites with enhanced thermal conductivity. High Volt. 2017;2(3):147–53.10.1049/hve.2017.0040Search in Google Scholar
(13) Wang Q, Li Z, Yin Y, Wu J. Thermal conductivity and breakdown strength study of micro/nano-alumina/epoxy resin composite. Insulat Mater. 2013;46(2):49–52.Search in Google Scholar
(14) Lin Z, Yan Q, Dai W, Lv L, Tan X. Research progress on hexagonal boron nitride-based thermal conductive composites. J Integr Technol. 2019;8(01):24–37.Search in Google Scholar
(15) Wang Z, Iizuka T, Kozako M, Tanaka T. Development of epoxy/BN composites with high thermal conductivity and sufficient dielectric breakdown strength part I- sample preparations and thermal conductivity. IEEE Trans Dielect El In. 2011;18(6):1963–72.10.1109/TDEI.2011.6118634Search in Google Scholar
(16) Wang Z, Iizuka T, Kozako M, Tanaka T. Development of epoxy/BN composites with high thermal conductivity and sufficient dielectric breakdown strength part II-breakdown strength. IEEE Trans Dielect El In. 2011;18(6):1973–83.10.1109/TDEI.2011.6118635Search in Google Scholar
(17) Martin D, Spiros T, Emmanuel L. Boron nitride filled epoxy with improved thermal conductivity and dielectric breakdown strength. Compos Sci Technol. 2015;110:152–8.10.1016/j.compscitech.2015.02.006Search in Google Scholar
(18) Zhang X, Hu G, Wu Y, Tang J. Study on the thermal and dielectric properties of epoxy resin modified by boron nitride nanosheets. High Volt Eng. 2021;47(2):645–51.Search in Google Scholar
(19) Liu L, Shen S, Wang Y. Enhanced thermal conductivity of flexible h-BN/polyimide composites films with ethyl cellulose. e-Polymers. 2019;9(1):305–12.10.1515/epoly-2019-0031Search in Google Scholar
(20) Wu X, Liu W, Ren L, Zhang C. Highly thermally conductive boron nitride @UHMWPE composites with segregated structure. e-Polymers. 2020;20(1):510–8.10.1515/epoly-2020-0053Search in Google Scholar
(21) Randhawa K, Patel A. Enhancing tribo-mechanical properties and thermal stability of nylon 6 by hexagonal boron nitride fillers. e-Polymers. 2020;20(1):733–45.10.1515/epoly-2020-0069Search in Google Scholar
(22) Li Q, Huang X, Liu T, Ni J, Wang Z, Zhang Y, et al. Application progresses of molecular simulation methodology in the area of high volt insulation. Trans China Electrotechn Soc. 2016;31(12):1–13.Search in Google Scholar
(23) Zhang X, Chen X, Xiao S, Wen H, Wu J. Molecular dynamics simulation of thermal-mechanical properties of modified SiO2 reinforced epoxy resin. High Volt Eng. 2018;44(3):740–9.Search in Google Scholar
(24) Xie Q, Duan Q, Zhang L, Zhao Y, Lu L, Huang Z. Molecular dynamics simulation of the influence of nano-SiO2 filling on thermo-mechanical properties of highly cross-linked epoxy resin. High Volt Eng. 2020;46(05):1596–605.Search in Google Scholar
(25) Wen H, Zhang X, Wu Y, Yang Z. Molecular dynamics simulation of SrTiO3/epoxy resin composites with different filling proportions. Insulat Mater. 2019;52(8):16–23.Search in Google Scholar
(26) Tang C, Zheng W, Wang L, Xie J. Thermal stability of polyphenylsilsesquioxane-modified meta-aramid insulation paper. High Volt. 2020;5(3):264–9.10.1049/hve.2019.0266Search in Google Scholar
(27) Liu X, Rao Z. A molecular dynamics study on heat conduction of crosslinked epoxy resin based thermal interface materials for thermal management. Comp Mater Sci. 2020;172:109298.10.1016/j.commatsci.2019.109298Search in Google Scholar
(28) Shenogina NB, Tsige M, Patnaik SS, Mukhopadhyay SM. Molecular modeling approach to prediction of thermo-mechanical behavior of thermoset polymer networks. Macromolecules. 2012;45(12):5307–15.10.1021/ma3007587Search in Google Scholar
(29) Wang Z, Lv Q, Chen S, Li C, Sun S, Hu S. Glass transition investigations on highly crosslinked epoxy resins by molecular dynamics simulations. Mol Simulat. 2015;41(18):1515–27.10.1080/08927022.2014.998213Search in Google Scholar
(30) Liu X, Rao Z. Molecular dynamics simulations on the heat and mass transfer of hypercrosslinked shell structure of phase change nanocapsules as thermal energy storage materials. Int J Heat Mass Tran. 2019;132:362–74.10.1016/j.ijheatmasstransfer.2018.12.009Search in Google Scholar
(31) Müller-Plathe F. A simple nonequilibrium molecular dynamics method for calculating the thermal conductivity. J Chem Phys. 1997;106(14):6082–5.10.1063/1.473271Search in Google Scholar
(32) Fu K, Xie Q, Zhang L, Lv F, Zhao Y, Huang Z. Molecular dynamics simulation of thermomechanical properties of DGEBA/DCPDE double-crosslinked epoxy resin. High Volt Eng. 2019;45(9):2722–31.Search in Google Scholar
(33) Xie Q, Fu K, Liang S, Liu B, Lu L. Micro-structure and thermomechanical properties of crosslinked epoxy composite modified by nano-SiO₂: a molecular dynamics simulation. Polymers. 2018;10(7):801–17.10.3390/polym10070801Search in Google Scholar PubMed PubMed Central
(34) Bondi A. Free volumes and free rotation in simple liquids and liquid saturated hydrocarbons. J Phys Chem. 1954;58(11):929–39.10.1021/j150521a001Search in Google Scholar
(35) Yin F, Tang C, Li X, Wang X. Effect of moisture on mechanical properties and thermal stability of meta-aramid fiber used in insulating paper. Polymers. 2017;9(10):537–51.10.3390/polym9100537Search in Google Scholar PubMed PubMed Central
© 2021 Lei Guo et al., published by De Gruyter
This work is licensed under the Creative Commons Attribution 4.0 International License.
Articles in the same Issue
- Research Articles
- Research on the mechanism of gel accelerator on gel transition of PAN solution by rheology and dynamic light scattering
- Gel point determination of gellan biopolymer gel from DC electrical conductivity
- Composite of polylactic acid and microcellulose from kombucha membranes
- Synthesis of highly branched water-soluble polyester and its surface sizing agent strengthening mechanism
- Fabrication and characterization of poly(3-hydroxybutyrate-co-3-hydroxyhexanoate) modified with nano-montmorillonite biocomposite
- Fabrication of N-halamine polyurethane films with excellent antibacterial properties
- Formulation and optimization of gastroretentive bilayer tablets of calcium carbonate using D-optimal mixture design
- Sustainable nanocomposite films based on SiO2 and biodegradable poly(3-hydroxybutyrate-co-3-hydroxyhexanoate) (PHBH) for food packaging
- Evaluation of physicochemical properties of film-based alginate for food packing applications
- Electrically conductive and light-weight branched polylactic acid-based carbon nanotube foams
- Structuring of hydroxy-terminated polydimethylsiloxane filled by fumed silica
- Surface functionalization of nanostructured Cu/Ag-deposited polypropylene fiber by magnetron sputtering
- Influence of composite structure design on the ablation performance of ethylene propylene diene monomer composites
- MOFs/PVA hybrid membranes with enhanced mechanical and ion-conductive properties
- Improvement of the electromechanical properties of thermoplastic polyurethane composite by ionic liquid modified multiwall carbon nanotubes
- Natural rubber latex/MXene foam with robust and multifunctional properties
- Rheological properties of two high polymers suspended in an abrasive slurry jet
- Two-step polyaniline loading in polyelectrolyte complex membranes for improved pseudo-capacitor electrodes
- Preparation and application of carbon and hollow TiO2 microspheres by microwave heating at a low temperature
- Properties of a bovine collagen type I membrane for guided bone regeneration applications
- Fabrication and characterization of thermoresponsive composite carriers: PNIPAAm-grafted glass spheres
- Effect of talc and diatomite on compatible, morphological, and mechanical behavior of PLA/PBAT blends
- Multifunctional graphene nanofiller in flame retarded polybutadiene/chloroprene/carbon black composites
- Strain-dependent wicking behavior of cotton/lycra elastic woven fabric for sportswear
- Enhanced dielectric properties and breakdown strength of polymer/carbon nanotube composites by coating an SrTiO3 layer
- Analysis of effect of modification of silica and carbon black co-filled rubber composite on mechanical properties
- Polytriazole resins toughened by an azide-terminated polyhedral oligomeric silsesquioxane (OADTP)
- Phosphine oxide for reducing flammability of ethylene-vinyl-acetate copolymer
- Study on preparation and properties of bentonite-modified epoxy sheet molding compound
- Polyhedral oligomeric silsesquioxane (POSS)-modified phenolic resin: Synthesis and anti-oxidation properties
- Study on structure and properties of natural indigo spun-dyed viscose fiber
- Biodegradable thermoplastic copolyester elastomers: Methyl branched PBAmT
- Investigations of polyethylene of raised temperature resistance service performance using autoclave test under sour medium conditions
- Investigation of corrosion and thermal behavior of PU–PDMS-coated AISI 316L
- Modification of sodium bicarbonate and its effect on foaming behavior of polypropylene
- Effect of coupling agents on the olive pomace-filled polypropylene composite
- High strength and conductive hydrogel with fully interpenetrated structure from alginate and acrylamide
- Removal of methylene blue in water by electrospun PAN/β-CD nanofibre membrane
- Theoretical and experimental studies on the fabrication of cylindrical-electrode-assisted solution blowing spinning nanofibers
- Influence of l-quebrachitol on the properties of centrifuged natural rubber
- Ultrasonic-modified montmorillonite uniting ethylene glycol diglycidyl ether to reinforce protein-based composite films
- Experimental study on the dissolution of supercritical CO2 in PS under different agitators
- Experimental research on the performance of the thermal-reflective coatings with liquid silicone rubber for pavement applications
- Study on controlling nicotine release from snus by the SIPN membranes
- Catalase biosensor based on the PAni/cMWCNT support for peroxide sensing
- Synthesis and characterization of different soybean oil-based polyols with fatty alcohol and aromatic alcohol
- Molecularly imprinted electrospun fiber membrane for colorimetric detection of hexanoic acid
- Poly(propylene carbonate) networks with excellent properties: Terpolymerization of carbon dioxide, propylene oxide, and 4,4ʹ-(hexafluoroisopropylidene) diphthalic anhydride
- Polypropylene/graphene nanoplatelets nanocomposites with high conductivity via solid-state shear mixing
- Mechanical properties of fiber-reinforced asphalt concrete: Finite element simulation and experimental study
- Applying design of experiments (DoE) on the properties of buccal film for nicotine delivery
- Preparation and characterizations of antibacterial–antioxidant film from soy protein isolate incorporated with mangosteen peel extract
- Preparation and adsorption properties of Ni(ii) ion-imprinted polymers based on synthesized novel functional monomer
- Rare-earth doped radioluminescent hydrogel as a potential phantom material for 3D gel dosimeter
- Effects of cryogenic treatment and interface modifications of basalt fibre on the mechanical properties of hybrid fibre-reinforced composites
- Stable super-hydrophobic and comfort PDMS-coated polyester fabric
- Impact of a nanomixture of carbon black and clay on the mechanical properties of a series of irradiated natural rubber/butyl rubber blend
- Preparation and characterization of a novel composite membrane of natural silk fiber/nano-hydroxyapatite/chitosan for guided bone tissue regeneration
- Study on the thermal properties and insulation resistance of epoxy resin modified by hexagonal boron nitride
- A new method for plugging the dominant seepage channel after polymer flooding and its mechanism: Fracturing–seepage–plugging
- Analysis of the rheological property and crystallization behavior of polylactic acid (Ingeo™ Biopolymer 4032D) at different process temperatures
- Hybrid green organic/inorganic filler polypropylene composites: Morphological study and mechanical performance investigations
- In situ polymerization of PEDOT:PSS films based on EMI-TFSI and the analysis of electrochromic performance
- Effect of laser irradiation on morphology and dielectric properties of quartz fiber reinforced epoxy resin composite
- The optimization of Carreau model and rheological behavior of alumina/linear low-density polyethylene composites with different alumina content and diameter
- Properties of polyurethane foam with fourth-generation blowing agent
- Hydrophobicity and corrosion resistance of waterborne fluorinated acrylate/silica nanocomposite coatings
- Investigation on in situ silica dispersed in natural rubber latex matrix combined with spray sputtering technology
- The degradable time evaluation of degradable polymer film in agriculture based on polyethylene film experiments
- Improving mechanical and water vapor barrier properties of the parylene C film by UV-curable polyurethane acrylate coating
- Thermal conductivity of silicone elastomer with a porous alumina continuum
- Copolymerization of CO2, propylene oxide, and itaconic anhydride with double metal cyanide complex catalyst to form crosslinked polypropylene carbonate
- Combining good dispersion with tailored charge trapping in nanodielectrics by hybrid functionalization of silica
- Thermosensitive hydrogel for in situ-controlled methotrexate delivery
- Analysis of the aging mechanism and life evaluation of elastomers in simulated proton exchange membrane fuel cell environments
- The crystallization and mechanical properties of poly(4-methyl-1-pentene) hard elastic film with different melt draw ratios
- Review Articles
- Aromatic polyamide nonporous membranes for gas separation application
- Optical elements from 3D printed polymers
- Evidence for bicomponent fibers: A review
- Mapping the scientific research on the ionizing radiation impacts on polymers (1975–2019)
- Recent advances in compatibility and toughness of poly(lactic acid)/poly(butylene succinate) blends
- Topical Issue: (Micro)plastics pollution - Knowns and unknows (Guest Editor: João Pinto da Costa)
- Simple pyrolysis of polystyrene into valuable chemicals
- Topical Issue: Recent advances of chitosan- and cellulose-based materials: From production to application (Guest Editor: Marc Delgado-Aguilar)
- In situ photo-crosslinking hydrogel with rapid healing, antibacterial, and hemostatic activities
- A novel CT contrast agent for intestinal-targeted imaging through rectal administration
- Properties and applications of cellulose regenerated from cellulose/imidazolium-based ionic liquid/co-solvent solutions: A short review
- Towards the use of acrylic acid graft-copolymerized plant biofiber in sustainable fortified composites: Manufacturing and characterization