
Research on user behavior of traditional Chinese medicine therapeutic smart clothing
-
Hongying Jia


Abstract
Smart clothing, as a cutting-edge artificial intelligence product integrating fashion and technology, demonstrates substantial market potential. However, smart clothing featuring traditional Chinese medicine (TCM) therapeutic functions has yet to achieve widespread adoption, with notably low usage frequency and short application cycles among users. To address this challenge, this study constructs a theoretical model of user behavior for TCM therapeutic smart clothing by integrating the Technology acceptance model, theory of planned behavior, and perceived risk (PR) theory. A multi-stage research design was adopted. A structured questionnaire based on established scales yielded 567 valid online responses (response rate: 97.7%), providing empirical support. Descriptive statistics and cluster analysis explored sample characteristics and group differences. Confirmatory factor analysis assessed measurement reliability and validity, while structural equation modeling tested hypothesized relationships. Additionally, hierarchical regression and simple slope analysis examined the moderating effect of user technology literacy (UTL). Results showed that perceived ease of use (PEOU) and perceived usefulness significantly enhanced user stickiness, which positively influenced usage behavior. PR negatively affected stickiness, and UTL moderated the link between PEOU and stickiness. Notably, perceived behavioral control and perceived cost did not show significant effects, suggesting users prioritize functional benefits and health outcomes over controllability and economic concerns. This study integrates theoretical and empirical analysis to quantify key behavioral factors, offering insights for product design, marketing, and user experience optimization in TCM therapeutic smart clothing.
1 Introduction
Thanks to continuous socioeconomic development and rapid advances in artificial intelligence in recent years, intelligent wearable technology, as an emerging technological product category, is gradually penetrating the fashion domain. From smart bracelets, watches to glasses, innovative applications of intelligent technology continue to expand, extending into the clothing industry and forming a cross-boundary integration trend represented by smart clothing [1]. Smart clothing not only meets people’s demands for multifunctional apparel but also promotes the deep integration of modern artificial intelligence with daily life, bringing new breakthroughs in health management, functional design, and human–computer interaction [2]. According to the “2024–2029 China Smart Apparel Industry Market Analysis and Investment Risk Research Report,” the global smart clothing market is projected to reach $12.28 billion by 2029, with a compound annual growth rate of 22.3%. In China, the smart apparel market size is also showing rapid growth, expected to exceed 100 billion RMB by 2025, demonstrating enormous development potential.
Traditional Chinese medicine (TCM) therapeutic smart clothing, as an innovative product combining TCM therapy concepts with modern intelligent technology, aims to simulate TCM massage, heat therapy, and other treatments through built-in sensors and heating elements to provide users with health conditioning and comfort experiences. However, these products currently face multiple challenges in market application, including low usage frequency and insufficient user stickiness (US). This phenomenon not only limits the market penetration of TCM therapeutic smart clothing but also reflects its inadequacies in technical design and user experience. How to improve US of TCM therapeutic smart clothing and further transform it into stable usage behavior has become an urgent issue for both industry and academia to address.
In recent years, TCM therapeutic smart clothing, as an innovative application in intelligent medical care and health management, has received high attention and support from the Chinese government. The “Action Plan for Further Improving Product, Engineering and Service Quality (2022–2025)” released in 2022 proposed accelerating the research and development of new technology products such as smart clothing; the “Guiding Opinions on Accelerating Digital Empowerment of Life Services” issued in 2023 explicitly required advancing digital applications in the medical and health field and promoting the R&D and popularization of intelligent medical equipment; in 2024, the “Several Opinions on Promoting the Development of Digital TCM” further encouraged the development of TCM health monitoring devices and smart clothing using big data and artificial intelligence technologies, supporting the construction of preventive healthcare management platforms. These policies have clarified the important position of TCM therapeutic smart clothing in the national health management system and provided strong support for its technological innovation and market promotion.
Currently, user behavior (UB) issues in smart clothing have attracted widespread attention, particularly research on purchase intention and consumer behavior. For example, Shucong Chen and Jing Ye used the PLS-SEM model to explore factors influencing consumers’ smart clothing purchase intentions, revealing the significant impact of expressiveness on perceived ease of use (PEOU) [3]. Woo and Kim investigated the mediating effects of brand evaluation and information framing on users’ purchase intentions for smart medical clothing [4]. Additional studies also show this gap. For example, Turhan examined consumer acceptance of wearable technologies using the technology acceptance model (TAM) and theory of planned behavior (TPB) yet focused mainly on initial purchase intentions [5]. Similarly, Brauner et al. applied an extended TAM model to investigate user acceptance of smart textiles in home environments, but did not address US or continued use [6]. For instance, Ju and Lee explored the role of cognitive risks in users’ psychological resistance to smart clothing but failed to reveal the key mechanisms of US and usage behavior for TCM therapeutic smart clothing from multiple dimensions [7]. In addition, Arachchi and Samarasinghe recently highlighted the importance of integrating technology acceptance frameworks to predict adoption and sustained usage intentions for intelligent clothing, further underscoring the necessity of this study [8].
Therefore, it is necessary to further construct a research model targeting UB of TCM therapeutic smart clothing to fill the gaps in existing research. This study integrates three theoretical perspectives – TAM, TPB, and perceived risk (PR) theory – to construct a comprehensive research model. In this model, users’ perceptions regarding the usefulness and ease of use of smart clothing are considered essential drivers of their behavioral tendencies, while attitudes, behavioral control, and PRs reflect motivational and inhibitory factors in decision-making processes. Furthermore, perceived cost (PC) is regarded as a potential barrier to sustained use, whereas US captures repeated usage behaviors. In addition, user technology literacy (UTL) is incorporated as a moderating factor to examine its role in influencing the relationship between PEOU and US. This research not only quantifies the impact weights of key influencing factors but also provides theoretical support and practical guidance for product optimization, user experience enhancement, and market promotion strategies of TCM therapeutic smart clothing, aiming to promote further development and market penetration in this field.
2 Literature review and theoretical framework
2.1 TAM
TAM was first proposed by Davis in 1989 to study key factors influencing user acceptance of information systems [9]. The model emphasizes that perceived usefulness (PU) and PEOU are important variables affecting user behavioral intentions, while external variables such as system characteristics indirectly influence UB through PU and PEOU (Figure 1). Since its introduction, the TAM model has been widely applied and extended (TAM2 [10] and TAM3 [11]). Particularly in the field of users’ continuous usage, Bhattacherjee’s research further revealed the significant positive effect of PU on US and continued usage intention [12].

TAM. Created by the author.
For the emerging field of TCM therapeutic smart clothing, the TAM model has important applicability. First, the acceptance of smart wearable devices often depends on users’ evaluation of their functionality (perceived usefulness) and ease of use. In the context of TCM therapeutic smart clothing, factors such as whether the product effectively improves health management, whether it is easy to operate, and whether it simplifies daily health management tasks significantly influence users’ usage intentions. Through the TAM model, we can clearly identify core factors affecting user adoption of such products, providing theoretical support for product design and market promotion.
2.2 TPB
The TPB was proposed by Ajzen based on the theory of reasoned action (TRA) (Figure 2) [13]. By adding the variable of perceived behavioral control (PBC), TPB breaks through the interpretative limitations of the traditional TRA model regarding attitude toward behavior (ATB) and subjective norms, aiming to more comprehensively explain the formation process of user behavioral intentions [14]. The TPB model suggests that individual behavioral intentions are influenced not only by personal attitudes and social norms but also by their perception of behavioral control (such as abilities, resources, and barriers).

TPB model. Created by the author.
As a smart device that is highly dependent on personal health management, TCM therapeutic smart clothing influences users’ behavioral intentions not only through their attitudes toward the product (perceived usefulness and ease of use), but also through ATB (e.g., positive or negative evaluations from middle-aged and elderly users) and PBC (e.g., whether they possess adequate health knowledge or technical skills). Incorporating the TPB model helps us deeply understand users’ behavioral motivations in health management scenarios, especially how users weigh their attitudes, external expectations, and self-control perceptions when facing new technological products, which in turn affects their usage decisions.
2.3 PR theory
PR was first proposed by Bauer in 1960, suggesting that UB may lead to unpredictable personal losses and significantly influence behavioral intentions [15,16]. Research in the market field indicates that PR is more about subjective perception rather than actual risk. In the field of smart devices, PR is a key factor affecting consumers’ purchase decisions and usage intentions, especially when involving sensitive issues such as privacy and health.
In the context of TCM therapeutic smart clothing usage, Privacy Risk, Functional Risk, and Legal Risk are important dimensions affecting user perception. Users may worry about personal health data leakage, device functionality not meeting expected health management needs, or even question the product’s legality and safety. Therefore, PR theory provides us with a framework to understand how to reduce these PRs and increase product acceptance by analyzing how these risks affect users’ trust and usage intentions.
2.4 PC
PC refers to users’ subjective perception of combined economic, time, learning, psychological, and social costs in the consumption process. This concept is widely applied in consumer behavior research, emphasizing the inhibitory effect of resource input on UB. High economic costs, complex operating interfaces, and lengthy learning cycles often reduce users’ behavioral intentions [17].
In the context of TCM therapeutic smart clothing, PC is particularly evident. High prices may cause users to question product value; complex function settings (such as massage modes or heat intensity) increase learning and time costs; users may also experience psychological burden due to concerns about technical failures or poor functionality [18,19]. Therefore, this study introduces PC theory as a negative variable to explore its role in weakening US and reducing behavioral intentions, attempting to reveal the possibility of enhancing user experience and behavioral continuity by reducing PCs. At the same time, the application of PC theory helps us analyze how to improve user acceptance and usage intentions by simplifying product functions, reducing prices, and the learning burden.
2.5 UTL
UTL refers to users’ capability and familiarity in technology use, including cognitive ability, skill level, and adaptability [20]. Users with high technology literacy usually possess stronger self-efficacy, enabling them to better handle technical operations and troubleshooting when facing new technology, thereby increasing technology dependence and usage frequency.
For TCM therapeutic smart clothing, users’ technology literacy directly affects their evaluation of the product ease of use and subsequent usage intentions. Users with higher technology literacy may have higher tolerance for product functionality adaptability and operating interface complexity, thereby enhancing their usage stickiness. This article defines UTL as users’ demonstrated ability to master technical operations while using TCM therapeutic smart clothing and incorporates this construct into the model to investigate its moderating effect on key variables.
3 Materials and methods
3.1 Research design
To ensure the scientific rigor and systematic execution of this study, a multi-stage research design was adopted to guide the entire research process. This structured approach encompassed four key stages: theoretical modeling, data collection, data analysis, and results presentation. Each stage was closely aligned with the study’s objectives to ensure the logical progression from theoretical development to empirical validation and interpretation.
3.1.1 Stage 1: Theoretical modeling
The research commenced with a comprehensive literature review to establish the theoretical foundation. Drawing on the TAM, the TPB, and PR theory, this phase aimed to integrate relevant constructs and formulate hypotheses regarding user acceptance and behavioral intentions toward TCM therapeutic smart clothing. The outcome of this stage was a conceptual research model with clearly defined paths awaiting empirical testing.
3.1.2 Stage 2: Data collection
The second stage involved user-centered empirical investigation. Initially, user research was conducted to refine and contextualize scale items, ensuring their applicability to the study domain. Based on these findings, a structured questionnaire was developed incorporating established scales. The questionnaire was then distributed via online channels, resulting in the collection of 567 valid responses. This robust dataset provided the empirical basis for subsequent statistical analysis.
3.1.3 Stage 3: Data analysis
This stage consisted of a series of multivariate analysis techniques to test the proposed model and hypotheses. Descriptive statistics and cluster analysis were first employed to profile respondent characteristics and identify potential group differences. Next, confirmatory factor analysis (CFA) was performed to evaluate the measurement model, focusing on factor loadings, reliability (composite reliability, CR), and validity (average variance extracted, AVE). Following the validation of the measurement model, structural equation modeling (SEM) was applied to test the hypothesized relationships among constructs. Additionally, moderation analysis, using hierarchical regression and simple slope analysis, was conducted to examine the moderating role of UTL.
3.1.4 Stage 4: Results presentation
In the final stage, the research findings were systematically summarized and visualized. Path diagrams and moderation effect plots were used to present the results intuitively. Furthermore, the findings were interpreted in the context of existing literature, highlighting both supported and unsupported hypotheses. The overall research process is illustrated in Figure 3 for clarity.
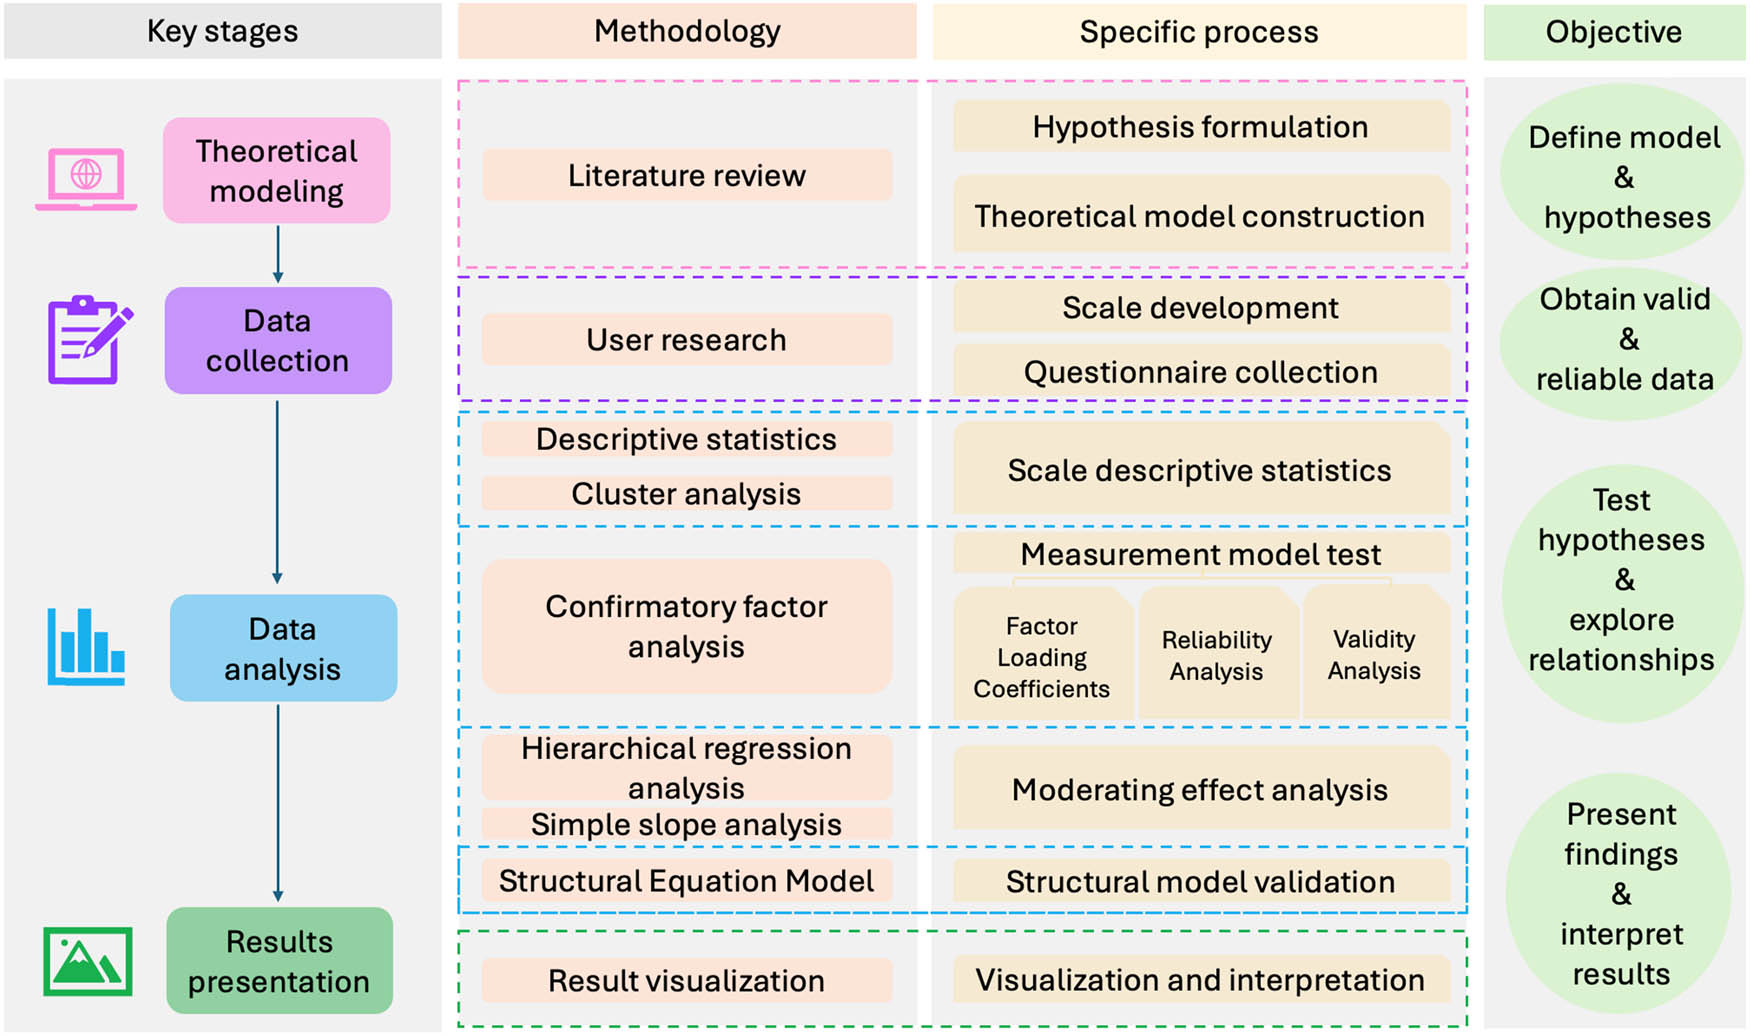
Flowchart of the research process. Created by the author.
3.2 Research hypotheses
3.2.1 PU
PU is one of the important variables in studying user adoption intention. According to the TAM model, the key to users’ willingness to adopt new technology lies in whether they perceive significant usage value [21]. Holden and Karsh further point out that PU is a core factor affecting user technology adoption, as users’ perception of technology’s value directly influences their adoption intention [22]. Additionally, other studies have shown that PU significantly impacts users’ acceptance of new technology, especially in the healthcare technology field, directly affecting users’ acceptance level and usage frequency [23]. Thus, in smart health device applications, PU is an important factor driving US. Based on this, we propose
H1: PU positively influences US.
3.2.2 PEOU
PEOU reflects the degree of difficulty users perceive when learning or using new technology. The TAM model indicates that PEOU not only affects users’ adoption behavior but also indirectly promotes user intention by enhancing PU [24]. Specifically, if users find a technology easy to use, they are more likely to perceive it as having higher usage value and thus more likely to adopt it. In smart clothing applications, PEOU is particularly important as the operational convenience of this technology directly affects users’ acceptance and usage continuity. If users experience low learning costs and high operational convenience when using TCM therapeutic smart clothing, they are more likely to believe the technology significantly benefits their health, thereby enhancing their PU of the technology and promoting US [25,26]. Based on this, we propose:
H2: PEOU positively influences PU.
H3: PEOU positively influences US.
3.2.3 ATB
ATB, derived from TPB theory, refers to users’ overall evaluation of performing a behavior [13], typically influenced by both behavioral beliefs (expectations of behavioral outcomes) and outcome evaluations (perceived value of outcomes) [27]. In the context of smart technology adoption, ATB influences PU by affecting individuals’ perception of the technology’s value. For example, if users have high comprehensive evaluations of TCM therapeutic smart clothing in terms of functionality, comfort, convenience, and price, they will consider the technology capable of meeting their health needs and having higher usage value, thus increasing their PU of the technology. Research shows that ATB not only plays an important role in users’ technology adoption intention but also further influences their behavioral decisions through PU. Based on this, we propose:
H4: ATB positively influences PU.
3.2.4 PBC
PBC is a key variable in the TPB model, reflecting users’ perception of their resources, skills, and opportunities when executing a behavior. According to TPB theory, PBC influences users’ behavioral intentions and decisions. In this study, PBC is defined as users’ confidence in their conditions (such as device connection and usage environment) when using TCM therapeutic smart clothing [28]. Existing research shows that PBC indirectly promotes the improvement of PU by enhancing users’ sense of control over technology [29]. Specifically, when users perceive they can effectively operate the technology, they are more likely to consider it having high usage value and practical benefits. Based on this, we propose:
H5: PBC positively influences PU.
3.2.5 PR
PR reflects users’ perception of potential adverse consequences when using new technology. In the smart clothing field, PR mainly manifests in privacy, functional, and legal aspects. For example, users may worry about health data leakage or functional failures leading to adverse consequences. In this study, PR is defined as users’ subjective perception of potential risks associated with TCM therapeutic smart clothing [30]. PR may lead to decreased user trust in the product, thereby affecting their willingness to continue using it. Li et al. found that PR has a significant negative impact on User Behavioral intentions and loyalty [31,32]. Based on this, we propose:
H6: PR negatively influences US.
3.2.6 PC
PC refers to users’ comprehensive perception of economic, time, learning, and psychological costs when using products or services [33]. As a negative variable, PC reflects users’ subjective perception of product investment costs, which may inhibit user intentions and behavior [34]. In the context of TCM therapeutic smart clothing usage, high device prices, complex operational learning, and psychological burden may inhibit users’ willingness to use and stickiness [35]. Higher PCs usually reduce users’ continued usage intention, especially in smart product and technology use [36,37]. Based on this, we propose:
H7: PC negatively influences US.
H8: PC negatively influences ATB.
3.2.7 US
US reflects users’ willingness to continuously use a product or service [38]. In the smart product field, US is typically related to user loyalty to products; higher stickiness indicates stronger user loyalty and higher behavioral frequency [39]. Particularly in the context of TCM therapeutic smart clothing, US is considered an important driver of ultimate usage behavior [40]. Users with high stickiness usually demonstrate strong purchase intention and long-term usage tendency, which is crucial for smart product market promotion and user retention [41]. Based on this, we propose:
H9: US positively influences UB.
3.2.8 UTL
UTL refers to users’ understanding, adaptation, and operational capabilities regarding new technology [42]. In this study, this variable is defined as users’ operational proficiency and adaptability to TCM therapeutic smart clothing, manifesting as a moderating effect on final usage behavior. Research shows that higher technology literacy enables users to better understand and operate new technology, thereby enhancing their acceptance and willingness to use it. In particular, users’ technology literacy level may moderate the relationship between PEOU and final usage behavior, as users with higher technology literacy may more positively perceive technology’s ease of use and use the product more frequently [43]. Based on this, we propose
H10: UTL positively moderates the influence of PEOU on UB.
3.3 Model construction
Based on the theoretical discussion and research hypotheses, this study proposes the following model, as shown in Figure 4. Built upon the variables from TAM and TPB, combined with PR theory, this study constructs a comprehensive model for analyzing UB of TCM therapeutic smart clothing. Based on market research of Chinese TCM therapeutic smart clothing, nine core variables were extracted to explore their pathway relationships with UB. These variables include PU, PEOU, ATB, PBC, PR, PC, US, UTL, and ultimate UB.

Theoretical model of UB for TCM therapeutic smart clothing. Created by the author.
In this model, US is viewed as a key variable directly affecting ultimate UB, while stickiness itself is influenced by multiple factors. Specifically, PU, PEOU, ATB, and PBC all significantly influence US, while PC and PR act as negative factors weakening US. Additionally, PEOU indirectly affects UB through its influence on PU. UTL is incorporated into the model to explore its positive moderating effect on ultimate UB.
Through the logical relationship between the above variables, this article constructs a UB model for TCM therapeutic smart clothing, which provides a theoretical basis for in-depth research on the path relationships and influence weights of various factors on UB.
3.4 Questionnaire design
Questionnaire design is the core component of this study’s empirical research, with its scientific rigor and rationality directly affecting the accuracy and interpretability of SEM analysis [44]. Drawing on a comprehensive review of relevant scales related to TCM therapeutic smart clothing research, and integrating the theoretical framework and model pathways of this study, the questionnaire was developed to include specific measurement items for nine core variables. The final version contains 37 measurement items, as shown in Table 1.
Variables and measurement items
| Latent variable | Description of questionnaire item | ID | References |
|---|---|---|---|
| ATB | I have a positive attitude towards using TCM therapeutic smart clothing | ATB 1 | [24,48] |
| I believe using TCM therapeutic smart clothing is beneficial for me | ATB 2 | ||
| I am optimistic about the future development prospects of TCM therapeutic smart clothing | ATB 3 | ||
| Using TCM therapeutic smart clothing makes me feel pleasant and comfortable | ATB 4 | ||
| PBC | I have sufficient ability to use TCM therapeutic smart clothing | PBC 1 | [49–51] |
| I can use TCM therapeutic smart clothing independently without help from others | PBC 2 | ||
| I can easily solve difficulties encountered while using TCM therapeutic smart clothing | PBC 3 | ||
| I feel at ease and confident when using TCM therapeutic smart clothing | PBC 4 | ||
| I am confident I can use TCM therapeutic smart clothing well in any situation | PBC 5 | ||
| PU | TCM therapeutic smart clothing is very helpful for my health management | PU 1 | [18,52,53] |
| Using TCM therapeutic smart clothing can improve my health management effectiveness | PU 2 | ||
| TCM therapeutic smart clothing helps me better regulate my body condition | PU 3 | ||
| I find TCM therapeutic smart clothing very effective in daily use | PU 3 | ||
| PEOU | The learning and usage process of TCM therapeutic smart clothing is very easy for me | PEOU1 | [21,54,55] |
| I can easily get started when using TCM therapeutic smart clothing | PEOU2 | ||
| The operating interface of TCM therapeutic smart clothing is very convenient | PEOU3 | ||
| The usage method of TCM therapeutic smart clothing is intuitive and easy to understand | PEOU4 | ||
| US | I frequently use TCM therapeutic smart clothing and don’t plan to switch to other therapeutic products | US 1 | [35,56,57] |
| TCM therapeutic smart clothing is an indispensable device in my daily health management | US 2 | ||
| If there are similar therapeutic devices, I would still prioritize TCM therapeutic smart clothing | US 3 | ||
| I highly rely on TCM therapeutic smart clothing in health management | US 4 | ||
| I will continue using TCM therapeutic smart clothing long-term to maintain my health | US 5 | ||
| PC | I believe the time and effort invested in using TCM therapeutic smart clothing is worthwhile | PC 1 | [16,58,59] |
| I think the price of TCM therapeutic smart clothing reflects its quality and effectiveness | PC 2 | ||
| I consider purchasing TCM therapeutic smart clothing an investment in health | PC 3 | ||
| I believe the investment in TCM therapeutic smart clothing has significantly improved my health | PC 4 | ||
| PR | I believe TCM therapeutic smart clothing is safe to use | PR 1 | [13,60–62] |
| I trust that TCM therapeutic smart clothing can protect my health data well | PR 2 | ||
| I feel the use of TCM therapeutic smart clothing is reliable | PR 3 | ||
| I believe the technology of TCM therapeutic smart clothing is mature and trustworthy | PR 4 | ||
| UB | I frequently use TCM therapeutic smart clothing for therapy | UB 1 | [63–65] |
| I use TCM therapeutic smart clothing multiple times per week for health management | UB 2 | ||
| Using TCM therapeutic smart clothing has become a regular behavior in my daily health management | UB 3 | ||
| I still use TCM therapeutic smart clothing regularly even without external requirements | UB 4 | ||
| UTL | I am familiar with using smart therapeutic devices like TCM therapeutic smart clothing | UTL 1 | [66–68] |
| I have a good understanding of how to operate TCM therapeutic smart clothing | UTL 2 | ||
| I am confident in mastering various functions of TCM therapeutic smart clothing | UTL 3 |
This study employs a seven-point Likert scale to measure each variable, with scores ranging from 1 to 7, where “1” represents “strongly disagree” and “7” represents “strongly agree” [45]. The seven-point scale effectively captures respondents’ subtle cognitive differences regarding each item and provides higher measurement precision for subsequent quantitative analysis [46]. Furthermore, to ensure the questionnaire’s applicability and reliability, the measurement items underwent multiple revisions during the design process to better align with the actual application scenarios of TCM therapeutic smart clothing [47].
The variables and their measurement items closely correspond to the model pathways, covering the following content:
PU: Measures users’ value perception of TCM therapeutic smart clothing in terms of health services and health level improvement.
PEOU: Evaluates users’ subjective perception of operational convenience, learning difficulty, and ease of technical mastery during use.
ATB: Reflects users’ overall evaluation of functionality, comfort, and credibility of combining technology with TCM therapeutic smart clothing.
PBC: Examines users’ subjective judgment of whether they possess the resources, skills, and conditions to use the product.
PR: Focuses on users’ subjective awareness of privacy leakage, functional failure, and legal risks.
PC: Measures users’ expected resource investment in using smart clothing, including economic costs (such as purchase and maintenance fees) and time costs.
US: Assesses users’ willingness to continuously use and loyalty to TCM therapeutic smart clothing.
UTL: Measures users’ personal technological knowledge, focusing on their ability and confidence in mastering technology.
UB: Reflects users’ actual usage frequency and behavioral performance regarding TCM therapeutic smart clothing.
The questionnaire design strictly follows the theoretical model and hypothetical pathways, ensuring high consistency between measurement content and research objectives, providing a reliable data foundation for subsequent SEM construction and verification.
4 Results
4.1 Scale descriptive statistics
A total of 580 questionnaires were distributed, and after excluding incomplete and invalid responses, 567 valid samples were obtained, resulting in an effective response rate of 97.7%. This high rate reflects the scientific rigor of the questionnaire design and the participants’ strong engagement.
As shown in Table 2, the gender distribution was nearly balanced, with males accounting for 49.6% and females 50.4%, ensuring gender representation. The age distribution indicated that respondents aged 60–69 formed the largest group (31.4%), followed by those aged 50–59 (42.0%), highlighting the dominance of middle-aged and elderly users. In terms of occupation, retirees represented the highest proportion (38.4%), suggesting this group as a key target for TCM therapeutic smart clothing.
Sample descriptive statistics
| Category | Attribute | F | % | Category | Attribute | F | % |
|---|---|---|---|---|---|---|---|
| Gender | Male | 281 | 49.6 | Profession | Healthcare | 48 | 8.5 |
| Female | 286 | 50.4 | Education and Research | 54 | 9.5 | ||
| Age | Under 18 | 7 | 1.2 | Technical/professional | 45 | 7.9 | |
| 18–29 | 19 | 3.4 | Sales and Marketing | 31 | 5.5 | ||
| 30–39 | 31 | 5.5 | Admin/management | 35 | 6.2 | ||
| 40–49 | 51 | 9 | Service industry | 38 | 6.7 | ||
| 50–59 | 238 | 42 | Students | 35 | 6.2 | ||
| 60–69 | 178 | 31.4 | Retired | 218 | 38.4 | ||
| 70 and above | 43 | 7.6 | Others | 63 | 11.1 | ||
| Education level | Junior high or below | 18 | 3.2 | Health status | Healthy | 99 | 17.5 |
| High school | 29 | 5.1 | General | 182 | 32.1 | ||
| Associate | 73 | 12.9 | Requires daily management | 208 | 36.7 | ||
| Bachelor | 224 | 39.5 | Others | 78 | 13.8 | ||
| Master | 171 | 30.2 | Exercise habits | Irregular exercise | 78 | 13.8 | |
| Doctoral or above | 52 | 9.2 | Occasional exercise | 188 | 33.2 | ||
| Monthly income level (RMB) | Under 3,000 | 20 | 3.5 | 1–2 Times a week | 194 | 34.2 | |
| 3,000–4,999 | 55 | 9.7 | 3 or More times a week | 107 | 18.9 | ||
| 5,000–7,999 | 88 | 15.5 | Frequency of using electronic devices | Less than 1 hour a day | 87 | 15.3 | |
| 8,000–11,999 | 171 | 30.2 | 1–3 h a day | 179 | 31.6 | ||
| 12,000–19,999 | 161 | 28.4 | 3–5 h a day | 215 | 37.9 | ||
| 20,000 or above | 72 | 12.7 | More than 5 h a day | 86 | 15.2 |
Note: F = Frequency, % = Percentage.
Regarding educational background, respondents holding bachelor’s degrees constituted the largest proportion (39.5%), followed by those with master’s degrees (30.2%), reflecting relatively high levels of knowledge and information comprehension. Monthly income data revealed that 30.2% of the participants earned between 8,000 and 11,999 RMB and 28.4% between 12,000 and 19,999 RMB, indicating a considerable purchasing power among the respondents.
Health-related characteristics further revealed user traits. About 36.7% of participants required daily health management, while 34.2% exercised 1–2 times per week. Additionally, 37.9% reported using health management products for 3–5 h daily, suggesting significant health needs and a high awareness of health management behaviors.
In summary, the survey data show that the main participating group was concentrated in the 60–69 age range, predominantly retirees, with strong health needs, economic purchasing power, and relatively high education levels. These characteristics provide clear direction for the market positioning of TCM therapeutic smart clothing, namely focusing on middle-aged and elderly groups who are concerned with the quality of life and health protection. By designing personalized functions and pricing strategies targeting this group, there is potential to improve product user acceptance and market share.
4.2 Analysis of influence factor means
To explore differences across demographic groups, cluster analysis was conducted based on the means of nine latent variables (ATB, PBC, PU, PEOU, US, PC, PR, UB, and UTL) across different education levels and age groups. This method is appropriate for identifying hierarchical patterns in the data. The clustering results are illustrated in Figure 5.
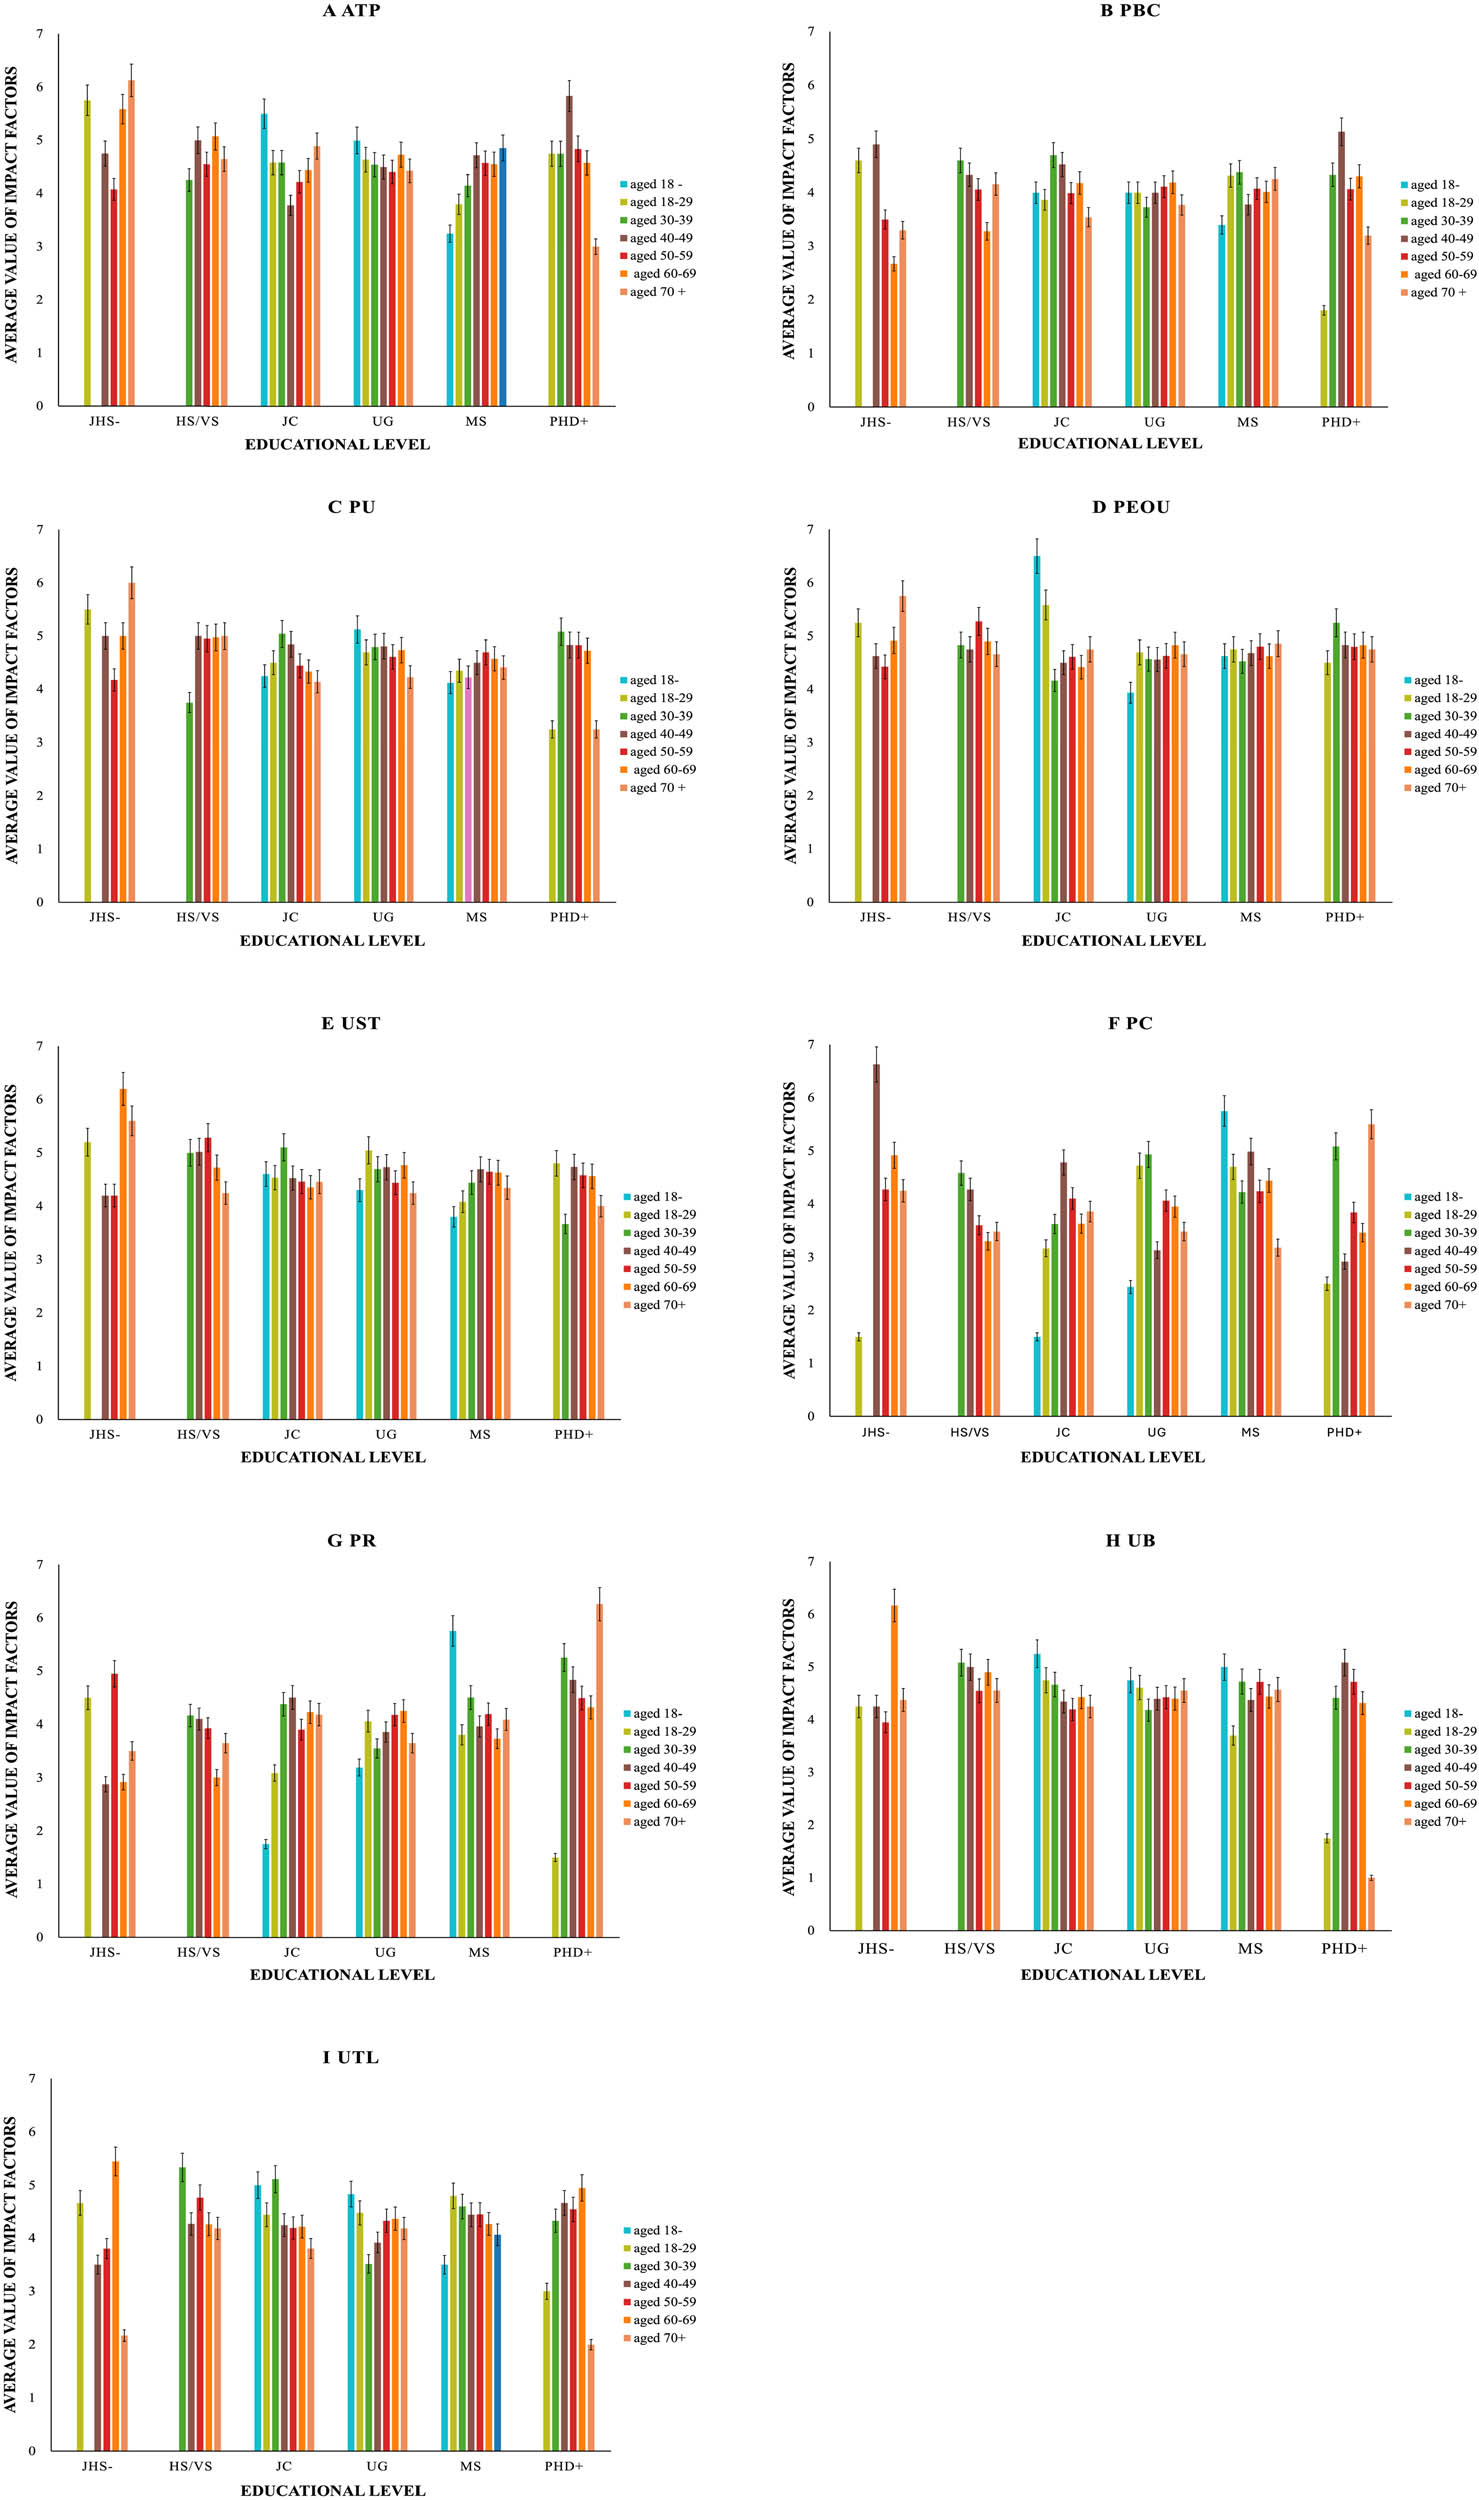
Item cluster diagram. Created by the author.
The analysis revealed that groups with higher education levels generally scored higher across all latent variables compared to groups with lower education levels, particularly in PBC and US. For instance, within the 50–59 age group, participants with master’s degrees reported an average score of 4.8 for PBC, whereas those with middle school education or below scored only 3.3. A similar pattern was observed for US, with highly educated individuals averaging 4.8 compared to 3.6 in the lower education group. These findings suggest that higher education levels may be associated with greater technology acceptance and economic capacity, which contribute to enhanced attitudes and behaviors toward TCM therapeutic smart clothing.
A clear trend was also observed regarding age. Middle-aged and elderly participants (50–69 years) scored significantly higher on ATB and US than younger age groups. For example, among participants with master’s degrees, those aged 60–69 averaged 5.6 on ATB, while the 30–39 age group scored only 4.7. These results indicate that older users, particularly those with health management needs, exhibit more positive attitudes and higher satisfaction with TCM therapeutic smart clothing.
Furthermore, the interaction between education level and age group further highlighted that highly educated middle-aged and elderly individuals demonstrated the strongest performance across latent variables. They not only reported the highest US and ATB but also perceived lower levels of risk. This suggests that they are the core target user group for TCM therapeutic smart clothing. In contrast, elderly individuals with lower education levels showed higher PR and lower US, underscoring the importance of targeted education and promotional efforts to enhance trust and facilitate product adoption among this segment.
4.3 Factor loading coefficients
CFA was conducted to evaluate the measurement model by examining the factor loading coefficients between latent variables and their observed indicators (Table 3) [44]. All standardized factor loadings exceeded the recommended threshold of 0.70, indicating satisfactory convergent validity and robust construct representation.
Factor loading coefficients
| Factor | Item | Unstd. Load. | Std. Load. | SE | CR | P |
|---|---|---|---|---|---|---|
| ATB | ATB1 | 1 | 0.796 | |||
| ATB2 | 0.938 | 0.761 | 0.051 | 18.224 | *** | |
| ATB3 | 0.942 | 0.751 | 0.052 | 17.958 | *** | |
| ATB4 | 0.993 | 0.773 | 0.054 | 18.514 | *** | |
| PBC | PBC1 | 1 | 0.775 | |||
| PBC2 | 1.036 | 0.814 | 0.051 | 20.378 | *** | |
| PBC3 | 1.006 | 0.805 | 0.050 | 20.120 | *** | |
| PBC4 | 1.040 | 0.823 | 0.050 | 20.645 | *** | |
| PBC5 | 0.989 | 0.823 | 0.048 | 20.639 | *** | |
| PU | PU1 | 1 | 0.752 | |||
| PU2 | 1.041 | 0.776 | 0.060 | 17.272 | *** | |
| PU3 | 1.031 | 0.752 | 0.061 | 16.783 | *** | |
| PU4 | 1.018 | 0.754 | 0.060 | 16.828 | *** | |
| PEOU | PEOU1 | 1 | 0.811 | |||
| PEOU2 | 0.982 | 0.764 | 0.052 | 18.941 | *** | |
| PEOU3 | 1.038 | 0.789 | 0.053 | 19.669 | *** | |
| PEOU4 | 1.005 | 0.780 | 0.052 | 19.400 | *** | |
| US | US1 | 1 | 0.807 | |||
| US2 | 0.872 | 0.709 | 0.049 | 17.801 | *** | |
| US3 | 1.008 | 0.788 | 0.050 | 20.309 | *** | |
| US4 | 0.993 | 0.794 | 0.048 | 20.499 | *** | |
| US5 | 0.965 | 0.797 | 0.047 | 20.601 | *** | |
| PC | PC1 | 1 | 0.784 | |||
| PC2 | 1.069 | 0.820 | 0.052 | 20.568 | *** | |
| PC3 | 1.050 | 0.831 | 0.050 | 20.884 | *** | |
| PC4 | 1.090 | 0.850 | 0.051 | 21.385 | *** | |
| PR | PR1 | 1 | 0.830 | |||
| PR2 | 0.979 | 0.821 | 0.044 | 22.169 | *** | |
| PR3 | 0.988 | 0.835 | 0.044 | 22.671 | *** | |
| PR4 | 0.968 | 0.807 | 0.045 | 21.681 | *** | |
| UB | UB1 | 1 | 0.752 | |||
| UB2 | 1.009 | 0.791 | 0.056 | 18.131 | *** | |
| UB3 | 1.047 | 0.791 | 0.058 | 18.151 | *** | |
| UB4 | 1.032 | 0.809 | 0.056 | 18.526 | *** | |
| UTL | UTL1 | 1 | 0.850 | |||
| UTL2 | 1.028 | 0.847 | 0.048 | 21.218 | *** | |
| UTL3 | 0.950 | 0.766 | 0.049 | 19.551 | *** |
4.3.1 Standardized factor loading coefficients
The standardized factor loadings ranged from 0.709 to 0.850. UTL exhibited the highest loading (UTL1 = 0.850), suggesting excellent measurement validity for this moderating construct. PR and PC also demonstrated strong factor loadings, ranging from 0.807 to 0.835 and from 0.784 to 0.850, respectively. These results indicate that both constructs are well-represented by their observed indicators.
US, while slightly lower, still maintained satisfactory loadings between 0.709 and 0.807. This suggests that the measurement scale for US reliably captures the core characteristics of this construct.
4.3.2 Critical ratios and significance
The significance of the factor loadings was confirmed through the critical ratios (C.R.). All C.R. values exceeded the threshold of 1.96, ranging from 16.783 to 22.671, and all corresponding p-values were less than 0.001. This indicates strong statistical significance for all observed indicators, further validating the appropriateness of the measurement model.
4.3.3 Specific performance of latent variables
Further examination of individual latent variables showed consistent and meaningful results. PBC and ATB had factor loadings between 0.775–0.823 and 0.751–0.796, respectively, demonstrating high internal consistency. For PEOU and PU, the loadings ranged between 0.764–0.811 and 0.752–0.776, with PEOU1 contributing particularly strongly. UTL and PR also maintained relatively high and concentrated loading ranges, reinforcing the reliability of their measurement.
In conclusion, the CFA results indicate that factor loading coefficients for all latent variables were significant and met theoretical expectations, with standardized factor loading values falling within statistical requirements and critical ratio significance supporting the measurement model’s validity. The factor loading results further verify the structural validity robustness of the measurement tool, laying a solid foundation for subsequent SEM analysis.
4.4 Reliability analysis
To assess the internal consistency and reliability of the measurement model, Cronbach’s alpha coefficients and CR were calculated for each latent variable (Table 4). The results demonstrated that all latent variables met the accepted reliability standards, with both Cronbach’s alpha and CR values exceeding the recommended threshold of 0.70, indicating strong reliability of the measurement instruments.
Reliability analysis
| Latent variable | Alpha | CR | Item count |
|---|---|---|---|
| ATB | 0.853 | 0.854 | 4 |
| PBC | 0.904 | 0.904 | 5 |
| PU | 0.844 | 0.844 | 4 |
| PEOU | 0.866 | 0.866 | 4 |
| US | 0.885 | 0.886 | 5 |
| PC | 0.892 | 0.893 | 4 |
| PR | 0.894 | 0.894 | 4 |
| UB | 0.865 | 0.866 | 4 |
| UTL | 0.860 | 0.862 | 3 |
4.4.1 Reliability analysis details
Cronbach’s alpha coefficient reflects the internal consistency of observed variables in the scale, calculated by the following formula:
where N represents the number of observed variables (items),
4.4.2 CR
CR provides further verification of the overall measurement model reliability for latent variables, calculated by the following formula:
where
Notably, UTL achieved a CR value of 0.862, closely aligned with its Cronbach’s alpha result. This further validates the scale’s ability to stably capture the characteristics of this moderating variable, despite having only three measurement items.
In conclusion, reliability analysis results fully demonstrate that the scale used in this study performed excellently in both internal consistency (Cronbach’s alpha) and structural reliability (CR). This not only verifies the scientific nature of the scale design but also indicates significant theoretical fit and statistical significance between latent variables and their observed variables. Particularly, the high reliability of PBC and PR reflects important characteristics in User Behavioral control and risk perception, while the reliability of moderating variable UTL further supports its key role in the moderating model. These results validate the theoretical feasibility and practical value of the research model in UB analysis.
4.5 Validity analysis
To assess the measurement validity of the scale, both convergent validity and discriminant validity were examined. Convergent validity evaluates the extent to which latent variables explain their observed indicators, while discriminant validity tests whether latent variables are empirically distinct from each other. These assessments were conducted using AVE and correlation analysis according to the Fornell–Larcker criterion (Table 5).
Analysis of convergent validity and discriminant validity
| Latent variable | ATB | PBC | PU | PEOU | US | PC | PR | UB | UTL |
|---|---|---|---|---|---|---|---|---|---|
| ATB | 0.594 | ||||||||
| PBC | 0.065 | 0.653 | |||||||
| PU | 0.445 | 0.121 | 0.575 | ||||||
| PEOU | 0.349 | 0.160 | 0.317 | 0.618 | |||||
| US | 0.429 | 0.087 | 0.437 | 0.440 | 0.608 | ||||
| PC | −0.137 | 0.122 | −0.007 | 0.061 | −0.055 | 0.675 | |||
| PR | −0.013 | 0.191 | −0.043 | −0.02 | −0.228 | 0.174 | 0.678 | ||
| UB | 0.250 | 0.237 | 0.353 | 0.366 | 0.348 | 0.108 | 0.047 | 0.618 | |
| UTL | 0.360 | 0.051 | 0.291 | 0.317 | 0.232 | −0.058 | 0.013 | 0.221 | 0.676 |
|
|
0.770 | 1.461 | 0.759 | 0.786 | 0.780 | 1.497 | 0.823 | 0.786 | 1.498 |
Note: The data in the lower left corner represent the correlation coefficients, while the data along the diagonal represent the AVE.
4.5.1 Convergent validity
AVE values were calculated for each latent variable to assess convergent validity. According to established standards, AVE values exceeding 0.50 indicate that the construct explains more than half of the variance in its indicators, supporting adequate convergent validity.
The results showed that all latent variables had AVE values above 0.50, confirming strong convergent validity. PBC (0.653) and UTL (0.676) demonstrated particularly high AVE values. Although ATB (0.594) and PU (0.575) recorded slightly lower AVE values, they still met the acceptable threshold, indicating that all constructs reliably reflect their underlying latent variables.
4.5.2 Discriminant validity
Discriminant validity was assessed using the Fornell–Larcker criterion, which requires that the square root of each construct’s AVE exceeds its correlations with other constructs.
Analysis results supported adequate discriminant validity. For instance, the square root of US’s AVE was 0.780, higher than its correlations with other constructs (e.g., 0.437 with PU). Similarly, UTL had an AVE square root of 1.498, far exceeding its highest correlation (0.360 with ATB), indicating a clear distinction from other constructs.
Overall, low to moderate correlations among latent variables further confirmed their empirical distinctiveness. For example, PR demonstrated relatively low correlations with other variables, ranging from −0.228 to 0.191, which reinforces the independence of constructs within the measurement model.
In conclusion, this study’s measurement model performed well in both convergent and discriminant validity. All latent variables’ AVE values exceeded 0.5, indicating strong explanatory power of the scale for observed variables of latent variables, verifying the scale’s convergent validity. Meanwhile, latent variables’ AVE square roots exceeded their correlation coefficients with other latent variables, supporting discriminating capability between latent variables, fully demonstrating the scale’s discriminant validity.
This validity analysis not only laid a reliable foundation for subsequent SEM analysis but also provided important theoretical support, validating the scientific nature and practicality of the US model for TCM therapeutic smart clothing. Particularly, the high validity of UTL and PBC further verified their key roles in intelligent medical device adoption. These findings provide new data support for academic and practical fields of TCM therapeutic smart clothing, emphasizing the importance of optimizing technology acceptance and sense of behavioral control to enhance smart clothing adoption.
4.6 Moderating effect analysis
To further investigate the relationships among PEOU, UTL, and UB, a hierarchical regression analysis was conducted based on the TAM. By gradually introducing the moderating variable (UTL) and the interaction term (PEOU × UTL), the incremental explanatory power and significance of the moderation effect were systematically examined. The results are summarized in Table 6.
Moderating effect analysis results
| Variable | Dependent variable: UB | ||
|---|---|---|---|
| Model 1 | Model 2 | Model 3 | |
| (Constant) | 4.477 (108.460) | 4.477 (109.159) | 4.450 (106.440) |
| PEOU | 0.346 (7.927) | 0.311 (6.891) | 0.303 (6.745) |
| UTL | 0.86 (2.811) | 0.80 (2.716) | |
| PEOUUTL | 0.74 (2.91) | ||
| R 2 | 0.1 | 0.113 | 0.126 |
| Adjusted R 2 | 0.099 | 0.11 | 0.122 |
| F | F = 62.845, p = 0.000 | F = 35.979, p = 0.000 | F = 27.126, p = 0.000 |
Note: p < 0.05, p < 0.01; the values in parentheses represent the t-values.
4.6.1 Overall explanatory power of moderation models
From the R 2 and adjusted R 2 values, it can be seen that the model’s explanatory power gradually increased after introducing the moderating variable (UTL) and interaction term (PEOU × UTL):
Model 1 (PEOU only): Adjusted R 2 = 0.099, explanatory power of 10%.
Model 2 (PEOU + UTL): Adjusted R 2 = 0.110, explanatory power increased to 11.3%.
Model 3 (PEOU + UTL + PEOU × UTL): Adjusted R 2 = 0.122, explanatory power further increased to 12.6%.
F-values for all three models were significant (p < 0.001), indicating statistical significance of the overall moderation model. This shows that as model complexity increased, the explanatory power for UB also gradually improved, validating the theoretical value of moderating variables and interaction effects.
4.6.2 Main effect analysis of core variables
PEOU has a significant positive influence on User Stickiness (UB):
In Model 1, PEOU’s regression coefficient was 0.346 (t = 7.927, p < 0.01), indicating its significant independent effect on UB.
In Models 2 and 3, with the introduction of other variables, PEOU’s effect slightly decreased (Model 3: B = 0.303, t = 6.745, p < 0.01) but maintained significance, verifying the key role of PEOU in UB.
4.6.3 Main effect of moderating variable (UTL)
UTL showed significant positive effects on UB in both Models 2 and 3:
In Model 2, UTL’s regression coefficient was 0.86 (t = 2.811, p < 0.01).
In Model 3, the coefficient slightly decreased to 0.80 (t = 2.716, p < 0.01) after adding the interaction term, but remained statistically significant. This indicates that although the independent effect of UTL weakened after introducing the interaction term (PEOU × UTL), it still maintained an important role in explaining UB as a key variable.
4.6.4 Interaction effect analysis
The interaction term (PEOU × UTL) demonstrated a significant moderating effect in Model 3, with a regression coefficient of 0.74 (t = 2.91, p < 0.01).
This indicates that UTL significantly moderates the relationship between PEOU and UB. As UTL levels increase, the positive effect of PEOU on UB strengthens, verifying the existence of the moderating effect.
To better illustrate the moderating effect of UTL on the relationship between PEOU and UB, simple slope analysis was conducted, and the results are presented in Figure 6.
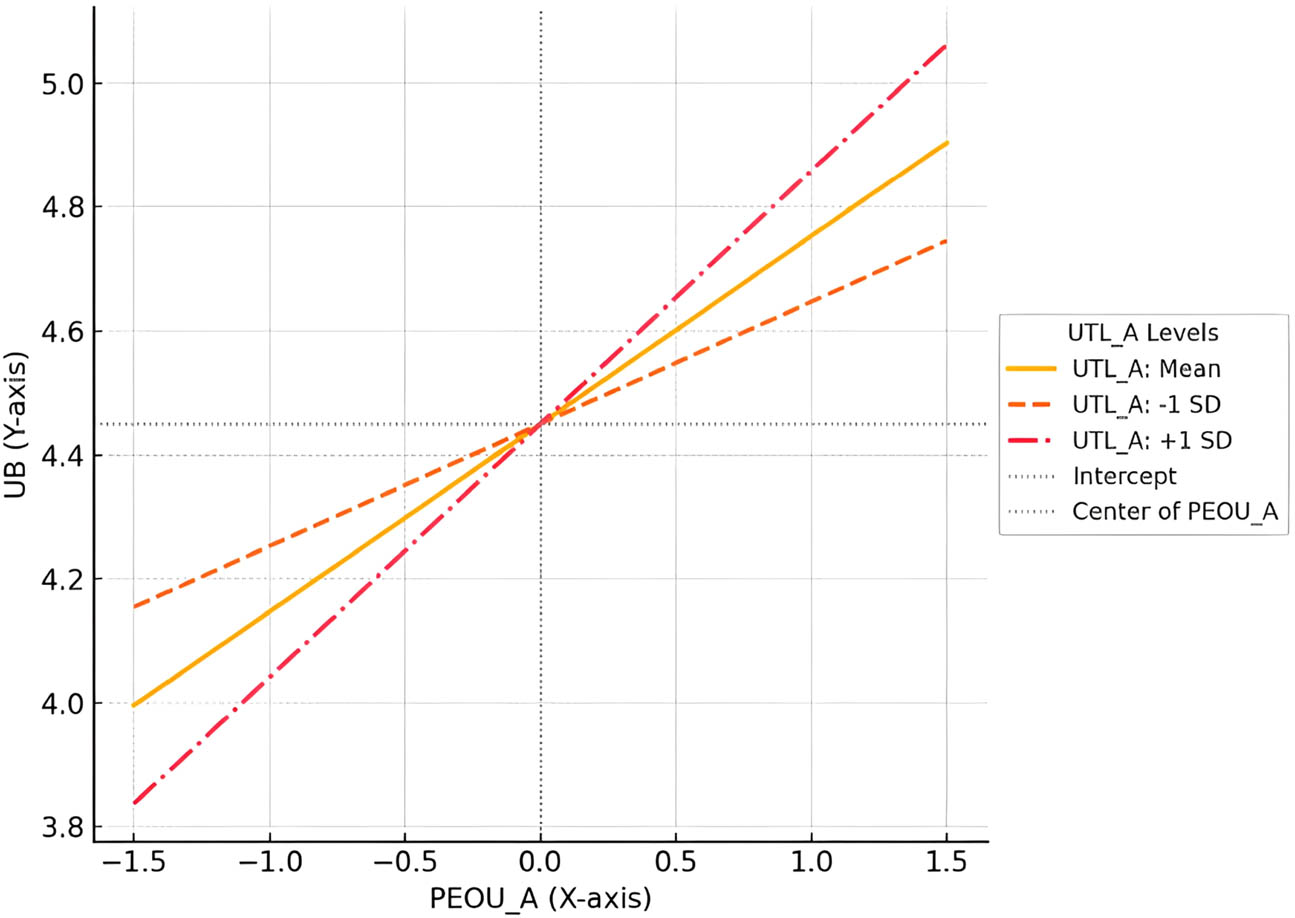
Simple slope graph. Created by the author.
The plot reveals that
When UTL is low (−1.44), the slope of the relationship between PEOU and UB is relatively small, indicating a weak influence of PEOU.
When UTL is at an average level (0), the slope becomes moderate, suggesting a stronger effect of PEOU on UB.
When UTL is high (+1.44), the slope is the steepest, demonstrating that PEOU has the most pronounced positive impact on UB for users with higher technology literacy.
These results indicate that the positive influence of PEOU on UB becomes significantly stronger as UTL increases. Specifically, for individuals with higher levels of technology literacy, ease-of-use features are more readily accepted and translated into continuous usage behavior. In contrast, among users with lower technology literacy, improvements in ease of use alone may be insufficient to substantially enhance US.
In conclusion, this study verified the significant effects of PEOU, UTL, and their interaction term on UB, further supporting the core hypothesis H10. Research shows that enhancing user technology familiarity can significantly strengthen the positive effect of PEOU on UB, particularly notable among users with high technology familiarity. This finding not only provides theoretical support for optimizing the UB model of TCM therapeutic smart clothing but also offers important insights for product promotion practices – through user education, operation simplification, and lowering technical barriers, user acceptance and continued usage intention can be effectively enhanced, promoting further development of the TCM therapeutic smart clothing industry.
4.7 Model analysis
To comprehensively explore the theoretical construction and practical significance of the UB model for TCM therapeutic smart clothing, this study conducted empirical testing of hypothesized paths based on SEM. Through comprehensive analysis of model fit indices, path coefficients, significance levels, and confidence intervals, the relationships between PU, PEOU, ATB, PBC, PR, PC, US, UTL, and UB were verified (Figure 7).

Model results diagram. Created by the author.
4.7.1 Model fit testing
Multiple fit indices were used to assess the overall model fit, including chi-square/degrees of freedom ratio (χ 2/df), comparative fit index (CFI), Tucker–Lewis index (TLI), root mean square error of approximation (RMSEA), and standardized root mean square residual (SRMR).
The analysis yielded the following fit indices:
χ 2/df = 2.311 (acceptable threshold: <3),
CFI = 0.926 (acceptable threshold: >0.90),
TLI = 0.913 (acceptable threshold: >0.90),
RMSEA = 0.048 (acceptable threshold: <0.08),
SRMR = 0.041 (acceptable threshold: <0.08).
All indices met or exceeded the recommended thresholds, indicating that the proposed structural model achieved an acceptable to good overall fit. These results suggest that the model adequately captures the relationships among latent variables and is statistically robust (Table 7).
Key fit indices and suggested values
| Index | CMIN | DF | CMIN/DF | RMSEA | TFI | NFI | IFI | CFI |
|---|---|---|---|---|---|---|---|---|
| Ideal value | — | — | <3 | <0.08 | >0.9 | >0.9 | >0.9 | >0.9 |
| Standard value | — | — | <5 | <0.10 | >0.8 | >0.8 | >0.8 | >0.8 |
| Fit value | 839.008 | 518 | 1.620 | 0.033 | 0.966 | 0.922 | 0.969 | 0.969 |
4.7.2 Path coefficient analysis
Through SEM path coefficient analysis of the US model hypotheses, hypothesis relationships were verified through path coefficients, significance levels, and confidence intervals (Table 8). Path establishment criteria were path coefficient >0.3, significance P < 0.05, and confidence interval not crossing 0 (i.e., not having both positive and negative values). Hypotheses H1, H2, H3, H4, H6, H8, and H9 received significant support, while H5 and H7 were not fully established. Research results indicate that ATB, PU, PEOU, and US play key roles in UB; PR significantly negatively affects US, but PC’s direct effect on US is not significant. Additionally, PBC’s effect on PU is not significant. Overall, this study verified the reasonableness of the UB model for TCM therapeutic smart clothing, providing theoretical support for improving UB.
Path relationship coefficient
| Path relationship | Estimate | SE | C.R. (t) | P | Lower CI | Upper CI | ||
|---|---|---|---|---|---|---|---|---|
| ATB | ← | PC | −0.136 | 0.028 | −2.822 | 0.005 | −0.19088 | −0.08112 |
| PU | ← | ATB | 0.405 | 0.041 | 8.079 | *** | 0.32464 | 0.48536 |
| PU | ← | PEOU | 0.19 | 0.048 | 4.084 | *** | 0.09592 | 0.28408 |
| PU | ← | PBC | 0.079 | 0.032 | 1.773 | 0.076 | 0.01628 | 0.14172 |
| US | ← | PU | 0.35 | 0.049 | 7.515 | *** | 0.25396 | 0.44604 |
| US | ← | PR | −0.202 | 0.027 | −4.855 | *** | −0.25492 | −0.14908 |
| US | ← | PC | −0.035 | 0.021 | −0.857 | 0.392 | −0.07616 | 0.00616 |
| US | ← | PEOU | 0.341 | 0.049 | 7.567 | *** | 0.24496 | 0.43704 |
| UB | ← | US | 0.359 | 0.049 | 7.369 | *** | 0.26296 | 0.45504 |
Note: ***p < 0.001.
5 Discussion
This study empirically explored the influencing factors shaping UB in the context of TCM therapeutic smart clothing. By examining multiple hypothesized relationships, we confirmed the significant roles of constructs such as PEOU, PU, US, PC, and UTL. However, some hypothesized paths, including the relationship between PBC and PU, as well as PC and US, did not reach significance. These findings provide valuable insights and merit further discussion.
5.1 Discussion of factor relationships
5.1.1 Discussion of positive factor relationships
This study verified the positive influence of PU and PEOU on US, thereby further supporting the core hypotheses of the TAM. These findings demonstrate that enhancing users’ PU and PEOU of TCM therapeutic smart clothing products can directly increase their intention for continued use. For instance, Luo et al. reported that, within the context of smart healthcare services, users’ perceptions of usefulness significantly influenced their intention to continue using these services, highlighting the critical role of PU in driving user engagement and satisfaction [69]. This pattern is particularly evident in TCM therapeutic smart clothing, where users place great value on actual health benefits. Such findings reveal a key insight: for healthcare-related smart products, PU is not merely a functional assessment but reflects users’ trust in health outcomes. Therefore, PU plays a dual role – both cognitive and emotional – making it a decisive factor in promoting continuous usage in health-focused scenarios.
Moreover, this study also confirms that in the context of smart clothing, PEOU not only directly enhances US but also indirectly promotes UB through its positive impact on PU. For TCM therapeutic smart clothing, improved PEOU enables users to more quickly understand and master product functions, reducing technology fear and adaptation costs, which is crucial for enhancing market competitiveness. Particularly as health management increasingly becomes a consumer focus, easy-to-use intelligent wearable devices can greatly lower user barriers, thus accelerating product promotion and popularization. Therefore, PEOU plays a bridge-like role in transforming technical accessibility into perceived product benefits. This mechanism underscores the importance of optimizing interface design and enhancing usability to accelerate product acceptance and market penetration.
Although PBC has been considered an important determinant of technology acceptance in numerous studies, this research revealed that PBC did not significantly influence PU (H5). This result may stem from the uniqueness of the TCM therapeutic smart clothing field. Compared to traditional technology products, smart clothing operation emphasizes functionality and health effects rather than merely relying on perceived control of technical operations. This suggests that in the context of TCM therapeutic smart clothing use, users’ focus on device functionality and health effects may be more important than perceived operational control. Future research should continue exploring such domain-specific modifications to better capture user decision-making logics in health-focused scenarios.
UTL as a moderating variable also showed a significant positive influence in this study. Research shows that UTL significantly enhances the effect of PEOU on UB. These results indicate that users with high technology literacy are more likely to accept and continue using the product when they perceive TCM therapeutic smart clothing as easy to operate. This aligns with Astuti et al.’s research, which indicates that digital literacy serves as a critical moderating variable, significantly enhancing the impact of technology’s perceived usability on user acceptance, particularly in contexts where high usability reduces barriers to adoption and fosters stronger behavioral intentions [70]. Additionally, related research shows that technology literacy not only affects users’ learning costs but also enhances their confidence, thereby increasing acceptance of intelligent products [71]. These findings have important implications for promoting TCM therapeutic smart clothing. Particularly in the current context of intelligent hardware popularization, product technology content and complexity may become major barriers for middle-aged and elderly groups. Therefore, strengthening education and training to improve technology literacy for user groups with different technology literacy levels, especially middle-aged and elderly groups, may be an effective strategy for enhancing US and long-term usage intention. Through this approach, not only can usage barriers be lowered, but user confidence and experience can also be enhanced, thereby promoting widespread application of smart clothing products.
5.1.2 Discussion of negative factor relationships
This study further confirmed that PR has a significant negative effect on US, indicating that users’ concerns regarding privacy, data security, and product reliability substantially reduce their continued usage intentions. This result is consistent with previous research. For instance, Tran’s study demonstrated that PR profoundly affects user satisfaction and purchase intentions in online and intelligent product contexts [72]. Similarly, in the domain of TCM therapeutic smart clothing, users’ apprehensions about health data leakage and device malfunctions emerged as key factors diminishing product satisfaction. Such findings reveal that in smart health products, PR is not just about financial or performance concerns, but more about trust and perceived vulnerability. The fear of private health information exposure directly undermines users’ emotional comfort, which in turn weakens their long-term attachment to the product. This highlights the central role of psychological security in promoting continued use in health-focused smart devices. Therefore, manufacturers should prioritize enhancing privacy protection and data security mechanisms. Through adopting encrypted storage, transparent data usage policies, and clear communication with users, it is possible to alleviate risk perceptions and improve user trust. Furthermore, building a comprehensive after-sales service system, such as offering free maintenance or extended warranties, can also help reduce users’ risk-related anxieties and enhance their satisfaction and stickiness. While PR exerted a significant negative influence on US, the anticipated negative impact of PC on ATB was not supported by the empirical data. This unexpected result suggests that, within the specific context of TCM therapeutic smart clothing, financial and learning-related costs may not serve as decisive barriers to forming positive user attitudes. Although such products are relatively expensive and may initially require users to invest time and effort in learning, these factors do not appear to significantly hinder attitude formation. A plausible explanation lies in the distinctive motivations of health-oriented consumers. For users with urgent health management needs, perceived benefits – particularly those related to tangible health outcomes – may outweigh cost considerations. In such cases, product efficacy and functional value are likely to dominate cognitive evaluations, minimizing the relevance of price and learning-related concerns. This interpretation is consistent with previous findings in other domains. For instance, Ramanathan and Sonia, in the context of pharmaceutical retailing, found that customer-centric service and effective product management could mitigate the negative effects of PC on user satisfaction. These findings collectively suggest that in health-related product markets, users’ strong functional dependence on product benefits may neutralize cost-related apprehensions, thereby reducing the adverse influence of PC on US [73].
In addition, PC did not exhibit a significant negative relationship with US, further challenging our initial hypothesis. Although the relatively high price and learning effort associated with TCM therapeutic smart clothing were expected to discourage repeated use, our findings indicate otherwise. For specific user segments, particularly those driven by pronounced health needs, cost-related concerns appear secondary to the perceived value and health-enhancing capabilities of the product. In this regard, product uniqueness and the promise of health-related benefits seem to play an overriding role in encouraging sustained usage. This pattern aligns with Ramanathan et al.’s research in health management, which suggested that strong user dependency on a product’s health benefits can attenuate concerns over financial and cognitive costs. Therefore, it can be inferred that in the realm of intelligent healthcare products, user decisions regarding continued use are more likely to be shaped by perceived functional value and health impact rather than cost considerations. This insight carries important implications for product development and marketing, underscoring the need to focus on enhancing and communicating product value to cultivate long-term user commitment.
5.2 Practical and management recommendations
Building on the above findings, this study proposes several practical and managerial recommendations aimed at enhancing the design, promotion, and user experience of TCM therapeutic smart clothing. These suggestions are grounded in the observed relationships among key variables, particularly the influence of PU, PEOU, UTL, and PR on US and UB.
First, given the significant positive impact of PU on US, it is critical that manufacturers emphasize product functionality and health benefits. The findings indicate that users’ sustained usage intentions are largely driven by their perception of tangible health management outcomes. Therefore, in the design and marketing of TCM therapeutic smart clothing, companies should highlight the product’s health value proposition. This includes clearly communicating how the product contributes to alleviating health issues and improving quality of life. Additionally, enhancing product personalization and operability can further strengthen PU by enabling users to tailor the product to their individual health needs.
Second, PEOU plays a central role, both directly and indirectly, in influencing US and UB. This underscores the importance of user-centered design principles. Manufacturers should prioritize simplifying product operation, optimizing interface usability, and minimizing the learning curve to lower technological barriers. Furthermore, this study identified UTL as a significant moderator, indicating that users with higher technology literacy levels derive greater benefits from ease-of-use features. Accordingly, companies should develop targeted educational programs and detailed operational guides to assist lower-literacy users in mastering the product. These initiatives are especially vital for middle-aged and elderly users, who may face greater challenges in adopting new technologies.
Third, ATB was found to exert a positive effect on PU. This suggests that fostering favorable user attitudes can indirectly enhance perceptions of product value. To cultivate positive attitudes, enterprises should invest in brand building and consumer education. Demonstrating the actual health benefits of TCM therapeutic smart clothing through marketing campaigns, testimonials, and health-related content can effectively increase user recognition and trust. Furthermore, offering engaging promotional activities and informative resources, such as online health lectures or product demonstration videos, may further reinforce positive attitudes and drive product adoption.
Fourth, given the significant negative effect of PR on US, reducing users’ risk perceptions is essential for improving continued usage intentions. The findings highlight privacy and security concerns as major barriers to user commitment. To address this issue, manufacturers should implement robust privacy protection measures, including encrypted data storage and transparent data usage policies. In addition, providing comprehensive after-sales services, such as warranty extensions and responsive customer support, can enhance users’ sense of security and trust, thereby mitigating the negative impact of PR.
Finally, from a broader market perspective, targeted marketing and differentiated service strategies are essential. TCM therapeutic smart clothing should focus on health-conscious consumer segments, particularly middle-aged and elderly groups with pronounced health management needs. Customized functions and personalized services tailored to these user segments can enhance product relevance and user satisfaction. Furthermore, by reducing perceived technical barriers and improving user-friendliness, companies can attract and retain users with lower technology literacy levels, thereby expanding market reach and promoting industry growth.
In summary, these practical recommendations are closely aligned with the empirical findings and offer actionable strategies for improving product design, marketing, and user engagement. By addressing the core drivers of UB – such as PU, ease of use, user literacy, and PR – manufacturers can more effectively meet user needs, enhance US, and accelerate the widespread adoption of TCM therapeutic smart clothing in the health management market.
5.3 Theoretical and practical significance
This study offers important theoretical and practical implications for understanding UB related to TCM therapeutic smart clothing, particularly within the context of intelligent health products. Based on the comprehensive analysis of positive and negative influencing factors, several key contributions can be identified.
From a theoretical perspective, this research extends and integrates the TAM, the TPB, and PR Theory to construct a more contextually relevant UB model for TCM therapeutic smart clothing. The empirical findings validate the pivotal roles of PU and PEOU, thereby reinforcing TAM’s explanatory power in intelligent product acceptance. Notably, the results also reveal that ATB significantly impacts PU, thus offering further empirical support for TPB in the domain of intelligent healthcare products. These findings suggest that classical acceptance theories, while robust, must be contextually adapted when applied to health-oriented intelligent products. In particular, health management scenarios emphasize outcome expectations and functional value, which may alter the traditional pathways of influence observed in other technology domains. Therefore, this study not only verifies but also refines and enriches the application of established theoretical frameworks within the smart healthcare context.
Furthermore, the significant negative influence of PR highlights its critical role as an inhibitory factor in user decision-making. By incorporating PR as an essential element of the UB model, this research introduces a valuable negative dimension to supplement traditional acceptance models, which often emphasize facilitating factors. This contribution underscores the necessity for future research to give balanced attention to both enablers and barriers in technology adoption models, particularly in contexts involving sensitive health-related information and personal privacy concerns. The findings thus offer a more holistic perspective for understanding user acceptance mechanisms in the intelligent health product sector.
From a practical standpoint, the study’s conclusions provide concrete guidance for product design, market promotion, and user experience enhancement. Specifically, the results emphasize the importance of highlighting health management functions and improving ease of use to strengthen PU and US. This suggests that manufacturers should prioritize user-centered design, incorporating intuitive interfaces and simplifying product operations to reduce technological barriers.
Additionally, the moderating role of UTL highlights the need for differentiated strategies targeting various user segments. For users with lower technology literacy – especially middle-aged and elderly consumers – comprehensive user education, operational guidance, and simplified product features are essential for improving acceptance and sustained usage. This insight emphasizes that smart health product strategies must go beyond generic solutions, instead adopting tailored approaches to meet the diverse capabilities and expectations of different user groups.
Reducing PR also emerges as a key managerial priority. By enhancing data security, privacy protection, and after-sales service, companies can effectively alleviate user concerns and build trust, which is essential for fostering long-term user relationships and encouraging continued use. Furthermore, the demonstrated insignificance of PC suggests that companies should focus on emphasizing product value and health-related benefits in marketing efforts, as users appear more motivated by tangible outcomes than by price considerations.
In conclusion, this study makes significant contributions at both theoretical and practical levels. Theoretically, it proposes and validates a refined UB model that integrates traditional acceptance frameworks with new dimensions tailored for intelligent health products. Practically, it offers actionable insights for enhancing product design, marketing strategies, and user engagement, ultimately supporting the broader adoption and sustainable development of TCM therapeutic smart clothing. Together, these contributions not only advance academic understanding but also provide valuable references for industry stakeholders aiming to promote innovative health-oriented smart clothing solutions.
6 Conclusion
This study makes important theoretical and practical contributions to understanding UB in TCM therapeutic smart clothing. Moving beyond prior research that mainly focused on purchase intentions, this research highlights US and long-term usage behavior as critical determinants of market success. The findings indicate that users prioritize functional benefits and health outcomes, suggesting that practical efficacy and ease of use are more influential than controllability or cost concerns. This insight reshapes existing assumptions based on classical models like TAM and TPB, emphasizing the need to recalibrate theoretical frameworks when applied to healthcare-oriented smart products. Furthermore, the identified moderating role of UTL suggests differentiated marketing and design strategies targeting various user groups. Practically, these results offer valuable guidance for designers and marketers seeking to enhance user retention and engagement through improving PU and ease of use while mitigating PRs. Nonetheless, several limitations should be acknowledged. First, the research model mainly focused on product-related attributes and did not incorporate external factors such as social influence, which may also affect UB. Second, although subjective user data were collected through surveys and interviews, objective behavioral data were not included. Third, as the smart clothing market in China is still at an early stage of development, the findings may not fully reflect future technological advancements and user expectations. Future studies are encouraged to address these issues by incorporating external variables, adopting more diverse data collection methods, and exploring smart clothing products with advanced functions.
-
Funding information: This work was supported by the National Social Science Foundation of China, Art General Project “Research on the Chinese Everyday Design History” (Grant No. 21BG41).
-
Author contributions: H.J. conceived and designed the study, conducted the investigation, performed the data analysis, and drafted the manuscript. L.Z. supervised the project, provided critical revisions, and approved the final version for submission.
-
Conflict of interest: Authors state no conflict of interest.
-
Data availability statement: The datasets generated during the current study are available from the corresponding author on reasonable request.
References
[1] Stoppa, M., Chiolerio, A. (2014). Wearable electronics and smart textiles: A critical review. Sensors, 14(6), 11957–11992.10.3390/s140711957Suche in Google Scholar PubMed PubMed Central
[2] Lin, Z. H., Chen, P. J. (2024). Evaluation and trend of smart clothing research: Visualization analysis based on bibliometric analysis and quantitative statistics. Fibers and Polymers, 25(9), 1479–1511.10.1007/s12221-024-00521-8Suche in Google Scholar
[3] Chen, S., Ye, J. (2023). Understanding consumers’ intentions to purchase smart clothing using PLS-SEM and fsQCA. PLoS ONE, 18, e0291870.10.1371/journal.pone.0291870Suche in Google Scholar PubMed PubMed Central
[4] Woo, H., Kim, S. (2022). An expansion of the brand and message framing effects on smart health-care clothing. Journal of Product & Brand Management, 31(6), 622–636.10.1108/JPBM-11-2020-3199Suche in Google Scholar
[5] Turhan, G. (2013). An assessment towards the acceptance of wearable technology to consumers in Turkey: The application to smart bra and t-shirt products. Journal of the Textile Institute, 104(4), 367–379.10.1080/00405000.2012.736191Suche in Google Scholar
[6] Brauner, P., van Heek, J., Ziefle, M. (2017). Age, gender, and technology attitude as factors for acceptance of smart interactive textiles in home environments: Towards a smart textile technology acceptance model. In International Conference on Human Aspects of IT for the Aged Population (pp. 44–57). Springer.10.5220/0006255600130024Suche in Google Scholar
[7] Ju, N., Lee, K.-H. (2021). Perceptions and resistance to accept smart clothing: Moderating effect of consumer innovativeness. Applied Sciences, 11, 3211.10.3390/app11073211Suche in Google Scholar
[8] Arachchi, H. A. D. M., Samarasinghe, G. D. (2024). Intention to adopt intelligent clothing in the fashion retail industry: Extending the Hisam Model with Technology Readiness. International Journal of Fashion Design, Technology and Education, 17(1), 50–63.Suche in Google Scholar
[9] Davis, F. D. (1985). A technology acceptance model for empirically testing new end-user information systems: Theory and results. Doctoral dissertation, Massachusetts Institute of Technology.Suche in Google Scholar
[10] Venkatesh, V., Davis, F. D. (2000). A theoretical extension of the technology acceptance model: Four longitudinal field studies. Management Science, 46(2), 186–204.10.1287/mnsc.46.2.186.11926Suche in Google Scholar
[11] Venkatesh, V., Bala, H. (2008). Technology acceptance model 3 and a research agenda on interventions. Decision Sciences, 39(2), 273–315.10.1111/j.1540-5915.2008.00192.xSuche in Google Scholar
[12] Bhattacherjee, A. (2001). Understanding information systems continuance: An expectation-confirmation model. MIS Quarterly, 25(3), 351–370.10.2307/3250921Suche in Google Scholar
[13] Ajzen, I. (1991). The theory of planned behavior. Organizational Behavior and Human Decision Processes, 50(2), 179–211.10.1016/0749-5978(91)90020-TSuche in Google Scholar
[14] Ajzen, I. (2020). The theory of planned behavior: Frequently asked questions. Human Behavior and Emerging Technologies, 2, 314–324.10.1002/hbe2.195Suche in Google Scholar
[15] Bauer, R. A. (1969). Consumer behavior as risk taking. Marketing: Critical perspectives on business and management, 593, 13–21.Suche in Google Scholar
[16] Mitchell, V. (1999). Consumer perceived risk: Conceptualizations and models. European Journal of Marketing, 33(1/2), 163–195.10.1108/03090569910249229Suche in Google Scholar
[17] Anwar, A., Thongpapanl, N., Ashraf, A. R. (2021). Strategic imperatives of mobile commerce in developing countries: The influence of consumer innovativeness, ubiquity, perceived value, risk, and cost on usage. Journal of Strategic Marketing, 29(9), 722–742.10.1080/0965254X.2020.1786847Suche in Google Scholar
[18] Wu, L.-Y., Chen, K.-Y., Chen, P.-Y., Cheng, S.-L. (2014). Perceived value, transaction cost, and repurchase-intention in online shopping: A relational exchange perspective. Journal of Business Research, 67(12), 2768–2776.10.1016/j.jbusres.2012.09.007Suche in Google Scholar
[19] Lin, K.-Y., Wang, Y.-T., Huang, T. K. (2020). Exploring the antecedents of mobile payment service usage. Online Information Review, 44(2), 299–318.10.1108/OIR-05-2018-0175Suche in Google Scholar
[20] Ng, W. (2012). Can we teach digital natives digital literacy? Computers & Education, 59(2), 1065–1078.10.1016/j.compedu.2012.04.016Suche in Google Scholar
[21] Davis, F. D. (1989). Perceived usefulness, perceived ease of use, and user acceptance of information technology. MIS Quarterly, 13(3), 319–340.10.2307/249008Suche in Google Scholar
[22] Holden, R. J., Karsh, B.-T. (2010). The technology acceptance model: Its past and its future in health care. Journal of Biomedical Informatics, 43(1), 159–172.10.1016/j.jbi.2009.07.002Suche in Google Scholar PubMed PubMed Central
[23] Agarwal, R., Prasad, J. (1999). Are individual differences germane to the acceptance of new information technologies? Decision Sciences, 30(2), 361–391.10.1111/j.1540-5915.1999.tb01614.xSuche in Google Scholar
[24] Gefen, D., Straub, D. W., Boudreau, M.-C. (2000). Structural equation modeling and regression: Guidelines for research practice. Communications of the Association for Information Systems, 4(7), 1–30.10.17705/1CAIS.00407Suche in Google Scholar
[25] Saadé, R., Bahli, B. (2005). The impact of cognitive absorption on perceived usefulness and perceived ease of use in online learning: An extension of the technology acceptance model. Information & Management, 42(2), 317–327.10.1016/j.im.2003.12.013Suche in Google Scholar
[26] Abdullah, F., Ward, R., Ahmed, E. (2016). Investigating the influence of the most commonly used external variables of TAM on students’ perceived ease of use (PEOU) and perceived usefulness (PU) of e-portfolios. Computers in Human Behavior, 63, 75–90.10.1016/j.chb.2016.05.014Suche in Google Scholar
[27] Fishbein, M., Ajzen, I. (1975). Belief, attitude, intention, and behavior: An introduction to theory and research. Addison-Wesley, Reading, Mass.Suche in Google Scholar
[28] Taylor, S., Todd, P. A. (1995). Understanding information technology usage: A test of competing models. Information Systems Research, 6(2), 144–176.10.1287/isre.6.2.144Suche in Google Scholar
[29] Lee, M.-C. (2009). Factors influencing the adoption of internet banking: An integration of TAM and TPB with perceived risk and perceived benefit. Electronic Commerce Research and Applications, 8(3), 130–141.10.1016/j.elerap.2008.11.006Suche in Google Scholar
[30] Hong, W., Thong, J. Y. L. (2013). Internet privacy concerns: An integrated conceptualization and four empirical studies. MIS Quarterly, 37(1), 275–298.10.25300/MISQ/2013/37.1.12Suche in Google Scholar
[31] Li, Y., Li, X., Cai, J. (2021). How attachment affects user stickiness on live streaming platforms: A socio-technical approach perspective. Journal of Retailing and Consumer Services, 60, 102478.10.1016/j.jretconser.2021.102478Suche in Google Scholar
[32] Qu, Y., Cieślik, A., Fang, S., Qing, Y. (2023). The role of online interaction in user stickiness of social commerce: The shopping value perspective. Digital Business, 3, 100061.10.1016/j.digbus.2023.100061Suche in Google Scholar
[33] Dodds, W. B., Monroe, K. B., Grewal, D. (1991). Effects of price, brand, and store information on buyers’ product evaluations. Journal of Marketing Research, 28(3), 307–319.10.1177/002224379102800305Suche in Google Scholar
[34] Hsu, C.-L., Lin, J. C.-C. (2016). Effect of perceived value and social influences on mobile app stickiness and in-app purchase intention. Technological Forecasting and Social Change, 108, 42–53.10.1016/j.techfore.2016.04.012Suche in Google Scholar
[35] Venkatesh, V., Morris, M. G., Davis, G. B., Davis, F. D. (2003). User acceptance of information technology: Toward a unified view. MIS Quarterly, 27(3), 425–478.10.2307/30036540Suche in Google Scholar
[36] Kim, S., Baek, T. H., Kim, Y.-K., Yoo, K. (2016). Factors affecting stickiness and word of mouth in mobile applications. Journal of Research in Interactive Marketing, 10(3), 162–178.10.1108/JRIM-06-2015-0046Suche in Google Scholar
[37] Lin, J. C.-C. (2007). Online stickiness: Its antecedents and effect on purchasing intention. Behaviour & Information Technology, 26(6), 507–516.10.1080/01449290600740843Suche in Google Scholar
[38] Lin, K.-Y., Lu, H.-P. (2011). Why people use social networking sites: An empirical study integrating network externalities and motivation theory. Computers in Human Behavior, 27(3), 1152–1161.10.1016/j.chb.2010.12.009Suche in Google Scholar
[39] Zhou, X., Rau, P.-L. P., Jie, Z. (2024). Stickiness formation among mobile apps of different social levels: Multigroup analysis using the cognitive–affective–conative framework. Information Technology & People, 37(5), 1208–1228.10.1108/ITP-05-2022-0358Suche in Google Scholar
[40] Kim, B., Son, J. (2009). Out of dedication or constraint? A dual model of post-adoption phenomena and its empirical test in the context of online services. MIS Quarterly, 33(1), 49–70.10.2307/20650278Suche in Google Scholar
[41] Huang, L., Jia, L., Song, J. (2015). Antecedents of user stickiness and loyalty and their effects on users’ group-buying repurchase intention. In 2015 Americas Conference on Information Systems, AMCIS 2015.Suche in Google Scholar
[42] Parasuraman, A. (2000). Technology readiness index (TRI): A multiple-item scale to measure readiness to embrace new technologies. Journal of Service Research, 2(4), 307–320.10.1177/109467050024001Suche in Google Scholar
[43] Dinev, T., Hu, Q. (2007). The centrality of awareness in the formation of user behavioral intention toward protective information technologies. Journal of the Association for Information Systems, 8(7), 386–408.10.17705/1jais.00133Suche in Google Scholar
[44] Hair Jr, J. F., Black, W. C., Babin, B. J. (2010). Multivariate data analysis (7th ed.). Pearson Education, Upper Saddle River, NJ, USA.Suche in Google Scholar
[45] Likert, R. (1932). A technique for the measurement of attitudes. Archives of Psychology, 22(140), 55.Suche in Google Scholar
[46] Krosnick, J. A. (2018). Question and questionnaire design. In The Palgrave handbook of survey research, Springer International Publishing, Cham, pp. 439–455.10.1007/978-3-319-54395-6_53Suche in Google Scholar
[47] Churchill, G. A. (1979). A paradigm for developing better measures of marketing constructs. Journal of Marketing Research, 16(1), 64–73.10.1177/002224377901600110Suche in Google Scholar
[48] Koul, S., Eydgahi, A. (2017). A systematic review of technology adoption frameworks and their applications. Journal of Technology Management & Innovation, 12(4), 106–113.10.4067/S0718-27242017000400011Suche in Google Scholar
[49] Rhodes, R. E., Courneya, K. S. (2005). Threshold assessment of attitude, subjective norm, and perceived behavioral control for predicting exercise intention and behavior. Psychology of Sport and Exercise, 6(3), 349–361.10.1016/j.psychsport.2004.04.002Suche in Google Scholar
[50] Pavlou, P. A., Fygenson, M. (2006). Understanding and predicting electronic commerce adoption: An extension of the theory of planned behavior. MIS Quarterly, 30(1), 115–143.10.2307/25148720Suche in Google Scholar
[51] Arkorful, V. E., Hammond, A., Lugu, B. K., Basiru, I., Sunguh, K. K., Charmaine‐Kwade, P. (2022). Investigating the intention to use technology among medical students: An application of an extended model of the theory of planned behavior. Journal of Public Affairs, 22, e2460.Suche in Google Scholar
[52] Deng, Q., Zheng, Y., Lu, J., Zeng, Z., Liu, W. (2021). What factors predict physicians’ utilization behavior of contrast-enhanced ultrasound? Evidence from the integration of the Theory of Planned Behavior and Technology Acceptance Model using a structural equation modeling approach. BMC Medical Informatics and Decision Making, 21, 173.10.1186/s12911-021-01540-8Suche in Google Scholar PubMed PubMed Central
[53] Rahimi, N., Jetter, A. (2015). Explaining health technology adoption: Past, present, future. In 2015 Portland International Conference on Management of Engineering and Technology (PICMET) (pp. 2465–2495).10.1109/PICMET.2015.7273030Suche in Google Scholar
[54] Schnall, R., Higgins, T., Brown, W., Carballo-Dieguez, A., Bakken, S. (2015). Trust, perceived risk, perceived ease of use, and perceived usefulness as factors related to mHealth technology use. Studies in Health Technology and Informatics, 216, 467.10.3233/978-1-61499-564-7-467Suche in Google Scholar
[55] Nguyen, M., Fujioka, J., Wentlandt, K., Onabajo, N., Wong, I., Bhatia, R. S., et al. (2020). Using the technology acceptance model to explore health provider and administrator perceptions of the usefulness and ease of using technology in palliative care. BMC Palliative Care, 19, 138.10.1186/s12904-020-00644-8Suche in Google Scholar PubMed PubMed Central
[56] Shao, Z., Zhang, L., Chen, K., Zhang, C. (2020). Examining user satisfaction and stickiness in social networking sites from a technology affordance lens: Uncovering the moderating effect of user experience. Industrial Management & Data Systems, 120(7), 1331–1360.10.1108/IMDS-11-2019-0614Suche in Google Scholar
[57] Nandi, S., Nandi, M. L., Khandker, V. (2021). Impact of perceived interactivity and perceived value on mobile app stickiness: An emerging economy perspective. Journal of Consumer Marketing, 38(7), 721–737.10.1108/JCM-02-2020-3661Suche in Google Scholar
[58] Wu, K., Vassileva, J., Noorian, Z., Zhao, Y. (2015). How do you feel when you see a list of prices? The interplay among price dispersion, perceived risk, and initial trust in Chinese C2C market. Journal of Retailing and Consumer Services, 25, 36–46.10.1016/j.jretconser.2015.03.007Suche in Google Scholar
[59] Myreteg, G. (2015). Cost-benefit evaluation of e-health services: Acceptance and value creation are interactive forces. Health Systems, 4(3), 204–211.10.1057/hs.2015.10Suche in Google Scholar
[60] Fox, G., Connolly, R. (2018). Mobile health technology adoption across generations: Narrowing the digital divide. Information Systems Journal, 28(6), 995–1019.10.1111/isj.12179Suche in Google Scholar
[61] Alexandrou, A., Chen, L.-C. (2019). A security risk perception model for the adoption of mobile devices in the healthcare industry. Security Journal, 32(4), 410–434.10.1057/s41284-019-00170-0Suche in Google Scholar
[62] Li, H., Wu, J., Gao, Y., Shi, Y. (2016). Examining individuals’ adoption of healthcare wearable devices: An empirical study from privacy calculus perspective. International Journal of Medical Informatics, 88, 8–17.10.1016/j.ijmedinf.2015.12.010Suche in Google Scholar PubMed
[63] Kijsanayotin, B., Pannarunothai, S., Speedie, S. M. (2009). Factors influencing health information technology adoption in Thailand’s community health centers: Applying the UTAUT model. International Journal of Medical Informatics, 78(6), 404–416.10.1016/j.ijmedinf.2008.12.005Suche in Google Scholar PubMed
[64] Nittas, V., Zecca, C., Kamm, C. P., Kuhle, J., Chan, A., von Wyl, V. (2023). Digital health for chronic disease management: An exploratory method to investigating technology adoption potential. PLoS ONE, 18, e0284477.10.1371/journal.pone.0284477Suche in Google Scholar PubMed PubMed Central
[65] Marston, H. R., Kroll, M., Fink, D., de Rosario, H., Gschwind, Y. J. (2016). Technology use, adoption, and behavior in older adults: Results from the iStoppFalls project. Educational Gerontology, 42(6), 371–387.10.1080/03601277.2015.1125178Suche in Google Scholar
[66] Mackert, M., Mabry-Flynn, A., Champlin, S., Donovan, E. E., Pounders, K. (2016). Health literacy and health information technology adoption: The potential for a new digital divide. Journal of Medical Internet Research, 18, e264.10.2196/jmir.6349Suche in Google Scholar PubMed PubMed Central
[67] Kuek, A., Hakkennes, S. (2020). Healthcare staff digital literacy levels and their attitudes towards information systems. Health Informatics Journal, 26(4), 592–612.10.1177/1460458219839613Suche in Google Scholar PubMed
[68] Verma, B., Tandon, U. (2022). Modelling barriers to wearable technologies in the Indian context: Validating the moderating role of technology literacy. Global Knowledge Management Conference Proceedings, 73(5), 984–1004.10.1108/GKMC-08-2022-0209Suche in Google Scholar
[69] Luo, J., Zhang, K., Huang, Q., Jiang, S., Pan, Y. (2024). From acceptance to dependence: Exploring influences of smart healthcare on continuous use intention of mobile health services among older adults with chronic illnesses in China. Behavioral Sciences, 15(1), 19.10.3390/bs15010019Suche in Google Scholar PubMed PubMed Central
[70] Astuti, S., Gamayuni, R. R., Komalasari, A. (2024). Assessing the use of financial accounting standards for micro, small, and medium entities (SAK EMKM) using the Unified Theory of Acceptance and Use of Technology (UTAUT) method in SOE-assisted MSMEs: Digital literacy as a moderating variable. Proceedings of the 7th International Conference of Economics, Business, and Entrepreneurship (ICEBE 2024), Shah Alam, Selangor, Malaysia, September 4–5, 2024.10.4108/eai.4-9-2024.2353764Suche in Google Scholar
[71] van der Heijden, H. (2004). User acceptance of hedonic information systems. MIS Quarterly, 28(4), 695–704.10.2307/25148660Suche in Google Scholar
[72] Tran, V. D. (2020). The relationship among product risk, perceived satisfaction, and purchase intentions for online shopping. The Journal of Asian Finance, Economics and Business, 7(2), 123–134.10.13106/jafeb.2020.vol7.no6.221Suche in Google Scholar
[73] Ramanathan, V., Sonia, C. (2018). The antecedents of category management towards customer enhanced services and effects on customer satisfaction in pharmaceutical retailing: A study with special reference to medical shops (Drug Stores) at Kanchipuram Town. Journal of Accounting & Marketing, 8(1), 69–89.Suche in Google Scholar
© 2025 the author(s), published by De Gruyter
This work is licensed under the Creative Commons Attribution 4.0 International License.
Artikel in diesem Heft
- Study and restoration of the costume of the HuoLang (Peddler) in the Ming Dynasty of China
- Texture mapping of warp knitted shoe upper based on ARAP parameterization method
- Extraction and characterization of natural fibre from Ethiopian Typha latifolia leaf plant
- The effect of the difference in female body shapes on clothing fitting
- Structure and physical properties of BioPBS melt-blown nonwovens
- Optimized model formulation through product mix scheduling for profit maximization in the apparel industry
- Fabric pattern recognition using image processing and AHP method
- Optimal dimension design of high-temperature superconducting levitation weft insertion guideway
- Color analysis and performance optimization of 3D virtual simulation knitted fabrics
- Analyzing the effects of Covid-19 pandemic on Turkish women workers in clothing sector
- Closed-loop supply chain for recycling of waste clothing: A comparison of two different modes
- Personalized design of clothing pattern based on KE and IPSO-BP neural network
- 3D modeling of transport properties on the surface of a textronic structure produced using a physical vapor deposition process
- Optimization of particle swarm for force uniformity of personalized 3D printed insoles
- Development of auxetic shoulder straps for sport backpacks with improved thermal comfort
- Image recognition method of cashmere and wool based on SVM-RFE selection with three types of features
- Construction and analysis of yarn tension model in the process of electromagnetic weft insertion
- Influence of spacer fabric on functionality of laminates
- Design and development of a fibrous structure for the potential treatment of spinal cord injury using parametric modelling in Rhinoceros 3D®
- The effect of the process conditions and lubricant application on the quality of yarns produced by mechanical recycling of denim-like fabrics
- Textile fabrics abrasion resistance – The instrumental method for end point assessment
- CFD modeling of heat transfer through composites for protective gloves containing aerogel and Parylene C coatings supported by micro-CT and thermography
- Comparative study on the compressive performance of honeycomb structures fabricated by stereo lithography apparatus
- Effect of cyclic fastening–unfastening and interruption of current flowing through a snap fastener electrical connector on its resistance
- NIRS identification of cashmere and wool fibers based on spare representation and improved AdaBoost algorithm
- Biο-based surfactants derived frοm Mesembryanthemum crystallinum and Salsοla vermiculata: Pοtential applicatiοns in textile prοductiοn
- Predicted sewing thread consumption using neural network method based on the physical and structural parameters of knitted fabrics
- Research on user behavior of traditional Chinese medicine therapeutic smart clothing
- Effect of construction parameters on faux fur knitted fabric properties
- The use of innovative sewing machines to produce two prototypes of women’s skirts
- Numerical simulation of upper garment pieces-body under different ease allowances based on the finite element contact model
- The phenomenon of celebrity fashion Businesses and Their impact on mainstream fashion
- Marketing traditional textile dyeing in China: A dual-method approach of tie-dye using grounded theory and the Kano model
- Contamination of firefighter protective clothing by phthalates
- Sustainability and fast fashion: Understanding Turkish generation Z for developing strategy
- Digital tax systems and innovation in textile manufacturing
- Applying Ant Colony Algorithm for transport optimization in textile industry supply chain
- Innovative elastomeric yarns obtained from poly(ether-ester) staple fiber and its blends with other fibers by ring and compact spinning: Fabrication and mechanical properties
- Design and 3D simulation of open topping-on structured crochet fabric