Predicted sewing thread consumption using neural network method based on the physical and structural parameters of knitted fabrics
-
Faouzi Khedher
 ,
Thouraya Hamdi
,
Thouraya Hamdi

Abstract
This article presents an experimental study on the influence of various parameters on sewing thread consumption. Four knitted samples, featuring different structures and thicknesses, were tested by sewing two- and three-layer using chain stitch type 401. This work allows for examining the effects of the sewing machine foot pressure height, surface mass, fabric thickness, and number of layers sewn on thread consumption. It was concluded that lower foot pressure results in a significant increase in the amount of thread used. In addition, accurately predicting thread consumption makes it easier to control the stock level of inventories, which is important for effective supply chain management. With optimized inventory, companies will save on storage expenses and minimize the downtime between operations, resulting in increased productivity. The combined application of neural nets and statistical techniques increases the accuracy of forecasts, which is essential for manufacturers in a highly competitive environment.
1 Introduction
In the textile industry, characterized by its competitiveness and dynamism, knitted fabrics play an essential role due to their elasticity and comfort properties. These materials, widely used in the production of clothing and sports articles, require precise resource management, particularly regarding sewing thread consumption. An incorrect estimation of thread needs can lead to the accumulation of unusable surplus, such as leftover spools under sewing machines, resulting in significant financial losses for companies. This issue originates from the complexity of the parameters influencing thread consumption, including fabric weight, thickness, number of layers (NL), and foot pressure height (FPH). Although several studies have addressed these factors, the majority have focused on woven textiles, leaving a gap concerning knitted fabrics. However, knitted fabrics present structural particularities that generate specific challenges in managing sewing thread consumption. In the literature [1], various methods have been developed to estimate thread consumption, ranging from geometric approaches to statistical and mathematical models [2,3,4,5]. For example, Jaouadi et al. developed new formulas that consider thread tension, achieving more accurate results using neural networks (with very close to 98 and 95% accuracy) [6]. Rasheed et al. applied geometric analysis and discovered that parameters such as material thickness and stitch density particularly influenced thread consumption [7]. Jaouachi and Khedher used fuzzy logic and regression to estimate consumption in denim pants [8], while Midha et al. applied a regression model with 95% accuracy for stitch class 401 [9]. Khan et al. also utilized regression, highlighting that stitch density was a key factor 18 [10].
The quality of sewability of knitted and woven fabrics is a complex area influenced by fiber type, yarn, fabric structure, sewing thread, and machine parameters. Careful selection and evaluation of these elements are essential to minimize needle cuts and other sewing damages, enabling defect-free garment production through optimized fabric, thread, and machine design [11].
Finally, Jaouachi et al. compared different methods, concluding that image analysis was the most accurate, followed by geometric modeling [12].
The amount of thread used in sewn products depends on multiple factors, including stitch type and seam type, material thickness, NL, and stitch density. The various style preferences do not maintain consistent factors. Thread consumption remains unpredictable for all sewn product categories, including jeans, shirts, jackets, lingerie, and footwear. The calculated thread consumption requires an additional 10–15% waste factor for the total thread usage [13]. The manufacturing facility experiences thread wastage because of its operating environment, which includes machine operation, thread failures, and equipment maintenance needs [14].
Researchers, together with industrial experts and manufacturers, develop their models by assuming that the seam line remains constant while they study fabric and sewing thread deformability and material compressibility, and shapes during and after seaming [15]. Additionally, to minimize errors between theoretical and actual thread consumption, factors such as stitch density, assembly layers, and fabric thickness (FT) affect thread consumption in lockstitch (301) and chainstitch (401) seams, comparing experimental, regression, and geometrical models to identify the most accurate prediction method [16]. Although the compressibility of denim fabrics is recognized as an influential factor in sewing thread consumption, it has not been explicitly emphasized.
However, these methods remain limited when it comes to simultaneously accounting for the specificities of knitted fabrics and the multitude of influencing parameters in real production conditions. This study, therefore, adopts an experimental approach aimed at exploring sewing thread consumption for garments made from knitted fabrics while considering physical and structural parameters. By employing a factorial design, this research allows us to identify influential factors and systematically evaluate their combined impact. The primary objective of this work is to provide a solid scientific foundation for optimizing sewing thread usage, reducing waste, and improving inventory management strategies in the textile sector. This research will provide valuable insights about production parameter interactions to establish an evaluation of thread consumption behavior in relation to fabric compressibility when using chain stitch type 401. The study presents an established method to measure thread consumption based on compressed thickness under known pressure conditions that can be continuously increased. The changes in thickness and density that occur when pressure increases or decreases will impact the sewing thread consumption values for knitted fabric.
2 Materials and methods
This study used four knitted samples, characterized by their specific properties, to create an experimental database. To measure the pressure applied by the sewing machine foot presser, samples with two and three layers were sewn using a Siruba Spreader machine equipped with a Flexi Force® pressure sensor. Thread consumption was measured by unpicking the samples after sewing, and each test was repeated five times to obtain an accurate average value. The tests were conducted using chain stitch type 401, commonly employed in garment manufacturing, and the results allowed for the determination of the impact of FPH on thread consumption (Table 1).
Characteristics of knitted fabrics used
| No. | Plain structure | Jauge | Blend | Thickness (mm) | Mass (g/m2) | Structure |
|---|---|---|---|---|---|---|
| 1 | Tricot jersey | E24 | 100% viscose | 0.48 | 103.1 |
 |
| 2 | Tricot jersey | E20 | 100% cotton | 0.60 | 151.8 |
 |
| 3 | Interlook | E20 | 100% cotton | 0.91 | 240.2 |
 |
| 4 | Rib1x1 | E20 | 95% cotton and 5% elasthane | 1.19 | 304.4 |
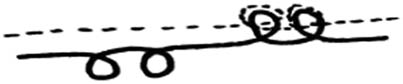 |
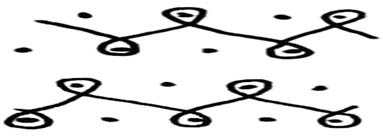
This study selected and used four knitted samples with their defined characteristics. These samples were chosen to create an experimental database of knitted fabrics. To determine the pressure values applied by the pressure device, two-layer, and three-layer knits were sewn using a Siruba Spreader sewing machine (Figure 1), a Flexi Force® pressure sensor device (Figure 2), and an electric millimeter (Figure 3) was used. The manufacturing process of knits employs chain stitch type 401 in the assembly line for garment production. The average thread consumption value measured in centimeters represents the total thread length used during assembly seam sewing. The thread consumption measurement took place after sewing all samples through experimental disassembly procedures. Our experimental design included five repetitions for each tested combination to determine a representative average thread consumption value. The research included eight different heights, which produced results that directly became pressure measurements. The clothing industry requires chain stitch type 401 for assembling knitted fabric layers. The FPH variation achieved through the foot presser screw (Figure 4) converts knit resistance values into pressure rates. All tests occurred according to established textile testing protocols.
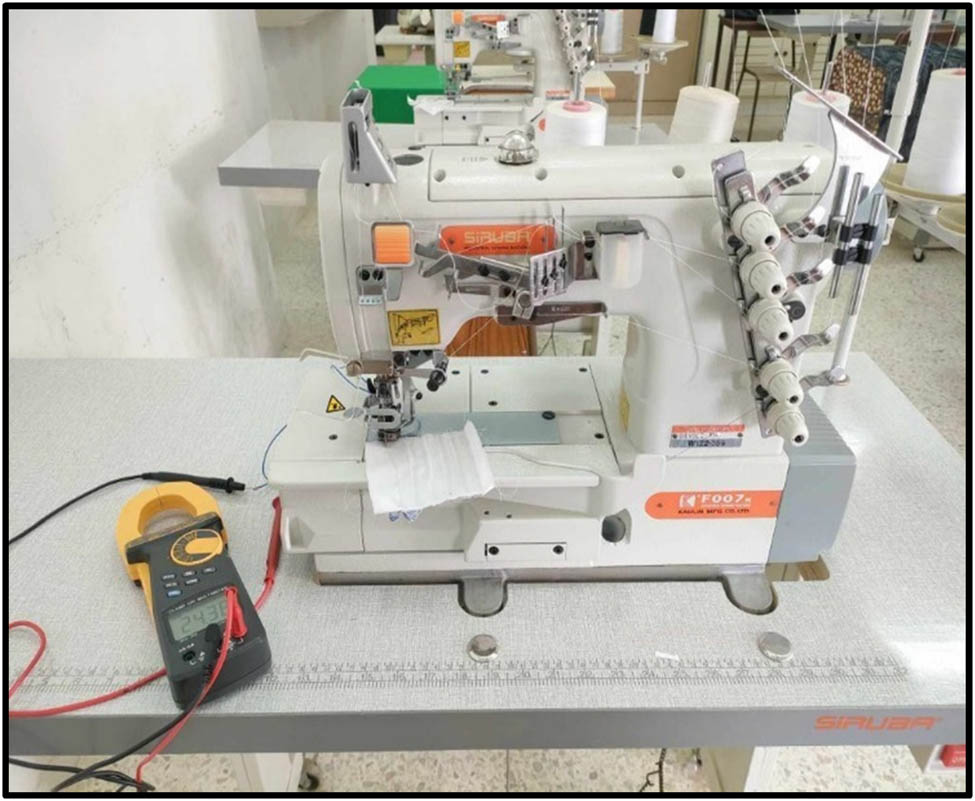
Measurement of resistance as a function of presser foot height.
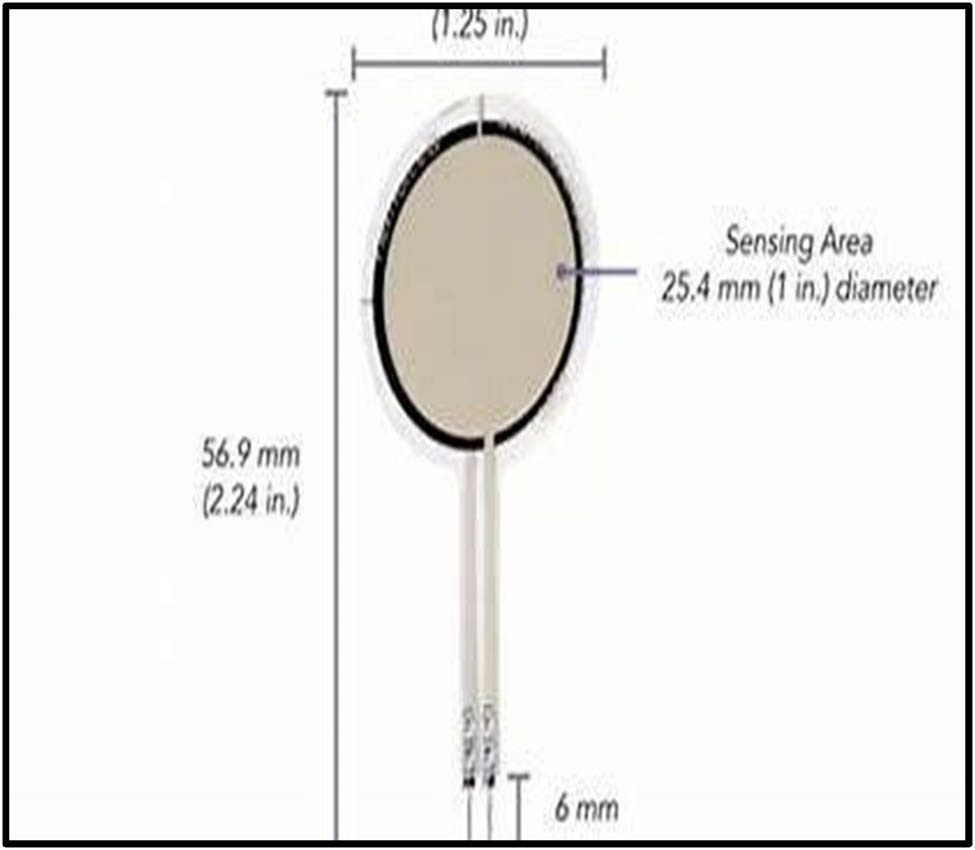
Flexi Force® pressure sensor.

Electric millimeter.
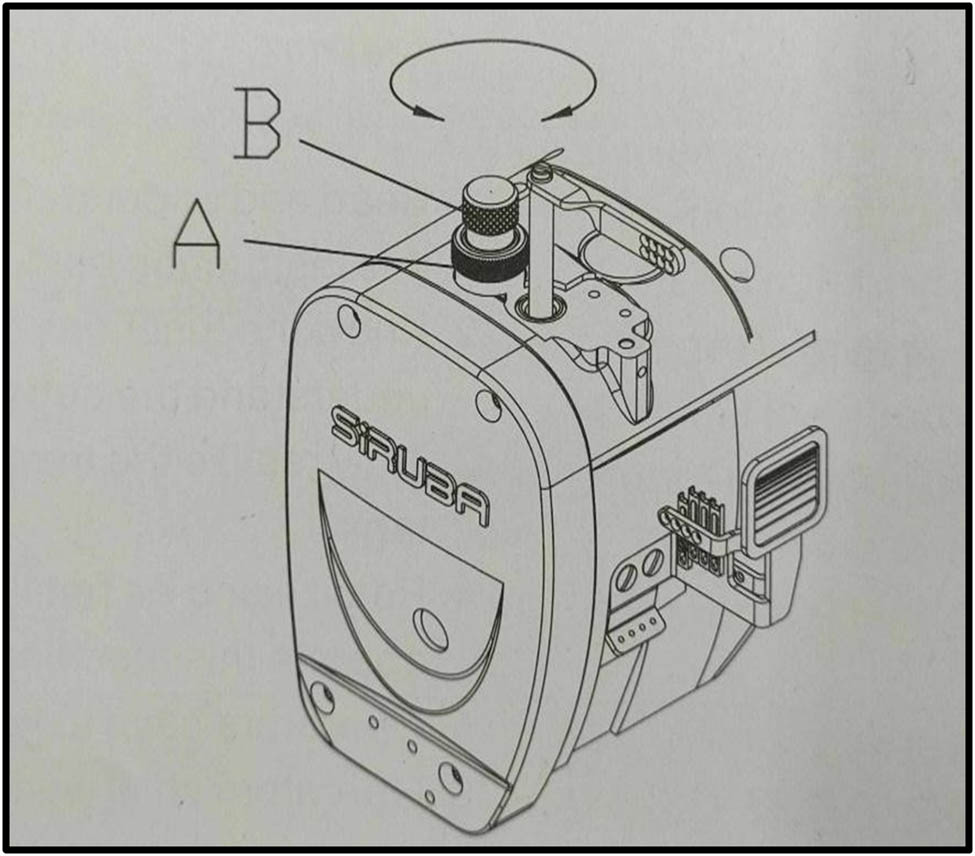
Foot presser screw.
As part of our study, we undertook a meticulous sewing process by creating assembly seams of 10 cm. Each sample was sewn with two and three layers using a chain stitch machine type 401 SIRUBA. This allowed us to analyze the differences in material behavior based on their thickness and structure. The threads used for the needle and the looper are 100% polyester, twisted Z with Ne = 50/3 (English number), and the stitch density is fixed at 4 stitches/cm. This sewing was performed using eight different FPHs (3.7, 3.8, 3.9, 4.0, 4.1, 4.2, 4.3, and 4.4 mm) to ensure reliable and reproducible results. It is important to note that if the height exceeds 4.4 mm, sewing is not possible, which limits adjustments to optimal values to ensure good sewing quality. Furthermore, for each height setting, we repeated the operation five times (10 cm × 5) to accumulate sufficient data for robust statistical analysis. We sewed these samples while maintaining the same machine parameters (needle type, number of stitches per centimeter, and thread tension) and using the same needle and looper thread. This systematic approach was adopted not only to ensure the accuracy of needle and looper thread calculations but also to adhere to established standards in the field of textile sewing.
The foot pressure was properly calibrated before testing to reduce measurement errors. The FPH values need to be converted to generate compression values. The results of resistance value evolution for the studied samples appear in Figure 5 regarding FPH.
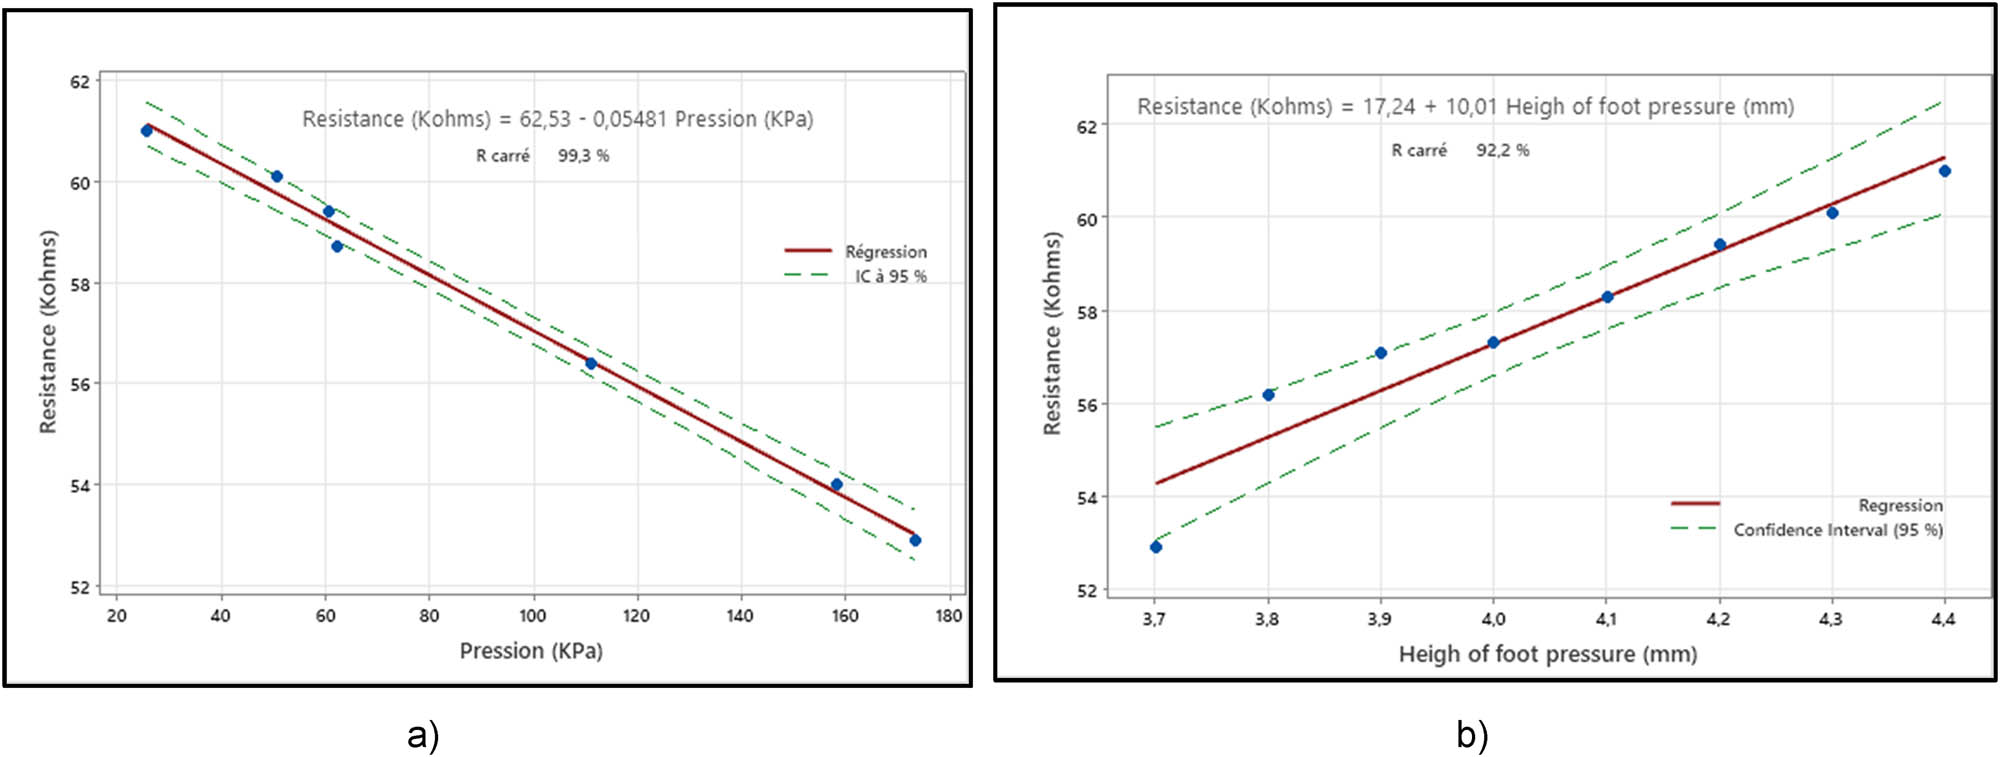
Evolution of resistance values of studied samples as a function of (a) pressure and (b) height of foot pressure.
The foot presser exerts a compressive force on the knitted fabric to be sewn. This force is measured in KPa and is inversely proportional to the height of the foot presser. This compressive force is confronted by an internal resistance of the fabric. So, Figure 5 illustrates that if the pressure force exerted by the foot presser increases (the height of the foot presser decreases), the knitted fabric will be compressed, and its internal resistance decreases. In the opposite case, where the pressure of the foot presser decreases (the height of the foot presser decreases), the resistance of the knitted fabric increases, and the knitted fabric takes on its entire volume.
The average sewing thread consumption value, expressed in centimeters, is the quantity of thread sewn in two and three layers for a 10 cm length, tested at eight different heights. After sewing all the samples, the total amount of thread consumed was calculated. We measured the total thread consumption based on the pressure of the foot presser by adding the consumption of the needle thread and the looper thread. Our procedure remains unchanged: we conduct several tests with a coefficient of variation (CV%) below 5%, calculate the average for both types of consumption (needle thread and looper thread), and then sum these averages to obtain the total consumption.
2.1 Multiple linear regression techniques
Minitab 20 software was used to analyze the individual and interactive effects of key parameters in our study, including FPH, surface mass (SM), FT, and NL. To ensure a rigorous analysis, we implemented a complete factorial experimental design to evaluate all possible input parameter combinations objectively. The results allowed us to identify significant interactions between the studied variables and model their impacts on the measured responses. Table 2 presents the studied input parameters and their levels.
Experimental design of input parameter levels
| Level | FPH (mm) | SM (g/m2) | FT (mm) | NL |
|---|---|---|---|---|
| 1 | 3.70 | 103.10 | 0.48 | 2.00 |
| 2 | 3.80 | 151.80 | 0.60 | 3.00 |
| 3 | 3.90 | 240.20 | 0.91 | — |
| 4 | 4.00 | 304.40 | 1.19 | — |
| 5 | 4.10 | — | — | — |
| 6 | 4.20 | — | — | — |
| 7 | 4.30 | — | — | — |
| 8 | 4.40 | — | — | — |
2.2 Neural network techniques: An overview
The neural network is a specialized computer model that derives inspiration from the human brain and can work on multiple learning problems, such as classification, regression, clustering, and reinforcement learning. It consists of multiple groups of interrelated nodes that bear a resemblance to neurons. These interconnected components work collectively to process the input data and extract certain features from the data. The architecture of a neural network is composed of layers of these nodes, which perform a series of mathematical operations on the data fed to it. So many researchers have recently been using this type of application in the textile field to optimize phenomena that statistical applications cannot rigorously optimize [17,18,19].
2.2.1 Components of neural networks
2.2.1.1 Nodes (neurons)
The primary unit of a neural network. Every neuron gets an input signal from the previous layer, and it processes this information and produces an output signal.
It is composed of weights, an activation function, and a bias. The weights capture the relative magnitude of the corresponding inputs; the bias modifies the output.
2.2.1.2 Layers
Input layer: The first layer receives a raw input to the network. A neuron in this layer corresponds to a component of the input data.
Hidden layers: These are the layers between the input and output layers. The purpose of these hidden layers is to modify the input for the other layers and ensure the output layer utilizes the data. In most cases, these neural networks contain more than one hidden layer so that complex interrelationships among the components of the data can be learned.
Output layer: For the neural network, this layer stores the ultimate output of the neural network’s estimation or classification.
2.2.1.3 Weights and biases
Weights are a set of parameters that govern the strength of the linkage between two connected neurons. They are updated throughout the training phase to reduce prediction error. Biases are supplementary parameters added to the primary ones that assist in shifting the function of activation. They permit the model to be more precise when matching the data.
2.2.1.4 Activation functions
The model to learn complicated patterns is achieved due to the introduction of nonlinearity through “Activation functions.”
2.2.2 Training a neural network
For your neural network to be effective, you need to teach it by following the steps below.
2.2.2.1 Forward propagation
The provided data move through the network, beginning with the input layer, to the hidden layers, and finishing with the output layer. Each neuron’s output is determined by the weighted summation of the neuron’s outputs. In other words, output from the neuron is calculated from the weighted sum of inputs, bias is added, and then an activation function is passed.
2.2.2.2 Loss calculation
The loss function defines the deviations in the estimations selected by the user and those that exist in reality. Loss refers to the deficiency in performance compared to the expected result. One can consider many additional losses: prediction losses, summations of values, and real values. Given the action that invokes this loss, we can describe it thoroughly.
2.2.2.3 Backpropagation
The adjustments of weights and biases given loss are then calculated. This is done by estimating how much loss changes due to a change in each weight (using the chain rule) and then minimizing the loss by moving the weights in the opposite direction of that loss.
2.2.2.4 Iteration
Both the processes of forward and backward propagation undergo repeated iterations (epochs) in which weights and biases are modified at each iteration, thus progressively refining the performance of the training set.
3 Results and discussion
In the context of this research, 256 different sewing combinations were designed to evaluate the impact of foot presser pressure, knit thickness, NL, and SM on consumption behavior. Five tests were repeated for each combination to ensure reliability.
3.1 Regression modeling the sewing thread consumption
A general full factorial design was implemented to study the effect of FPH, FT, SM, and NL on sewing thread consumption. The treatment plan was an 8 × 4 × 4 × 2 factorial design (according to the studied parameters listed in Table 2). Given that the studied factors are continuous variables, it is crucial to represent the model as a linear regression that includes all input parameters and their interactions. To highlight the impact of changes in input parameters, the variation in sewing thread consumption (
3.1.1 Analysis of the main effects of sewing thread consumption
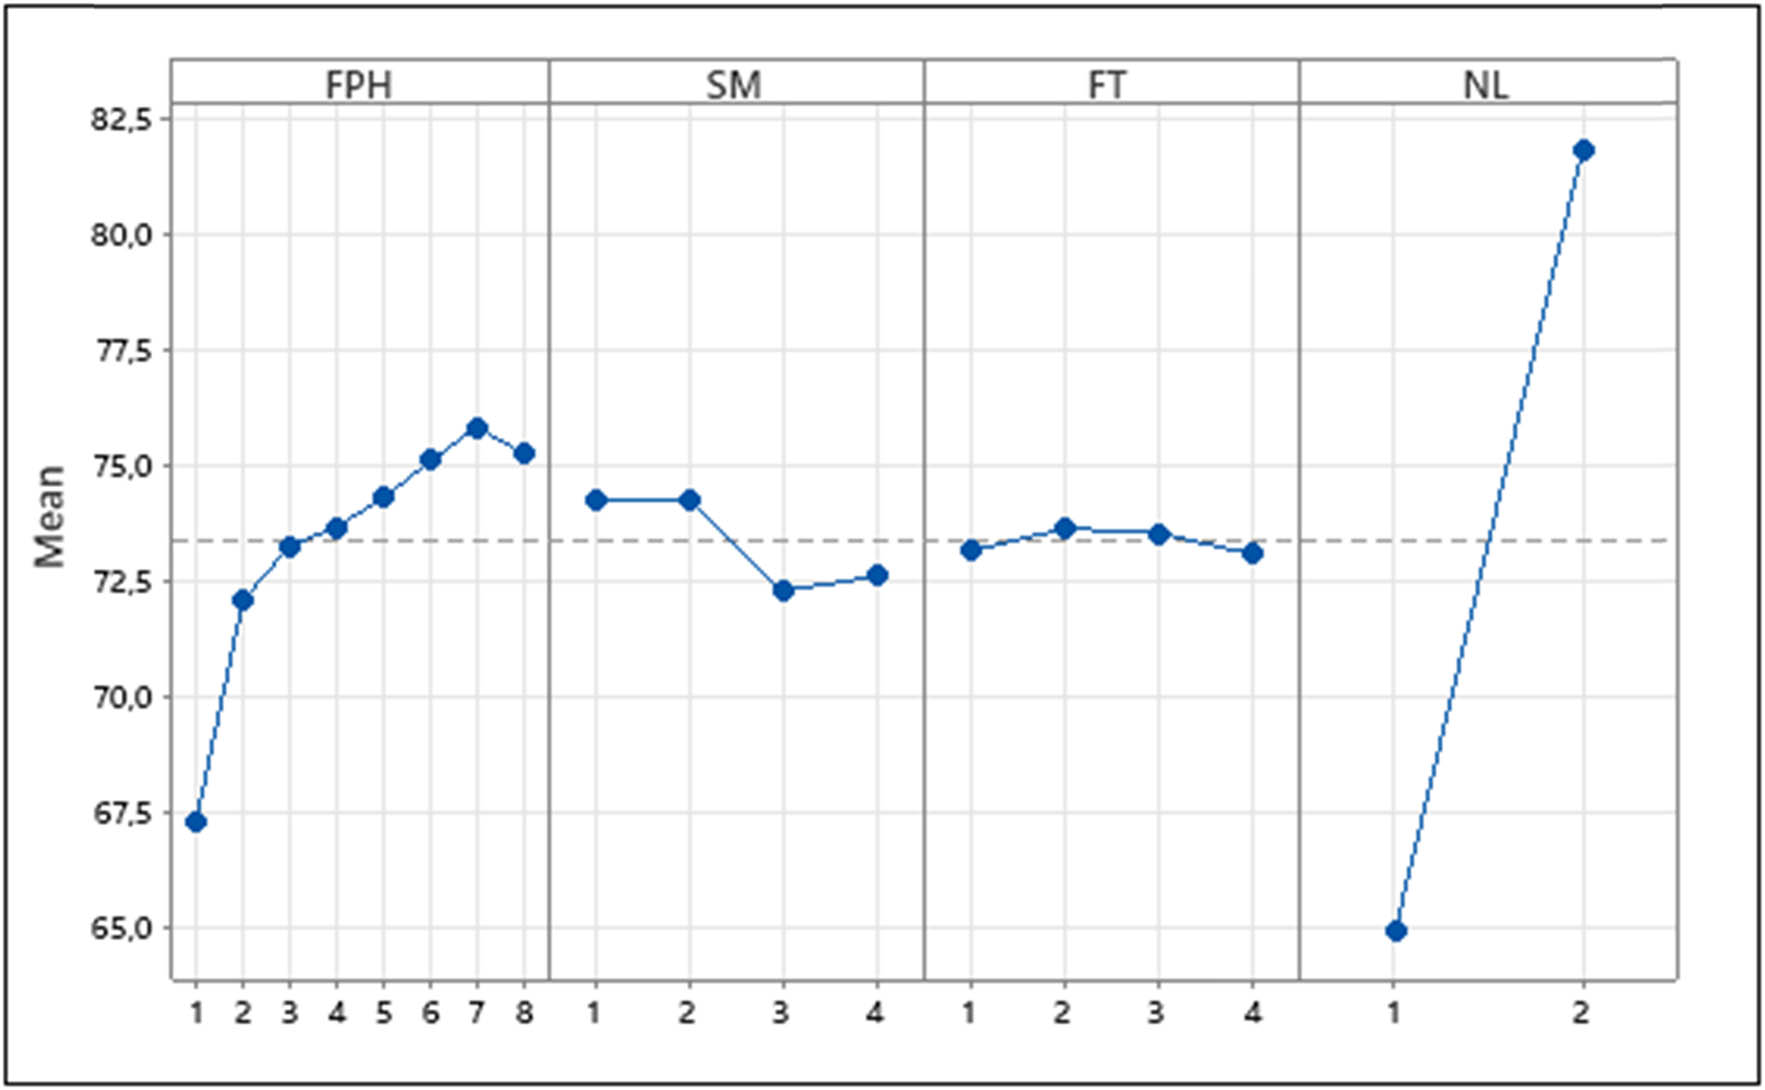
Figure 6 illustrates the main effect plot, which presents the influence of each input parameter on the sewing thread consumption behavior of knitted fabrics.
Effect evolutions of all studied input parameters on sewing thread consumption.
From this figure, it can be concluded that the change in each input parameter influences the sewing thread consumption. Indeed, by increasing the FPH, the variation in the sewing thread consumption is notable and increases from 67.3 to 75.8 cm. A variation of 0.7 cm in FPH causes an important increase in consumed sewing thread for knitted fabrics using chain stitch type 401 (
Relative to Figure 6, when the fabric density (SM) increases from a light knit (103.1 g/m2) to a medium knit (304.4 g/m2) the consumed sewing thread goes from 74.2 to 72.3 cm (
The SM is an important parameter in the study of sewing thread consumption, especially in the assembly of fabrics and, specifically, knits. The settings of the sewing machine (tension, needle size, etc.) are made and then optimized according to this parameter, so its influence is felt in several production indicators, such as yield and manufacturing quality. The consumption of sewing thread increases with the increase in this parameter, but this increase remains minimal when compared with other parameters, such as the NL and the pressure of the sewing machine foot presser.
In the same direction, when the FT increases by 0.71 mm, the consumed sewing thread goes from 73.08 to 73.64 cm (
The NL in the assembly of the knits is a very important parameter in the consumption of thread sewing. when it increases by a single layer, the consumed sewing thread goes from 64.9 to 81.8 cm (
The first factor that affects knitted fabrics is the thickness, regardless of their plain structures and different stitch densities and spacings. The results of Begum and Subramanian are understandable as they prove that sewing thread consumption is higher when using thicker fabrics [21]. The results are obvious as thicker fabrics display lower compressional resilience and vice versa, which, in turn, causes a high amount of sewing thread.
3.1.2 Analysis of interactions of sewing thread consumption
Figure 7 shows the interaction plots of the input parameters. FPH has interactions with the NL and the FT. The variation in the three factors together influences the mean consumption value since in many thickness values and changing the NL, the variation in FPH is significant (an overlap). The knitted fabrics are compressible in terms of thickness, which explains the effect of these two parameters together on the sewing thread consumption
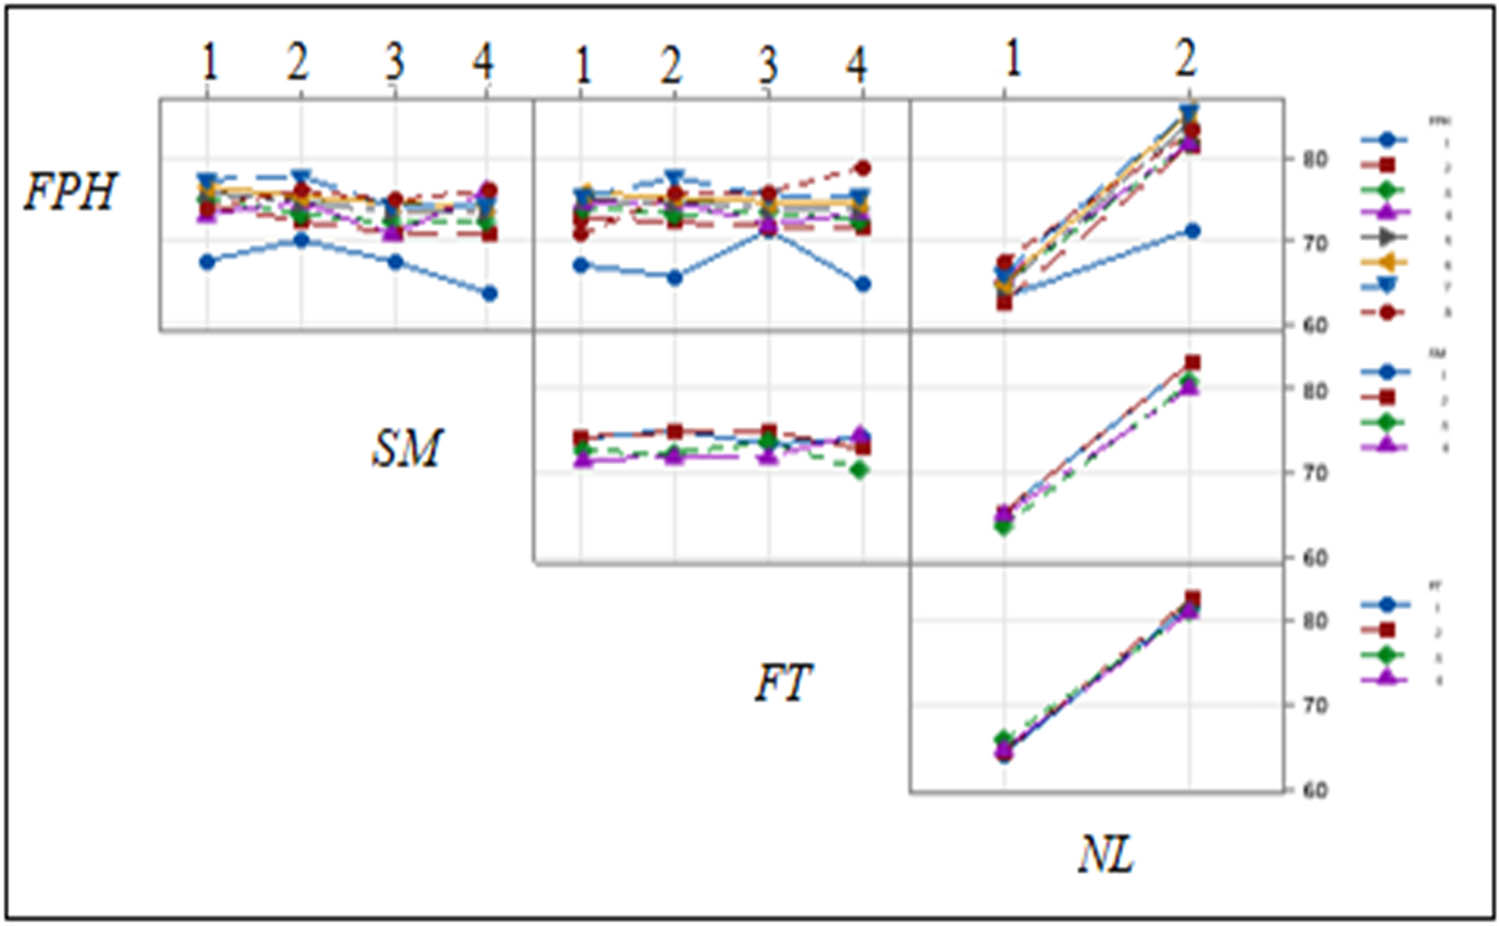
Interaction plots of the investigated input parameters.
3.1.3 Analysis of variance (ANOVA) in predicting thread consumption
To judge if the parameters’ effect and their interactions with the measured answer (
If P-value <1%, the parameter is highly significant;
If 1% ≤ P-value ≤5%, the parameter is significant;
If P-value >5%, the parameter is not significant.
Table 3 reveals the P-value given directly by the Minitab software.
ANOVA (without interactions between factors)
| Source | DF | Adj SS | Adj MS | F-Value | P-Value |
|---|---|---|---|---|---|
| Regression | 4 | 19661.0 | 4915.2 | 188.62 | 0.000 |
| FPH | 1 | 1233.9 | 1233.9 | 47.35 | 0.000 |
| SM | 1 | 151.2 | 151.2 | 5.80 | 0.017 |
| FT | 1 | 0.3 | 0.3 | 0.01 | 0.919 |
| NL | 1 | 18275.7 | 18275.7 | 701.31 | 0.000 |
|
|
251 | 6540.9 | 26.1 | — | — |
| Total | 255 | 26201.9 | — | — | — |
The ANOVA and regression analysis presented in Table 3 reveal several key insights. The source of variation is divided into regression, representing the effects of independent variables (FPH, SM, FT, and NL) on the dependent variable (actual consumption), and error, which captures the unexplained variation. The regression model has 4 degrees of freedom (DF), while the error accounts for 251 DF, leading to 255 DF. The adjusted sum of squares for regression is 19,661, indicating the total variance explained by the model, whereas the error sum of squares is 6540.9, reflecting the variance not explained. The mean square is calculated by dividing the sum of squares by the respective DF, and the overall F-value of 188.62 is significant (p-value = 0.000), suggesting that at least one independent variable significantly affects the dependent variable. Specifically, the factor “Foot pressure height (FPH)” shows an F-value of 47.35 and a P-value of 0.000, indicating a significant effect on actual consumption. Similarly, “Number of layers (NL)” has an F-value of 700.31 and a p-value of 0.000, while “Surface Mass” has an F-value of 5.80 and a p-value of 0.017, demonstrating significant impacts. In contrast, the “fabric thickness (FT)” factor presents an F-value of 0.01 and a P-value of 0.919, indicating that it does not significantly affect actual consumption.
3.1.3.1 Normal probability plots
The normal probability plot is a graphical technique for assessing whether or not a dataset is approximately normally distributed. The normal probability plot of residual values was dressed and reported in Figure 8.
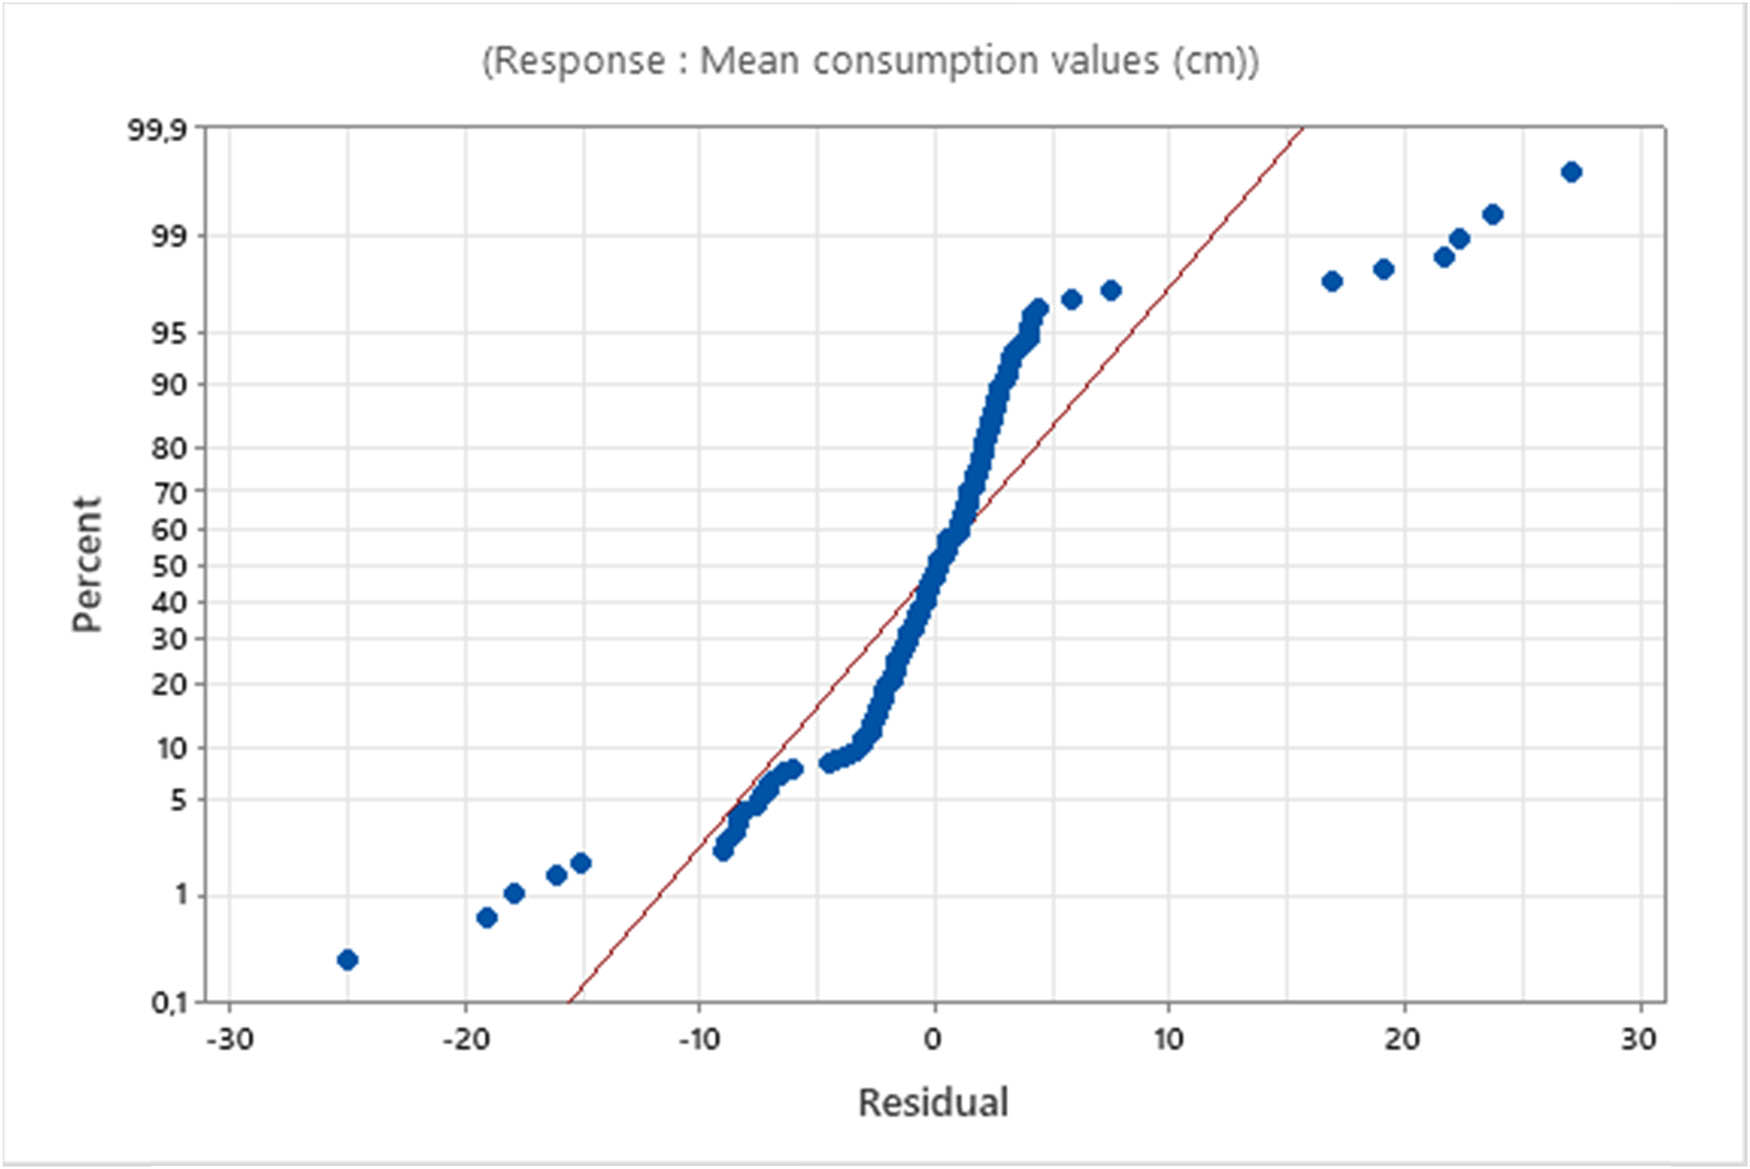
Normal probability plot of residuals for mean consumption values.
From this figure, it can be seen that the experimental points follow a straight line, suggesting normal distribution of the data. The selected model adequately described the observed data, explaining approximately 87.4% of the variability of sewing thread consumption.
The R 2 value of 75.04% suggests that the independent variables can explain approximately 75.04% of the variability in actual consumption. The adjusted R 2 of 74.64% accounts for the number of predictors in the model, while the predicted R 2 of 73.88% reflects the model’s predictive capability.
The sewing thread consumption (
3.1.4 Incorporating factor interactions in multiple linear regression models
The ANOVA (Table 4) summarizes the results of an ANOVA for a multiple linear regression model that includes factor interactions. It outlines various sources of variation, including the overall regression model, individual factors (FPH, FT, SM, NL), and their interactions. The DF indicate the number of independent values that can vary, with the regression having 10 DF and the error term 245. The F-value tests the null hypothesis that the means are equal; higher values suggest significant relationships, particularly for FPH (P-value = 0.000) and NL (P-value = 0.000). The interaction between the FPH and NL has a significant effect (P-value = 0.002). In contrast, all other interactions show no considerable contribution. Overall, the regression model explains a substantial variation in the response variable, aiding in identifying important predictors for future research and model refinement.
ANOVA (including interactions between factors)
| Source | DF | Adj SS | Adj MS | F-value | P-value |
|---|---|---|---|---|---|
| Regression | 10 | 20161.6 | 2016.16 | 81.78 | 0.000 |
| FPH | 1 | 237.9 | 237.9 | 3.21 | 0.000 |
| SM | 1 | 70.8 | 70.8 | 2.87 | 0.023 |
| FT | 1 | 11.1 | 11.06 | 0.45 | 0.504 |
| NL | 1 | 1253.5 | 1253.47 | 50.84 | 0.000 |
| FPH × SM | 1 | 34.5 | 34.47 | 1.40 | 0.238 |
| FPH × FT | 1 | 93.3 | 93.30 | 3.78 | 0.053 |
| FPH × NL | 1 | 233.1 | 233.08 | 9.45 | 0.002 |
| SM × FT | 1 | 41.5 | 41.53 | 1.68 | 0.196 |
| SM × NL | 1 | 56.2 | 56.20 | 2.28 | 0.132 |
| FT × NL | 1 | 42.1 | 42.05 | 1.71 | 0.193 |
|
|
245 | 6040.2 | 24.65 | ||
| Total | 255 | 26201.9 |
The R 2 value of 76.95% suggests that the independent variables can explain approximately 76.95% of the variability in actual consumption. The adjusted R 2 of 76.01% accounts for the number of predictors in the model, while the predicted R 2 of 74.09% reflects the model’s predictive capability.
The improvement in R 2 is minimal and represents only an increase of about 2%. This improvement remains unconvincing, hence another more rigorous modeling method is needed that can give results very close to the experimental results.
However, there remains room for improvement in the consumption prediction model. We will explore artificial intelligence methods to enhance their accuracy, mainly focusing on testing neural networks in Section 3.2.
3.2 Analysis of neural network performance and training dynamics
Figure 9 depicts a neural model with a unique structure. Its architecture has an input layer of four neurons that capture the first data element. The network has a hidden layer with ten neurons having their own weights (W), biases (b), and a nonlinear activation function. Finally, the architecture finishes with one neuron output layer, which uses the weights, biases, and activation function to yield the model’s output.
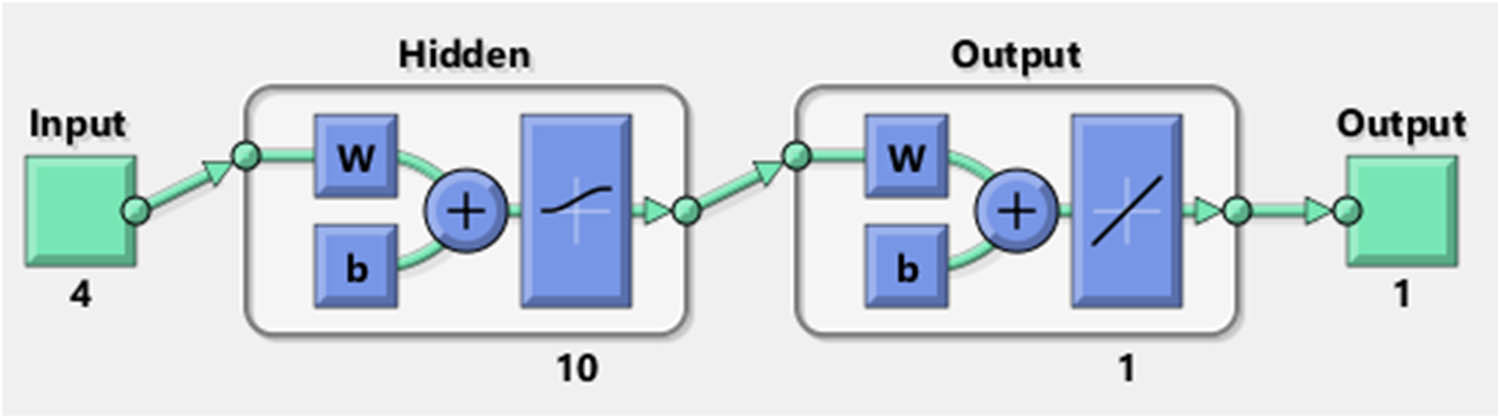
Neural Network architecture.
This diagram depicts the structure of a feedforward neural network with custom-defined activation functions. The network consists of a singular hidden layer of ten neurons, which is optimized by a Bayesian regularization training function. A nonlinearity is introduced by a hidden layer with a logistic sigmoid (logsig) activation, and the output layer captures the nonlinearities with a linear (purelin) activation function. Furthermore, the training settings are designed so that up to 1,000 epochs can be run with a performance target of 1 × 10⁻⁵ for acceptable estimate accuracy.
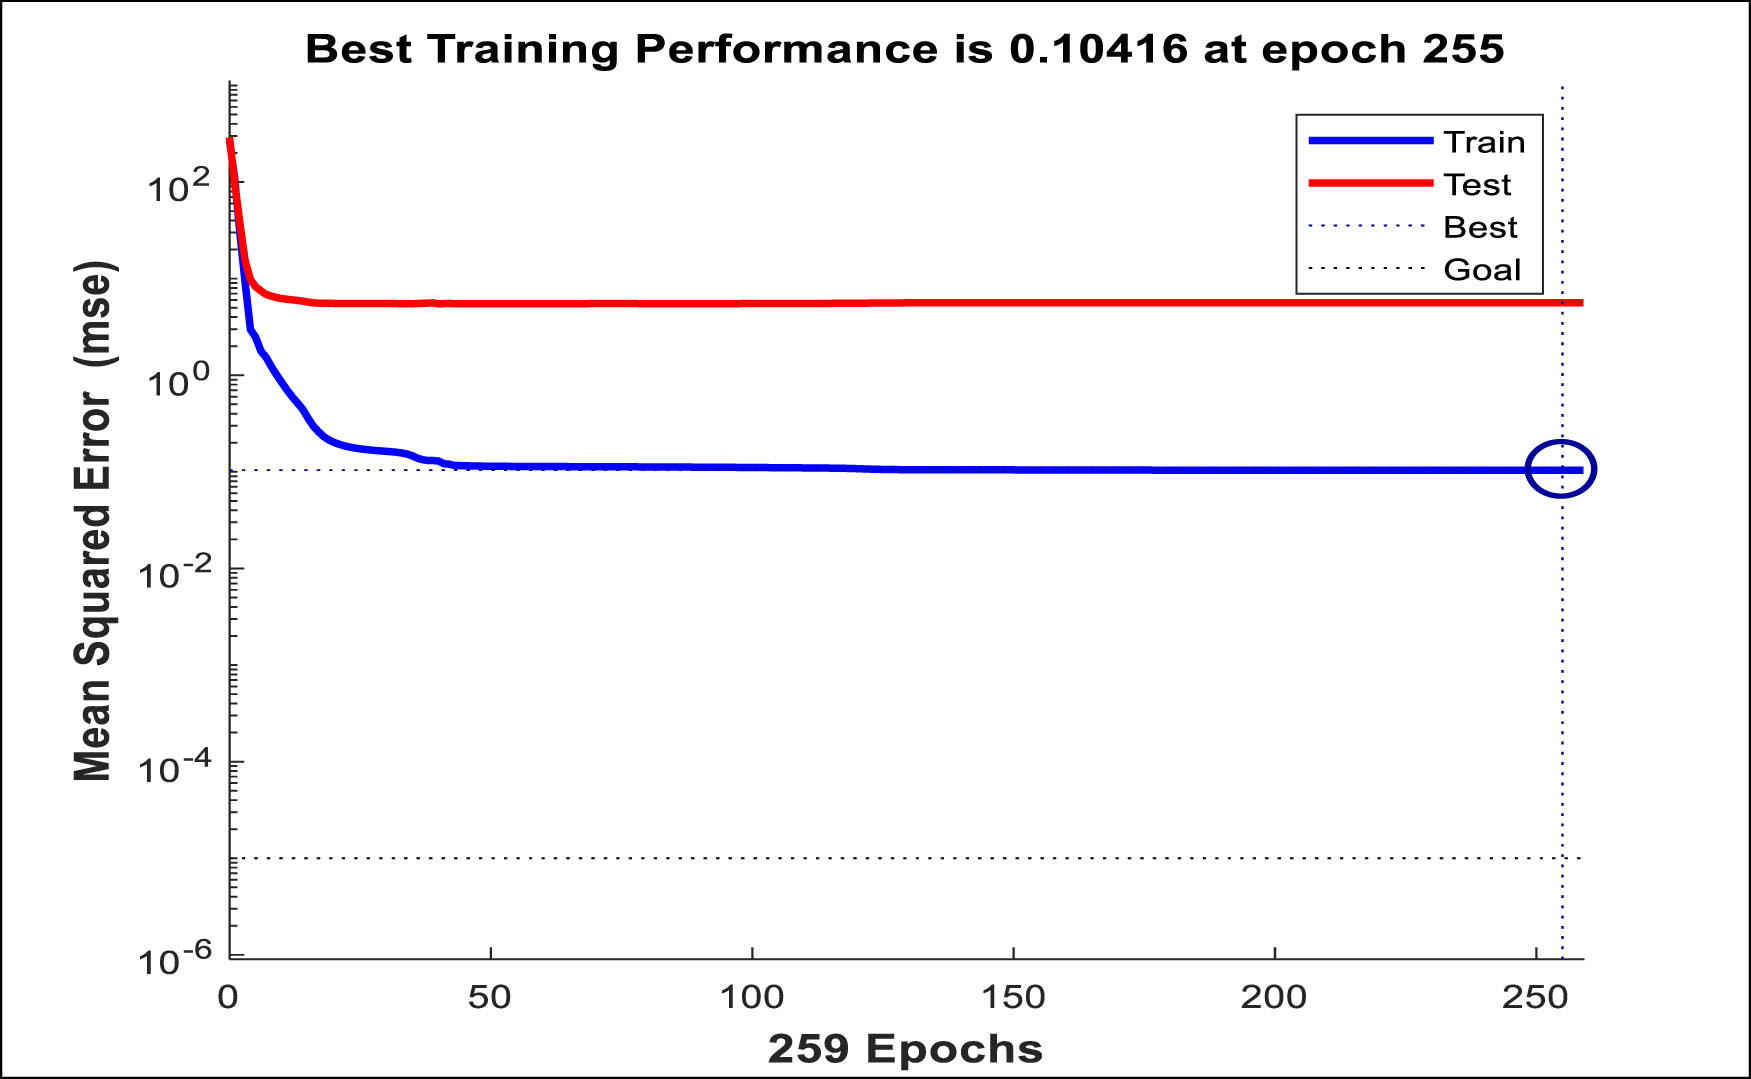
Figure 10 shows the training and testing performance of a machine learning model by monitoring the mean squared error (
Evaluation of the model performance metrics from the model’s evaluation outcomes, shown in Figures 11 and 12, verifies its dependability and generalization capabilities. The predictive power of the model is greatly enhanced by the high value of the correlation coefficient and R
2
parameters and the impressive accuracy of the model, given that the test data are further corroborated by the low measures of
Overall performance metrics.
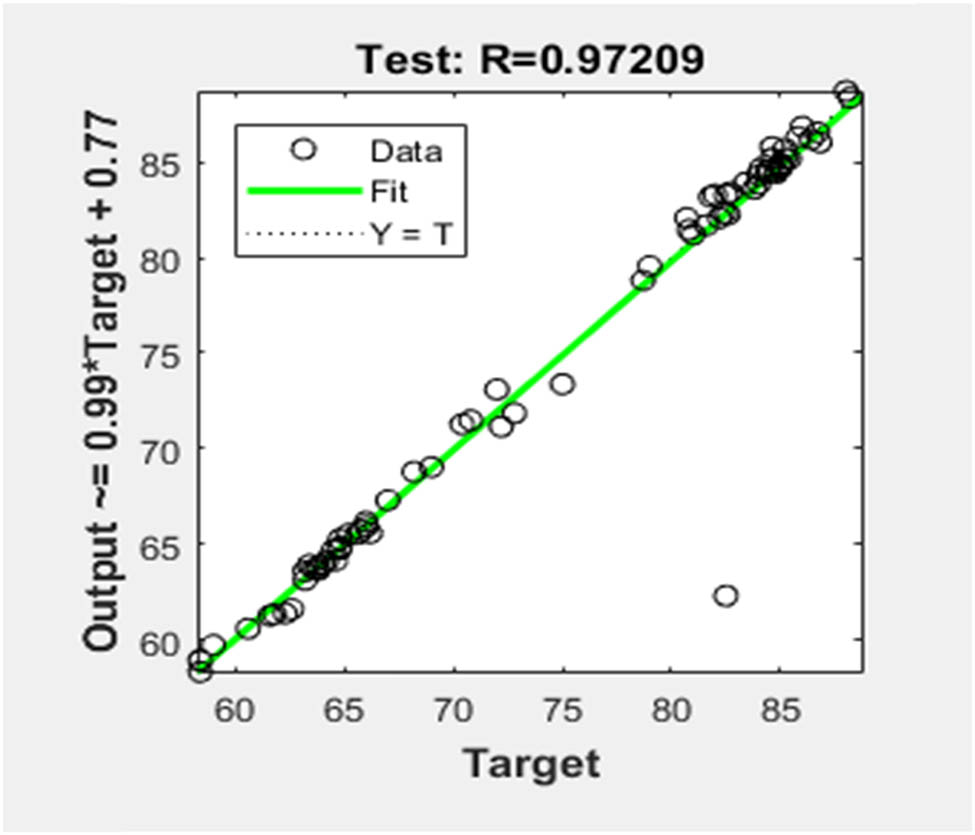
Test data performance metrics.
Table 5 shows two metrics related to the performance of a model, which is compared against a set and evaluated for its overall performance, along with its performance in the test data. Estimated prediction errors captured by
Statistical results
| Overall performance metrics | Test data performance metrics | |
|---|---|---|
|
|
1.3293 | 2.3733 |
|
|
0.3802 | 0.6991 |
| Correlation coefficient (R) | 0.9912 | 0.9721 |
| R-squared (R 2) | 0.9825 | 0.9449 |
| Adjusted R-squared | 0.9822 | 0.9419 |
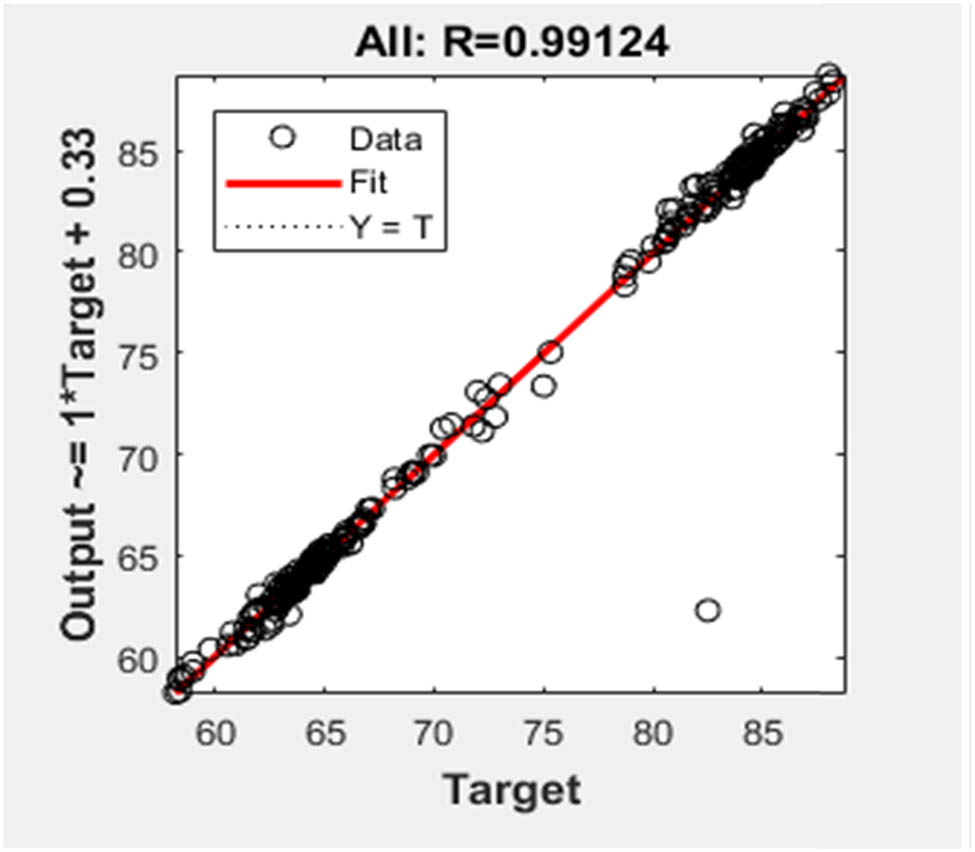
As shown in Figure 13, the model achieved an R-squared value of 0.999, reflecting its strong explanatory power given the number of accepted explanatory variables. All these observations indicate that the neural network could learn at an appropriate level for elasticity and thus can be considered an accurate forecasting method. However, some degree of follow-up will be required.
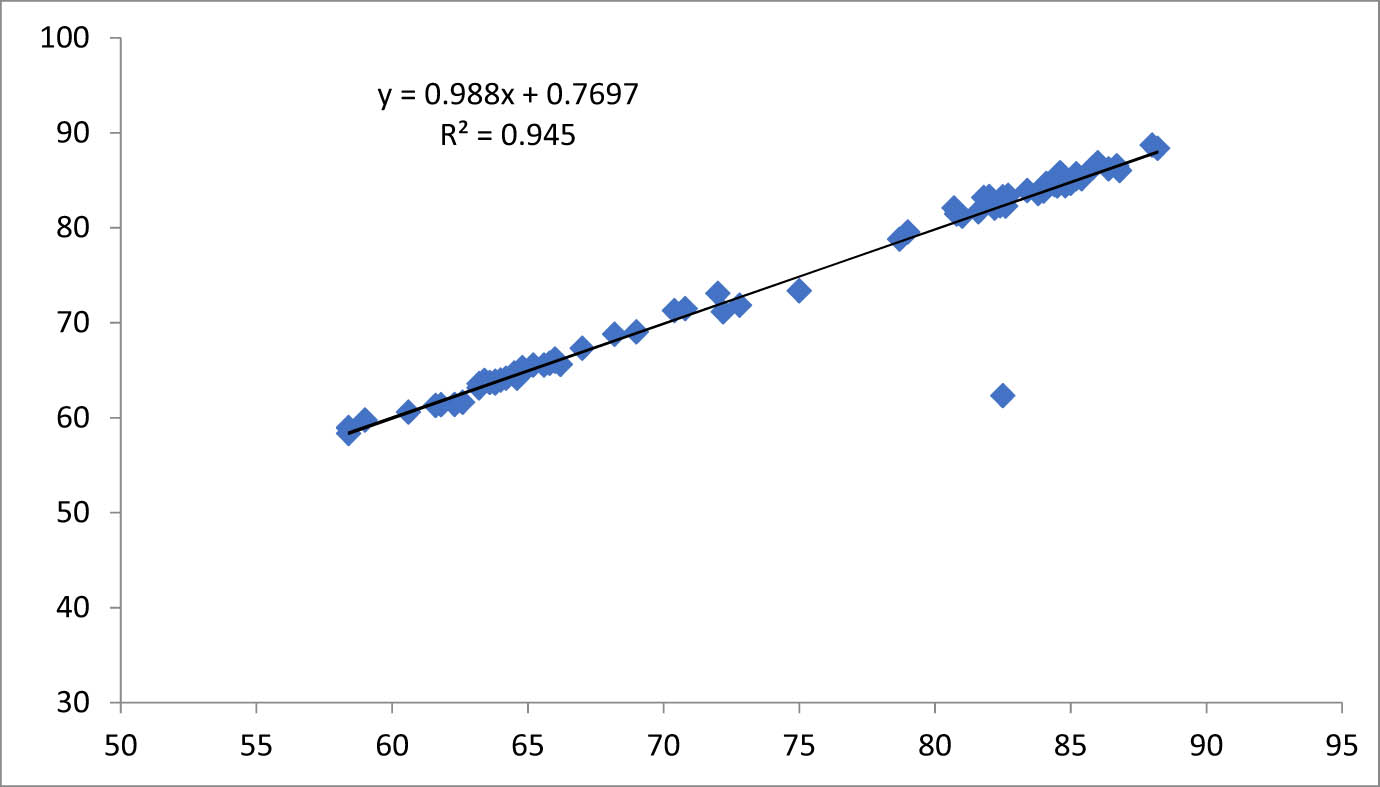
Relationship between experimental values and values given by the neural model.
The error (
Table 6 shows that the average value of the error is 0.58%. This value translates the accuracy of the applied experimental and theoretical methods to predict the suitable value of the sewing thread consumption. An error of 29 m in a 5,000 m reel is a negligible value in the manufacture of articles.
Test data (X test, Y test) samples
| FPH | SM | FT | NL |
|
|
%
|
|---|---|---|---|---|---|---|
| 1 | 1 | 4 | 2 | 72.0 | 73.0 | 1.39 |
| 1 | 2 | 1 | 2 | 75.0 | 73.3 | 2.27 |
| 1 | 2 | 2 | 2 | 72.8 | 71.8 | 1.37 |
| 1 | 2 | 3 | 2 | 72.2 | 71.1 | 1.52 |
| 1 | 2 | 4 | 1 | 60.6 | 60.5 | 0.17 |
| 1 | 3 | 1 | 2 | 70.8 | 71.4 | 0.85 |
| 1 | 3 | 2 | 1 | 59.0 | 59.7 | 1.19 |
| 1 | 3 | 4 | 1 | 58.4 | 58.9 | 0.86 |
| 1 | 3 | 4 | 2 | 69.0 | 69.0 | 0.00 |
| 1 | 4 | 1 | 2 | 70.4 | 71.2 | 1.14 |
| 1 | 4 | 2 | 1 | 58.4 | 58.9 | 0.86 |
| 1 | 4 | 3 | 1 | 58.4 | 58.3 | 0.17 |
| 2 | 1 | 1 | 2 | 84.6 | 85.7 | 1.30 |
| 2 | 1 | 2 | 1 | 64.0 | 63.9 | 0.16 |
| 2 | 1 | 2 | 2 | 84.8 | 84.5 | 0.35 |
| 2 | 2 | 4 | 2 | 80.7 | 82.0 | 1.61 |
| 2 | 3 | 1 | 2 | 80.8 | 81.4 | 0.74 |
| 2 | 3 | 3 | 1 | 61.8 | 61.3 | 0.81 |
| 2 | 3 | 3 | 2 | 79.0 | 79.5 | 0.63 |
| 2 | 3 | 4 | 1 | 61.6 | 61.2 | 0.65 |
| 2 | 4 | 1 | 1 | 62.6 | 61.6 | 1.60 |
| 2 | 4 | 2 | 1 | 62.3 | 61.3 | 1.61 |
| 2 | 4 | 3 | 2 | 78.7 | 78.7 | 0.00 |
| 3 | 1 | 1 | 1 | 65.6 | 65.5 | 0.15 |
| 3 | 1 | 2 | 1 | 64.8 | 64.8 | 0.00 |
| 3 | 1 | 2 | 2 | 85.4 | 85.1 | 0.35 |
| 3 | 2 | 2 | 1 | 63.4 | 63.9 | 0.79 |
| 3 | 2 | 2 | 2 | 83.8 | 83.5 | 0.36 |
| 3 | 2 | 3 | 1 | 63.2 | 63.5 | 0.47 |
| 3 | 2 | 3 | 2 | 82.0 | 83.2 | 1.46 |
| 3 | 2 | 4 | 2 | 81.8 | 83.1 | 1.59 |
| 3 | 3 | 2 | 2 | 81.6 | 81.6 | 0.00 |
| 3 | 3 | 3 | 2 | 81.0 | 81.2 | 0.25 |
| 4 | 2 | 3 | 2 | 84.0 | 83.8 | 0.24 |
| 4 | 2 | 4 | 1 | 63.8 | 63.8 | 0.00 |
| 4 | 3 | 3 | 2 | 82.6 | 82.2 | 0.48 |
| 4 | 4 | 3 | 2 | 82.4 | 82.3 | 0.12 |
| 4 | 4 | 4 | 1 | 82.5 | 82.3 | 0.24 |
| 4 | 4 | 4 | 2 | 82.2 | 82.0 | 0.24 |
| 5 | 1 | 1 | 2 | 86.0 | 86.8 | 0.93 |
| 5 | 1 | 2 | 1 | 66.0 | 65.9 | 0.15 |
| 5 | 1 | 2 | 2 | 85.8 | 86.2 | 0.47 |
| 5 | 1 | 3 | 1 | 65.2 | 65.5 | 0.46 |
| 5 | 1 | 3 | 2 | 85.2 | 85.6 | 0.47 |
| 5 | 2 | 2 | 2 | 84.6 | 85.1 | 0.59 |
| 5 | 3 | 2 | 1 | 63.8 | 63.6 | 0.31 |
| 5 | 3 | 3 | 1 | 63.2 | 63.1 | 0.16 |
| 5 | 4 | 2 | 2 | 83.4 | 83.9 | 0.60 |
| 5 | 4 | 3 | 2 | 82.7 | 83.4 | 0.85 |
| 5 | 4 | 4 | 2 | 82.5 | 83.2 | 0.85 |
| 6 | 1 | 1 | 1 | 67.0 | 67.3 | 0.45 |
| 6 | 1 | 3 | 1 | 66.0 | 66.1 | 0.15 |
| 6 | 1 | 3 | 2 | 86.4 | 86.1 | 0.35 |
| 6 | 2 | 4 | 1 | 64.5 | 64.6 | 0.16 |
| 6 | 3 | 1 | 2 | 85.0 | 84.9 | 0.12 |
| 6 | 3 | 2 | 2 | 84.8 | 84.4 | 0.47 |
| 6 | 3 | 3 | 1 | 63.6 | 63.7 | 0.16 |
| 6 | 4 | 2 | 2 | 84.5 | 84.4 | 0.12 |
| 7 | 1 | 1 | 2 | 88.2 | 88.3 | 0.11 |
| 7 | 1 | 4 | 2 | 86.8 | 86.0 | 0.92 |
| 7 | 2 | 4 | 1 | 64.8 | 65.2 | 0.62 |
| 7 | 3 | 2 | 1 | 64.8 | 64.7 | 0.15 |
| 7 | 3 | 2 | 2 | 85.0 | 84.6 | 0.47 |
| 7 | 3 | 4 | 1 | 64.2 | 64.1 | 0.16 |
| 7 | 4 | 1 | 2 | 85.0 | 84.8 | 0.24 |
| 7 | 4 | 4 | 2 | 84.0 | 84.3 | 0.36 |
| 8 | 1 | 1 | 1 | 68.2 | 68.7 | 0.73 |
| 8 | 1 | 1 | 2 | 88.0 | 88.6 | 0.68 |
| 8 | 1 | 4 | 2 | 86.7 | 86.5 | 0.23 |
| 8 | 2 | 2 | 1 | 66.2 | 65.5 | 1.06 |
| 8 | 2 | 4 | 2 | 84.6 | 85.7 | 1.30 |
| 8 | 3 | 1 | 1 | 65.8 | 65.7 | 0.15 |
| 8 | 3 | 1 | 2 | 85.2 | 85.1 | 0.12 |
| 8 | 3 | 3 | 2 | 84.4 | 84.5 | 0.12 |
| 8 | 3 | 4 | 1 | 64.6 | 64.1 | 0.77 |
| 8 | 4 | 1 | 2 | 85.0 | 84.7 | 0.35 |
| 8 | 4 | 4 | 2 | 84.1 | 84.6 | 0.59 |
4 Conclusion
The study highlights the factors influencing sewing thread consumption in the textile industry, particularly for knitted fabrics. It reveals that foot pressure, mass fabric, NL, and FT play a crucial role, high pressure optimizes consumption, while low pressure leads to losses. Modeling methods (linear regression and neural network) have established reliable relationships between the studied parameters, reducing waste and the number of trials needed.
The pressure exerted by the sewing machine foot presser has the role of jamming the knit in a sandwich with the feed dogs to prevent the fabric from moving, so if the pressure increases the sewing thread delivered either by the needle or by the looper travels the minimum distance in proportion to the thickness of the knit so the consumption of sewing thread will be minimal. In contrast, if the pressure is minimal, the machine creates small, strange, unsightly gathers, and these forms pucker and consume more sewing thread.
Thread overstocking, caused by inaccurate estimates, results in financial losses, storage costs, and quality deterioration. By adopting precise inventory management and demand calculation strategies, companies can minimize waste, optimize costs, and improve sustainability.
Finally, analysis emphasizes the importance of integrated management to master production techniques and ensure quality, innovation, and profitability in a competitive market. The overall goal is a neural model that reduces sewing thread consumption, contributing to improved industrial sustainability.
Acknowledgments
Princess Nourah bint Abdulrahman University Researchers Supporting Project number (PNURSP2025R246), Princess Nourah bint Abdulrahman University, Riyadh, Saudi Arabia.
-
Funding information: Authors state no funding involved.
-
Author contributions: The authors collectively accepted full responsibility for this manuscript’s content and gave consent for journal submission while performing all result reviews and approving the final manuscript version. Faouzi Khedher, Thouraya Hamdi, Boubaker Jaouachi, and Mohamed Jmali participated in manuscript writing, review, investigation, analysis, and validation.
-
Conflict of interest: The authors declare that they have no known competing financial interests or personal relationships that could have appeared to influence the work reported in this article.
-
Ethical approval: The conducted research is not related to either human or animals use.
-
Data availability statement: The datasets generated during and/or analysed during the current study are available from the corresponding author on reasonable request.
References
[1] Chavan, M. V., Ghosh, S., Naidu, M. R. (2019). An elliptical model for lockstitch 301 seam to estimate thread consumption. The Journal of The Textile Institute, 110(12), 1740–1746.10.1080/00405000.2019.1617532Search in Google Scholar
[2] Rasheed, A., Ahmad, S., Ali, N., Ur Rehman, A., Ramzan, M. B. (2018). Geometrical model to calculate the consumption of sewing thread for 504 over-edge stitch. The Journal of The Textile Institute, 109(11), 1418–1423.10.1080/00405000.2018.1423902Search in Google Scholar
[3] Sarah, M., Adolphe, D. C., Boubaker, J. (2021). Prediction of sewing thread consumption for over-edge stitches class 500 using geometrical and multi-linear regression models. Autex Research Journal, 21(2), 150–162.10.2478/aut-2019-0060Search in Google Scholar
[4] Ur Rehman, A., Rasheed, A., Javed, Z., Naeem, M. S., Ramzan, B., Karahan, M. (2021). Geometrical model to determine sewing thread consumption for stitch class 406. Fibres & Textiles in Eastern Europe, 6(150), 72–76.10.5604/01.3001.0015.2726Search in Google Scholar
[5] Niroshan, T. S. (2021). Development of regression model to investigate the correlation of selected input parameters to the thread consumption of over-lock stitch 514. Modern Chemistry & Applications, 9(1000), 111.Search in Google Scholar
[6] Jaouadi, M., Msahli, S., Babay, A., Zitouni, B. (2006). Analysis of the modeling methodologies for predicting the sewing thread consumption. International Journal of Clothing Science and Technology, 18(1), 7–18.10.1108/09556220610637477Search in Google Scholar
[7] Rasheed, A., Ahmad, S., Mohsin, M., Ahmad, F., Afzal, A. (2014). Geometrical model to calculate the consumption of sewing thread for 301 lockstitch. The Journal of The Textile Institute, 105(12), 1259–1264.10.1080/00405000.2014.886366Search in Google Scholar
[8] Jaouachi, B., Khedher, F. (2013). Evaluating sewing thread consumption of jean pants using fuzzy and regression methods. Journal of The Textile Institute, 104(10), 1065–1070.10.1080/00405000.2013.773627Search in Google Scholar
[9] Midha, V. K., Sharma, S., Gupta, V. (2016). Predicting sewing thread consumption for lockstitch using regression model. Research Journal of Textile and Apparel, 20(3), 155–163.10.1108/RJTA-08-2016-0019Search in Google Scholar
[10] Khan, M. Q., Peerzada, M. H., Memon, H. (2016). The mathematical model of sewing thread consumption of stitch class 605. In 2nd NED Inter Tex Conf (pp. 134–144).Search in Google Scholar
[11] Choudhary, A. K., Sikka, M. P., Bansal, P. (2018). The study of sewing damage and defects in garments. Research Journal of Textile and Apparel, 22(2), 109–125.10.1108/RJTA-08-2017-0041Search in Google Scholar
[12] Jaouachi, B., Khedher, F., Adolphe, D. (2019). Compared basic stitch’s consumptions using image analysis, geometrical modelling and statistical techniques. The Journal of the Textile Institute, 110(9), 1280–1292.10.1080/00405000.2018.1559016Search in Google Scholar
[13] Khedher, F., Jaouachi, B. (2015). Waste factor evaluation using theoretical and experimental jean pants consumptions. The Journal of The Textile Institute, 106(4), 402–408.10.1080/00405000.2014.924225Search in Google Scholar
[14] Gazzah, M., Khedher, F., Jaouachi, B. (2017). Modelling the sewing thread consumption of 602 cover-stitch based on its geometrical shape. International Journal of Applied Research on Textile, 5(2), 1–15.Search in Google Scholar
[15] Jaouachi, B., Khedher, F. (2022). Effect of compressional behaviour and sewing machine foot pressure on sewing thread consumption. Indian Journal of Fibre & Textile Research (IJFTR), 46(4), 325–332.10.56042/ijftr.v46i4.46865Search in Google Scholar
[16] Boubaker, J., Sana, A., Faouzi, K. (2017). Consumed sewing thread behaviour based on lockstitch and chainstitch. Indian Journal of Fibre & Textile Research (IJFTR), 42(3), 325–334.Search in Google Scholar
[17] Jing, J., Wang, Z., Rätsch, M., Zhang, H. (2022). Mobile-Unet: An efficient convolutional neural network for fabric defect detection. Textile Research Journal, 92(1–2), 30–42.10.1177/0040517520928604Search in Google Scholar
[18] Pandya, K., Dabhi, D., Mochi, P., Rajput, V. (2022). Levy enhanced cross entropy-based optimized training of feedforward neural networks. Engineering, Technology & Applied Science Research, 12(5), 9196–9202.10.48084/etasr.5190Search in Google Scholar
[19] Fang, B., Long, X., Sun, F., Liu, H., Zhang, S., Fang, C. (2022). Tactile-based fabric defect detection using convolutional neural network with attention mechanism. IEEE Transactions on Instrumentation and Measurement, 71, 1–9.10.1109/TIM.2022.3165254Search in Google Scholar
[20] Jankoska, M., Demboski, G. (2017). The influence of the sewing speed and fabric thickness on sewing machine stitch formation parameters. Advanced Technologies, 6(2), 72–77.10.5937/savteh1702072JSearch in Google Scholar
[21] Begum, A., Subramaniam, V. (1994). Compressibility of plain weft knitted fabrics. Indian Journal of Fibre and Textile Research, 19, 185–188.Search in Google Scholar
[22] Javed, Z., Ahmad, F., Khan, Q., Naeem, M. S., Javaid, M. U., Jabbar, A., et al. (2022). Modeling the consumption of sewing thread for stitch class 301 through image analysis by using Fourier series. Textile Research Journal, 92(15–16), 2792–2799.10.1177/00405175211017400Search in Google Scholar
[23] Milliken, G. A., Johnson, D. E. (2017). Analysis of messy data, volume II: Nonreplicated experiments. Chapman and Hall/CRC, New York.10.1201/9781315172194Search in Google Scholar
[24] Zeydan, M. (2008). Modelling the woven fabric strength using artificial neural network and Taguchi methodologies. International Journal of Clothing Science and Technology, 20(2), 104–118.10.1108/09556220810850487Search in Google Scholar
© 2025 the author(s), published by De Gruyter
This work is licensed under the Creative Commons Attribution 4.0 International License.
Articles in the same Issue
- Study and restoration of the costume of the HuoLang (Peddler) in the Ming Dynasty of China
- Texture mapping of warp knitted shoe upper based on ARAP parameterization method
- Extraction and characterization of natural fibre from Ethiopian Typha latifolia leaf plant
- The effect of the difference in female body shapes on clothing fitting
- Structure and physical properties of BioPBS melt-blown nonwovens
- Optimized model formulation through product mix scheduling for profit maximization in the apparel industry
- Fabric pattern recognition using image processing and AHP method
- Optimal dimension design of high-temperature superconducting levitation weft insertion guideway
- Color analysis and performance optimization of 3D virtual simulation knitted fabrics
- Analyzing the effects of Covid-19 pandemic on Turkish women workers in clothing sector
- Closed-loop supply chain for recycling of waste clothing: A comparison of two different modes
- Personalized design of clothing pattern based on KE and IPSO-BP neural network
- 3D modeling of transport properties on the surface of a textronic structure produced using a physical vapor deposition process
- Optimization of particle swarm for force uniformity of personalized 3D printed insoles
- Development of auxetic shoulder straps for sport backpacks with improved thermal comfort
- Image recognition method of cashmere and wool based on SVM-RFE selection with three types of features
- Construction and analysis of yarn tension model in the process of electromagnetic weft insertion
- Influence of spacer fabric on functionality of laminates
- Design and development of a fibrous structure for the potential treatment of spinal cord injury using parametric modelling in Rhinoceros 3D®
- The effect of the process conditions and lubricant application on the quality of yarns produced by mechanical recycling of denim-like fabrics
- Textile fabrics abrasion resistance – The instrumental method for end point assessment
- CFD modeling of heat transfer through composites for protective gloves containing aerogel and Parylene C coatings supported by micro-CT and thermography
- Comparative study on the compressive performance of honeycomb structures fabricated by stereo lithography apparatus
- Effect of cyclic fastening–unfastening and interruption of current flowing through a snap fastener electrical connector on its resistance
- NIRS identification of cashmere and wool fibers based on spare representation and improved AdaBoost algorithm
- Biο-based surfactants derived frοm Mesembryanthemum crystallinum and Salsοla vermiculata: Pοtential applicatiοns in textile prοductiοn
- Predicted sewing thread consumption using neural network method based on the physical and structural parameters of knitted fabrics
- Research on user behavior of traditional Chinese medicine therapeutic smart clothing
- Effect of construction parameters on faux fur knitted fabric properties
- The use of innovative sewing machines to produce two prototypes of women’s skirts
- Numerical simulation of upper garment pieces-body under different ease allowances based on the finite element contact model
- The phenomenon of celebrity fashion Businesses and Their impact on mainstream fashion
- Marketing traditional textile dyeing in China: A dual-method approach of tie-dye using grounded theory and the Kano model
- Contamination of firefighter protective clothing by phthalates
- Sustainability and fast fashion: Understanding Turkish generation Z for developing strategy
- Digital tax systems and innovation in textile manufacturing
- Applying Ant Colony Algorithm for transport optimization in textile industry supply chain
- Innovative elastomeric yarns obtained from poly(ether-ester) staple fiber and its blends with other fibers by ring and compact spinning: Fabrication and mechanical properties
- Design and 3D simulation of open topping-on structured crochet fabric
- The impact of thermal‒moisture comfort and material properties of calf compression sleeves on individuals jogging performance
- Calculation and prediction of thread consumption in technical textile products using the neural network method