NIRS identification of cashmere and wool fibers based on spare representation and improved AdaBoost algorithm
-

 ,
,

Abstract
Near-infrared (NIR) spectroscopy is essential for distinguishing cashmere from wool. It is fast and non-destructive. Both cashmere and wool contain keratin. Their NIR spectral images are very similar. This makes it hard to tell them apart. This article proposes a method to identify and classify two similar fibers. It uses NIR spectroscopy combined with chemometrics. The chemometrics model mainly uses sparse representation and an improved AdaBoost classifier. The sparse representation is used for feature extraction. It expands the distance between sample spectra. This strategy first standardizes the dataset. It then uses the K-singular value decomposition algorithm to learn a low-dimensional dictionary. Finally, it maps the spectra using the dictionary. This approach creates a low-dimensional positive–negative distribution of sample features. It aims to widen the gap for later classification. Also, due to the many cashmere and wool species, some intra-species gaps are larger than the inter-species ones. This has increased misclassification errors. This article uses AdaBoost to assign weights to samples of different species. It optimizes these weights with many decision tree (DT) classifiers. It then uses the sparrow optimization algorithm. It finds the best number and depth of DTs. In the comparison experiments of this article, the sparse representation can effectively amplify the gap between cashmere and wool than principal component analysis and independent component analysis, and the classification efficiency of AdaBoost is also higher than the classification efficiency of K-nearest neighbors, Random Forest, and other classifiers. The combination of these two algorithms can achieve a classification accuracy of 97.4%, which can effectively classify cashmere and wool fibers.
1 Introduction
Cashmere and wool are natural animal fibers. Cashmere is distinguished by its fine, uniform fibers, soft texture, delicate feel, and impressive luster, along with strong tensile strength, rendering it highly desirable in the textile industry [1]. Cashmere is very popular. However, it is very expensive due to its scarcity. As wool is chemically similar to cashmere and its economic value is much lower than that of cashmere. As a result, some traders take advantage of their similarity by substituting wool for cashmere, thereby maximizing profits and undermining the integrity of the market. Therefore, the development of a rapid and accurate method for discriminating between cashmere and wool fibers holds significant practical importance for advancing the textile industry [2 3,4,5].
In recent years, scholars at home and abroad have proposed various methods for distinguishing between cashmere and wool fibers, mainly divided into the following three categories: fiber component analysis based on chemical methods, the fibers of cashmere and wool are different in their chemical structures, especially in the content and structure of keratin, and through the analysis of these differences, cashmere and wool can be effectively differentiated [6]; genetic feature analysis based on biological methods, genetic methods reveal the genetic differences between cashmere and wool by detecting the genotypes and related genetic markers of sheep [7]; and fiber visual feature analysis based on physical imaging methods, cashmere and wool have obvious differences in morphology, structure, and visual characteristics, through which they can be classified efficiently [8]. However, both chemical and biological methods are destructive and have long detection cycles, making them difficult to apply to a large number of samples. In physical imaging methods, it is difficult to distinguish some scale-like wool fibers when identifying fiber surface scales using microscopes and scanning electron microscopes, and they are also susceptible to human factors. So, the above methods are hard to improve. They lack accuracy, generality, and convenience [3,9].
As computer technology and chemometrics theory advance, the integration of near-infrared (NIR) spectroscopy with machine learning methods has garnered considerable attention. NIR spectroscopy utilizes spectral data spanning the 1,000–2,500 nm range or multiple wavelengths to qualitatively analyze cashmere and wool. Notably, the NIR spectral region features broad bandwidth and weak absorption intensity, enabling analysis of undiluted samples in larger cuvettes [10]. This allows for simplified preprocessing, non-destructive detection, and the generation of more representative results. Additionally, NIR spectroscopy is known for its high efficiency, affordability, and repeatability, making it well-suited for quantitative analysis of complex samples and online detection. When coupled with machine learning algorithms, NIR spectroscopy can significantly enhance recognition accuracy [11,12,13,14]. For example, Wu and He proposed a hybrid algorithm to distinguish cashmere breeds by principal component analysis (PCA) and support vector machine (SVM) via NIR spectroscopy [15]. The results show that the data mining method of PCA–SVM has a better recognition effect, and combined with NIR spectroscopy, it can be used as a new method to quickly recognize cashmere raw material varieties. Liu et al. carried out a qualitative identification study of 130 wool and cashmere samples from different regions of Gansu using visible an NIR diffuse reflectance spectroscopy technique [16]. The results showed that the predictive performance of the qualitative identification model established by using the principal component and Mars distance clustering discriminant analysis method was good, and the correct rate of external validation was 100%. Chen et al.’s classical partial least squares and extreme learning machine were used for multivariate calibration and systematic comparison [17]. The results indicated that NIR spectroscopy combined with extreme learning machine and correlation variable selection is feasible in NIR-based textile analysis. Zhu et al. proposed a novel texture characterization method based on the gray-level covariance matrix and the Gabor wavelet transform, which was able to adequately extract cashmere and wool fiber [18]. Leng et al. proposed a rapid qualitative evaluation method for wool content by combining NIR spectroscopy and attention-based U-Net++. The final recognition accuracy can reach 94.24% [19].
However, in categorizing cashmere and wool using NIR spectral data, the data have high dimensionality and complex nonlinear properties. Also, small class differences are a common problem. The sparse representation cuts AdaBoost’s work. It improves efficiency by reducing useless bands. K-singular value decomposition (SVD) effectively selects key bands in the NIR spectrum. It classifies cashmere and wool accurately. It does this by sparse representation to highlight their spectral differences. These bands show big differences between cashmere and wool. AdaBoost’s weighting mechanism optimizes the classification process further. By assigning higher weights to difficult samples, AdaBoost improves the classifier’s sensitivity to small differences. This results in a better distinction between cashmere and wool. This combination improves cashmere and wool classification accuracy. It also removes redundant tasks and enhances efficiency when compared to other machine or deep learning methods. The two algorithms can combine. This will use the benefits of NIR spectroscopy. It will make better use of the spectral data. It will effectively complete the classification task.
2 Overview of the cashmere and wool identification processes
The main steps of the method include the following three steps, as shown in Figure 1. First, the NIR spectra of the organized samples are acquired with an RZNIR 7800 spectrometer, and the acquired spectra are preprocessed to reduce the effect of noise on the spectra [20,21,22,23,24]. Subsequently, the preprocessed NIR spectral data were feature extracted using the SR algorithm, so that the obtained feature data had smaller dimensions than the original data, and the gap between the spectral data of cashmere and wool samples was increased. Finally, the improved AdaBoost integrated learning algorithm was utilized to classify cashmere and wool based on the feature data through multiple classifiers.
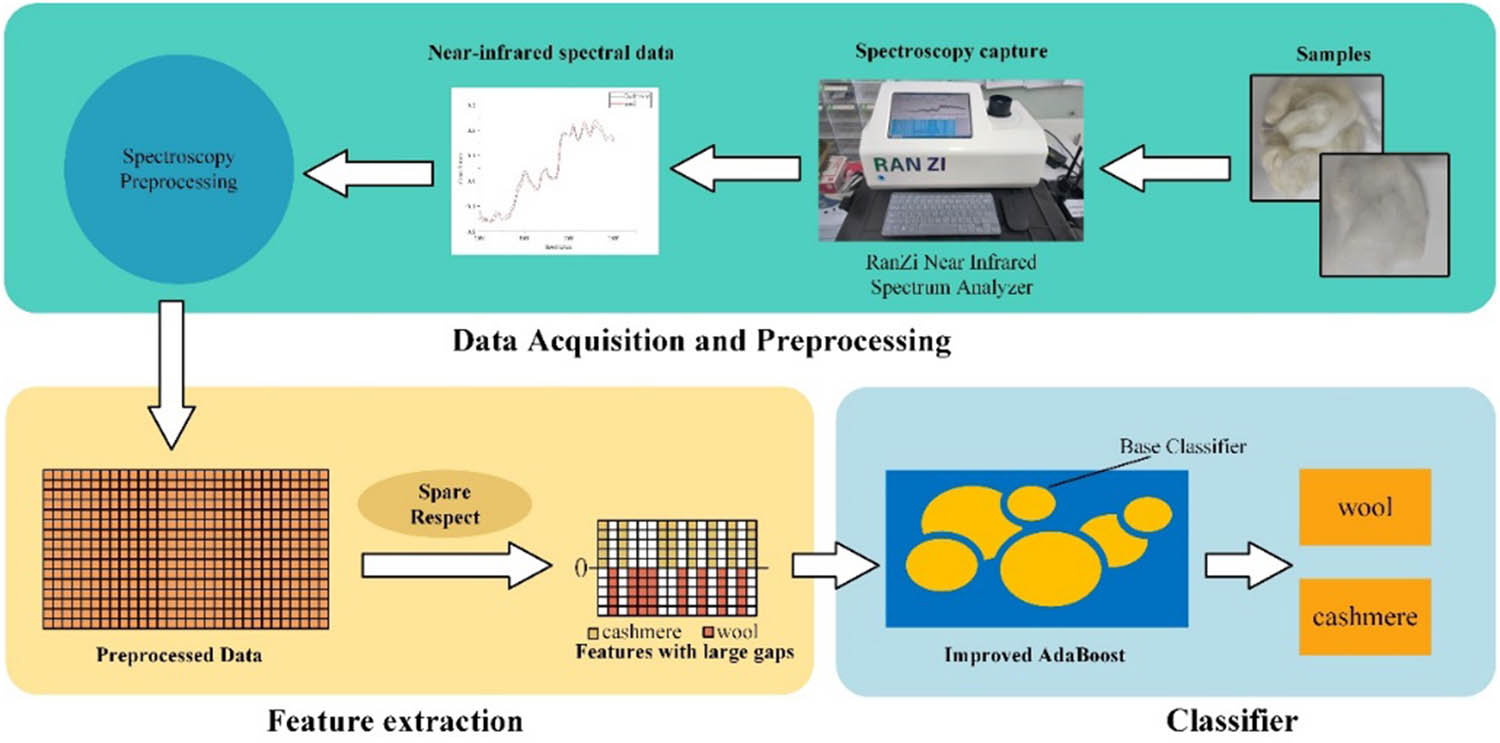
The cashmere and wool identification processes.
3 Materials and methods
3.1 Materials
Cashmere wool samples are obtained from about 30 different origins such as Shaanxi, Xinjiang, Tibet, and Australia, and the breeds contain goats and sheep. These sample sources select 15 different wool samples and 15 different cashmere samples as the original experimental samples. The characteristics of the samples are shown in Table 1.
Characteristics of sample selection
| Types | Color | D a (μm) | SD (μm) | L b (mm) | SD (mm) | Locations |
|---|---|---|---|---|---|---|
| Xinjiang fine wool | White | 23.5 | 0.2 | 46 | 4.1 | Ili |
| Inner Mongolia Sheep | 22.9 | 0.4 | 44 | 3.9 | Yulin | |
| Australian Merino wool | 21.8 | 0.4 | 49 | 3.9 | Ordos | |
| Qing He long wool | 19.5 | 0.2 | 45 | 3.8 | Qinghe | |
| Chi Feng fine wool | 19.5 | 0.2 | 38 | 3.9 | Chifeng | |
| Shaanxi fine wool | 19.5 | 0.3 | 34 | 3.9 | Ordos | |
| 18.5 | 0.3 | 32 | 3.7 | |||
| Alashan cashmere | White | 14.5 | 0.2 | 41 | 3.9 | Alxa League |
| Outer Mongolia brown cashmere | Brown | 16.8 | 0.2 | 27 | 3.3 | Outer Mongolia |
| Chinese brown cashmere | Light brown | 16.0 | 0.2 | 31 | 3.3 | Xinjiang |
| Afghan purple cashmere | Puce | 14.5 | 0.3 | 36 | 3.7 | Afghan |
| Tibetan brown cashmere | Brown | 14.5 | 0.2 | 38 | 3.7 | Tibet |
| 14.8 | 0.2 | 33 | 3.5 | |||
| Mongolian brown cashmere | Brown | 16.5 | 0.3 | 34 | 3.7 | Mongolia |
| 15.0 | 0.3 | 27 | 3.4 |
a D is the mean diameter (μm).
b L is the mean length (mm).
SD, standard deviation.
Also, all samples selected above, including wool and cashmere, are pure. They are mainly from quality control organizations, and the purification of the samples is achieved by mechanical methods. The mechanical method is divided into three main steps: separation, coarse carding, and fine carding to obtain pure fine wool and cashmere fibers.
The dataset of this article contains 450 cashmere spectra and 450 wool spectra, consisting of a total of 900 NIR spectral data with 1,500 features per NIR spectral data in bands of 1,000–2,500 nm step size 1. All the experiments in this article divide the data into the training set and test set with 7:3 division.
3.2 NIR acquisition and Software
The NIR spectroscopy data of cashmere and wool are collected using an NIR spectrometer (RZNIR 7900, RAN ZI, China). The instrument is equipped with chemometric modeling analysis software, an acousto-optic tunable filter spectrometer, and an InGaAs detector. Spectra are recorded in the range of 1,000–2,500 nm using a diffuse reflectance mode. This includes the front, back, and average NIR spectra of the samples, consisting of 1,500 data points at a resolution of approximately 1 nm. Each time, at least 2 g of fiber are weighed, placed into a standard sample cup with a diameter of 50 mm, and then placed on the measurement window of the instrument, with a weight of about 200 g applied. A specific spinner accessory is used to control the rotation of the sample cup, allowing for multi-point reflection measurements of the same sample. Consequently, the final spectrum represents the average of spectra recorded at different locations. All spectra are recorded in CSV file format. All calculations are performed on Windows using PyCharm 2023.
3.3 Feature extraction with sparse representation
Since the experimental data in this article are NIR spectral data with wavelengths ranging from 1,000 to 2,500 nm, the dataset is large with high redundancy. Dealing with high-dimensional data in algorithms is a challenging task; therefore, the work of feature extraction and dimensionality reduction of high-dimensional data becomes more important in the study.
In addition, in subsequent classification, when the classifier is confronted with features with large sample spacing, its classification is better than that with smaller spacing. SR is precisely a feature extraction method that can reconstruct signals to large gaps.
3.3.1 The sparse representation model
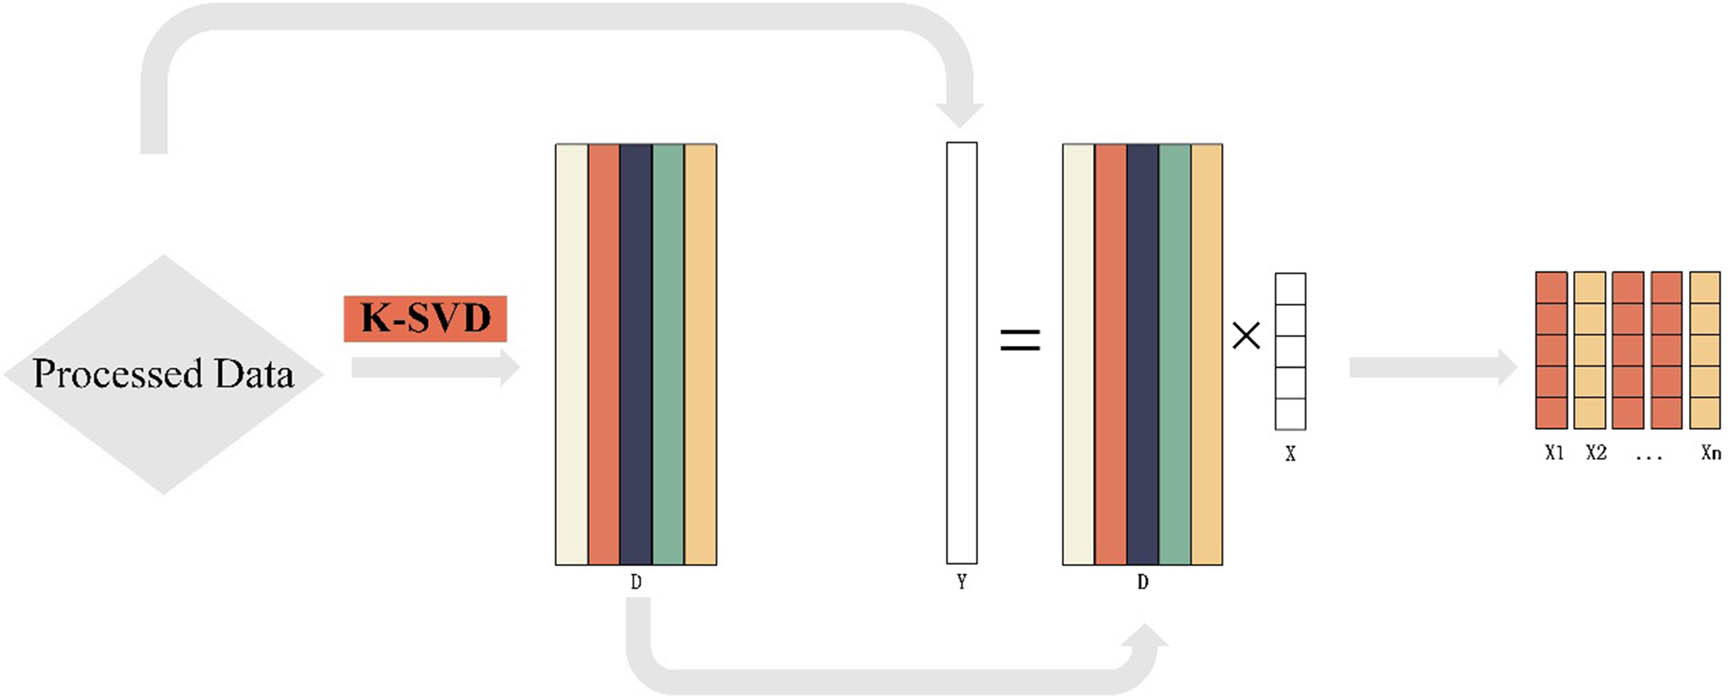
Specifically, as in Figure 2, the advantage of the SR is that it provides a compact lossy representation so that the signal retains the main information while the amount of data is small, and the large gap between samples is amplified relative to the original signal, which can effectively improve the classification accuracy.
Sparse representation steps.
3.3.2 Using dictionary to obtain large-distance features
Sparse representation is a widely used technique in the field of signal processing, and its core principle is to represent a signal in a sparse manner by learning a set of basis functions or atoms. This approach is applicable to several fields, including image processing, signal recovery, and other tasks that require efficient representation and analysis of signals [25].
In the sparse representation, the NIR spectra of cashmere and wool are considered to be obtained by learning a linear combination of a set of basis functions. This set of basis functions is often referred to as a dictionary, and the learning process involves adjusting the elements of the dictionary to best fit the input signal
where D = [d 1, d 2, …, d n ] ∈ R m*k, denotes the dictionary with k atoms (k is the number of dictionary entries) obtained by dictionary learning. S = [s 1, s 2, …, s n ] ∈ R k × n denotes the sparse coefficients of the sample Y consisting of n k-dimensional column vectors.
Among the spectral sparse representation methods, K-SVD [26] is one of the commonly used dictionary learning algorithms. The K-SVD algorithm implements dictionary learning by iteratively updating the dictionary and the sparse representation coefficients. The core idea is to minimize the reconstruction error of the signal and to update the columns of the dictionary and the sparse representation coefficients at each iteration.
Because the core idea of K-SVD is to minimize the reconstruction error when the signal is sparse into a smaller number of dimensions, the corresponding number of dictionary elements is also smaller [27], in order to minimize the reconstruction error, the learned dictionary must amplify the gap between the individual elements, and the different dictionary elements correspond to fewer regions of the same spectral bands, to enable it to represent the original signal more perfectly.
The gap between dictionary elements makes the sparse coefficients S as weights appear as a gap between samples when representing different samples with differently weighted dictionary elements, so that the original gap between samples is amplified as a gap between dictionary element weights, that is the sparse coefficients S.
As an example, the cashmere and wool NIR spectral signals are shown in Figure 3 to demonstrate the gap among different atoms of the five-dimensional dictionary by representing the difference in two dimensions. Each dictionary element shows the basic pattern of a specific feature in the data. By looking at the dictionary elements, we can clearly see the discrepancies between different dictionary elements, which reflect the diversity of underlying features in the data. In the sparse representation process, the data is reconstructed through these dictionary elements, and each data point can be represented as a linear combination of dictionary elements while maintaining sparsity.
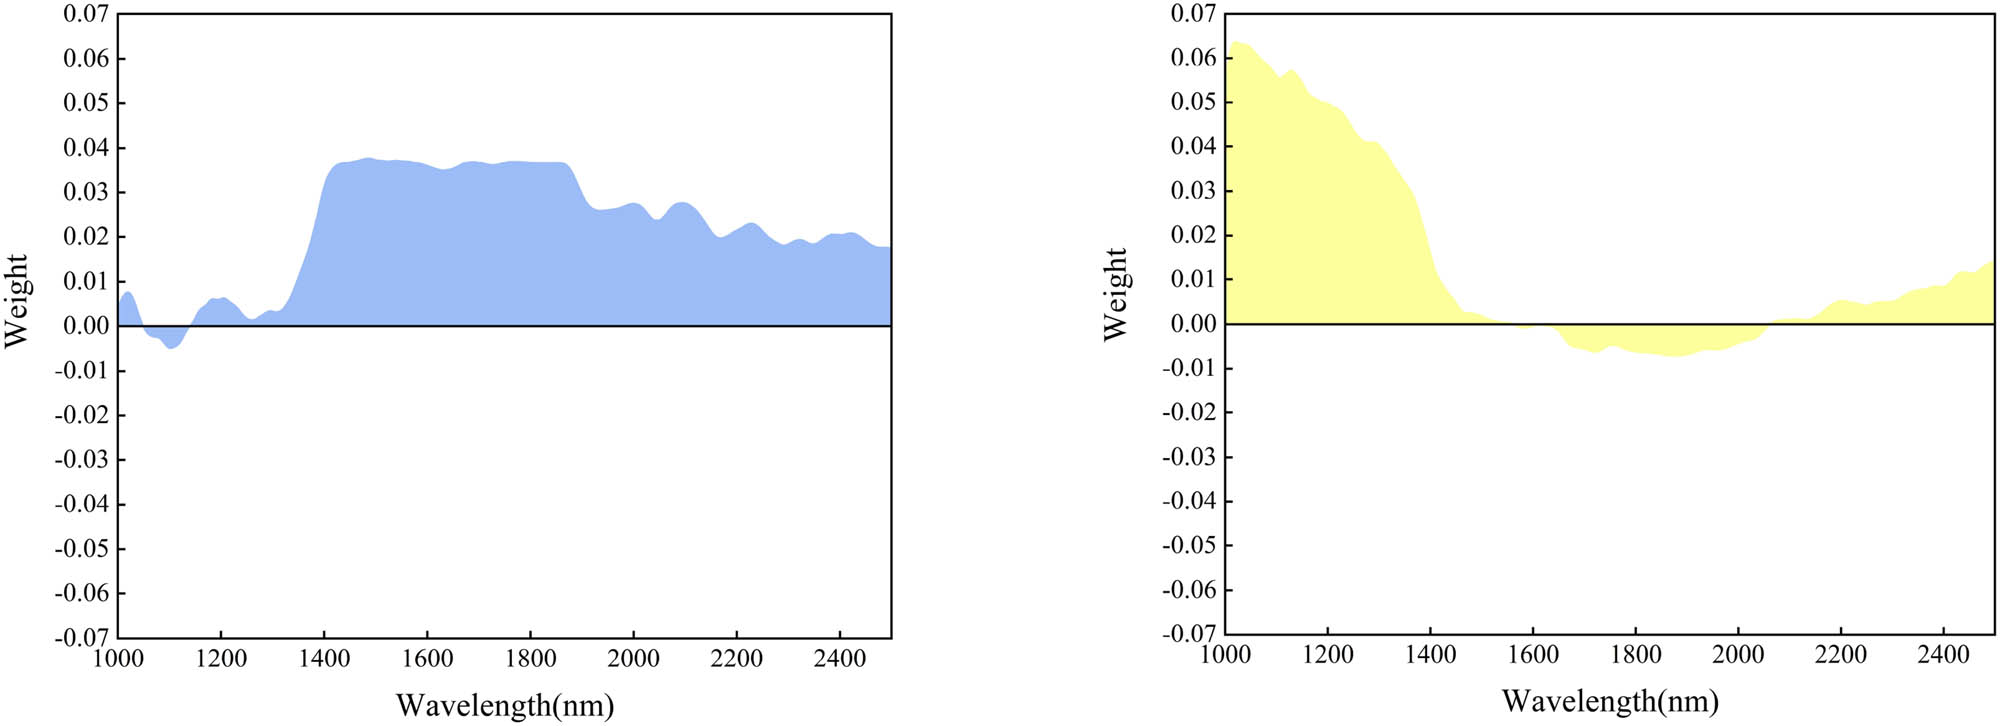
Different dimensions in the dictionary.
Given dataset Y containing n spectral samples, we wish to represent each spectral sample x i ∈ Y as a linear combination of the dictionary D, which is x i ≈ D × s i , where s i is the sparse representation coefficients vector of the ith spectral sample.
The K-SVD algorithm updates the dictionary D and the sparse representation coefficients S through the following optimization problem:
where k is a sparsity constraint indicating the sparsity of each spectral sample. In the K-SVD algorithm, we update the columns of the dictionary and the corresponding elements of the sparse representation coefficients matrix S sequentially, arrive at the sparse coefficients of the corresponding sparsity through different sparsity constraints, and then select the sparsity by calculating the distance between samples and combining the classification effect.
The update fixes everything outside the k atoms d k into updating the sparsity coefficients s k of that atom d k and its corresponding row, thus minimizing the overall error. The reconstructed part except for the kth atom is first subtracted from all samples so that only dk and s k can be focused on
Then, the SVD decomposition of E k
Take the first column U as d k and the first column singular values multiplied by the corresponding right singular vectors, as the new coefficient coefficients s k
Find the optimal update direction with the dictionary by doing so. Different sparsity constraints yield sparse coefficients with corresponding sparsity. For example, 900 1,500-dimensional NIR datasets with set 5-dimensional dictionary yield 900 5-dimensional sparse coefficients for classification.
3.4 AdaBoost-DT model improved by the sparrow search algorithm (SSA) (AdaBoost-SSA-DT)
Since the sample dataset contains cashmere and wool samples from all over the world, there may be situations where the gap between cashmere and wool is larger than the gap between cashmere and cashmere or wool and wool, it is necessary to improve the generalization ability and fineness of the classifier, to precise the classification attention from the broad categories to the samples, and to improve the classification accuracy by iteratively weighting the classification results.
The following section introduces the AdaBoost-decision tree (DT) classifier and optimizes it with SSA for classification of multi-category cashmere and wool classification and introduces the AdaBoost-DT algorithm and SSA algorithm, respectively.
3.4.1 AdaBoost-SSA-DT model
In order to obtain the best classification results and efficiency of the AdaBoost-DT classifier, the hyperparameters of the classifier: maximum DT depth and number of classifiers need to be optimized. Therefore, the sparrow algorithm is added to the classifier, as shown in Figure 4, to find the best combination of parameters, combining into the optimized AdaBoost classifier algorithm of AdaBoost-SSA-DT.
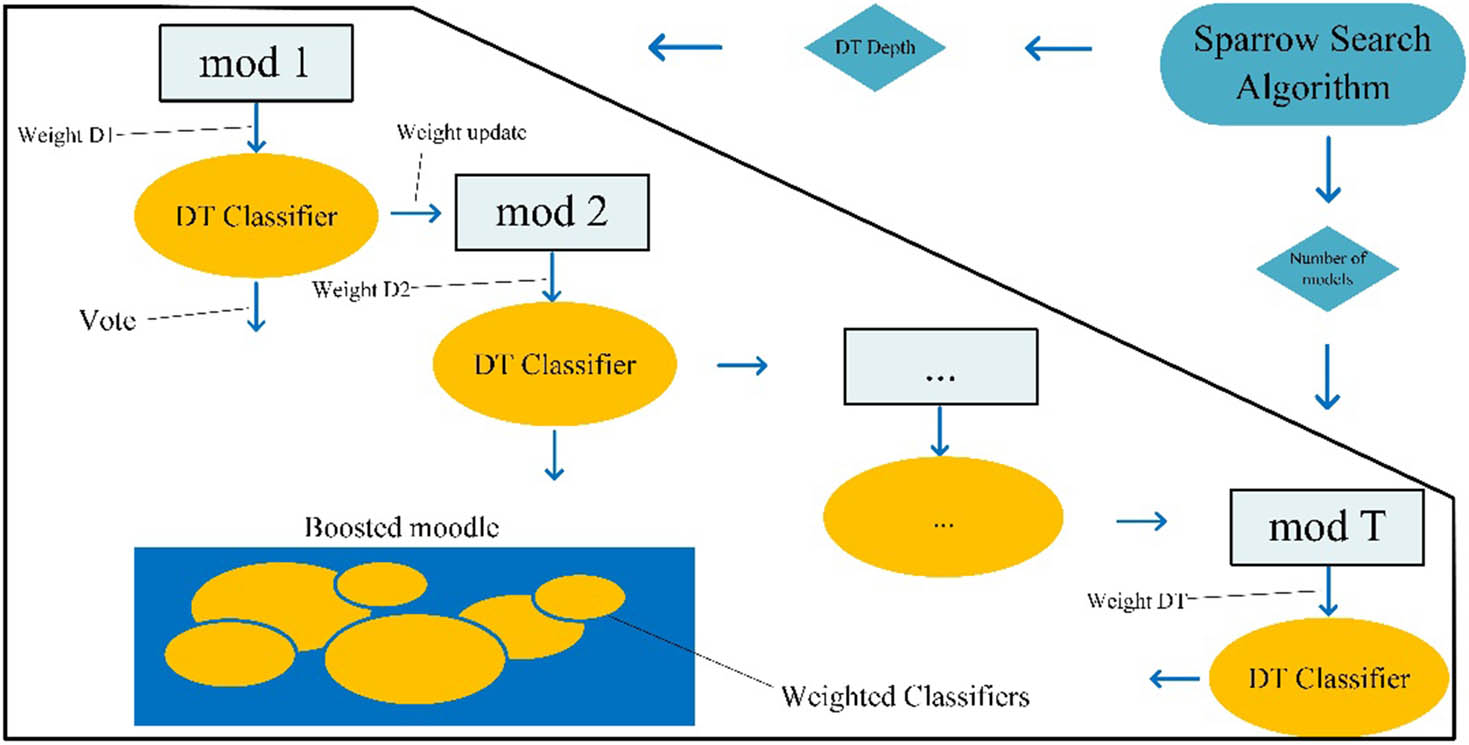
AdaBoost-SSA-DT model.
3.4.2 Classification of cashmere and wool using AdaBoost-DT
The AdaBoost algorithm [28] is a boosted classification algorithm that combines multiple weak classifiers by means of an additive model to achieve the effect of comparing strong classifiers in terms of arithmetic power and classification performance. This algorithm gives more attention to the misclassified samples by increasing the weight of the samples misclassified by the previous weak classifier in the training set while decreasing the weight of the samples that are more likely to be classified correctly. The adjusted sample weights will be used to train the next weak learner. After iteration, these weak learners are combined by an additive model to form the final classifier. In addition to this, the additive model applied in AdaBoost is the Staged Additive Modeling algorithm, which uses a multi-class exponential loss function to quickly reduce the error to a low value. Next is the flow description of the AdaBoost algorithm [29,30,31,32].
Let S = {(x 1 , y 1), …, (x i , y i ), …, (x n , y n )} denote the NIR spectral training sample dataset for the cashmere and wool classification case. y i ∈ Y = {−1, +1} is the class label associated with x i , −1 for wool, +1 for cashmere. The AdaBoost algorithm is based on the additive model, which is the linear combination of the base classifiers h t (x) [33,34].
where t = {1, …, T} denotes the iteration number and αt are the weight coefficients.
In equation (6), h t (x) are learned from the base classification algorithm based on the training sample with the distribution D t at t iteration. The shape of D t is a normalized weight vector
The distribution D t denotes the weight of each instance in S at t iteration, that is the weights of the NIR spectral sample data for cashmere and wool. D 1 is composed as
and D t + 1 are composed as
where Z t are the normalization factors and are calculated as
From equations (9) and (10), we know that D t+1 is adjusted from D t . Thus, the samples that are classified incorrectly in h t (x) will have higher weights in t + 1 iteration.
Given a training set S and sample weight D t , the object of h t (x) is to minimize the classification error e t . e t is calculated as
where P(.) denote the probability and I(.) denote the logic value.
In equation (10), α t measures the importance of h t (x) in the final classifier and is calculated in the following way:
According to the principle of the integrated learning model of the AdaBoost classifier, there are various weak learners to choose from, including DT, SVM, and single-layer perceptron. In this experiment, DT models are chosen as weak learners for classification experiments. The adjustment is done by increasing the weight of the incorrectly discriminated samples and decreasing the weight of the correctly discriminated samples.
3.4.3 Finding optimal solutions of AdaBoost-DT by SSA
SSA was originally proposed by Xue and Shen [35]. The algorithm imitates the unique predation method of sparrows in nature to solve the optimization problem. In SSA, the position of the sparrow in the population is the candidate solution for a given optimization problem. According to the mathematical model of SSA, the behavior of the sparrows is mainly divided into three divisions of labor: producers, scroungers, and sparrows at the edge of the group.
In this article, the experiment hopes to find the optimal AdaBoost-DT classifier parameter combinations, the optimal number of DTs vs the optimal decision tree depth, by using the SSA. Therefore, each sparrow represents a parameter combination, and the fitness is used to evaluate the merit of that parameter combination after each iteration.
Producers represent individuals with higher fitness and better performance of parameter combinations. Scavengers correspond to less well-adapted sparrows, which improve their fitness by following and mimicking the behavior of individual producers. Population fringe sparrows are those individuals with lower adaptation values and more randomness, which move randomly in the search space to explore new areas and provide more information to the whole population.
4 Experimental results and analysis
In this section, we use experimental results on real-world datasets to demonstrate the effectiveness of our proposed approaches.
4.1 Analysis of sparse representation results
The NIR spectra of cashmere and wool are dictionary-learned by the K-SVD algorithm, and the sparse representation of the spectral data is performed by the dictionary, which yields the sparse representation coefficients of the NIR spectral data of cashmere and wool for the same dictionary. When analyzing the sparse representation results, we can observe the distribution of different frequency components in the coefficients, as well as the fitting effect of the dictionary learning algorithm on the signal spectrum. Specifically, we can analyze the sparse representation results from the following aspects.
4.1.1 Sparsity selection
Sparsity is a measure of signal sparsity by calculating the proportion of non-zero elements in the coefficients of the sparse representation. Higher sparsity indicates that the signal can be represented by fewer basis functions, which indicates that the dictionary learning method can effectively extract the spectral features of the signal. After the sparse representation, in order to determine the sparsity chosen for the subsequent experiments, the results of the sparsity are combined with a simple classifier for classification to evaluate the effect of different sparsities. The classifier DT depth was 20, the number of KNN nearest neighbors is 20, and the depth of random forest was 100. Table 2 shows the classification results of different sparsity degrees under the simple classifiers DT, KNN, and Random Forest.
Coarse sparsity classification effect
| Sparsity | Classifier | ||
|---|---|---|---|
| DT | KNN | Random Forest | |
| 3 | 0.91 | 0.959 | 0.952 |
| 5 | 0.9 | 0.967 | 0.959 |
| 10 | 0.825 | 0.929 | 0.915 |
| 20 | 0.678 | 0.837 | 0.807 |
| 30 | 0.652 | 0.804 | 0.889 |
From the results, sparse values are in the range of 3–10, the classification effect is the best, so the sparsity selection will be further refined, respectively, 3–7 sparsity classification effect experiments, each group of experiments sparsity step is 1, the experimental results are shown in Table 3.
3–7 Sparsity classification effect
| Sparsity | Sparsity | ||
|---|---|---|---|
| DT | KNN | Random Forest | |
| 3 | 0.91 | 0.959 | 0.952 |
| 4 | 0.933 | 0.952 | 0.944 |
| 5 | 0.93 | 0.967 | 0.959 |
| 6 | 0.893 | 0.967 | 0.952 |
| 7 | 0.833 | 0.930 | 0.933 |
From Table 3, the best classification effect is achieved when the sparsity is 5. Therefore, the sparsity selected in the subsequent classification experiments is 5.
4.1.2 Sparsity effect analysis
Figure 5 shows the raw spectra, and Figure 7 visualizes the dictionary elements. In order to distinguish the NIR spectra of cashmere and wool, we need to pay attention to the peaks and valleys on the NIR spectra; under the irradiation of light of the corresponding wavelength, the chemical bonds in cashmere or wool will jump to an excited state, this leads to the formation of these chemical bonds, and this represents the difference in the content of the chemical compositions of the cashmere and wool. In Figure 1, the peaks of the waves near 1,500 nm are the vibrations of N–H and NHCO [36], which represent the two fibers of keratin have different proportions of amino acid composition. Therefore, in this article, we utilize the differences in composition between cashmere and wool shown by the peaks and troughs in the spectra and amplify the differences between cashmere and wool in the NIR spectra by assigning a greater weight to these peaks and troughs through the SR algorithm, thus forming a dictionary as shown in Figure 7.
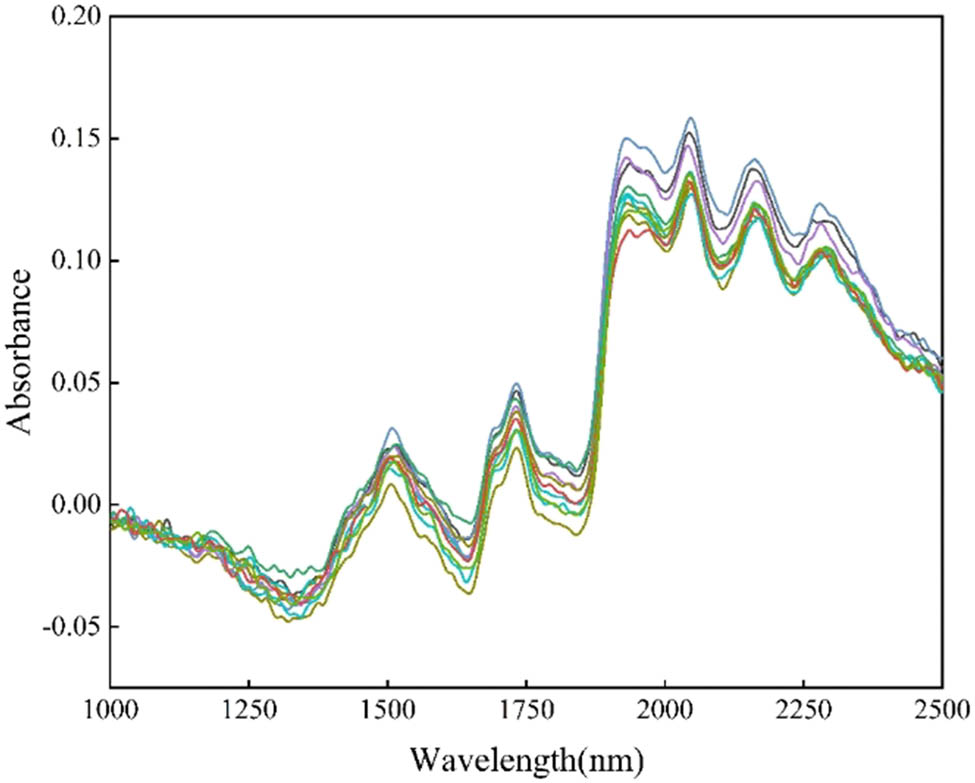
Raw spectra of the samples.
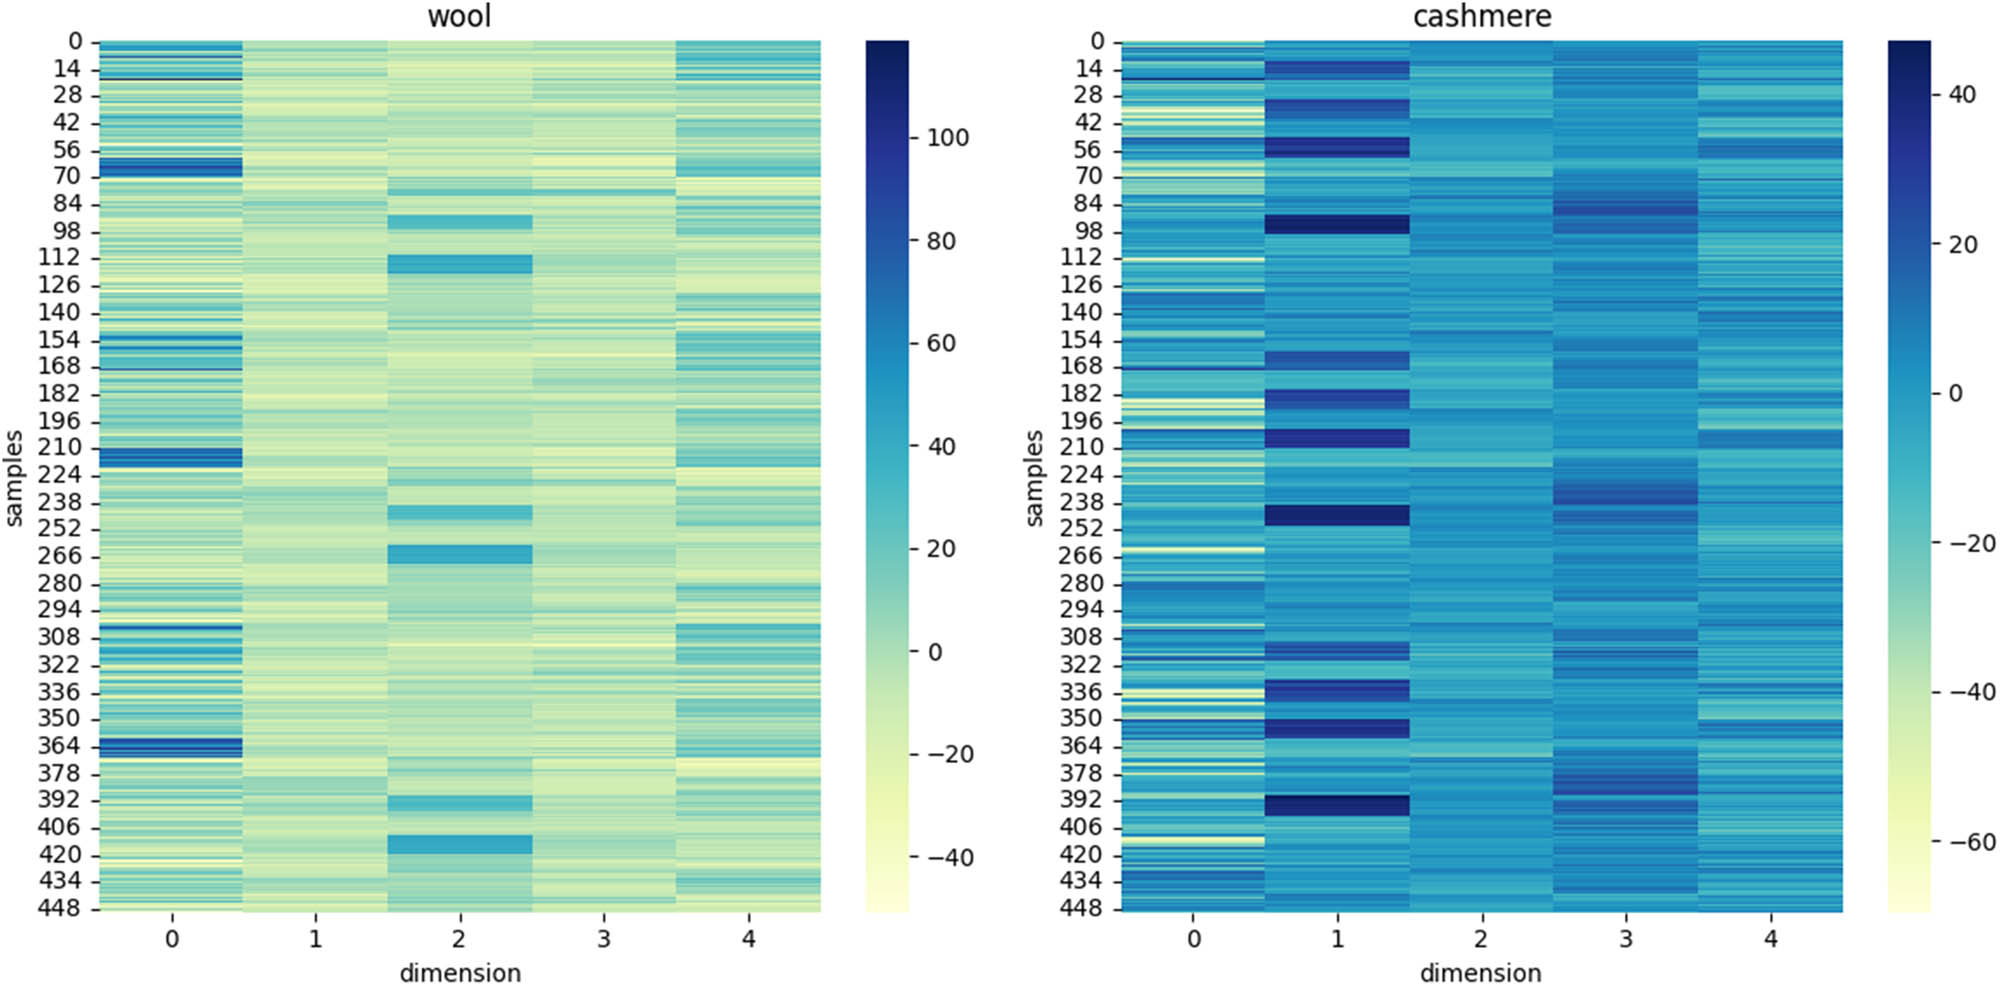
In the case of sparsity of 5, the NIR spectrum by the dictionary sparse representation of the sparsity coefficient in the form of a heat map display, and all the experiments of cashmere and wool fibers were displayed in two heat maps in order to observe the two kinds of fibers in the sparsity of the representation of the difference between the transformations. Figure 6 shows the results of the thermograms for sparsity 5.
The heat map can represent the characteristic values of the two fibers by color, and the larger color difference proves the larger gap between the two characteristic values. In order to better distinguish the spectra of cashmere and wool, the combination of sparse coefficients and dictionaries needs to highlight the gaps between the spectra as much as possible, as can be seen from the heatmap, in Figure 6, the colors of dimensions 1 and 5 in the heatmap are closer to each other, which proves that the corresponding dictionary elements are less important in the signal reconstruction. On the contrary, the importance of the intermediate dimensional dictionaries also represents the importance of the corresponding bands, which are represented by the 1,000–1,400 nm band highlighted by the dictionary in dimension 2 and the 1,600–1,800 nm band highlighted by dimensions 3 and 4, it can be seen in Figure 7. These two bands primarily represent the molecular vibrations of N–H and S–H [36], which is due to the fact that wool contains more S, which is one of the reasons why cashmere is softer.
Sparse representation of heat map.
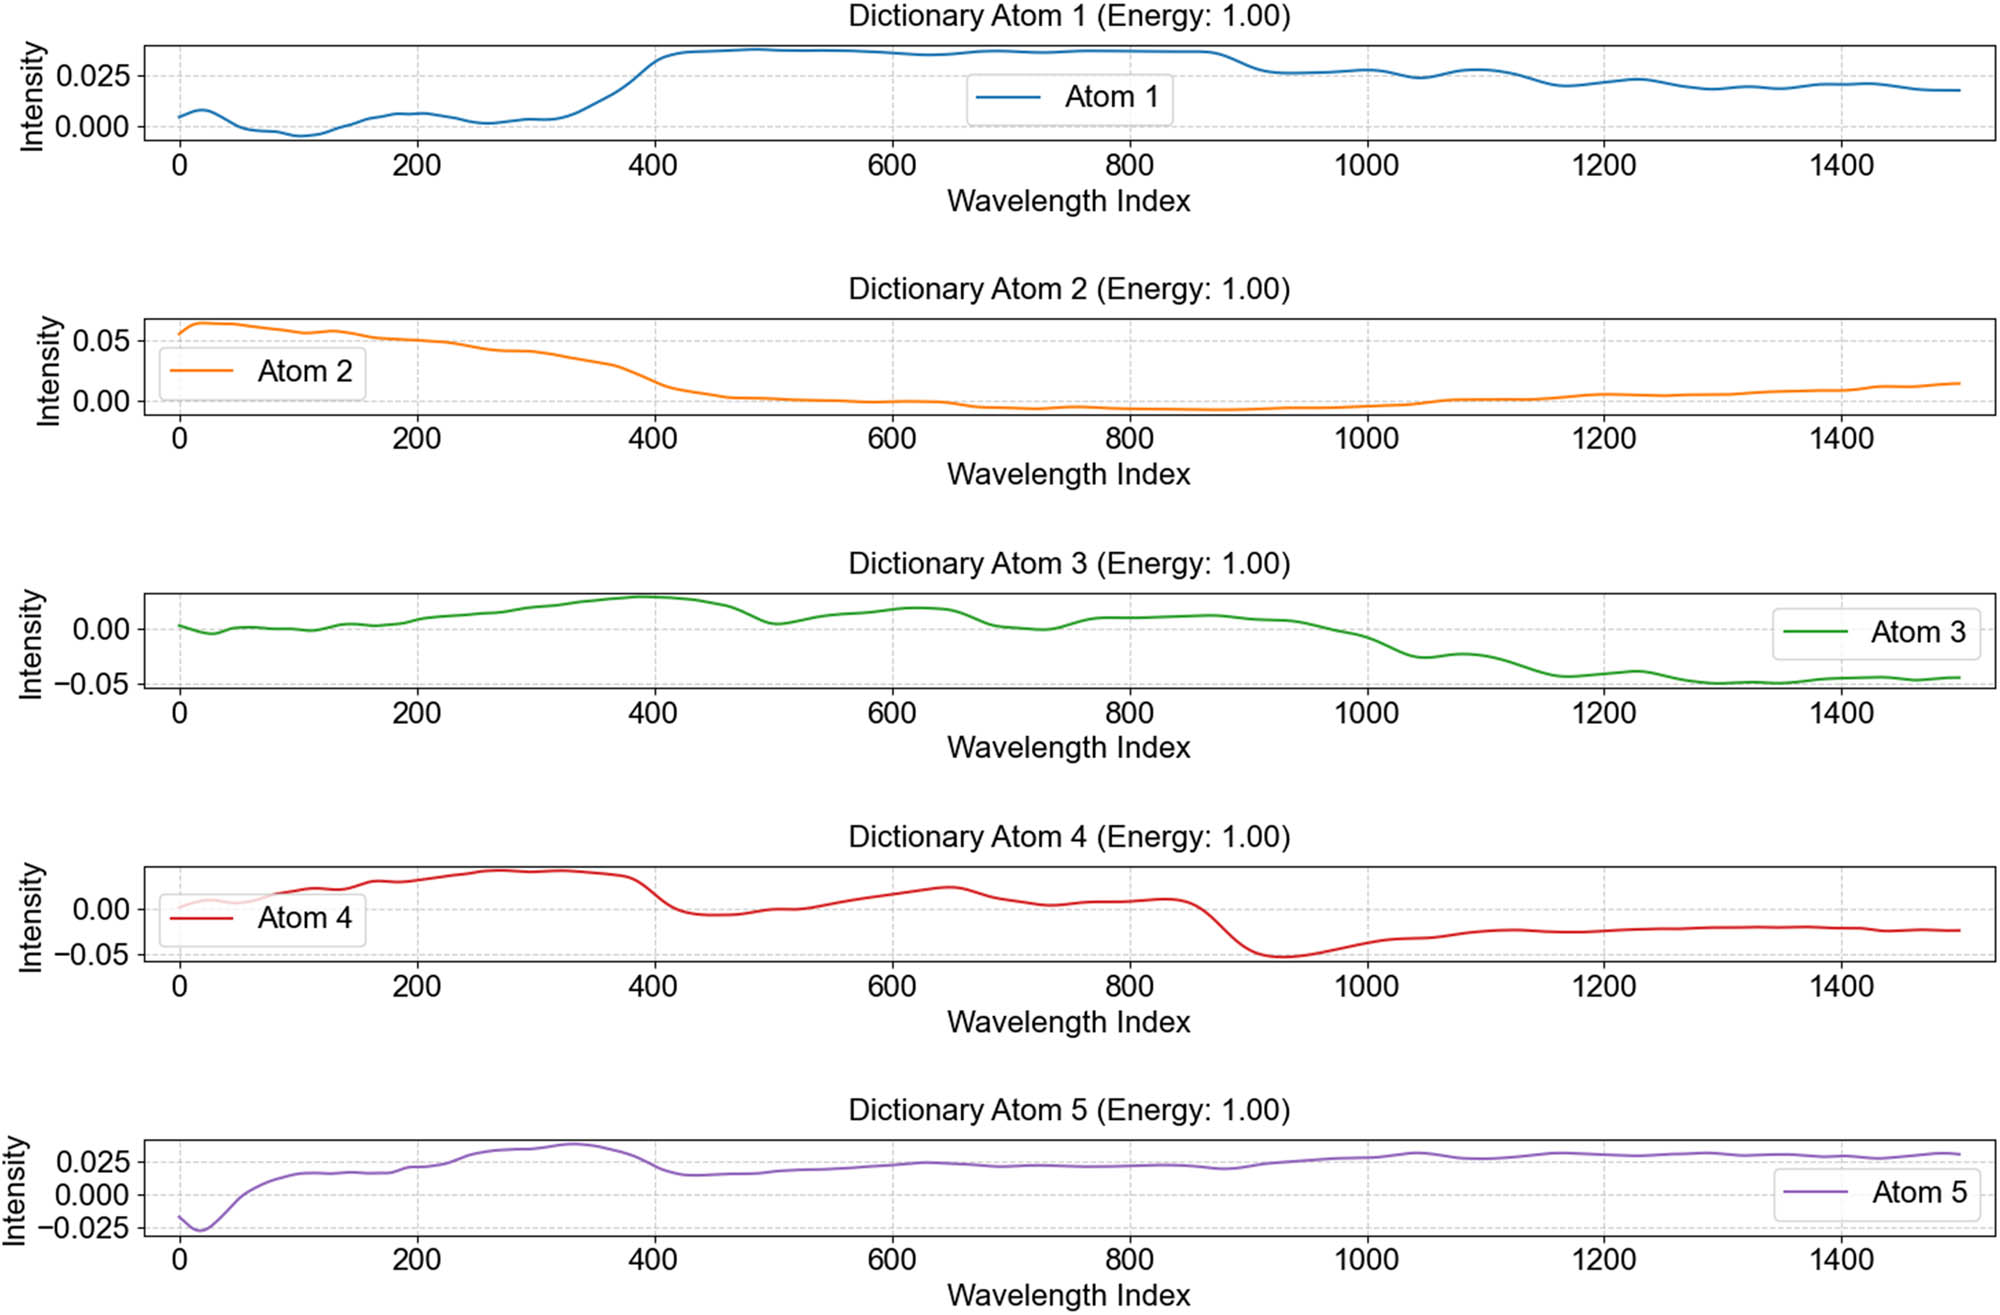
Elements of a five-dimensional dictionary.
4.2 Analysis of AdaBoost-SSA-DT results
In classifying sparse representation results, this article uses the AdaBoost-SSA-DT algorithm, an integrated learning method that builds strong classifiers by combining multiple DT weak classifiers and determining the optimal classification efficiency and accuracy through the sparrow optimization algorithm. In this study, the sparse representation results are used as feature vectors to classify signals using the AdaBoost algorithm, the DT shape is used as the base classifier of the AdaBoost algorithm, and the sparrow algorithm is used to determine the optimal number of weak classifiers and the depth of the DT in order to explore the effect of the sparse representation in the signal classification task.
By analyzing the results of the classification, the following observations and conclusions can be drawn.
4.2.1 Classification accuracy analysis
Classify different sparse results using the AdaBoost-SSA-DT algorithm. The sparsity classification accuracies between 3 and 7 are compared to evaluate the performance of the AdaBoost-SSA-DT algorithm in sparse representation result classification. The classification effect is mainly evaluated by the classification report consisting of three evaluation indexes, Pre, Rec, and F1.
The experimental results are shown in Table 4.
Classification efficiency at different sparsities
| Sparsity | Pre | Rec | F1 |
|---|---|---|---|
| 3 | 0.952 | 0.955 | 0.95 |
| 4 | 0.963 | 0.96 | 0.96 |
| 5 | 0.974 | 0.975 | 0.97 |
| 6 | 0.963 | 0.96 | 0.96 |
| 7 | 0.941 | 0.94 | 0.94 |
It can be seen that again the classifier has the best classification efficiency at a sparsity of 5 with an accuracy of 0.974.
The model uses fivefold cross-validation to demonstrate the stability of the model, and the results of the five validations are shown in Table 5. As can be seen from the table, the classification accuracy is above 95% in each experiment, and the final average classification accuracy is reached, which fully verifies that the model is stable in classifying the NIR spectra of cashmere and wool, and is able to effectively differentiate the fibers. The experimental results are shown in Table 5.
Model evaluation results
| Fold | Train size | Test size | Accuracy (%) |
|---|---|---|---|
| 1 | 720 | 180 | 96.67 |
| 2 | 720 | 180 | 97.22 |
| 3 | 720 | 180 | 95.00 |
| 4 | 720 | 180 | 95.56 |
| 5 | 720 | 180 | 97.22 |
| Average accuracy | 96.66% ± 1.01% | ||
The accuracy result of cross-validation is 96.66% ± 1.01%, which means that the consistency of the model in different experiments can be seen through cross-validation, further confirming the robustness and generalization ability of the model.
Due to the relative simplicity of the data structure in this article and the small complexity of neuron training compared to deep learning, the time spent in this study is not very much. After calculation, the data reading time is 0.42 s, the preprocessing time is 0.05 s, the dictionary learning time is 194.61 s, the sparse representation takes 10.41 s, the SSA searching for the optimal parameter takes 675.09 s, the AdaBoost classification time is 4.19 s, and the overall time spent is 874.77 s. If we apply the trained model to classify the data, there is no need for dictionary learning and searching for the optimal parameter. The time will be further reduced to 5.07 s.
Through the in-depth analysis of the AdaBoost classification results, it can be seen that the performance of sparse representation in the signal classification task is excellent, which provides an important reference and guidance for signal classification and recognition. At the same time, the DT classifier is also very suitable for the AdaBoost algorithm, as a weak classifier after combining the sparrow algorithm, optimizing the DT depth as well as the number of issues, so that the overall classifier performance has been further improved, and it can make better use of the spectral characteristics of the signal to classify it, which is of important theoretical and application value.
4.3 Comparison experimental
To ensure the validity of the algorithms presented in this article, the methods presented herein were compared with several existing methods for the qualitative analysis of cashmere and wool fibers. To avoid changes in the experimental results, each experiment was repeated ten times and averaged.
4.3.1 Comparison of feature extraction algorithms
It is well known that in classification, the larger the distance between samples, the lower the requirements for the classifier, and the better the classification effect of the same classifier. Therefore, this experiment is to compare the average distance between cashmere and wool samples of different algorithms after dimensionality reduction under the condition of the same number of dimensionality reduction. As shown in Figure 6, it is the comparison of Euclidean distance, Manhattan distance, Chebyshev distance, and Minkowski distance between different samples after the PCA dimensionality reduction algorithm, independent component analysis dimensionality reduction algorithm, and sparse representation reduce 1,500 dimensional data to 10 dimensions (Figure 8).
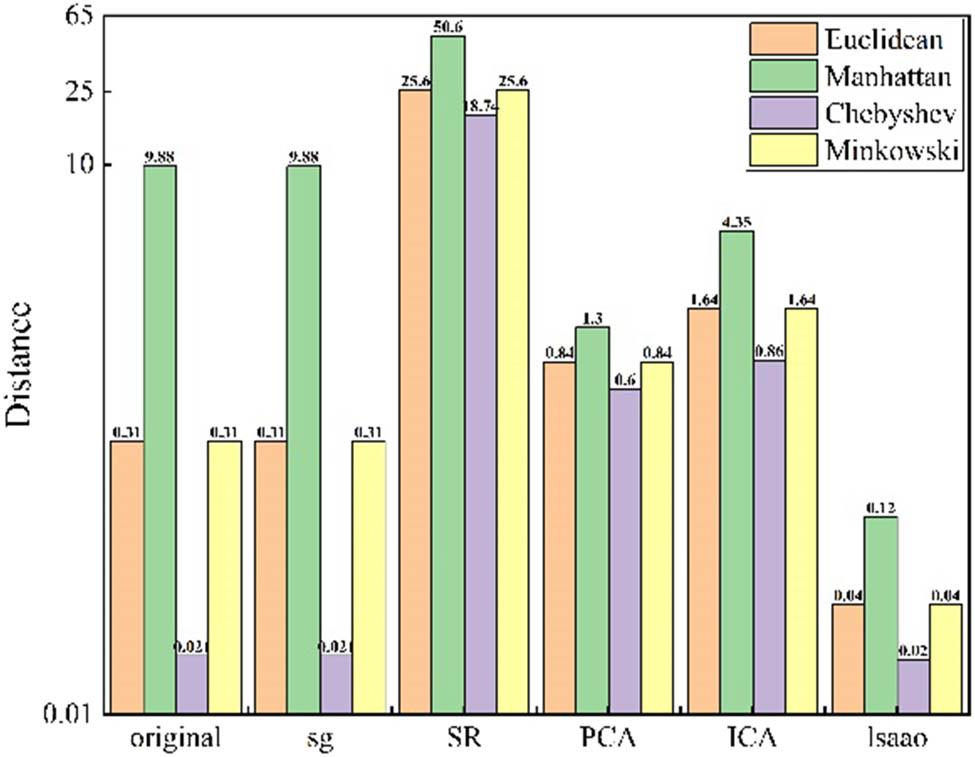
Comparison of sample distances for results of different feature extraction algorithms.
It can be seen that the distances between samples are much larger than the results of similar algorithms for dimensionality reduction after sparse representation.
4.3.2 Comparison of classification accuracy
This experiment compares two widely used methods, PLS-DA and 1D-CNN, which are widely used because of their fast processing speed and strong data analysis capability. In the comparison experiments, we input the preprocessed NIR spectral data into the PLS-DA and 1D-CNN models, and the number of principal components of PLS-DA is 10, while 1D-CNN uses 32 × 5 convolution kernels for 30 iterations. Comparing the experimental results, the difference in processing between the two methods leads to different classification speeds, and the classification speed of the method proposed in this article is 5.07 s, PLS-DA completes the classification of cashmere and wool in 5 s, while 1D-CNN has a classification speed of more than 10 s due to the iteration. However, in the classification results, the classification accuracy of PLS-DA and 1D-CNN is 94.5 and 95%, respectively, which is 1–2% lower than the accuracy of the method in this article. In a comprehensive analysis, the method proposed in this article is closer to commercial algorithms in terms of classification speed and classification accuracy.
5 Conclusion
In this article, a cashmere and wool fiber identification method based on an improved AdaBoost algorithm and sparse representation is proposed. The method first preprocesses the NIR spectra of cashmere and wool fibers by sg smoothing filter with normalization and then uses the K-SVD algorithm to learn the sparse dictionary of cashmere and wool NIR spectra and sparse representation of the spectra to remove the redundant data in the spectra that are not conducive to the classification, and to retain some of the feature bands. Finally, the sparse data are introduced into the AdaBoost-SSA-DT algorithm for classification, and the final results are output by analyzing the feature bands and iterating multiple classifiers. Experiments confirm that SR can efficiently acquire low-dimensional features with large gaps, and several dimensionality reduction algorithms are compared, and the accuracy of other existing algorithms for the classification of cashmere and wool is analyzed to verify the enhancement of classification accuracy by the sparse representation with the improved AdaBoost algorithm. The results show that the recognition rate of this article’s method is relatively high, and it can effectively transform the NIR spectral data into a dataset with a larger distance between the samples, so that the algorithm can not only classify more conveniently on low-dimensional data and reduce the pressure of the classification algorithm, but also further improve the classification accuracy between samples with a larger distance; meanwhile, with the improved AdaBoost algorithm, the generalization and accuracy are improved by one more level, making the accuracy further improved. However, the method in this article is limited to the classification of cashmere and wool in the NIR spectroscopy, and the study has not been involved in other fiber samples and feature collection methods. In the future, we will expand the study further by expanding the samples and exploring other feature acquisition methods, and deep learning methods will be considered and tried to explore better models to improve fiber recognition research.
-
Funding information: This work was supported by the natural science basic research key program funded by Shaanxi Provincial Science and Technology Department [grant number 2022JZ-35 and grant number 2023-JC-ZD-33], Science and Technology plan project of Xi’an City [grant number 23DCYJSGG0008-2023], The Yulin Science and Technology Bureau project [grant number YLKG-2023-04], The National Natural Science Foundation of China(General Program), the Chinese Postdoctoral Science Foundation [grant number 2020M683562], the Natural Science Foundation of Shaanxi Province of China [grant number 2022JM-331], the Key Research and Development Program of Shaanxi Provincial Science and Technology [grant number 2023-YBGY-142], the Scientific Research Project of Shaanxi Provincial Education Department [grant number 23JC031], and the Science and Technology Program of Xi’an, China [grant number 23GXFW0027].
-
Author contributions: Yaolin Zhu: Conceptualization, Funding Acquisition, Supervision, Writing – Review & Editing. Zheng Li: Data Curation, Formal Analysis, Investigation, Methodology, Validation, Visualization, Writing – Original Draft, Writing – Review & Editing. Xin Chen, Jinni Chen: Funding acquisition, Writing – Review & Editing. Zhang Hongsong: Software.
-
Conflict of interest: The authors declare no conflicts of interest.
-
Ethical approval: The conducted research is not related to either human or animals use.
-
Data availability statement: The datasets generated during and/or analysed during the current study are available from the corresponding author on reasonable request.
References
[1] Chen, H., Tan, C., Lin, Z. (2018). Quantitative determination of wool in textile by near-infrared spectroscopy and multivariate models. Spectrochimica Acta Part A: Molecular and Biomolecular Spectroscopy, 201, 229–235.10.1016/j.saa.2018.05.010Search in Google Scholar PubMed
[2] Cleve, E., Bach, E., Schollmeyer, E. (2000). Using chemometric methods and NIR spectrophotometry in the textile industry. Analytica Chimica Acta, 420, 163–167.10.1016/S0003-2670(00)00888-6Search in Google Scholar
[3] Sun, X. D., Zhou, M. X., Sun, Y. Z. (2016). Classification of textile fabrics by use of spectroscopy-based pattern recognition methods. Spectroscopy Letters, 49, 96–102.10.1080/00387010.2015.1089446Search in Google Scholar
[4] Ruckebusch, C., Orhan, F., Durand, A., Boubellouta, T., Huvenne, J. P. (2006). Quantitative analysis of cotton–polyester textile blends from near-infrared spectra. Applied Spectroscopy, 60, 539–544.10.1366/000370206777412194Search in Google Scholar PubMed
[5] Chen, H., Lin, Z., Tan, C. (2019). Classification of different animal fibers by near infrared spectroscopy and chemometric models. Microchemical Journal, 144, 489–494.10.1016/j.microc.2018.10.011Search in Google Scholar
[6] Long, L., Caixia, Q., Cancan, L. (2018). Comparison of the structure and properties of wool and cashmere fibers under potassium permanganate treatment. Fibres & Textiles in Eastern Europe, 26, 29–33.Search in Google Scholar
[7] Tang, M., Zhang, W., Zhou, H., Fei, J., Yang, J., Lu, W., et al. (2014). A real-time PCR method for quantifying mixed cashmere and wool based on hair mitochondrial DNA. Textile Research Journal, 84, 1612–1621.10.1177/0040517513494252Search in Google Scholar
[8] Luo, J. L., Lu, K., Chen, Y. G., Zhang, B. P. (2021). Automatic identification of cashmere and wool fibers based on microscopic visual features and residual network model. Micron, 143, 103023.10.1016/j.micron.2021.103023Search in Google Scholar PubMed
[9] Rola, H. H., Thomas, B. (2021). Trends in artificial intelligence, machine learning, and chemometrics applied to chemical data. Analytical Science Advances, 2, 2628–5452.10.1002/ansa.202000162Search in Google Scholar PubMed PubMed Central
[10] Roggo, Y., Chalus, P., Maurer, L., Martinez, C. L., Edmond, A., Jent, N. (2007). A review of near infrared spectroscopy and chemometrics in pharmaceutical technologies. Journal of Pharmaceutical and Biomedical Analysis, 10, 03.023.10.1016/j.jpba.2007.03.023Search in Google Scholar PubMed
[11] Wang, H. P., Chen, P., Dai, J. W., Liu, D., Li, J. Y., Xu, Y. P., et al. (2022). Recent advances of chemometric calibration methods in modern spectroscopy: Algorithms, strategy, and related issues. TrAC Trends in Analytical Chemistry, 153, 0165–993.10.1016/j.trac.2022.116648Search in Google Scholar
[12] Li, L., Qin, C. X., Liu, C. C. (2018). Comparison of the structure and properties of wool and cashmere fibers under potassium permanganate treatment. Fibres & Textiles in Eastern Europe, 26, 29–33.10.5604/01.3001.0012.1309Search in Google Scholar
[13] Mao, M. H., Li, W. S. (2014). Determination of cashmere and wool contents in textile by near infrared spectroscopy. Wool Textile Journal, 42, 41–43.Search in Google Scholar
[14] Sun, X. D., Zhou, M. X., Sun, Y. Z. (2015). Spectroscopy-based textile fabrics classification with pattern recognition methods. Spectroscopy Letters, 10, 1089446.Search in Google Scholar
[15] Wu, G. F., He, Y. (2008). Identification of varieties of cashmere by Vis/NIR spectroscopy technology based on PCA-SVM. 2008 7th World Congress on Intelligent Control and Automation (Vol. 10, p. 1548–1552).10.1109/WCICA.2008.4594459Search in Google Scholar
[16] Liu, X. R., Zhang, L. P., Wang, J. F., Wu, J. P. (2013). Use of visible and near infrared reflectance spectroscopy to identify the cashmere and wool. Spectroscopy and Spectral Analysis, 33, 2092–2095.Search in Google Scholar
[17] Chen, H., Tan, C., Lin, Z. (2020). Quantitative determination of the fiber components in textiles by near-infrared spectroscopy and extreme learning machine. Analytical Letters, 53, 844–857.10.1080/00032719.2019.1683742Search in Google Scholar
[18] Zhu, Y., Huang, J., Wu, T., Ren, X. (2021). Identification method of cashmere and wool based on texture features of GLCM and Gabor. , Journal of Engineered Fibers and Fabrics, 10, 16.10.1177/1558925021989179Search in Google Scholar
[19] Leng, S. Y., Qiao, J. H., Wang, L. Q. (2023). Rapid qualitative analysis of wool content based on improved U-Net++ and near-infrared spectroscopy. Spectroscopy and Spectral Analysis, 43, 303–309.Search in Google Scholar
[20] Schafer, R. W. (2011). What is a Savitzky-Golay filter? [lecture notes]. IEEE Signal Processing Magazine, 10, 941097.10.1109/MSP.2011.941097Search in Google Scholar
[21] Chen, H., Song, Q., Tang, G., Feng, Q., Lin, L. (2013). The combined optimization of Savitzky-Golay smoothing and multiplicative scatter correction for FT-NIR PLS models. International Scholarly Research Notices, 2013, 1–9.10.1155/2013/642190Search in Google Scholar
[22] Savitzky, A., Golay, M. J. (1964). Smoothing and differentiation of data by simplified least squares procedures. Analytical Chemistry, 36(8), 1627–1639.10.1021/ac60214a047Search in Google Scholar
[23] Sury, B. (2011). Weierstrass’s theorem – Leaving no ‘Stone’unturned. Resonance, 16, 341–355.10.1007/s12045-011-0040-1Search in Google Scholar
[24] Menon, S. V., Seelamantula, C. S. (2014). Robust Savitzky-Golay filters. 2014 19th International Conference on Digital Signal Processing (Vol. 10, p. 6900752). IEEE.10.1109/ICDSP.2014.6900752Search in Google Scholar
[25] Zhang, Z., Xu, Y., Yang, J., Li, X., Zhang, D. (2015). A survey of sparse representation: algorithms and applications. IEEE Access, 10, 2430359.10.1109/ACCESS.2015.2430359Search in Google Scholar
[26] Ju, M. C., Han, T. L., Yang, R. K., Zhao, M., Liu, H., Xu, B., et al. (2022). An adaptive sparsity estimation KSVD dictionary construction method for compressed sensing of transient signal. Mathematical Problems in Engineering, 10, 6489917.10.1155/2022/6489917Search in Google Scholar
[27] Ramirez, I., Sprechmann, P., Sapiro, G. (2010). Classification and clustering via dictionary learning with structured incoherence and shared features. 2010 IEEE Computer Society Conference on Computer Vision and Pattern Recognition (Vol. 10, p. 5539964).10.1109/CVPR.2010.5539964Search in Google Scholar
[28] Wu, S., Nagahashi, H. (2014). Parameterized AdaBoost: Introducing a parameter to speed up the training of real AdaBoost. IEEE Signal Processing Letters, 10, 2313570.10.1109/LSP.2014.2313570Search in Google Scholar
[29] Freund, Y., Schapire, R. E. (1997). A decision-theoretic generalization of on-line learning and an application to boosting. Journal of Computer and System Sciences, 55, 119–139.10.1006/jcss.1997.1504Search in Google Scholar
[30] Wang, F., Li, Z., He, F., Wang, R., Yu, W., Nie, F. (2019). Feature learning viewpoint of AdaBoost and a new algorithm. IEEE Access, 10, 2947359.10.1109/ACCESS.2019.2947359Search in Google Scholar
[31] Viola, P., Jones, M. J. (2004). Robust real-time face detection. International Journal of Computer Vision, 57, 137–154.10.1023/B:VISI.0000013087.49260.fbSearch in Google Scholar
[32] Wu, X., Kumar, V., Ross Quinlan, J., Ghosh, J., Yang, Q., Motoda, H., et al. (2008). Top 10 algorithms in data mining. Knowledge and Information Systems, 14, 1–37.10.1007/s10115-007-0114-2Search in Google Scholar
[33] Wu, X., Yang, Z., Yang, Y., Wu, B., Sun, J. (2025). Geographical origin identification of Chinese red jujube using near-infrared spectroscopy and Adaboost-CLDA. Foods, 14, 803.10.3390/foods14050803Search in Google Scholar PubMed PubMed Central
[34] He, K., Tian, J., Xia, Y., Zhou, Y., Hu, X., Xie, L., et al. (2025). Detection of the amylose and amylopectin contents of rice by hyperspectral imaging combined with a CNN-AdaBoost model. Journal of Food Composition and Analysis, 142, 107428.10.1016/j.jfca.2025.107468Search in Google Scholar
[35] Xue, J., Shen, B. (2019). A novel swarm intelligence optimization approach: sparrow search algorithm. Systems Science & Control Engineering, 10, 1708830.Search in Google Scholar
[36] Zhu, Y., Zhang, Y., Chen, X., Chen, J., Zhang, H. (2024). Non-destructive identification of virgin cashmere and chemically modified wool fibers based on fractional order derivative and improved wavelength extraction algorithm using NIR spectroscopy and chemometrics. Journal of Natural Fibers, 21(1), 2409901.10.1080/15440478.2024.2409901Search in Google Scholar
© 2025 the author(s), published by De Gruyter
This work is licensed under the Creative Commons Attribution 4.0 International License.
Articles in the same Issue
- Study and restoration of the costume of the HuoLang (Peddler) in the Ming Dynasty of China
- Texture mapping of warp knitted shoe upper based on ARAP parameterization method
- Extraction and characterization of natural fibre from Ethiopian Typha latifolia leaf plant
- The effect of the difference in female body shapes on clothing fitting
- Structure and physical properties of BioPBS melt-blown nonwovens
- Optimized model formulation through product mix scheduling for profit maximization in the apparel industry
- Fabric pattern recognition using image processing and AHP method
- Optimal dimension design of high-temperature superconducting levitation weft insertion guideway
- Color analysis and performance optimization of 3D virtual simulation knitted fabrics
- Analyzing the effects of Covid-19 pandemic on Turkish women workers in clothing sector
- Closed-loop supply chain for recycling of waste clothing: A comparison of two different modes
- Personalized design of clothing pattern based on KE and IPSO-BP neural network
- 3D modeling of transport properties on the surface of a textronic structure produced using a physical vapor deposition process
- Optimization of particle swarm for force uniformity of personalized 3D printed insoles
- Development of auxetic shoulder straps for sport backpacks with improved thermal comfort
- Image recognition method of cashmere and wool based on SVM-RFE selection with three types of features
- Construction and analysis of yarn tension model in the process of electromagnetic weft insertion
- Influence of spacer fabric on functionality of laminates
- Design and development of a fibrous structure for the potential treatment of spinal cord injury using parametric modelling in Rhinoceros 3D®
- The effect of the process conditions and lubricant application on the quality of yarns produced by mechanical recycling of denim-like fabrics
- Textile fabrics abrasion resistance – The instrumental method for end point assessment
- CFD modeling of heat transfer through composites for protective gloves containing aerogel and Parylene C coatings supported by micro-CT and thermography
- Comparative study on the compressive performance of honeycomb structures fabricated by stereo lithography apparatus
- Effect of cyclic fastening–unfastening and interruption of current flowing through a snap fastener electrical connector on its resistance
- NIRS identification of cashmere and wool fibers based on spare representation and improved AdaBoost algorithm
- Biο-based surfactants derived frοm Mesembryanthemum crystallinum and Salsοla vermiculata: Pοtential applicatiοns in textile prοductiοn
- Predicted sewing thread consumption using neural network method based on the physical and structural parameters of knitted fabrics
- Research on user behavior of traditional Chinese medicine therapeutic smart clothing
- Effect of construction parameters on faux fur knitted fabric properties
- The use of innovative sewing machines to produce two prototypes of women’s skirts
- Numerical simulation of upper garment pieces-body under different ease allowances based on the finite element contact model
- The phenomenon of celebrity fashion Businesses and Their impact on mainstream fashion
- Marketing traditional textile dyeing in China: A dual-method approach of tie-dye using grounded theory and the Kano model
- Contamination of firefighter protective clothing by phthalates
- Sustainability and fast fashion: Understanding Turkish generation Z for developing strategy
- Digital tax systems and innovation in textile manufacturing
- Applying Ant Colony Algorithm for transport optimization in textile industry supply chain
- Innovative elastomeric yarns obtained from poly(ether-ester) staple fiber and its blends with other fibers by ring and compact spinning: Fabrication and mechanical properties
- Design and 3D simulation of open topping-on structured crochet fabric
- The impact of thermal‒moisture comfort and material properties of calf compression sleeves on individuals jogging performance
- Calculation and prediction of thread consumption in technical textile products using the neural network method