Optimal dimension design of high-temperature superconducting levitation weft insertion guideway
-
Chengjun Zhang
 ,
Chi Zhang
,
Chi Zhang

Abstract
To address the issues of friction, heat generation, and noise associated with traditional shuttle systems during flight, this article proposes a high-temperature superconducting (HTS) shuttle that stably levitates above a Halbach permanent magnet guideway (PMG) without energy consumption. The levitation force experienced by the superconductor is closely related to the dimensions of both the PMG and the superconductor. To ensure the stability of the shuttle’s levitation during the weaving process, an optimization method that considers both the levitation force and material usage is proposed. The ratio of the levitation force per unit length of the superconductor (F Z ) to the PMG’s height (h pm) is defined as F h , with the optimal height of the PMG occurring when F h is maximized. Based on this, simulations were conducted to analyze the trend of levitation force changes with variations in guideway’s width, height, and superconductor material’s thickness. Finally, an experimental platform was built to verify the accuracy of the simulation results. The findings indicate that rational optimization of guideway dimensions can enhance the system’s levitation performance while optimizing material usage, with the optimized guideway providing significantly enhanced levitation force. This study offers theoretical and practical guidance for the design and application of HTS levitation guideways.
1 Introduction
The increasing demand for wide-width fabrics [1] in the textile industry has led to the widespread application of shuttle looms, which are characterized by their wide width, low-speed weft insertion, broad adaptability to different yarn types, and precisely controlled weft tension [2,3]. In traditional shuttle looms, weft insertion is achieved by a torsion shaft providing initial velocity to the shuttle, which introduces issues such as excessive impact force, significant noise, and low efficiency [4]. Additionally, shuttle looms face limitations during the weft insertion process due to speed decay and the increasing weight of the inserted weft yarn, causing the shuttle to descend within the shed space and shortening the weft insertion length, which limits the fabric width. Furthermore, friction between the shuttle and the guide can result in yarn breakage [5], adversely affecting both weft insertion speed and fabric quality. These issues directly impact the performance and production efficiency of shuttle looms.
With the rapid development of electromagnetic launch technology [6,7], several studies have explored integrating electromagnetic technology into textile machinery to increase the weft insertion width of shuttle looms. Qiao et al. [8] and Jordan et al. [9] investigated the interaction between the magnetic field generated by electromagnetic coils and the shuttle, providing a higher initial velocity to the shuttle and enabling it to cover a longer distance within the same time, thus increasing weft insertion width. Mirjalili developed a model for an electromagnetic weft insertion system and analyzed the impact of various parameters on system performance [10]. Building on this, Owlia et al. employed electromagnetic launchers to accelerate ferromagnetic projectiles attached to yarn, studying projectile velocity under different coil parameters and developing an adaptive neural network model for accurately predicting projectile speed [11,12,13]. Xu et al. proposed a segmented and continuously accelerating electromagnetic weft insertion design and optimized parameters to enhance the initial speed of shuttle weft insertion [14]. However, in current research on electromagnetic launch-based weft insertion systems, peak acceleration during insertion often results in yarn fraying and breakage issues [15]. Zhang et al. introduced a novel levitation-based weft insertion method using high-temperature superconducting (HTS) magnetic levitation and permanent magnet synchronous motor technology, designing a superconducting magnetic levitation weft insertion guideway structure and validating its feasibility through simulation analysis [16]. Nevertheless, this approach did not analyze the levitation characteristics of the shuttle, nor did it examine the parameters of the levitation guideway.
To address the limitations of conventional permanent magnetic guideways, a Halbach permanent magnet guideway (PMG) is introduced to enhance the levitation performance of HTS magnetic levitation systems [17]. Luo et al. developed analytical models for the Halbach array through surface current methods [18], while an analytical model was proposed based on the virtual work principle [19], which involves higher computational complexity. Earlier research [20,21] relied on empirical formulas or intricate algorithms for calculations. However, these approaches demand significant programming skills and computational resources, highlighting the need for a simplified magnetic force model to provide a theoretical foundation for PMG design.
The stable levitation of the shuttle is essential for achieving effective weft insertion. Based on the structure of the HTS magnetic levitation weft insertion guideway system, this study leverages the Meissner effect and flux pinning properties of HTS materials to optimize the dimensions of the shuttle and the levitation guideway. The shuttle is simplified as a high-temperature superconductor, and a three-dimensional (3D) model of the levitation system is established in simulation software. By maintaining a constant levitation height and systematically varying the height of the PMG, the width of the side magnets, the width of the central magnet, and the thickness of the superconductor, we compare the levitation forces acting on the optimized and unoptimized superconductors. Simulation results indicate that proper optimization of the PMG dimensions enhances both the levitation performance and stability of the system while optimizing material usage, with the optimized guideway providing significantly enhanced levitation force. An experimental platform was built to further validate the accuracy of this approach, providing valuable insights for designing HTS magnetic levitation weft insertion guideway structures.
2 Structure of HTS levitation weft insertion
Traditional looms face the problem of limited fabric width due to speed decay during weft insertion, along with issues such as high energy consumption, high noise, and short lifespan of the equipment. To address these problems, a novel weft insertion method is proposed based on the working principle of traditional looms, utilizing HTS magnetic levitation technology and permanent magnet synchronous motor drive technology. As shown in Figure 1, the HTS levitation weft insertion guideway system consists of an HTS shuttle, two levitation guideways, and one weft insertion guideway. The levitation guideways are composed of permanent magnet arrays, which generate a stable magnetic field through the proper arrangement of magnets, providing levitation force for the shuttle. The stable levitation of the shuttle is the foundation for effective weft insertion, and this study focuses on optimizing the dimensions of the shuttle and levitation guideways.

Structure diagram of the levitation weft insertion guideway system.
In HTS magnetic levitation systems, the levitation guideways are typically constructed using permanent magnets arranged in a Halbach array with different magnetization directions. This arrangement effectively enhances the magnetic field while making the field distribution more uniform and increasing the utilization of the magnetic field [22]. When the shuttle is placed above the permanent magnet array guideway, the magnetic field from the permanent magnets induces a current in the superconducting block, generating a force that interacts with the magnetic field. Due to the combined effects of the Meissner effect and flux pinning effect, the levitation force provided allows the superconducting block to stably levitate above the permanent magnet array guideway, creating a frictionless levitation state.
3 Mathematical model of permanent magnet array guideways
3.1 Solution to the spatial magnetic field of the permanent magnet array guideway
The shuttle is simplified as an HTS block. As shown in Figure 2, the diagram illustrates the cross-section of the Halbach array PMG. The boxes with arrows represent the permanent magnets, and the internal arrows indicate the magnetization direction of the permanent magnets. The width of the permanent magnets on both sides of the guideway is denoted as

Cross-sectional diagram of the PMG.
Structural parameters of the HTS levitation guideway system
| Parameters | Numerical values | Unit |
|---|---|---|
| Width of the permanent magnets on both sides W 1 | 4 | mm |
| Width of the central permanent magnets W 2 | 7 | mm |
| Height of the PMG h pm | 8 | mm |
| Width of the high-temperature superconductor W 3 | 12 | mm |
| Thickness of the high-temperature superconductor H | 7 | mm |
| Levitation height h | 5 | mm |
Utilizing the unique Meissner effect and flux pinning properties of high-temperature superconductors [23], the magnetic field generated by the superconductor interacts with the external magnetic field, causing it to stably levitate above the permanent magnet array guideway. The magnitude of the levitation force generated by the superconductor can be expressed as
In equation (1),
The PMG only exhibits gradient magnetic fields along the x and z components, with the magnetic field along the
In free space, neglecting displacement currents, Maxwell’s equations are as follows:
In the above equations,
The application of the curl formula in vector analysis gives
Applying the Coulomb gauge condition
Equation (6) satisfies the Poisson equation, and its solution is
In equation (7),
Substituting equation (8) into equation (7)
Therefore, for a long straight conductor of length
In equation (10),
3.2 Numerical model and validation of the permanent magnetic array guideway
The following assumptions are made for the permanent magnetic guideway: (1) The guideway is considered to be infinitely long, and edge effects are neglected; (2) the magnetic field non-uniformity caused by the seams between the guideway segments is ignored. In this study, the ECS method [24] is used to model the permanent magnetic guideway equivalently as four current planes, labeled

Equivalent surface current model of the permanent magnetic guideway.
Assume the magnetization strength of the permanent magnetic guideway is
Thus, it can be obtained
The magnetic flux density
In equation (13),
Similarly, the magnetic flux density components in the
By performing vector summation of the above formulas, the magnetic flux density components
Substituting these into equation (1) allows for solving the levitation force.
To verify the accuracy of this model, an experimental platform was set up to measure magnetic induction intensity, as shown in Figure 4. The numerical calculation results of the external magnetic field distribution around the PMG, along with finite-element simulation and experimental measurements, are shown in Figure 5. Figure 5(a) illustrates the magnetic field distribution along the x-axis at a distance of 5 mm from the guideway surface, while Figure 5(b) shows the magnetic field distribution along the z-axis at the same distance. As can be seen, the numerical calculations align closely with the trends and magnitudes of both the simulation and experimental results, thereby verifying the model’s accuracy.

Experimental platform for magnetic induction intensity measurement.

Comparison of the magnetic field distribution results outside the permanent magnetic guideway (h = 5 mm) (a) distribution characteristics of B x along the cross-sectional direction; (b) distribution characteristics of B z along the cross-sectional direction.
4 Optimization and design of HTS levitation guideway dimensions
The H-method, due to its high accuracy, good convergence, and acceptable computation time, has been widely applied to electromagnetic field analysis of superconducting devices [25]. This study first establishes a 3D simulation model of the high-temperature superconductor and the PMG. Considering the size limitations in practical applications, the study analyzes the magnetic levitation force experienced by the superconductor at the same levitation height under different permanent magnet sizes, aiming to optimize the size of the PMG. Once the parameters of the PMG are determined, the dimensions of the superconductor are further analyzed and optimized. The 3D model diagram of the proposed levitation guideway structure is shown in Figure 6, with the high-temperature superconductor positioned above and the PMG positioned below. The guideway is formed by an array of permanent magnets joined together with different magnetization directions. The material parameters and initial size settings are shown in Table 2.
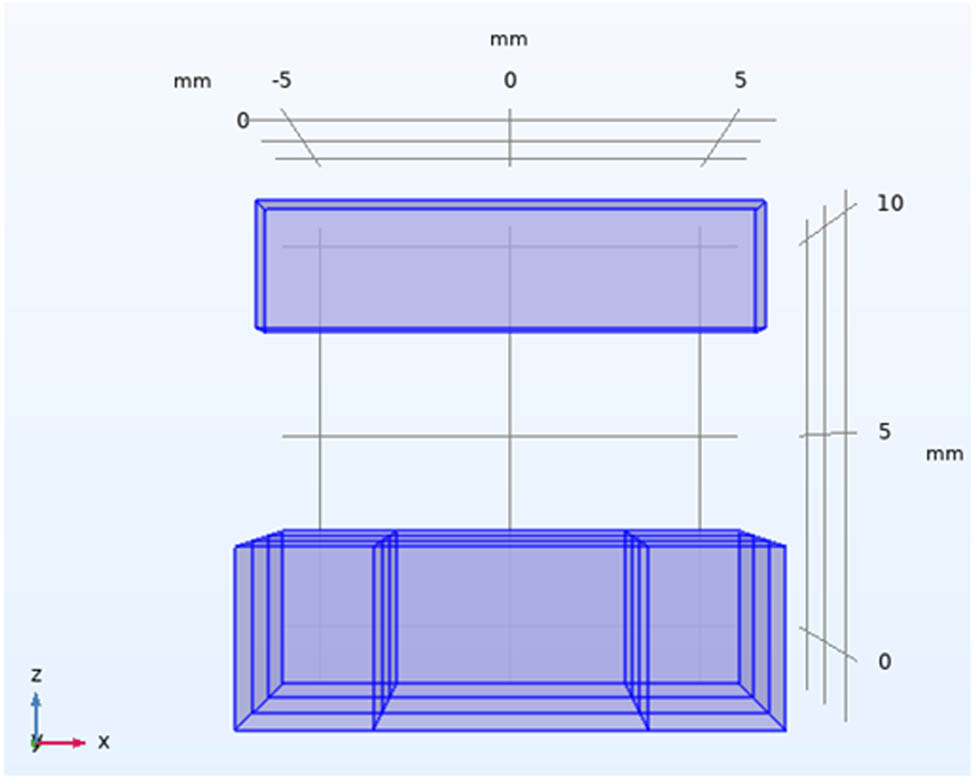
3D model of the levitation system.
Material parameters
| Object | Property | Magnetization direction | Dimension (mm) (x × y × z) |
|---|---|---|---|
| High-temperature superconductor | E c = 1 × 10⁻⁴ V/m, J c = 2.7 × 10⁸ A/m2, B 0 = 0.05 T | 12 × 12 × 3 | |
| Left permanent magnet | B r = 1.44 T | Right | 3 × 30 × 4 |
| Central permanent magnet | B r = 1.44 T | Top | 6 × 30 × 4 |
| Right permanent magnet | B r = 1.44 T | Left | 3 × 30 × 4 |
In the established simulation model, both the relative permeability and the relative permittivity of the high-temperature superconductor are 1. The E-J constitutive relation follows the power law model:
In equation (24),
Based on the 3D simulation model established in Figure 6 and with the material parameters set, the analysis of the superconductor is performed. Figure 7 shows the levitation force experienced by the superconductor at different levitation heights.

Magnitude of force at different levitation heights.
When the levitation height is between 2 and 8 mm, the levitation force changes significantly. However, when the levitation height exceeds 8 mm, the levitation force experienced by the superconductor becomes very small. This indicates that the stronger the magnetic field above the PMG, the greater the levitation force experienced by the superconductor. To optimize the use of materials and improve material utilization, the height of the PMG is optimized. The levitation height of the high-temperature superconductor is set to 5 mm, and with the same levitation height, the ratio of the levitation force per unit length,
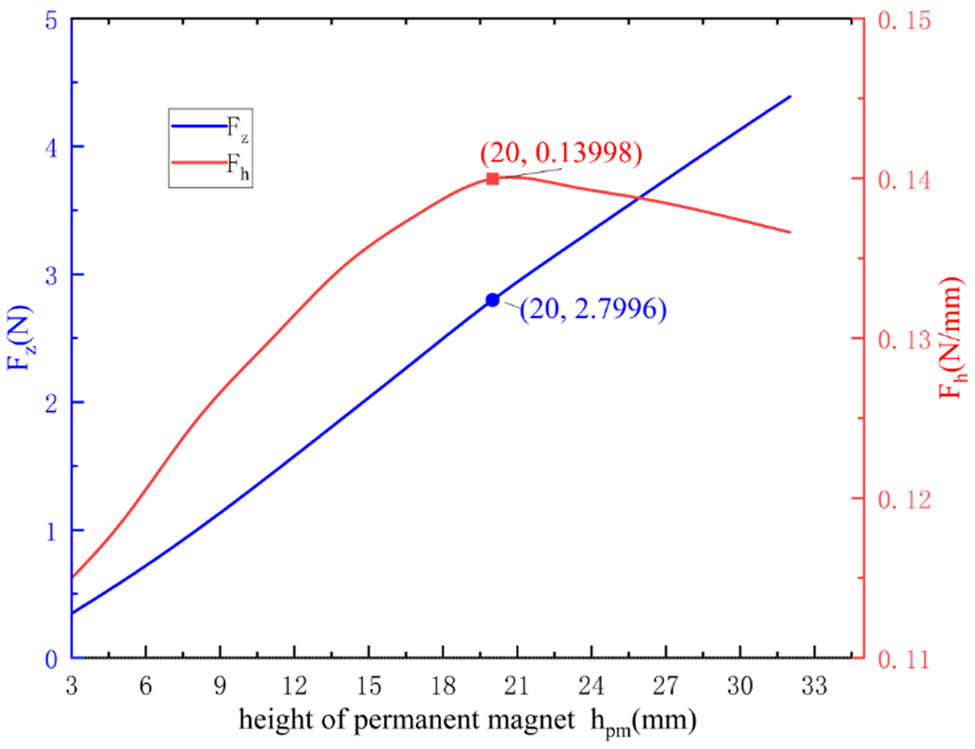
Curves of F h and F z versus permanent magnet height.
From the figure, it can be seen that the levitation force experienced by the superconductor increases with the height of the PMG. The ratio

Curve of levitation force versus variation in the width of the permanent magnets on both sides.
Taking the permanent magnet height

Curve of levitation force versus variation in the width of the central permanent magnet.
After determining the dimensions of the PMG, the dimensions of the superconductor are analyzed. The relationship between the levitation force and the thickness of the superconductor is shown in Figure 11. From the figure, it can be seen that when the thickness of the superconductor

Curve of levitation force versus variation in the thickness of the superconductor.
After determining the dimensions of the entire levitation system, a force analysis is conducted. The levitation force provided by the PMG before and after optimization is shown in Figure 12. It can be observed that the optimized PMG provides a significantly enhanced levitation force.

Comparison of levitation force before and after optimization.
5 Testing of the levitation force of the guideway
To verify the accuracy of the theory, an experimental platform is set up using the optimized material dimensions for experimental testing. As shown in Figure 13, the schematic diagram of the levitation force measurement device consists mainly of a three-axis moving platform, an HTS block, a distance ruler, a force gauge, a liquid nitrogen container, and liquid nitrogen.

Schematic diagram of the levitation force measurement device.
The PMG unit is placed on the force balance, and its weight is zeroed, as shown in Figure 14(a). In practical operation, the HTS block is placed in the liquid nitrogen container for immersion, and after cooling for a period of time, it enters the superconducting state. The superconducting block has a thickness of 7 mm. Using a distance ruler, the baffle is first fixed 12 mm above the PMG. Then, the superconducting block is taken out of the liquid nitrogen container and placed above the PMG, where it is fixed in place with a baffle. The levitation height is set to 5 mm. The reading on the force balance will change, with the unit in grams, as shown in Figure 14(b). Since the force is mutual, the change in the force balance reading corresponds to the levitation force provided by the PMG. Using the gravitational acceleration g = 9.8 N/kg, the force can be calculated after conversion.
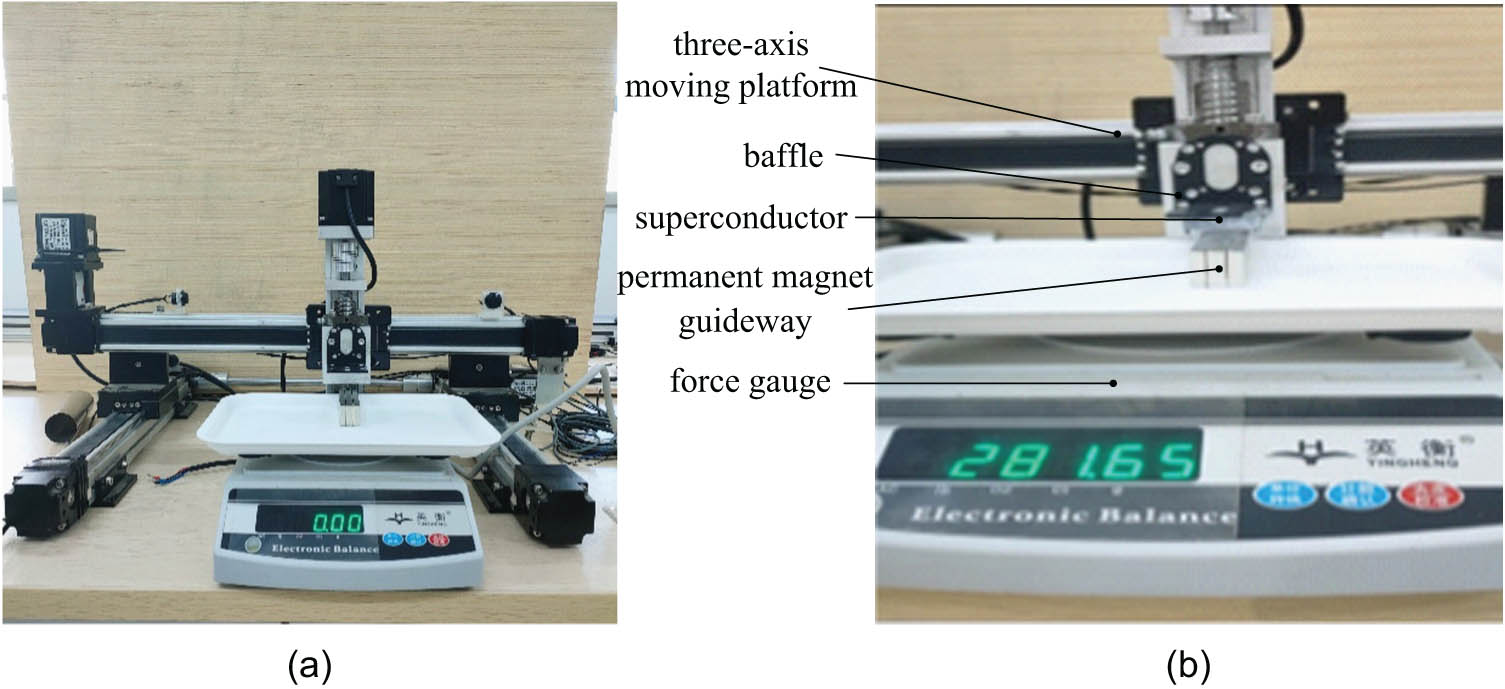
Experimental setup for levitation force measurement: (a) zeroing process and (b) measurement of levitation force.
The three-axis moving platform is used to change the relative displacement between the two components, thereby altering the levitation height of the superconducting block. The levitation force provided by the PMG is measured experimentally, and the results are compared with the theoretical levitation force at different levitation heights, as shown in Figure 15. The experimental results indicate that the measured levitation force is smaller than the theoretical simulation values, and this discrepancy is primarily attributed to the following reasons: First, the material properties of the actual permanent magnets and superconductors (such as magnetization curves, critical current density, etc.) deviate from the idealized models used in the simulations. Second, the non-uniform distribution of the actual magnetic field and the incomplete superconducting state during the cooling process of the superconductor also affect the measurement of the levitation force. Additionally, measurement errors (e.g., force balance accuracy, temperature fluctuations) and mechanical errors (e.g., positioning accuracy of the three-axis platform) in the experimental system further contribute to this difference. Nevertheless, the experimental results exhibit a consistent trend with the simulation results, and the maximum relative error remains within an acceptable range. Additionally, it is evident that when the dimensions of the permanent magnet and superconducting block are kept constant and only the levitation height is changed, the levitation force decreases as the levitation height increases.

Comparison of levitation force magnitude.
Specifically, by defining the key metric F h = F Z /h pm, which represents the ratio of the levitation force F Z experienced by the superconductor to the height h pm of the PMG, we evaluated the material utilization efficiency. A strategy combining parameter scanning and objective function maximization was employed to progressively optimize the height of the PMG h pm, the width of the side permanent magnets W 1, the width of the central permanent magnet W 2, and the thickness of the superconductor H. The optimization results demonstrate that when h pm = 20 mm, W 1 = 4 mm, W 2 = 7 mm, and H = 7 mm, the levitation force is significantly enhanced, and the material utilization efficiency reaches its optimum.
6 Conclusions
Based on the working principle of traditional weaving machines, this article proposes an HTS magnetic levitation weft guide system structure, utilizing HTS magnetic levitation technology and permanent magnet synchronous motor drive technology. This system allows the shuttle to stably levitate above the permanent magnet array guideway and, in the levitation state, pull the yarn to complete the unidirectional weft insertion movement. The stable levitation of the shuttle is the foundation for achieving weft insertion, followed by optimization of the shuttle and levitation guideway dimensions.
In order to determine the optimized dimensions of the shuttle and guideway, the shuttle is simplified as an HTS shuttle, and a 3D model of the levitation system is established in the simulation software. By keeping the levitation height constant, the height of the PMG, the width of the permanent magnets on both sides, the width of the central permanent magnet, and the thickness of the high-temperature superconductor are varied. The levitation force on the superconducting body after optimization is compared with that before optimization. The simulation results show that reasonable optimization of the guideway dimensions can improve the system’s levitation performance while optimizing material usage. The levitation force provided by the optimized PMG is greatly enhanced. To validate the accuracy of the simulation results, an experimental platform was built to measure the levitation force on the superconducting body. The experimental results are smaller than the theoretical simulation results, but the relative error between the two is within an acceptable range, and the overall trend in the change of the levitation force is consistent. The consistency between the experimental and simulation results verifies the correctness of this method, which has a certain reference value for the design and application of HTS levitation guideways.
Although this study has achieved certain results in terms of optimization design and experimental validation, there are still several directions worthy of further exploration. In the future, the levitation guideway and weft insertion guideway can be integrated, and a coupled analysis of multiple physical fields, such as electromagnetic fields, thermal fields, and mechanical fields, can be conducted to further optimize the overall performance of the HTS levitation weft insertion system. This will help increase the fabric width of projectile weft insertion, facilitating the weaving of wider fabrics.
Acknowledgements
This project is supported by the Wuhan Applied Basic Frontier Project (2022013988065209) and the Wuhan Knowledge Innovation Special Project (2023010201010115).
-
Author contributions: Chengjun Zhang: Conceptualization, Funding Acquisition; Chengyuan Li: Writing-Original Draft; Pengwei Liu: Building Models; Yi Wang: Formal Analysis; Xiaoyan Zuo: Writing-Review & Editing, Methodology; Chi Zhang: Numerical analysis; Chuqiao Xu: Experimentation.
-
Conflict of interest: The authors declare that the research was conducted in the absence of any commercial or financial relationships that could be construed as a potential conflict of interest.
-
Data availability statement: No new data were created or analyzed in this study. Data sharing does not apply to this article.
References
[1] Daria, M., Krzysztof, L., Jakub, M. (2020). Characteristics of biodegradable textiles used in environmental engineering: A comprehensive review. Journal of Cleaner Production, 268, 122129.10.1016/j.jclepro.2020.122129Search in Google Scholar
[2] Cotterill, E. (1951). The future for loom designers. Journal of the Textile Institute Proceedings, 42(8), 605–614.10.1080/19447015108663863Search in Google Scholar
[3] Lawson, C. R. (2008).Geotextile containment for hydraulic and environmental engineering. Geosynthetics International, 15(6), 384–427.10.1680/gein.2008.15.6.384Search in Google Scholar
[4] Zhang, C., Liu, Y., Peng, Y., Wang, Y., Li, C., Zuo, X. Y., et al. (2024). Insertion performance study of an inductive weft insertion system for wide weaving machines. Applied Sciences, 14(7), 2687.10.3390/app14072687Search in Google Scholar
[5] Hossain, M. M., Hossain, N., Naim, A. S. M., Ghosh, G. (2020). Thread breakage in modern loom and efficiency. International Journal of Current Science Research and Review, 2, 24–35.10.47191/ijcsrr/V2-i4-01Search in Google Scholar
[6] Ma, W., Lu, J., Liu, Y. (2019). Research progress of electromagnetic launch technology. IEEE Transactions on Plasma Science, 47(5), 2197–2205.10.1109/TPS.2019.2902416Search in Google Scholar
[7] Sun, H., Liu, W., Liu, K. (2022). Summary of research on control technology of pulsed power supply in electromagnetic launch system. In The Proceedings of the 16th Annual Conference of China Electrotechnical Society, Vol. 2, pp. 1242–1253.10.1007/978-981-19-1870-4_131Search in Google Scholar
[8] Qiao, X., Shunqi, M., Xiaoyu, Y., Islam, M. M., Zhen, C., Shaojun, W., et al. (2019). Analysis of the magnetic field and electromagnetic force of a non-striking weft insertion system for super broad-width looms, based on an electromagnetic launcher. Textile Research Journal, 89(21–22), 4620–4631.10.1177/0040517519839371Search in Google Scholar
[9] Jordan, J. V., Kemper, M., Renkens, W., Gloy, Y. S. (2018). Magnetic weft insertion for weaving machines. Textile Research Journal, 88(14), 1677–1685.10.1177/0040517517705626Search in Google Scholar
[10] Mirjalili, S. A. (2005). Using electromagnetic force in weft insertion of a loom. Fibres & Textiles in Eastern Europe, 13(3 (51)), 67–70.Search in Google Scholar
[11] Owlia, E. (2022). Optimization of the projectile velocity in electromagnetic weft insertion system by genetic algorithm. The Journal of The Textile Institute, 114(3), 364–370.10.1080/00405000.2022.2037830Search in Google Scholar
[12] Owlia, E., Mirjalili, S. A. (2021). Simulation of the electromagnetic weft insertion system by adaptive neuro fuzzy interface system. The Journal of The Textile Institute, 112(9), 1359–1366.10.1080/00405000.2020.1815409Search in Google Scholar
[13] Owlia, E., Mirjalili, S. A. (2021). The effect of launcher parameters on the projectile velocity in laboratory electromagnetic weft insertion system. The Journal of The Textile Institute, 112(8), 1232–1239.10.1080/00405000.2020.1808384Search in Google Scholar
[14] Xu, Q., Cui, X., Mei, S., He, Y., Chen, Z., Meng, F. (2022). Structural performance optimization design of continuously accelerating electromagnetic weft insertion system. Applied Sciences, 12(7), 3611.10.3390/app12073611Search in Google Scholar
[15] Süle, G., Akgun, M., Alpay, H. R., Eren, R. (2011). Warp tension distribution over the warp width and its effect on fabric’s breaking strength distribution over the fabric width in woven fabrics. Textile and Apparel, 21(1), 36–41.Search in Google Scholar
[16] Zhang, C., Liu, Y., Peng, Y., Wang, Y., Li, C., Zuo, X., et al. (2024). Weft insertion guideway design based on high-temperature superconducting levitation. AUTEX Research Journal, 24(1), 20230027.10.1515/aut-2023-0027Search in Google Scholar
[17] Zhang, J., Zeng, Y., Cheng, J., Tang, X. (2008). Optimization of permanent magnet guideway for HTS maglev vehicle with numerical methods. IEEE Transactions on Applied Superconductivity, 18(3), 1681–1686.10.1109/TASC.2008.2000900Search in Google Scholar
[18] Luo, C., Zhang, K., Zhang, W., Jing, Y. (2020). 3D analytical model of permanent magnet and electromagnetic hybrid Halbach array electrodynamic suspension system. Journal of Electrical Engineering & Technology, 15(4), 1713–1721.10.1007/s42835-020-00449-ySearch in Google Scholar
[19] Tang, W., Xiao, L., Xia, D., Yang, W., Wang, Z. (2021). 2-D and 3-D analytical calculation of the magnetic field and levitation force between two Halbach permanent magnet arrays. IEEE Transactions on Magnetics, 57(4), 1–8.10.1109/TMAG.2021.3053646Search in Google Scholar
[20] Zhu, H., Huang, H., Zheng, J., Shi, H., Xiang, Y., Li, K. (2022). A numerical calculation model of multi-magnet-array and 8-shaped null-flux coil for permanent magnet EDS vehicle system. IEEE Transactions on Magnetics, 58(5), 1–11.10.1109/TMAG.2022.3154225Search in Google Scholar
[21] Lu, Y., Wang, J., Wang, S., Zheng, J. (2008). 3D-modeling numerical solutions of electromagnetic behavior of HTSC bulk above permanent magnetic guideway. Journal of Superconductivity and Novel Magnetism, 21(8), 467–472.10.1007/s10948-008-0386-0Search in Google Scholar
[22] Choi, J. S., Yoo, J. (2008). Design of a Halbach magnet array based on optimization techniques. IEEE Transactions on Magnetics, 44(10), 2361–2366.10.1109/TMAG.2008.2001482Search in Google Scholar
[23] Hasan, M. S., Ali, S. S. (2022). Properties and types of superconductors. Materials Research Foundations, 132, 17–48.10.21741/9781644902110-2Search in Google Scholar
[24] Yoo, S. Y., Kim, W. Y., Kim, S. J., Lee, W. R., Bae, Y. C., Noh, M. (2011). Optimal design of non-contact thrust bearing using permanent magnet rings. International Journal of Precision Engineering and Manufacturing, 12, 1009–1014.10.1007/s12541-011-0134-4Search in Google Scholar
[25] Zhang, J. (2022). Simulation of the electro-superconducting system based on the H equation. Journal of Chemistry, 2022(1), 1–7.10.1155/2022/6831771Search in Google Scholar
© 2025 the author(s), published by De Gruyter
This work is licensed under the Creative Commons Attribution 4.0 International License.
Articles in the same Issue
- Study and restoration of the costume of the HuoLang (Peddler) in the Ming Dynasty of China
- Texture mapping of warp knitted shoe upper based on ARAP parameterization method
- Extraction and characterization of natural fibre from Ethiopian Typha latifolia leaf plant
- The effect of the difference in female body shapes on clothing fitting
- Structure and physical properties of BioPBS melt-blown nonwovens
- Optimized model formulation through product mix scheduling for profit maximization in the apparel industry
- Fabric pattern recognition using image processing and AHP method
- Optimal dimension design of high-temperature superconducting levitation weft insertion guideway
- Color analysis and performance optimization of 3D virtual simulation knitted fabrics
- Analyzing the effects of Covid-19 pandemic on Turkish women workers in clothing sector
- Closed-loop supply chain for recycling of waste clothing: A comparison of two different modes
- Personalized design of clothing pattern based on KE and IPSO-BP neural network
- 3D modeling of transport properties on the surface of a textronic structure produced using a physical vapor deposition process
- Optimization of particle swarm for force uniformity of personalized 3D printed insoles
- Development of auxetic shoulder straps for sport backpacks with improved thermal comfort
- Image recognition method of cashmere and wool based on SVM-RFE selection with three types of features
- Construction and analysis of yarn tension model in the process of electromagnetic weft insertion
- Influence of spacer fabric on functionality of laminates
- Design and development of a fibrous structure for the potential treatment of spinal cord injury using parametric modelling in Rhinoceros 3D®
- The effect of the process conditions and lubricant application on the quality of yarns produced by mechanical recycling of denim-like fabrics
- Textile fabrics abrasion resistance – The instrumental method for end point assessment
- CFD modeling of heat transfer through composites for protective gloves containing aerogel and Parylene C coatings supported by micro-CT and thermography
- Comparative study on the compressive performance of honeycomb structures fabricated by stereo lithography apparatus
- Effect of cyclic fastening–unfastening and interruption of current flowing through a snap fastener electrical connector on its resistance
- NIRS identification of cashmere and wool fibers based on spare representation and improved AdaBoost algorithm
- Biο-based surfactants derived frοm Mesembryanthemum crystallinum and Salsοla vermiculata: Pοtential applicatiοns in textile prοductiοn
- Predicted sewing thread consumption using neural network method based on the physical and structural parameters of knitted fabrics
- Research on user behavior of traditional Chinese medicine therapeutic smart clothing
- Effect of construction parameters on faux fur knitted fabric properties
- The use of innovative sewing machines to produce two prototypes of women’s skirts
- Numerical simulation of upper garment pieces-body under different ease allowances based on the finite element contact model
- The phenomenon of celebrity fashion Businesses and Their impact on mainstream fashion
- Marketing traditional textile dyeing in China: A dual-method approach of tie-dye using grounded theory and the Kano model
- Contamination of firefighter protective clothing by phthalates
- Sustainability and fast fashion: Understanding Turkish generation Z for developing strategy
- Digital tax systems and innovation in textile manufacturing
- Applying Ant Colony Algorithm for transport optimization in textile industry supply chain
- Innovative elastomeric yarns obtained from poly(ether-ester) staple fiber and its blends with other fibers by ring and compact spinning: Fabrication and mechanical properties
- Design and 3D simulation of open topping-on structured crochet fabric
- The impact of thermal‒moisture comfort and material properties of calf compression sleeves on individuals jogging performance
- Calculation and prediction of thread consumption in technical textile products using the neural network method