Optimization of particle swarm for force uniformity of personalized 3D printed insoles
-
Jiali Zhao


Abstract
This study investigates the application of particle swarm optimization (PSO) algorithm in optimizing the force uniformity of personalized 3D-printed insoles, aiming to enhance the comfort and functionality of the insoles. Traditional insole designs often lead to uneven force distribution due to fixed lattice materials and structures, particularly in critical areas such as the forefoot and heel, which can result in health issues. This research proposes an optimization model that combines the PSO algorithm with a variable density algorithm, enabling dynamic adjustments to the support capabilities of different regions of the insole to achieve uniform force distribution. The results indicate that after optimization with the PSO algorithm, the force distribution of the insoles has significantly improved, with pressure peaks effectively dispersed in critical areas. Furthermore, this research validates the effectiveness of the optimization method through 3D printing technology, providing a theoretical foundation for the design and optimization of personalized 3D-printed insoles. It demonstrates that the combination of the PSO algorithm and variable density methods can effectively improve insole performance, showing promising application prospects.
1 Introduction
In recent years, the rapid development of 3D printing technology and materials science has made the design and manufacturing of personalized insoles increasingly feasible. Utilizing 3D printing technology, insoles can be precisely produced according to the foot characteristics and movement needs of different users, ensuring ergonomic compliance [1,2]. Traditional insole designs, however, often depend on fixed lattice materials and structures, leading to uneven force distribution across the foot, particularly in critical areas such as the forefoot and heel, where force concentration frequently occurs [3,4]. This uneven force distribution can lead to foot fatigue and pain and may also contribute to long-term health issues like plantar fasciitis and Achilles tendonitis [5,6].
Given these challenges, optimizing force distribution in insoles to enhance their comfort and functionality has become an urgent research priority. Researchers have begun exploring new design methods and technical approaches to improve insoles’ performance [7,8]. A key aspect of achieving personalized designs lies in optimizing the internal structure of the insole to attain ideal force uniformity, thereby enhancing the overall comfort experienced by the wearer [9,10]. Among various optimization algorithms, particle swarm optimization (PSO) has emerged as an effective tool for solving complex optimization problems due to its simplicity and efficient global search capabilities [11]. This algorithm mimics the foraging behavior of birds, iteratively updating the positions and velocities of particles to find optimal solutions within complex search spaces.
Chen et al. [12] proposed an adaptive inertia weight strategy aimed at dynamically adjusting weights based on the current environment and search state, enhancing the algorithm’s adaptability and robustness in both dynamic and static environments. Li et al. [13,14] adopted a neighborhood topology structure based on complex networks to build personalized neighborhoods for each particle, significantly improving the global and local search capabilities of the PSO algorithm. Although optimizing the neighborhood topology structure can enhance the accuracy of the PSO algorithm, constructing complex topologies incurs additional time costs. Li et al. [15] introduced the concept of a strategy pool, allowing particles to dynamically select suitable strategies based on the environment, thereby improving the algorithm’s adaptability and diversity. Wang et al. [16,17] proposed a method for adaptively employing three different learning strategies, dynamically selecting and adjusting strategies based on the current search state and problem characteristics to enhance the algorithm’s adaptability and performance. Although hybrid strategies can effectively mitigate the risk of premature convergence, how to reasonably combine different strategies remains a challenge. The findings from the above studies provide a research foundation and theoretical support for constructing the PSO algorithm for optimizing the pressure distribution of insoles.
This study aims to utilize the PSO algorithm to develop a model for optimizing force uniformity in the design of 3D-printed insoles. The proposed model aims to optimize the supportive function of the insole for the foot, ensuring reasonable force distribution, minimizing the force concentration, and ultimately enhancing the overall comfort and performance of the insole [18,19,20]. Specifically, the study treats the design parameters of the insole as particles within a three-dimensional search space and employs the PSO algorithm to iteratively optimize these parameters, achieving uniform force distribution across the foot.
2 Experimental and methods
2.1 Experimental conditions
This study established experimental conditions to measure the pressure distribution on the soles of the feet. The experimental setup, as shown in Figure 1, consists of pressure sensors and a data acquisition system. During the testing process, participants stand barefoot on the insoles, and the sensors record the force data from various parts of the foot in real time, generating force distribution maps. The experimental environment is maintained at room temperature to ensure consistency in material properties. Static mode is adopted for force testing, requiring participants to remain still, with each test group repeated three times to enhance the reliability of the data.
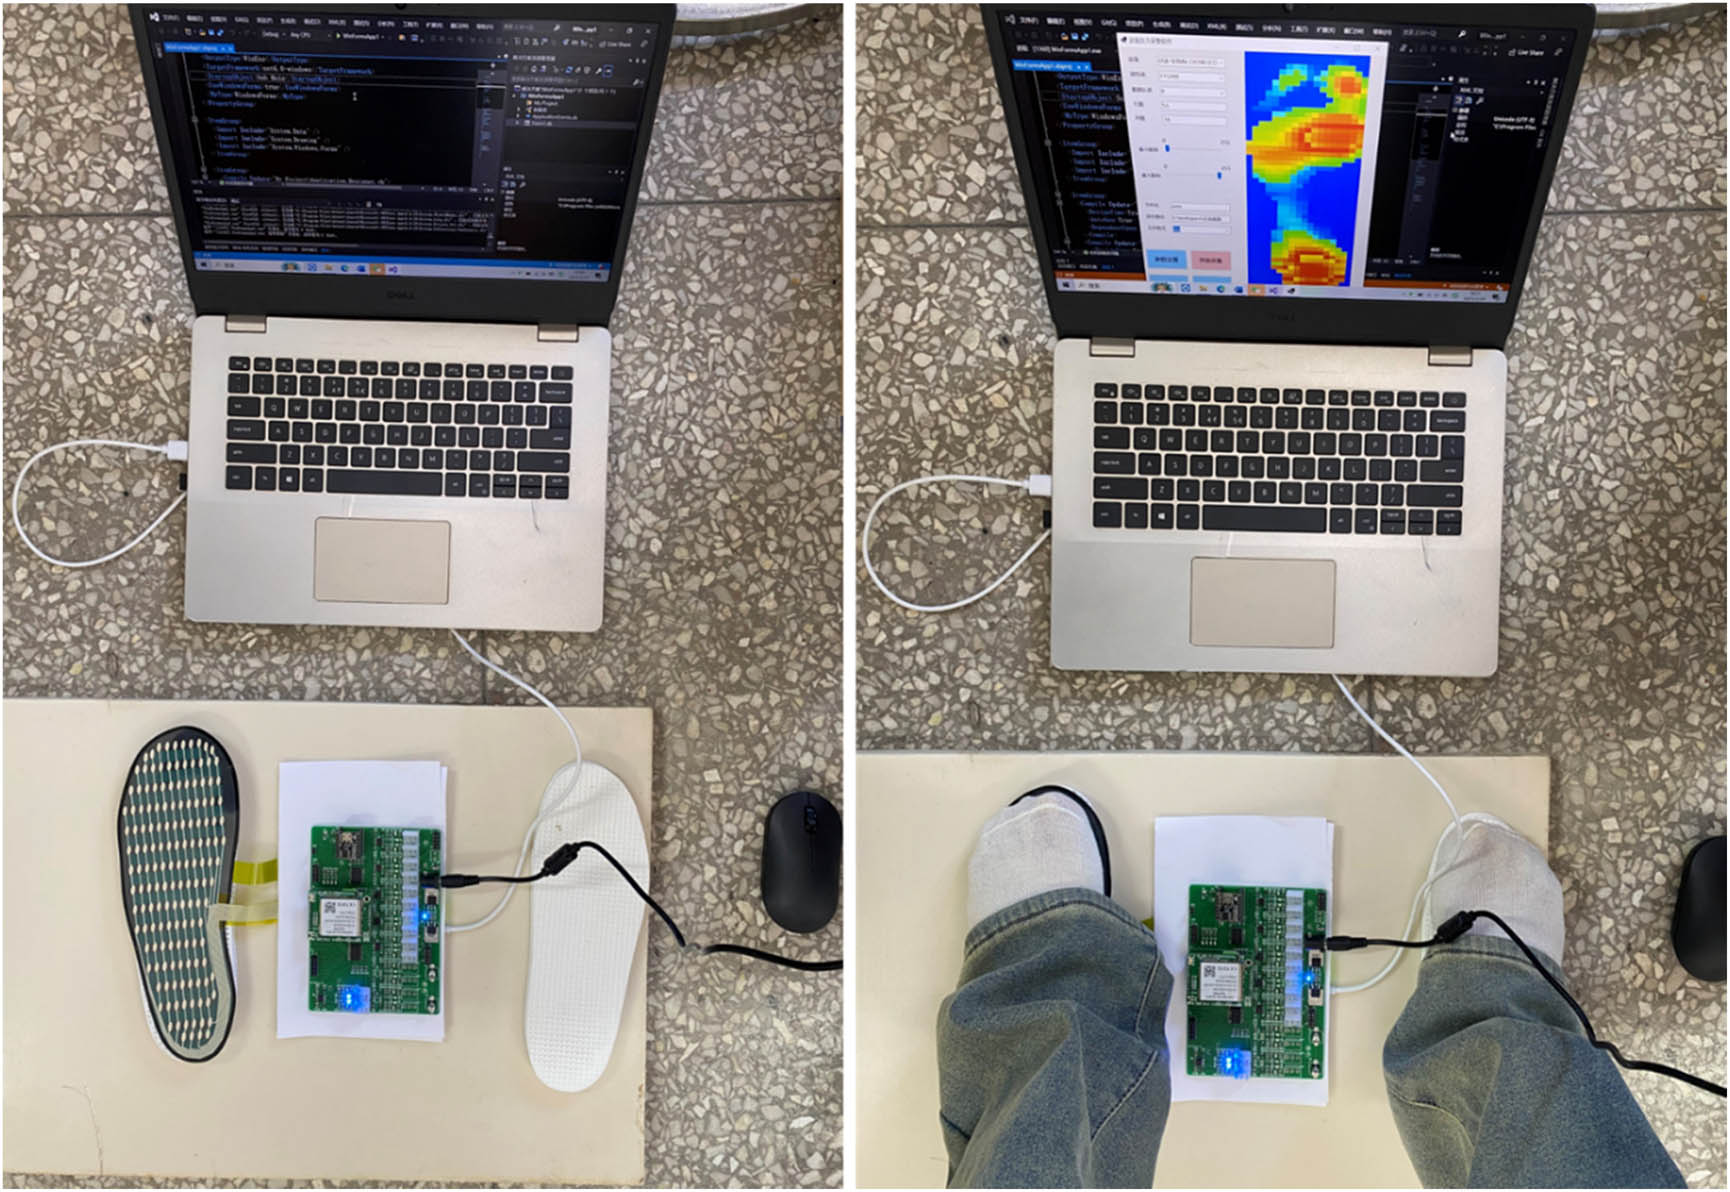
Experimental conditions.
2.2 Research methods
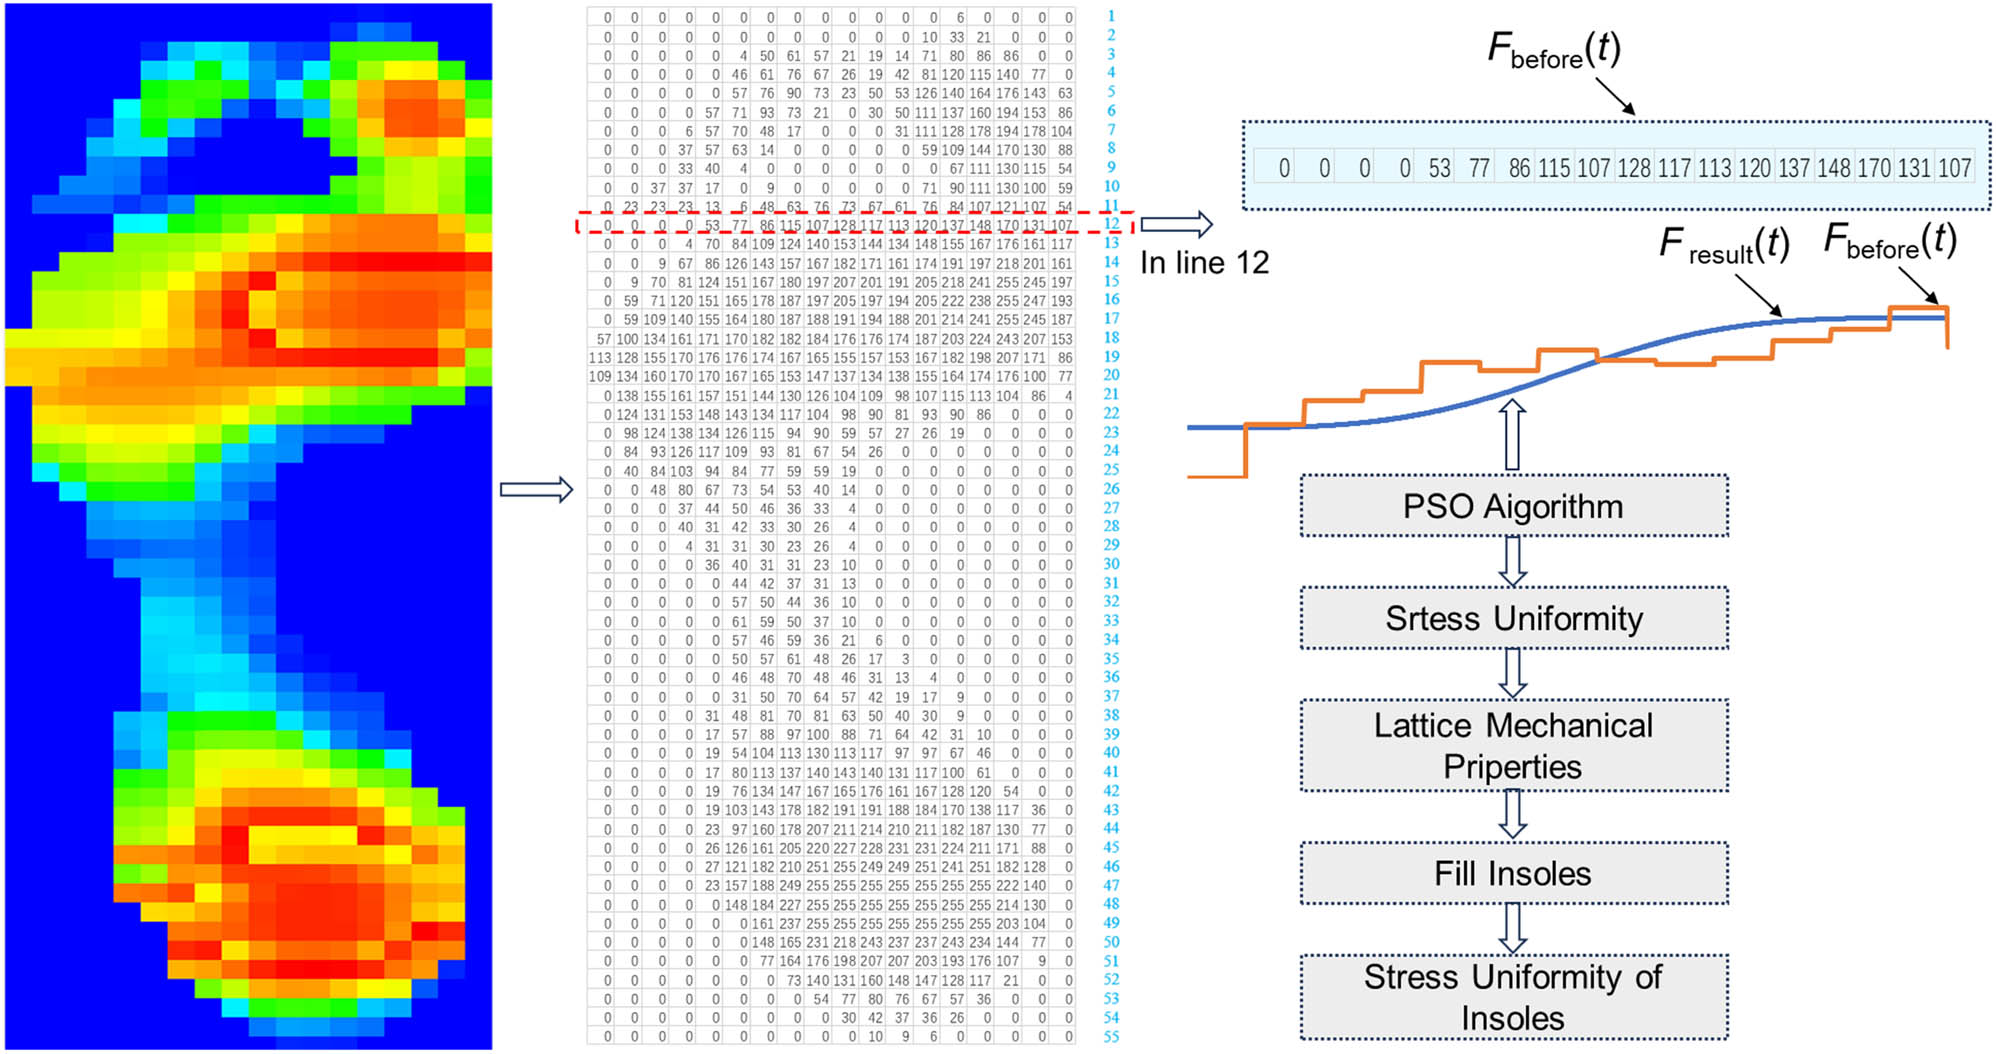
Current research on insole design mainly relies on computer simulations to optimize the pressure distribution on the foot’s sole. This article proposes an optimization model for insole pressure distribution based on the PSO algorithm combined with a variable density algorithm. The PSO algorithm is a population-based optimization technique known for its strong global search capability and simplicity of implementation, making it efficient for handling optimization problems involving multiple variables and complex objectives. By combining PSO with the variable density algorithm, the model can achieve dynamic adjustments to the support capability of the insole in different areas of the foot’s sole through iterative optimization, thereby achieving the goal of pressure distribution optimization. Figure 2 illustrates the overall technical approach for the study of force uniformity in insoles using the PSO algorithm.
Working principle of the modulator and characteristics of the heald frame.
2.2.1 Constructing the foot pressure uniformity based on PSO
In the application of the PSO algorithm, feasible solutions can be regarded as particles in a flight space. These particles fly through the search space at a certain velocity, with their flight direction and distance determined by their speed. Each particle’s fitness value is determined by the optimization function, and the particles search in the solution space by following the current optimal particle. The algorithm randomly generates an initial population and iteratively seeks the optimal solution.
For the issue of force uniformity in insoles, the mathematical description of the PSO algorithm is as follows: in a three-dimensional search space composed of N particles, the position of the ith particle can be represented as x i = (x ia , x ib , x ic ), the optimal position found during the search as P i = (P ia , P ib , P ic ), and x i (t) represents the position of the ith particle at time t. The velocity of the particle is represented as v i = (v ia , v ib , v ic ), and v i (t) is the speed of the ith particle at time t. P g = (P ga , P gb , P gc ) refers to the optimal position found by all particles in the population thus far. In each iteration, the dth dimension evolves according to the following equation:
In the equation, t represents the current time, c p and c g are learning factors that are non-negative constants used to adjust the step size of the particle’s flight, and r 1 and r 2 are random numbers in the range [0,1].
The process for constructing the PSO algorithm for force uniformity in insoles is as follows:
Set the learning factors c p and c g , the maximum number of iterations MaxDT, and initialize the current evolution time as t = 1. Randomly generate N particles to form the initial particle swarm and set the initial positions and velocities of the particles.
Calculate the objective function value for each particle to evaluate its fitness.
Compare each particle’s current fitness with its individual historical optimal value P i discovered so far. If the current fitness is better than P i , update P i .
Compare each particle’s current fitness with the global historical optimal value P g . If the current fitness is better than P g , update the current global optimum.
Update the flight speed and position of each particle according to the formula.
If the termination conditions are met, end the iteration; otherwise, return to step (2).
Termination conditions are as follows:
The maximum number of iterations has been reached.
A sufficiently good fitness value has been obtained.
The optimal solution no longer changes.
For example, in line 12, the corresponding objective function, as well as the force curve before optimization and the target optimization curve, is shown as in equation (2):
The choice of a seventh-degree polynomial as the target optimization curve is primarily due to its superiority in fitting complex force distributions. First, the seventh-degree polynomial has a high degree of freedom, allowing it to effectively adapt to curves with different shapes and characteristics, thereby improving the fitting accuracy to actual force data. Second, higher-degree polynomials can provide smooth curves, preventing abrupt changes in the force distribution and ensuring a more uniform force transmission, which enhances the comfort of wearing insoles.
In addition, the seventh-degree polynomial demonstrates good stability in numerical calculations, reducing oscillation phenomena and ensuring the convergence and reliability of the optimization algorithm. Furthermore, using a seventh-degree polynomial has physical rationality in mechanics and engineering applications, accurately reflecting the force conditions of the insoles under different usage scenarios. Therefore, the seventh-degree polynomial not only theoretically meets the optimization requirements but also effectively supports the uniformity of force distribution in practical applications.
As shown in Figure 3, the coordinates of 1,000 uniformly distributed points on the force curve F before(t) before optimization are defined as (A 1ti , B 1ti ), and the coordinates of 1,000 uniformly distributed points on the target optimization curve F result(t) are defined as (A 2ti , B 2ti ). The sum of the Euclidean distances of the corresponding points is denoted as S i (t), which is used to represent the non-coincidence of the two force curves. Let the design parameters be defined as a i , b i , and c i , then we have
where t = 1, 2, …, 1,000, i = 1, 2, …, 100.
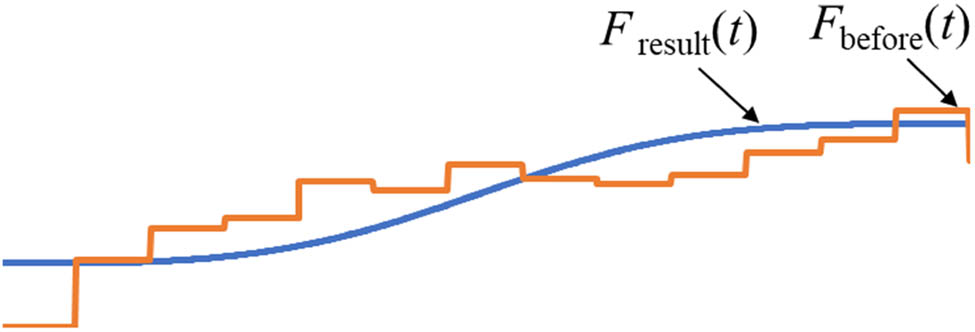
Force distribution curves before and after optimization.
Objective function:
Boundary conditions:
Correction function:
The PSO algorithm is used to achieve uniform distribution of force on the insoles, and the above mathematical model is programed and calculated using the Visual Studio 2019 programing tool. Following the method described in reference, the best value of the objective function obtained by the swarm is monitored, and convergence is assumed when no changes are observed within the specified number of iterations. Here, the size of the particle swarm is set to 100, and the maximum number of iterations is set to 5,000. Based on empirical ranges and preliminary calculations of particle convergence speed, learning factors c p = 0.05 and c g = 0.1 are determined. After exceeding 1,800 iterations, the optimal solution stagnates, and the collective behavior of particle convergence is shown in Figure 4.
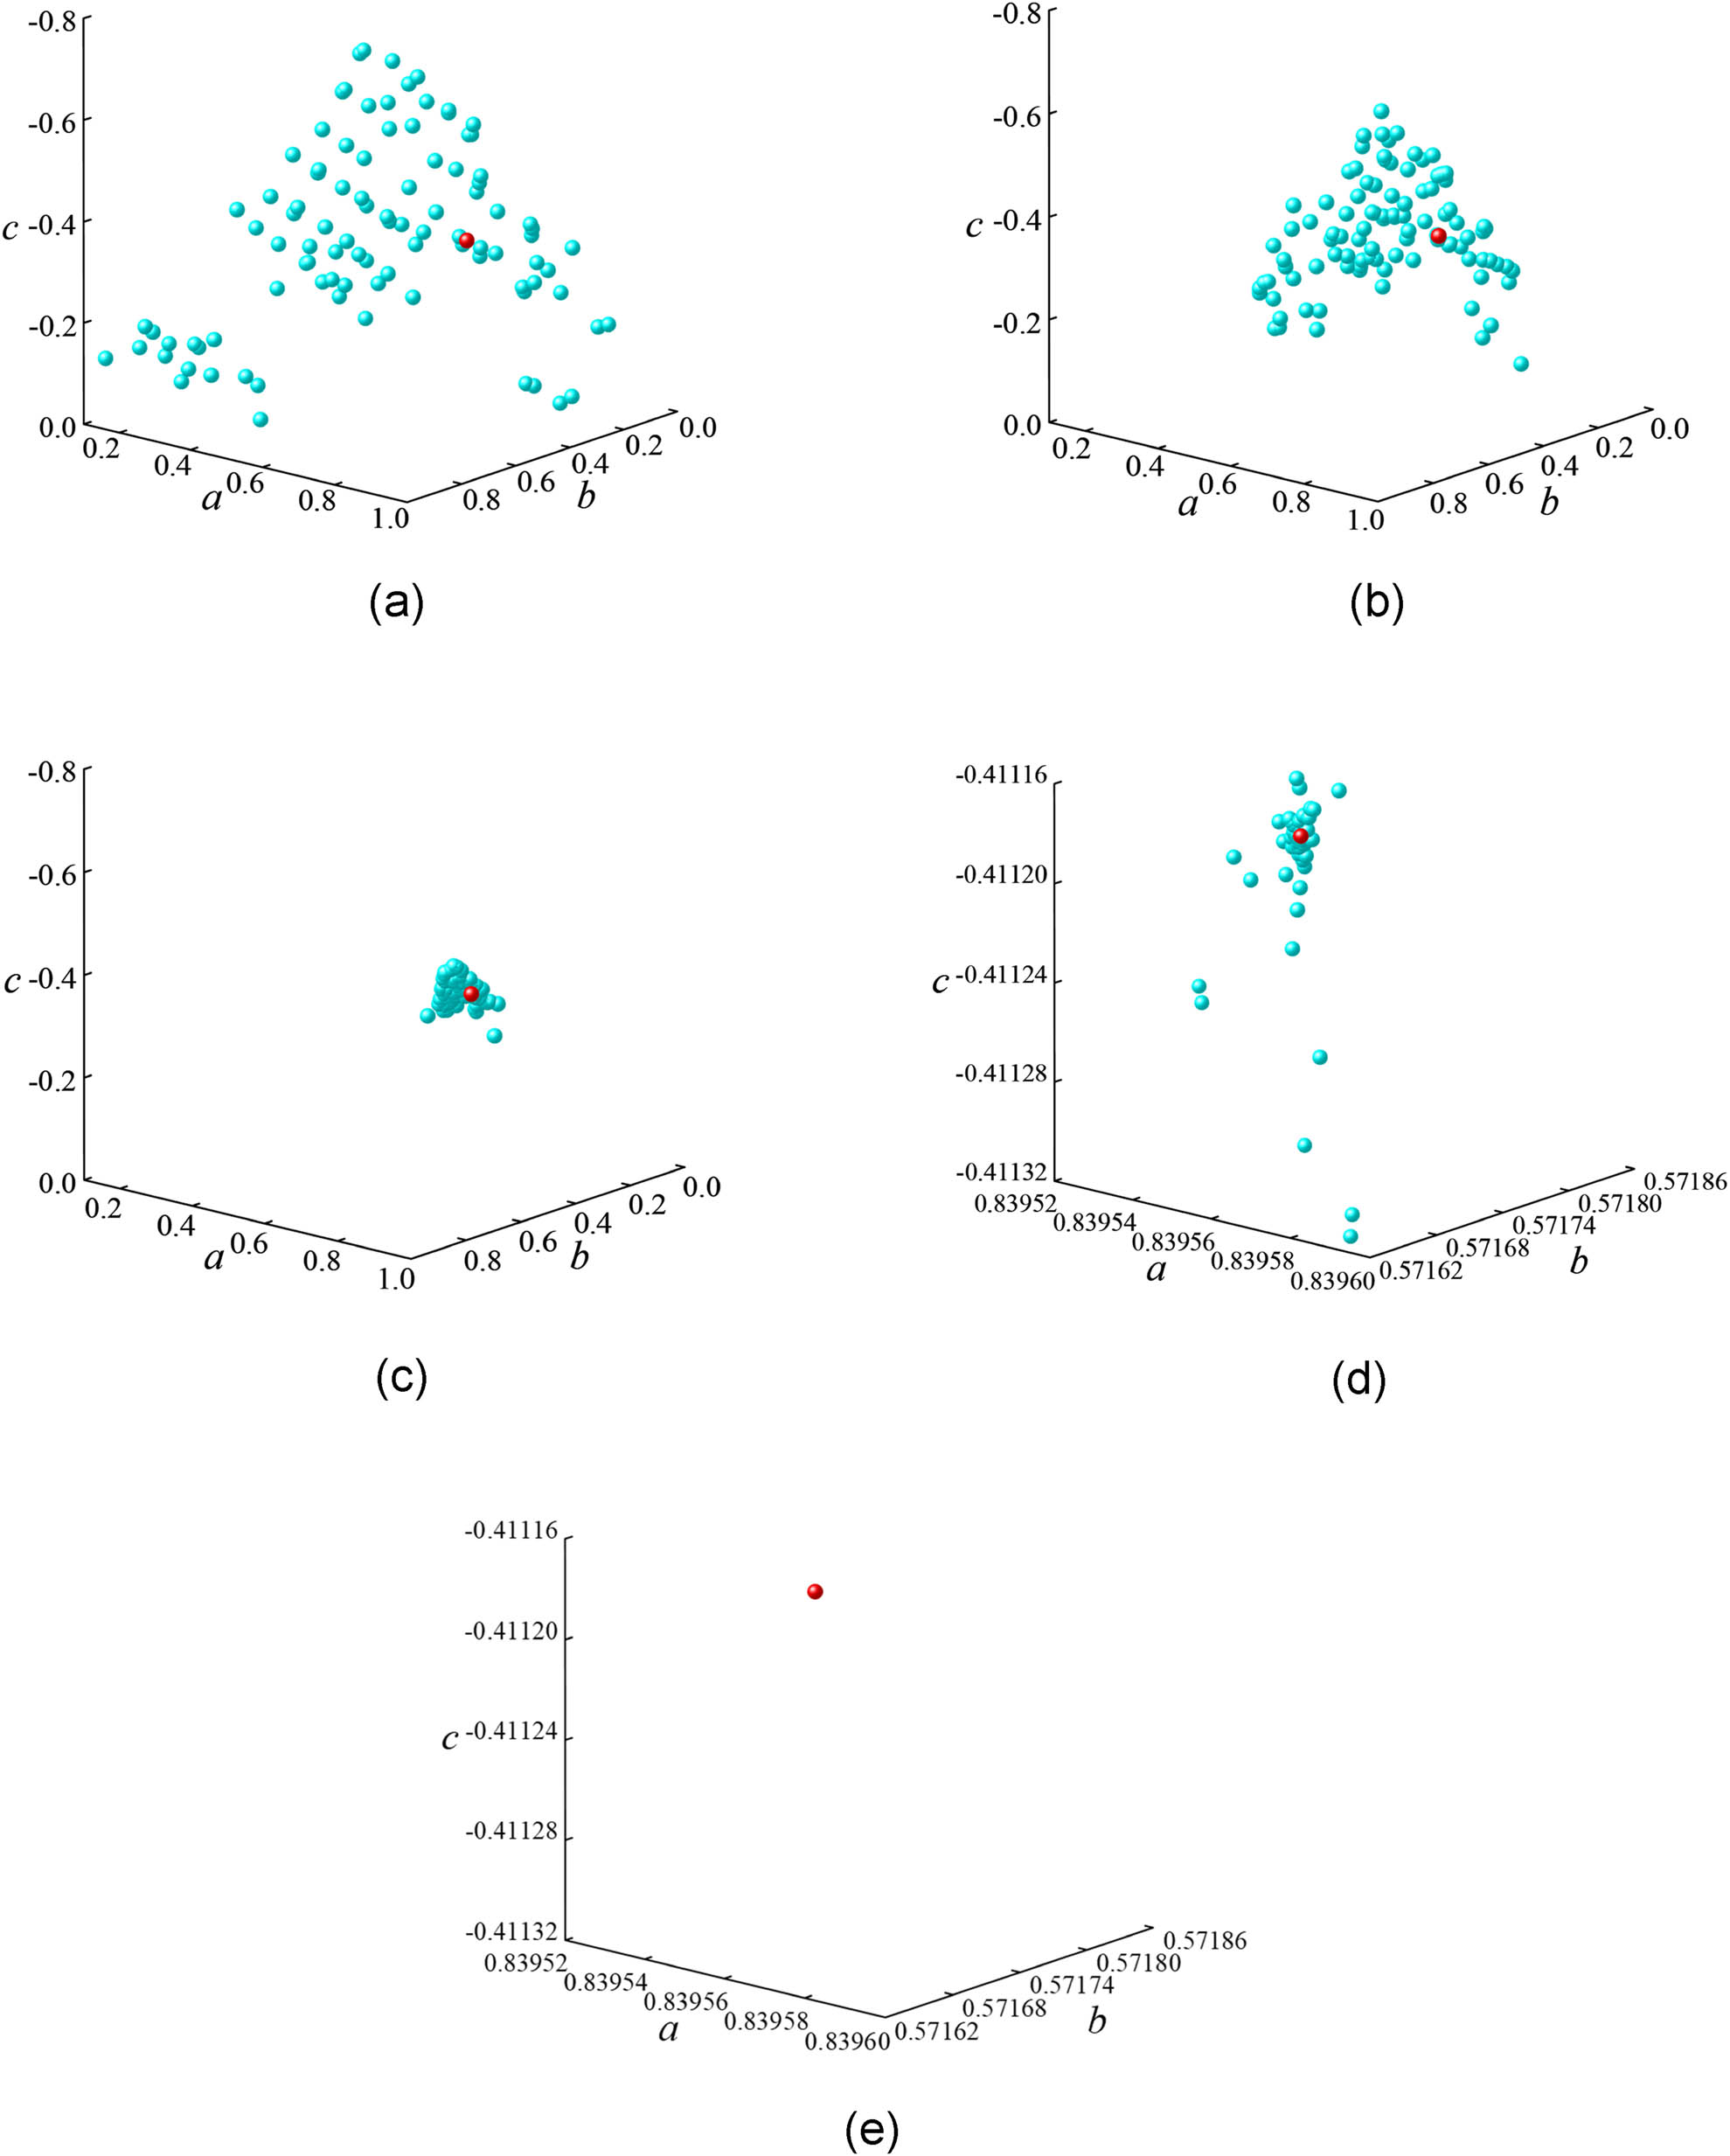
Swarm behavior of convergence. (a) Initial distribution, (b) 100 iterations, (c) 1,000 iterations, (d) 2,000 iterations, and (e) magnified view of particle distribution after 5,000 iterations.
In Figure 4, the red particles represent the optimal particles, illustrating the initial distribution of particles and their convergence after 100, 1,000, 2,000, and 5,000 iterations. It can be observed that the convergence of the red particles is quite good. After optimization and uniformization, correction coefficients a 12 = 0.840, b 12 = 0.572, and c 12 = −0.412 are obtained, with the objective function value being 0, leading to the force distribution on the insoles after uniformization.
2.2.2 Foot pressure distribution results
In the experiment, the subject is a female with a foot size of 38 and a weight of 55 kg. Figure 5 displays the force distribution data of the insoles before and after optimization. Before optimization, the force on the insoles is primarily concentrated in the forefoot and heel areas, resulting in noticeable pressure peaks, which can lead to discomfort during walking and movement, increasing potential health risks. After processing with the PSO algorithm, the force distribution on the insoles becomes more uniform, with significantly reduced pressure peaks, and a more reasonable distribution of force across various areas of the foot. This optimization effectively improves the comfort of the insoles and alleviates fatigue caused by uneven force distribution.
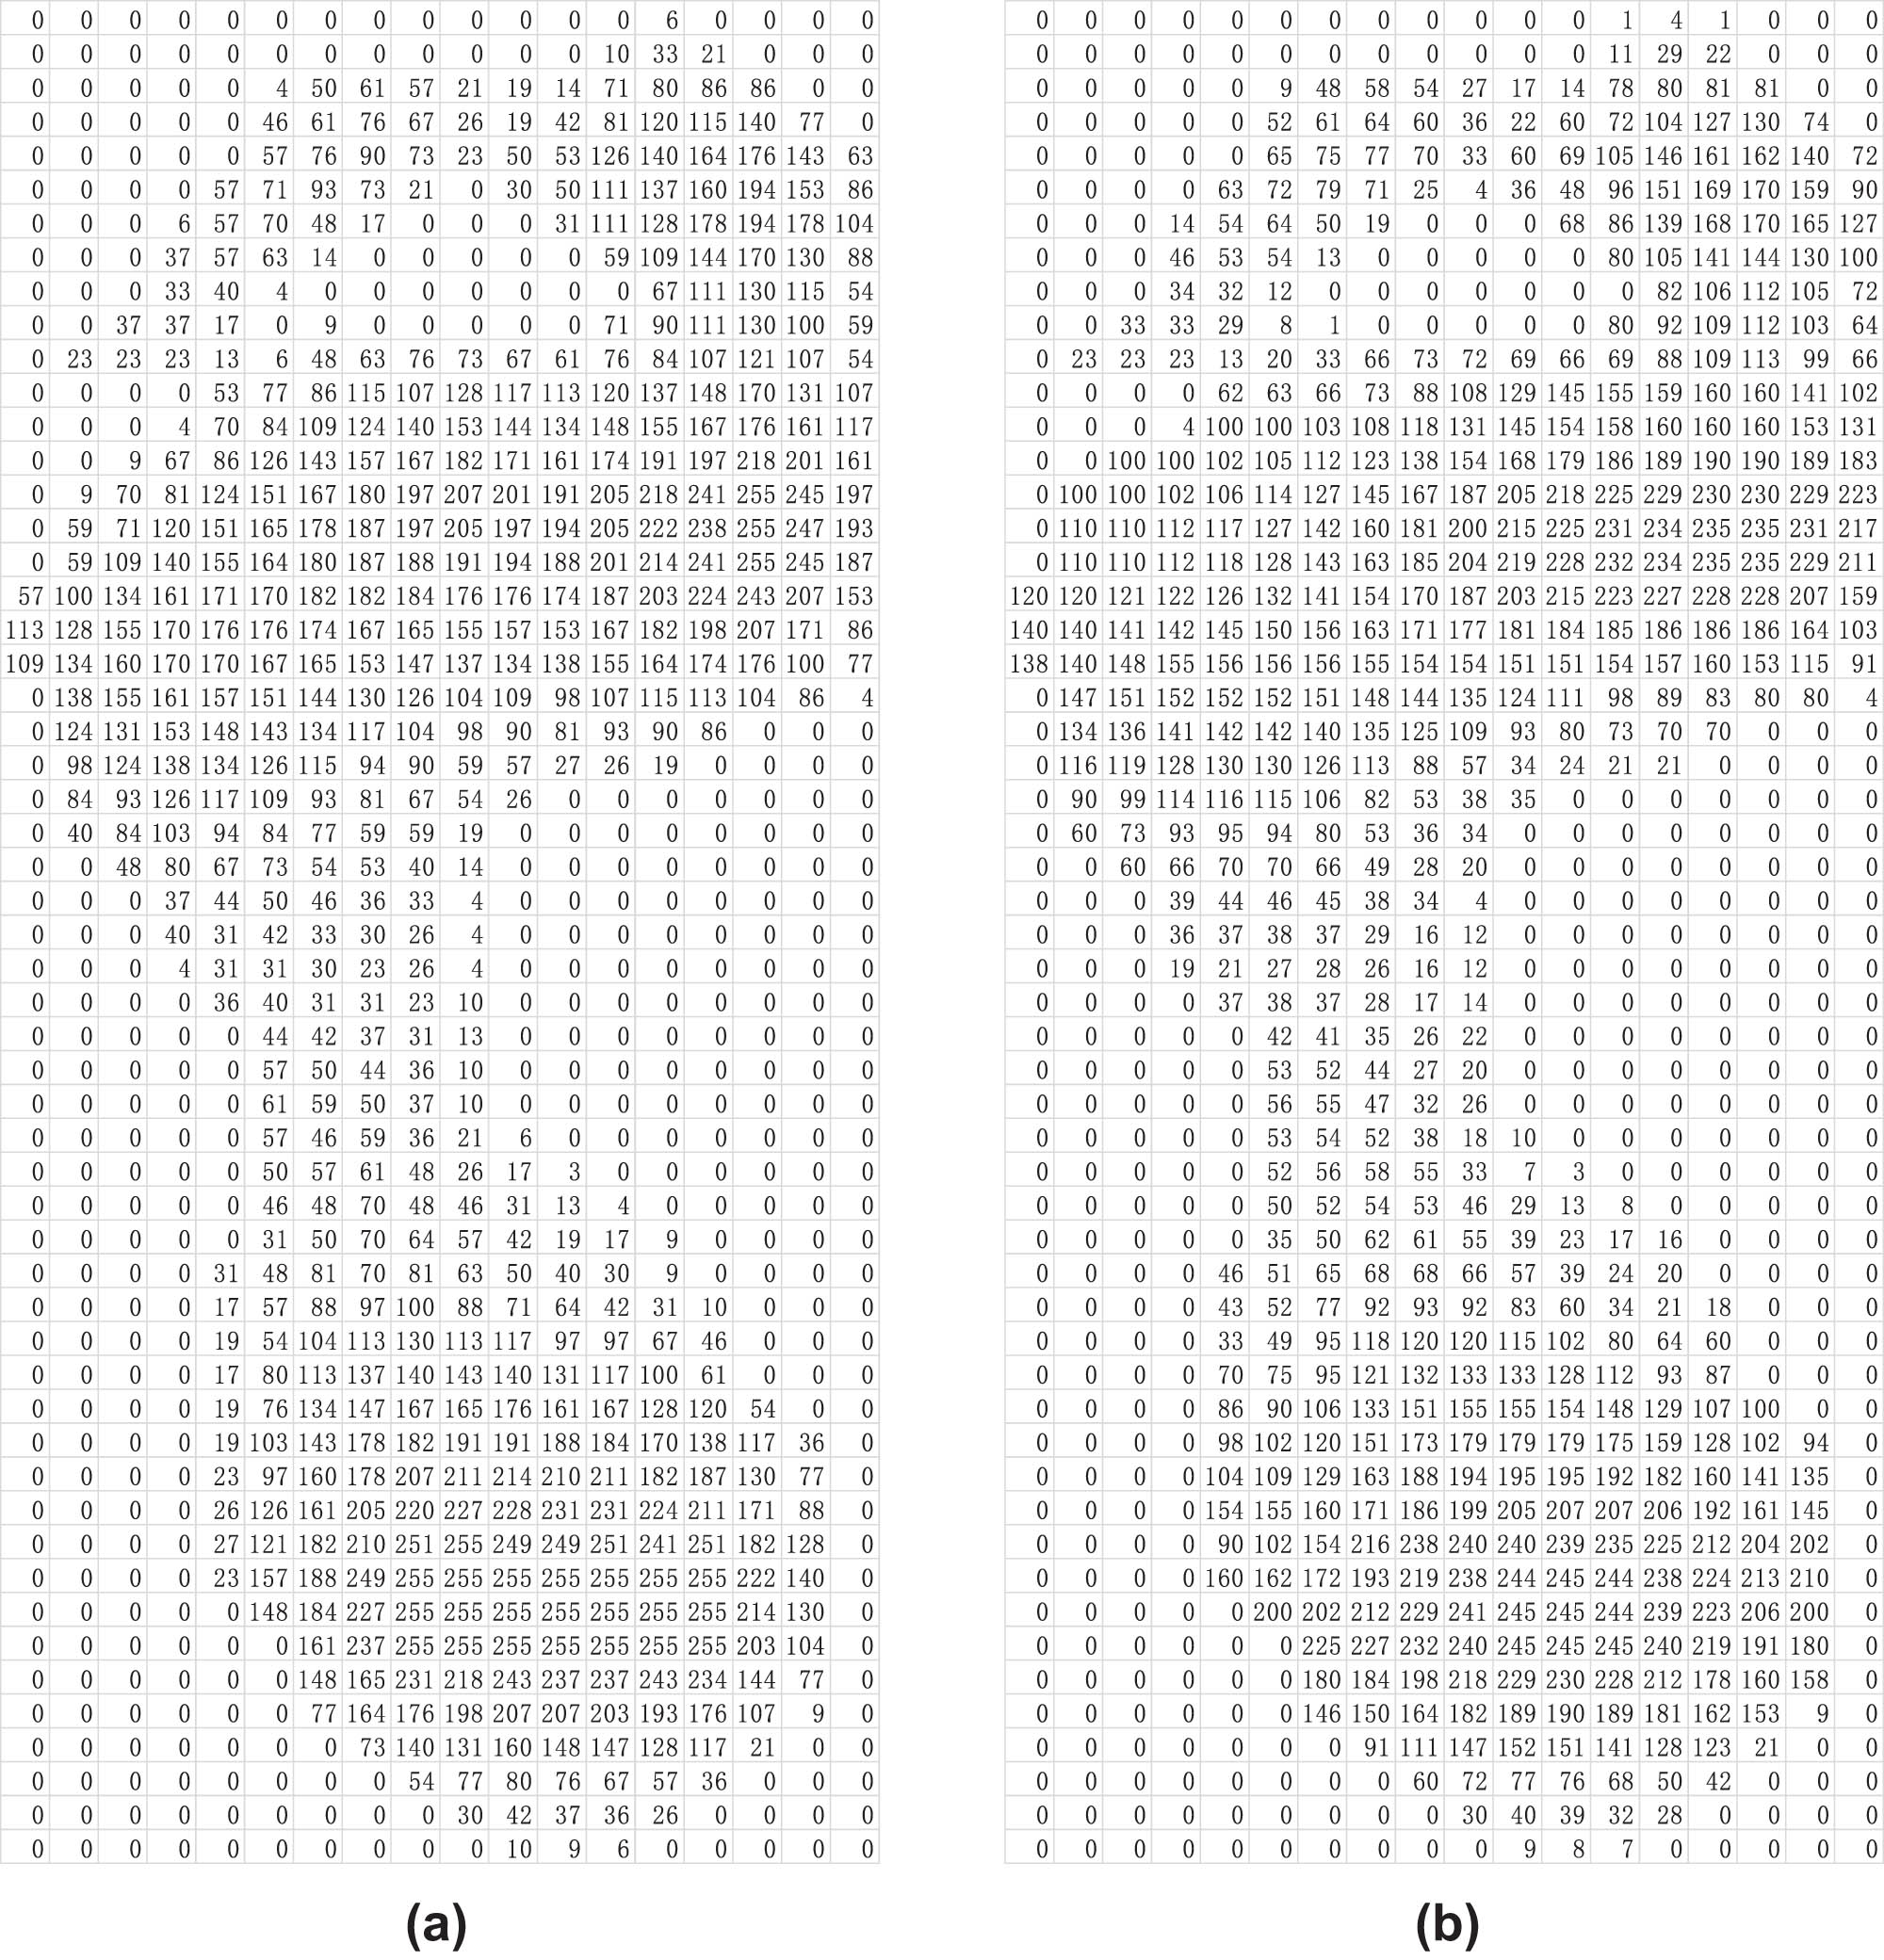
Data on force distribution before and after optimization. (a) Before optimization. (b) After optimization.
To achieve the optimized force distribution for 3D printed insoles, this study employs a combination of PSO and variable density methods to construct the lattice structure, aimed at enhancing the comfort and support of the insoles. By adjusting the rod diameters in different areas, it is possible to effectively change the stiffness and elasticity of the material, thereby optimizing the force characteristics of the insoles during use.
2.2.3 Lattice structure and variable density method
The basic lattice forms utilized include four types of lattice structures, as shown in Figure 6: body-centered cubic structure (BCC), vertex-centered structure (VC), body-centered cubic vertex structure (BCCZ), and face-centered cubic vertex structure (FCCZ). These structures exhibit significant differences in anisotropic mechanical properties and are widely representative. Additionally, a cubic envelope space is selected to facilitate the arrangement of the lattice within the design domain, resulting in a more regular structural boundary. The aim is to validate the optimization results through these four lattice forms.
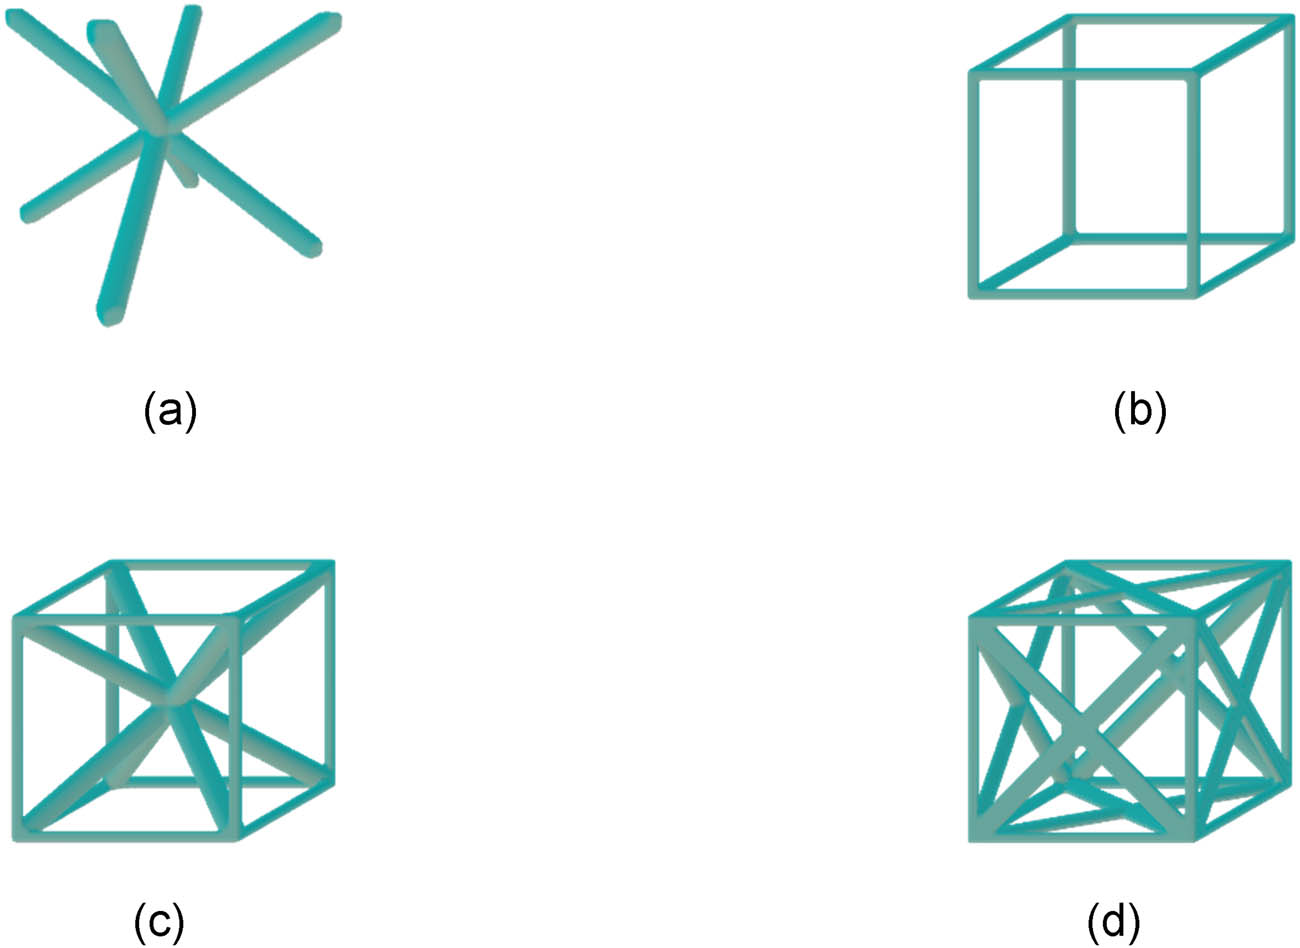
Lattice structure. (a) BCC, (b) VC, (c) BCCZ, and (d) FCCZ.
The mechanical properties of lattice structures are also related to their relative density. The relative density of a lattice structure is defined as the ratio of the equivalent density of the structure itself to the actual density of the base material, as shown in equation (7).
In this equation, ρ represents the equivalent density of the lattice structure itself and ρ 0 denotes the density of the base material of the lattice structure. The formulas (8)–(11) correspond to the relative density calculation results for BCC, VC, BCCZ, and FCCZ. In this study, the equivalent density of the lattice structure is calculated by considering the supporting rods. To simplify the calculation process, at the vertices of the lattice structure, although the rods overlap, they are still treated as complete supporting rods. As a result, the relative density obtained is somewhat higher and more conservative.
In these equations, d represents the diameter of the supporting rod, l denotes the length of the supporting rod, and L refers to the lattice dimension. From the relative density expressions of the four unit cells, it can be observed that the relative density of each lattice can be characterized by d/l, which is independent of the lattice dimension. The weight reduction ratio of the lattice structure refers to the percentage of pore volume relative to the total volume occupied by the entire lattice structure, denoted as P. The calculation method for the weight reduction ratio is related to the relative density, as indicated by the following formula:
The cubic envelope space lattice is consistent in all three directions, and the equivalent material belongs to orthotropic materials. Therefore, in the stiffness matrix, the coupling terms for tension and shear are both zero, and the coefficients in two orthogonal directions on the cross-section are the same. As a result, the 36 parameters in the fourth-order stiffness tensor matrix [C] can be reduced to three independent parameters: C 11, C 22, and C 44.
By taking the inverse of the matrix [C] from formula (12), we obtain its inverse matrix [T], as shown in formula (13). From the inverse matrix [S], the Young’s modulus E, shear modulus G, and Poisson’s ratio v can be derived as follows:
This study selects four lattice configurations from the previous section for homogenization analysis, with TPU70A as the chosen material, having an elastic modulus of 3.6 MPa, a tensile strength of 32 MPa, a density of 1.08 g/cm3, and a Poisson’s ratio of 0.42. The size of the single lattice is selected as 4 × 4 × 4 mm3. Based on the Young’s modulus E, shear modulus G, and Poisson’s ratio v data for different relative density lattice configurations, it is possible to achieve variations by changing the diameter of the lattice support rods and applying gradient changes. The variable density lattice structure is shown in Figure 7.
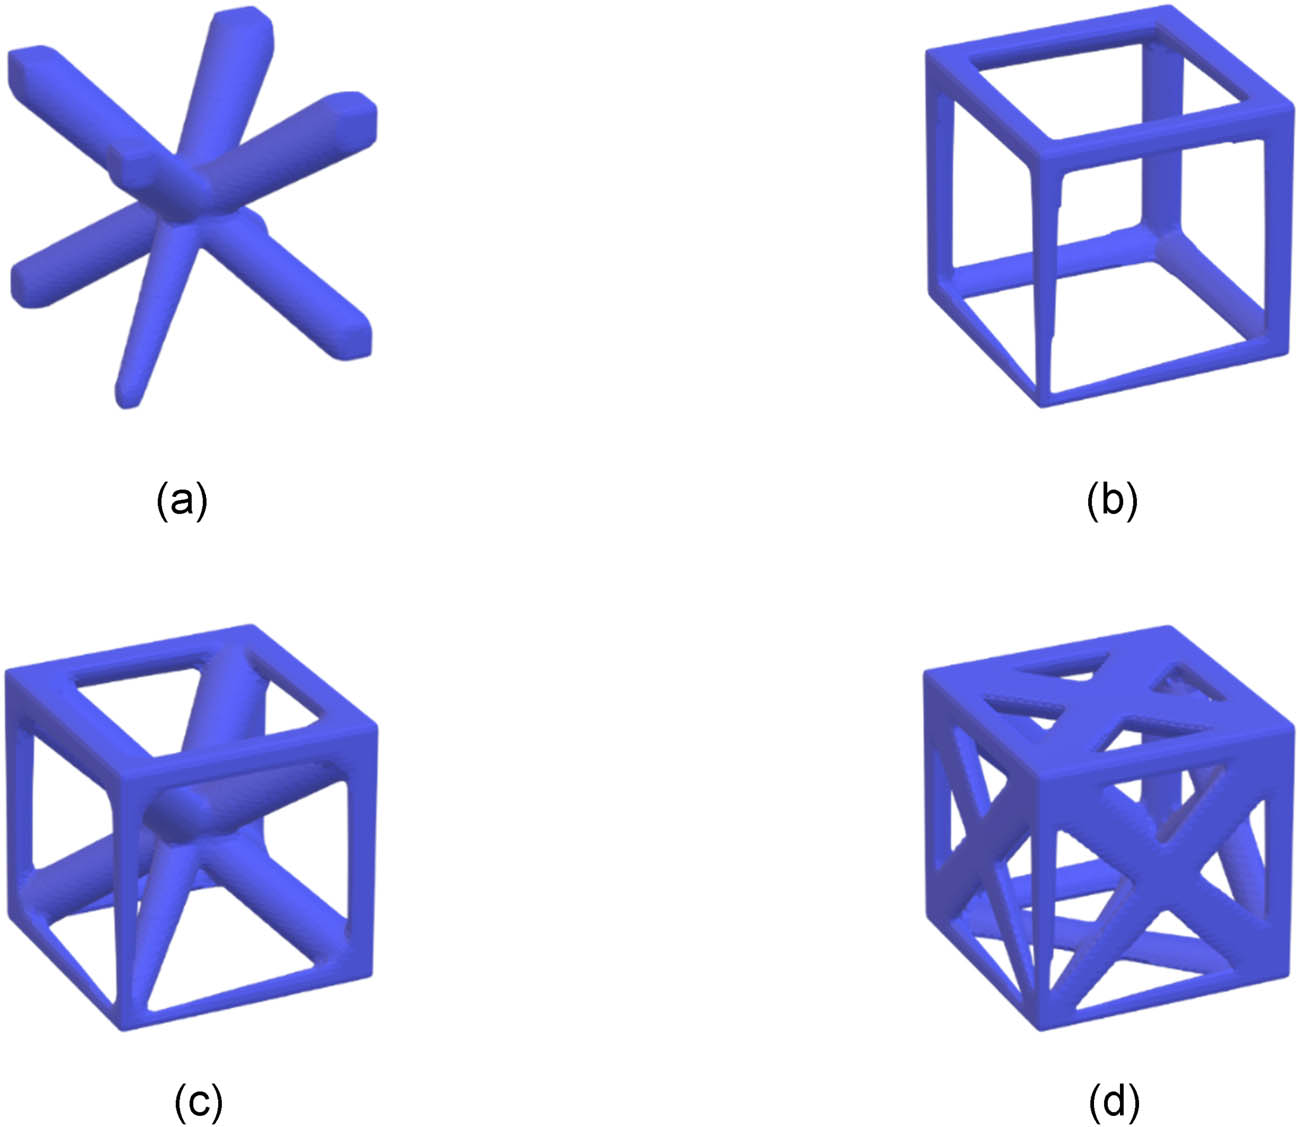
Variable density lattice structure. (a) BCC, (b) VC, (c) BCCZ, and (d) FCCZ.
3 Results and discussion
3.1 Construction of uniform density and PSO variable density lattice structure insoles
Using four types of lattice structures: BCC, VC, BCCZ, and FCCZ, the insoles were filled with both uniform density and variable density structures combined with the PSO algorithm. The filling results are shown in Figure 8. The upper right section displays the results of using a uniform density lattice for insole filling, while the lower right section illustrates the effects of using a variable density lattice for filling.
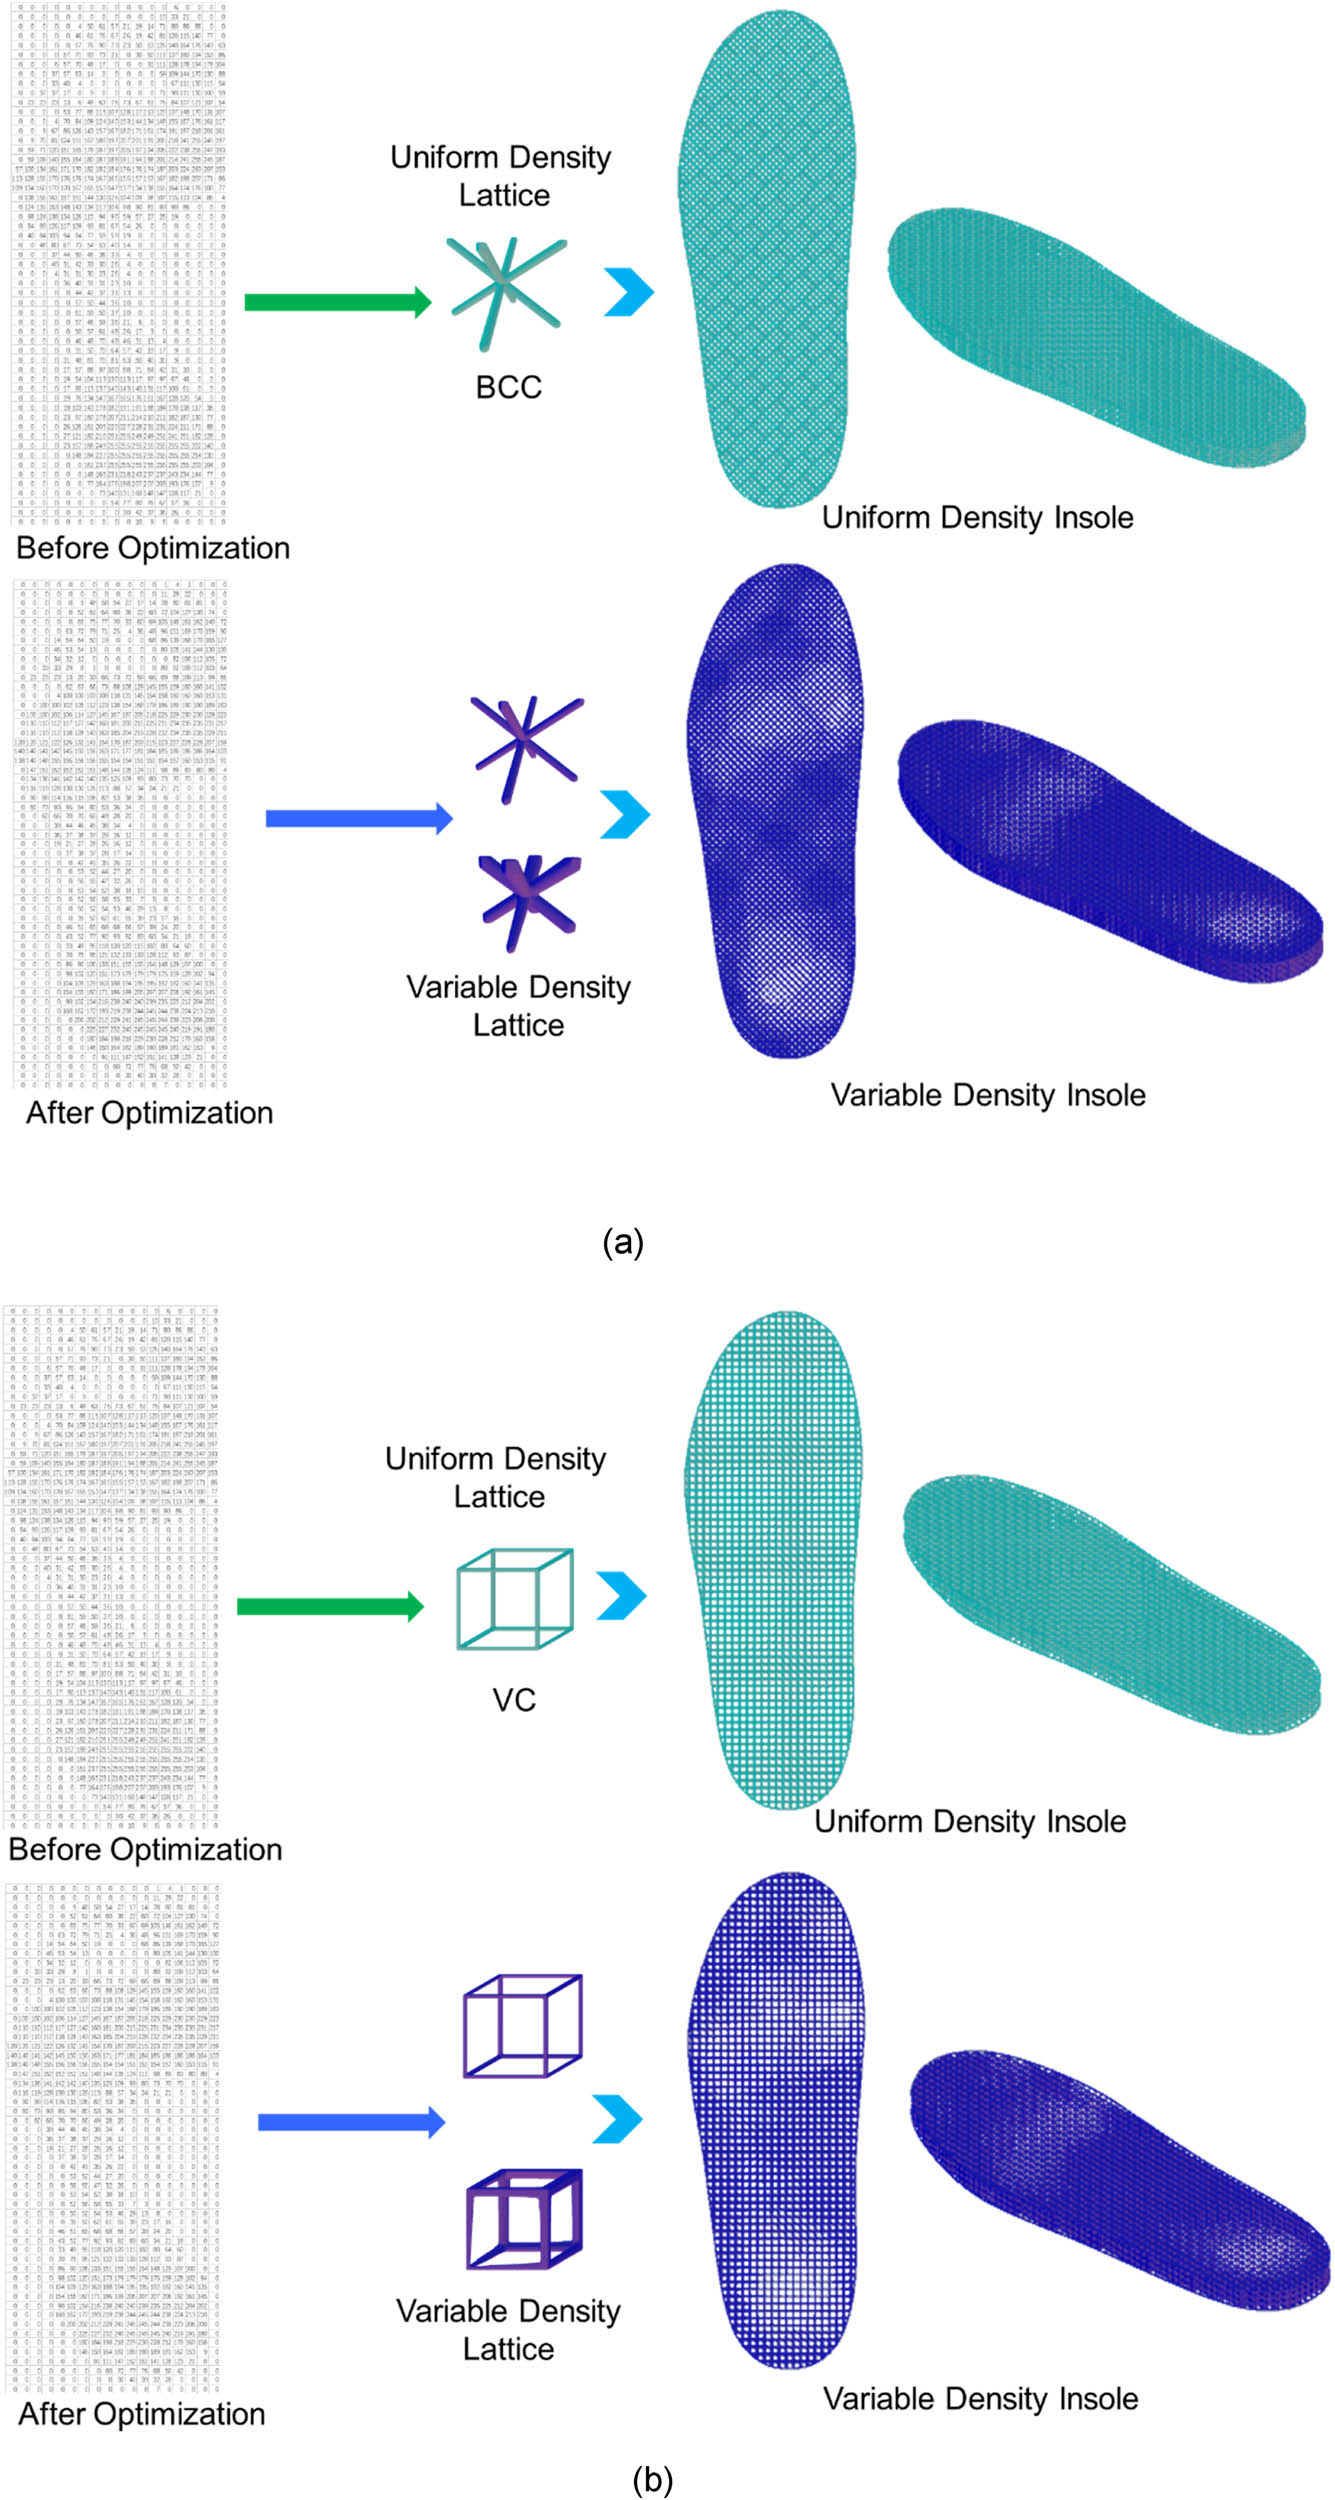
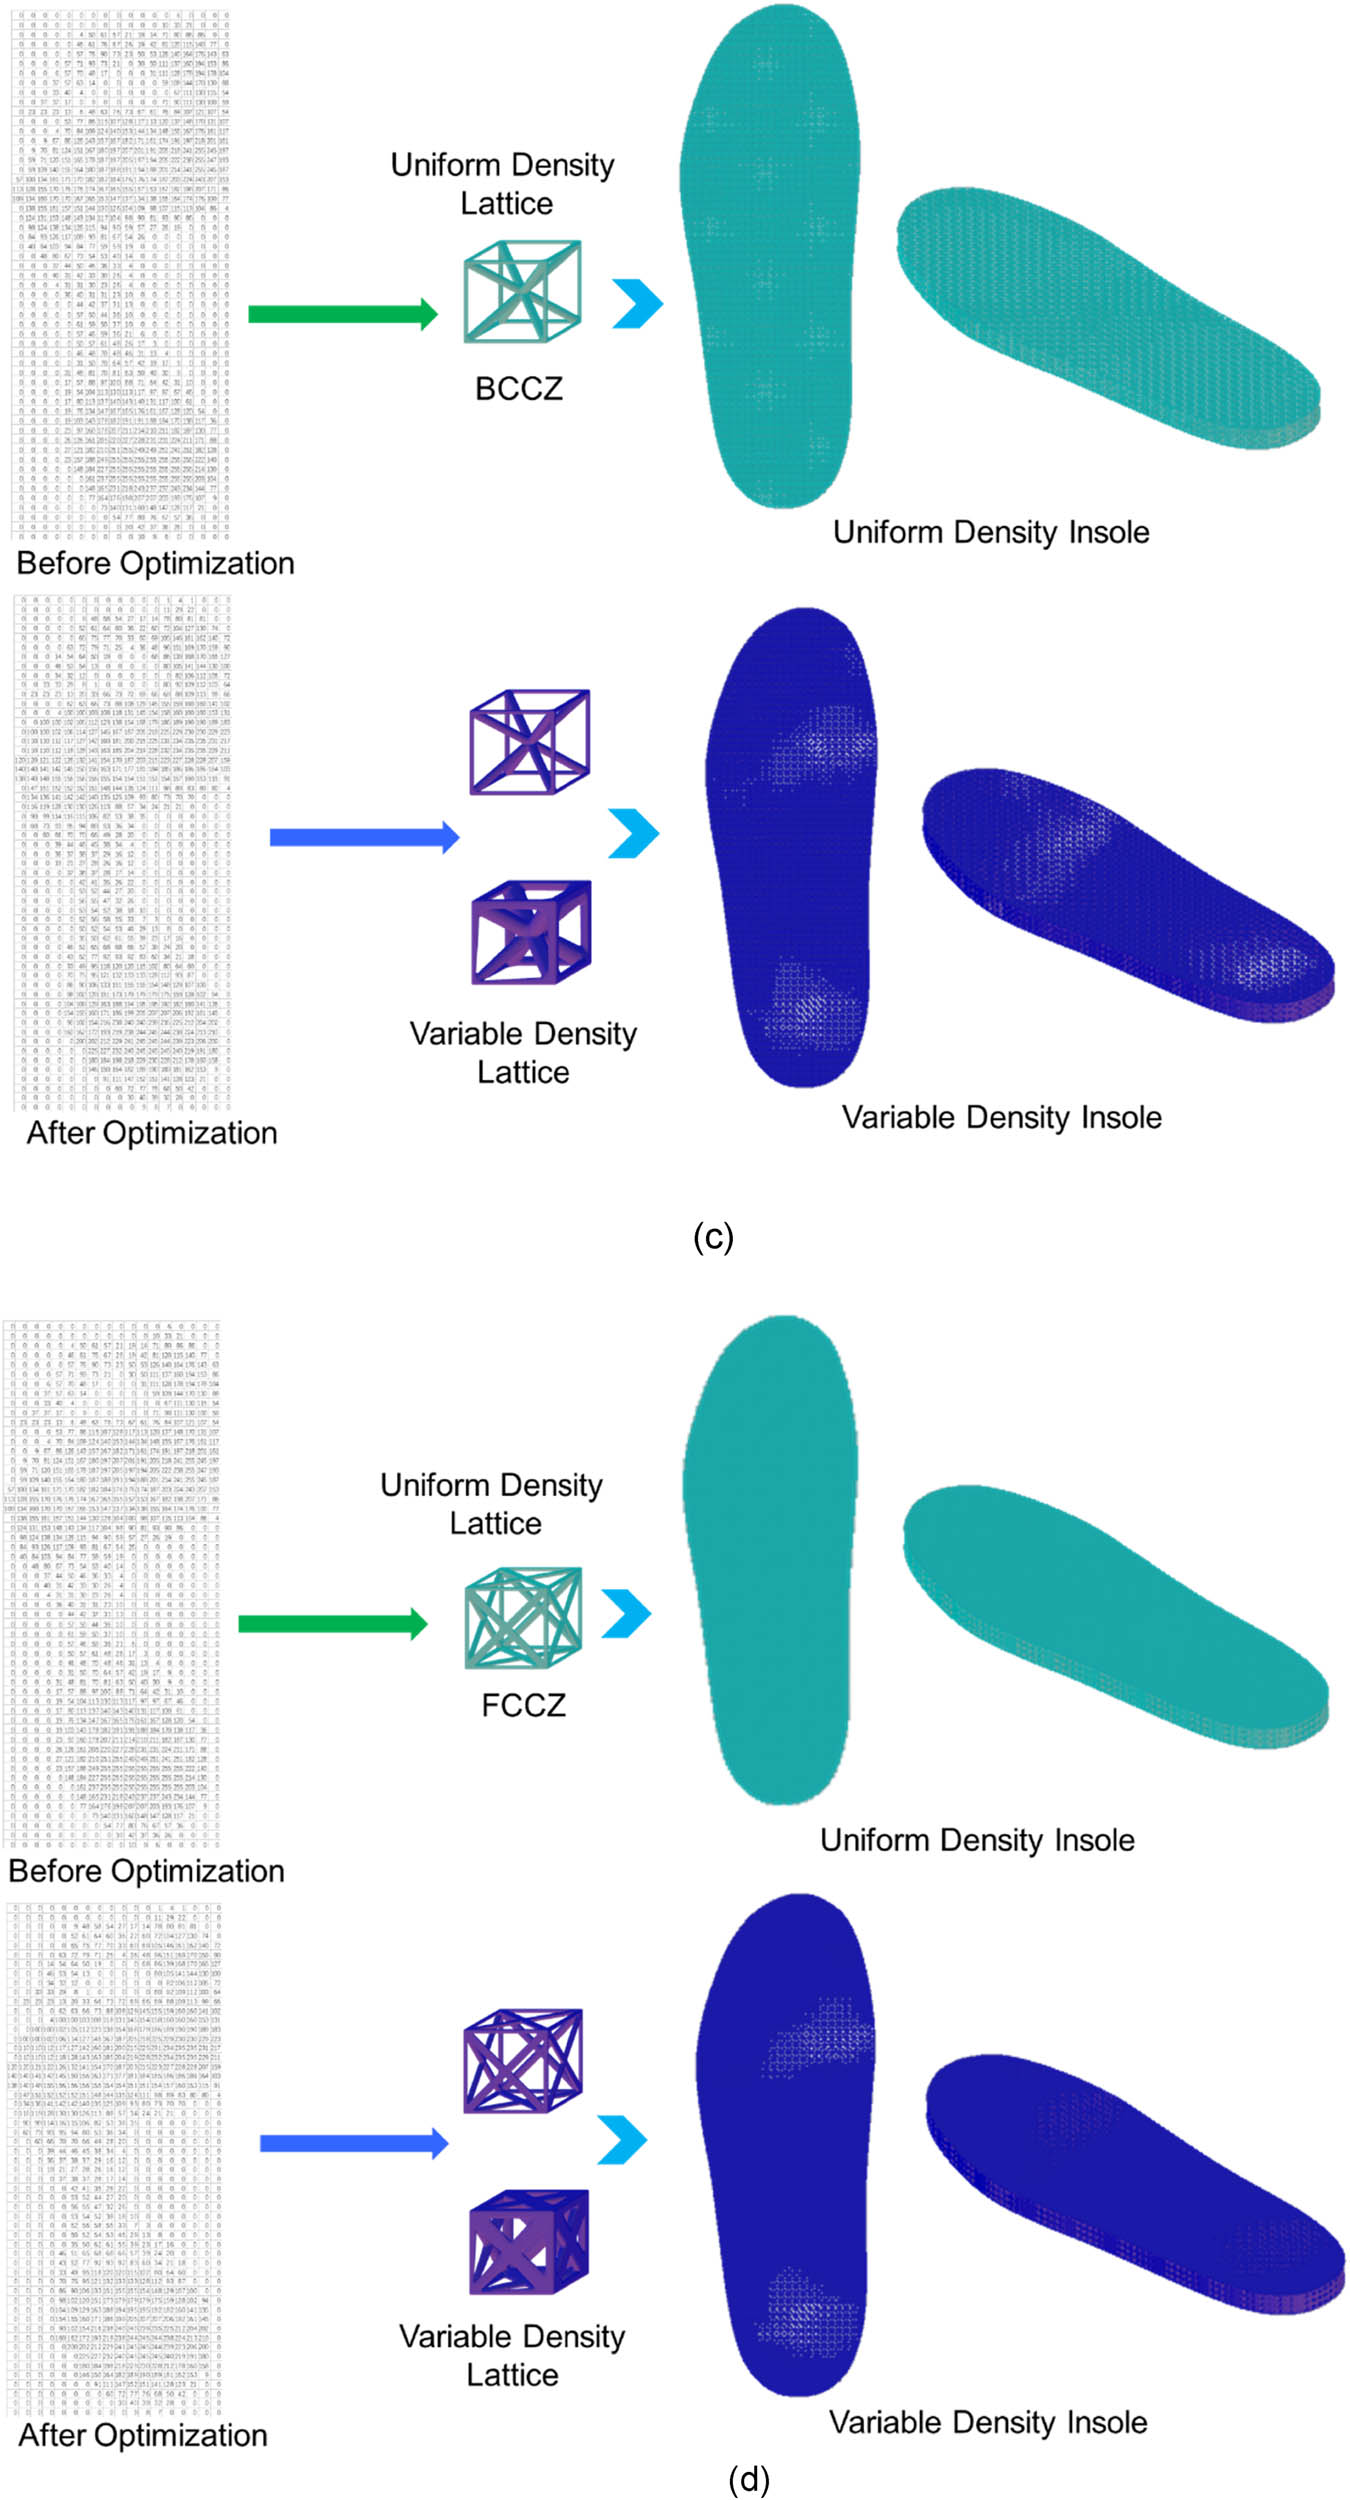
Force distribution of insoles before and after optimization. (a) BCC, (b) VC, (c) BCCZ, and (d) FCCZ.
The results indicate that insoles filled with BCC and VC lattice structures are relatively sparse in overall density. This design not only significantly reduces the weight of the insoles but also meets the daily lightweight requirements, making them suitable for long-term wear and casual activities. In contrast, insoles filled with BCCZ and FCCZ lattice structures exhibit higher filling density and stronger support performance, making them more suitable for sport scenarios that involve higher loads.
Furthermore, a pressure optimization model based on the PSO combined with a variable density algorithm was constructed to dynamically adjust the pressure distribution of the insoles. The PSO algorithm optimizes the pressure distribution across different areas of the insoles by simulating the iterative search process of particles within the solution space. The variable density algorithm optimizes the local parameters of the lattice structure according to the mechanical demands of different regions of the foot, thereby adjusting the stiffness and elasticity distribution characteristics within the insoles. During the optimization process, the pressure optimization model gradually reduces the excessive pressure in areas of high stress concentration while enhancing the support performance in low-pressure areas, creating a pressure distribution state that is more aligned with ergonomic requirements.
3.2 3D printed lattice structure insoles
The manufacturing process parameters of the lattice structure insoles directly affect the print quality and structural performance. Table 1 lists the printing process parameters used in the experiment with TPU70A filament, including the nozzle temperature, build plate temperature, print layer thickness, nozzle diameter, filling density, and enclosure temperature.
Manufacturing process parameters for lattice structure insoles
| Process name | Process parameters |
|---|---|
| Nozzle temperature (°C) | 215–240 |
| Build plate temperature (°C) | 20 |
| Print layer thickness (mm) | 0.2 |
| Nozzle diameter (mm) | 0.4 |
| Filling density | 100% |
| Enclosure temperature (°C) | 25–35 |
In the design process of lattice structures, the VC structure, due to its nodes being concentrated at the vertices of the unit, exhibits higher symmetry and uniformity, making it easier to control achieving precision and material distribution during printing. On the other hand, the BCCZ structure incorporates inclined struts at the center of each unit to create a more complex three-dimensional network. This design not only enhances the strength and stability of the structure but also effectively addresses more complex loading conditions. Therefore, the selection of these two lattice structures provides a solid basis for comparison in the experiment. Thus, the experiment focused on the VC and BCCZ lattice structures, conducting 3D printing of insoles before and after optimization, as shown in Figure 9.
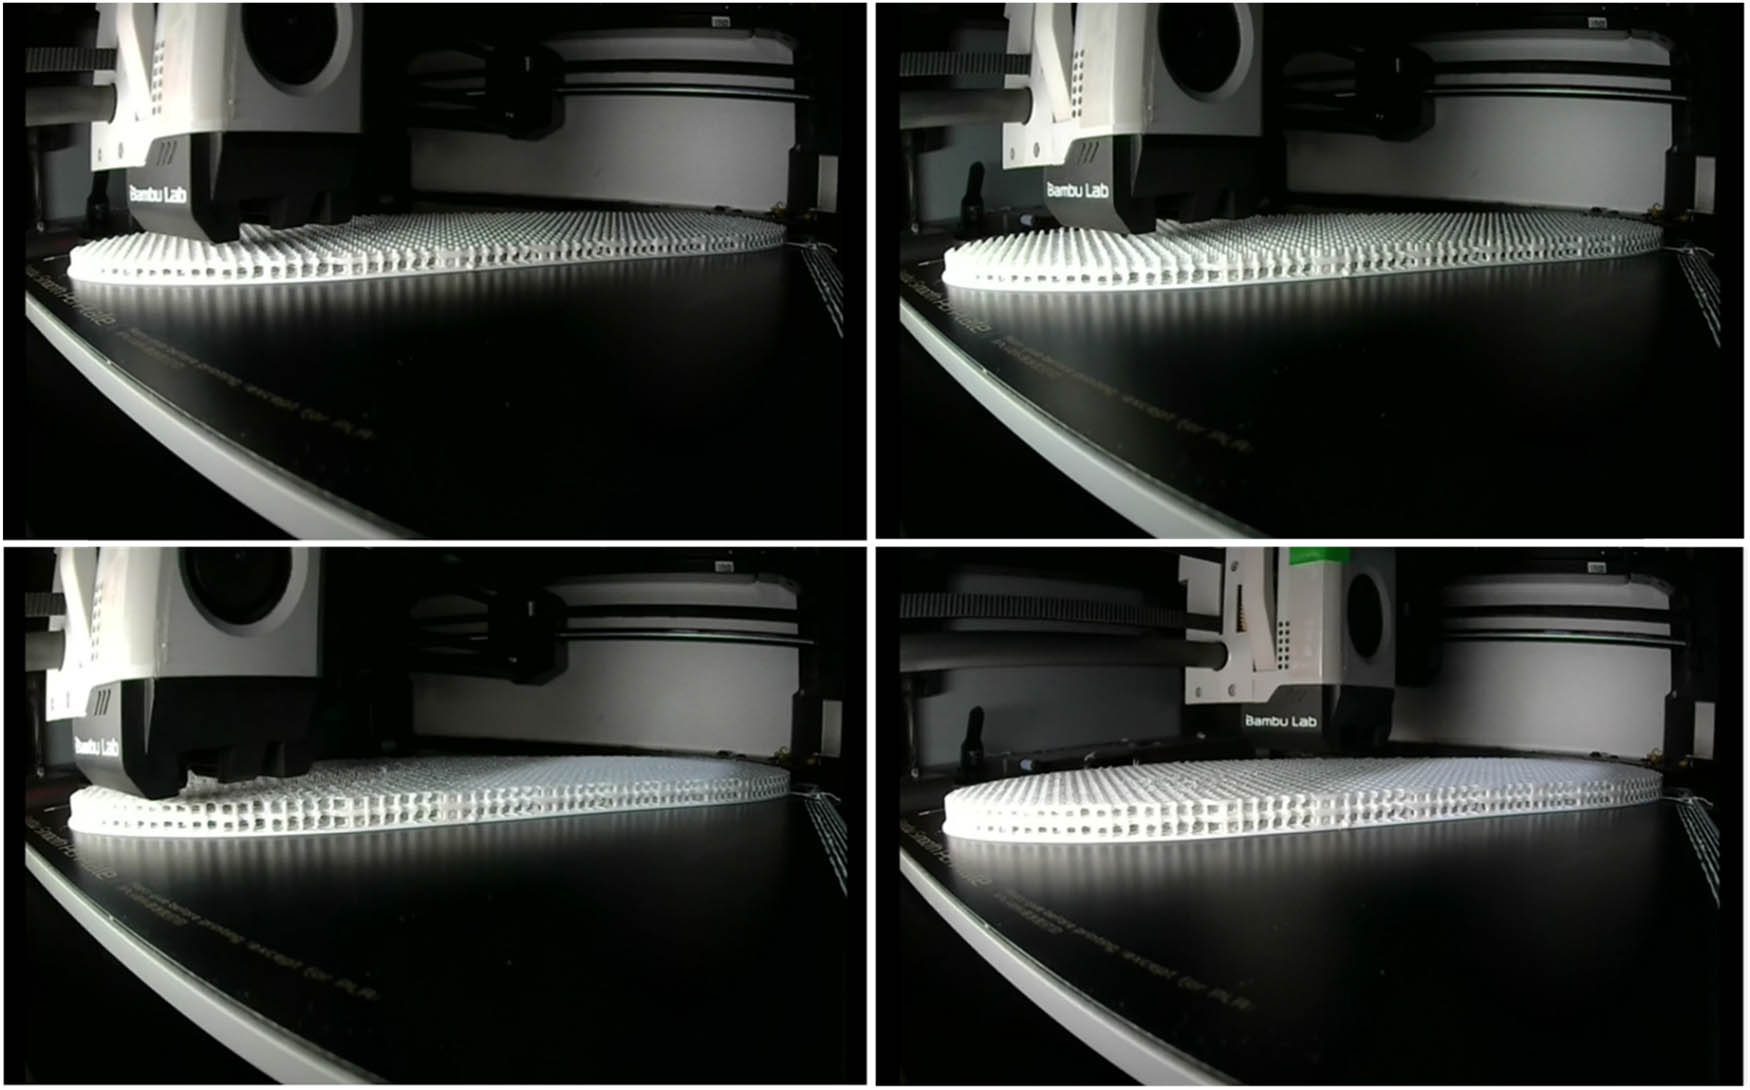
3D printing process of insoles.
Using the equal density VC lattice structure, PSO combined with variable density VC lattice structure, equal density BCCZ lattice structure, and PSO combined with variable density BCCZ lattice structure, insoles were printed. The results of the 3D printing are shown in Figure 10.
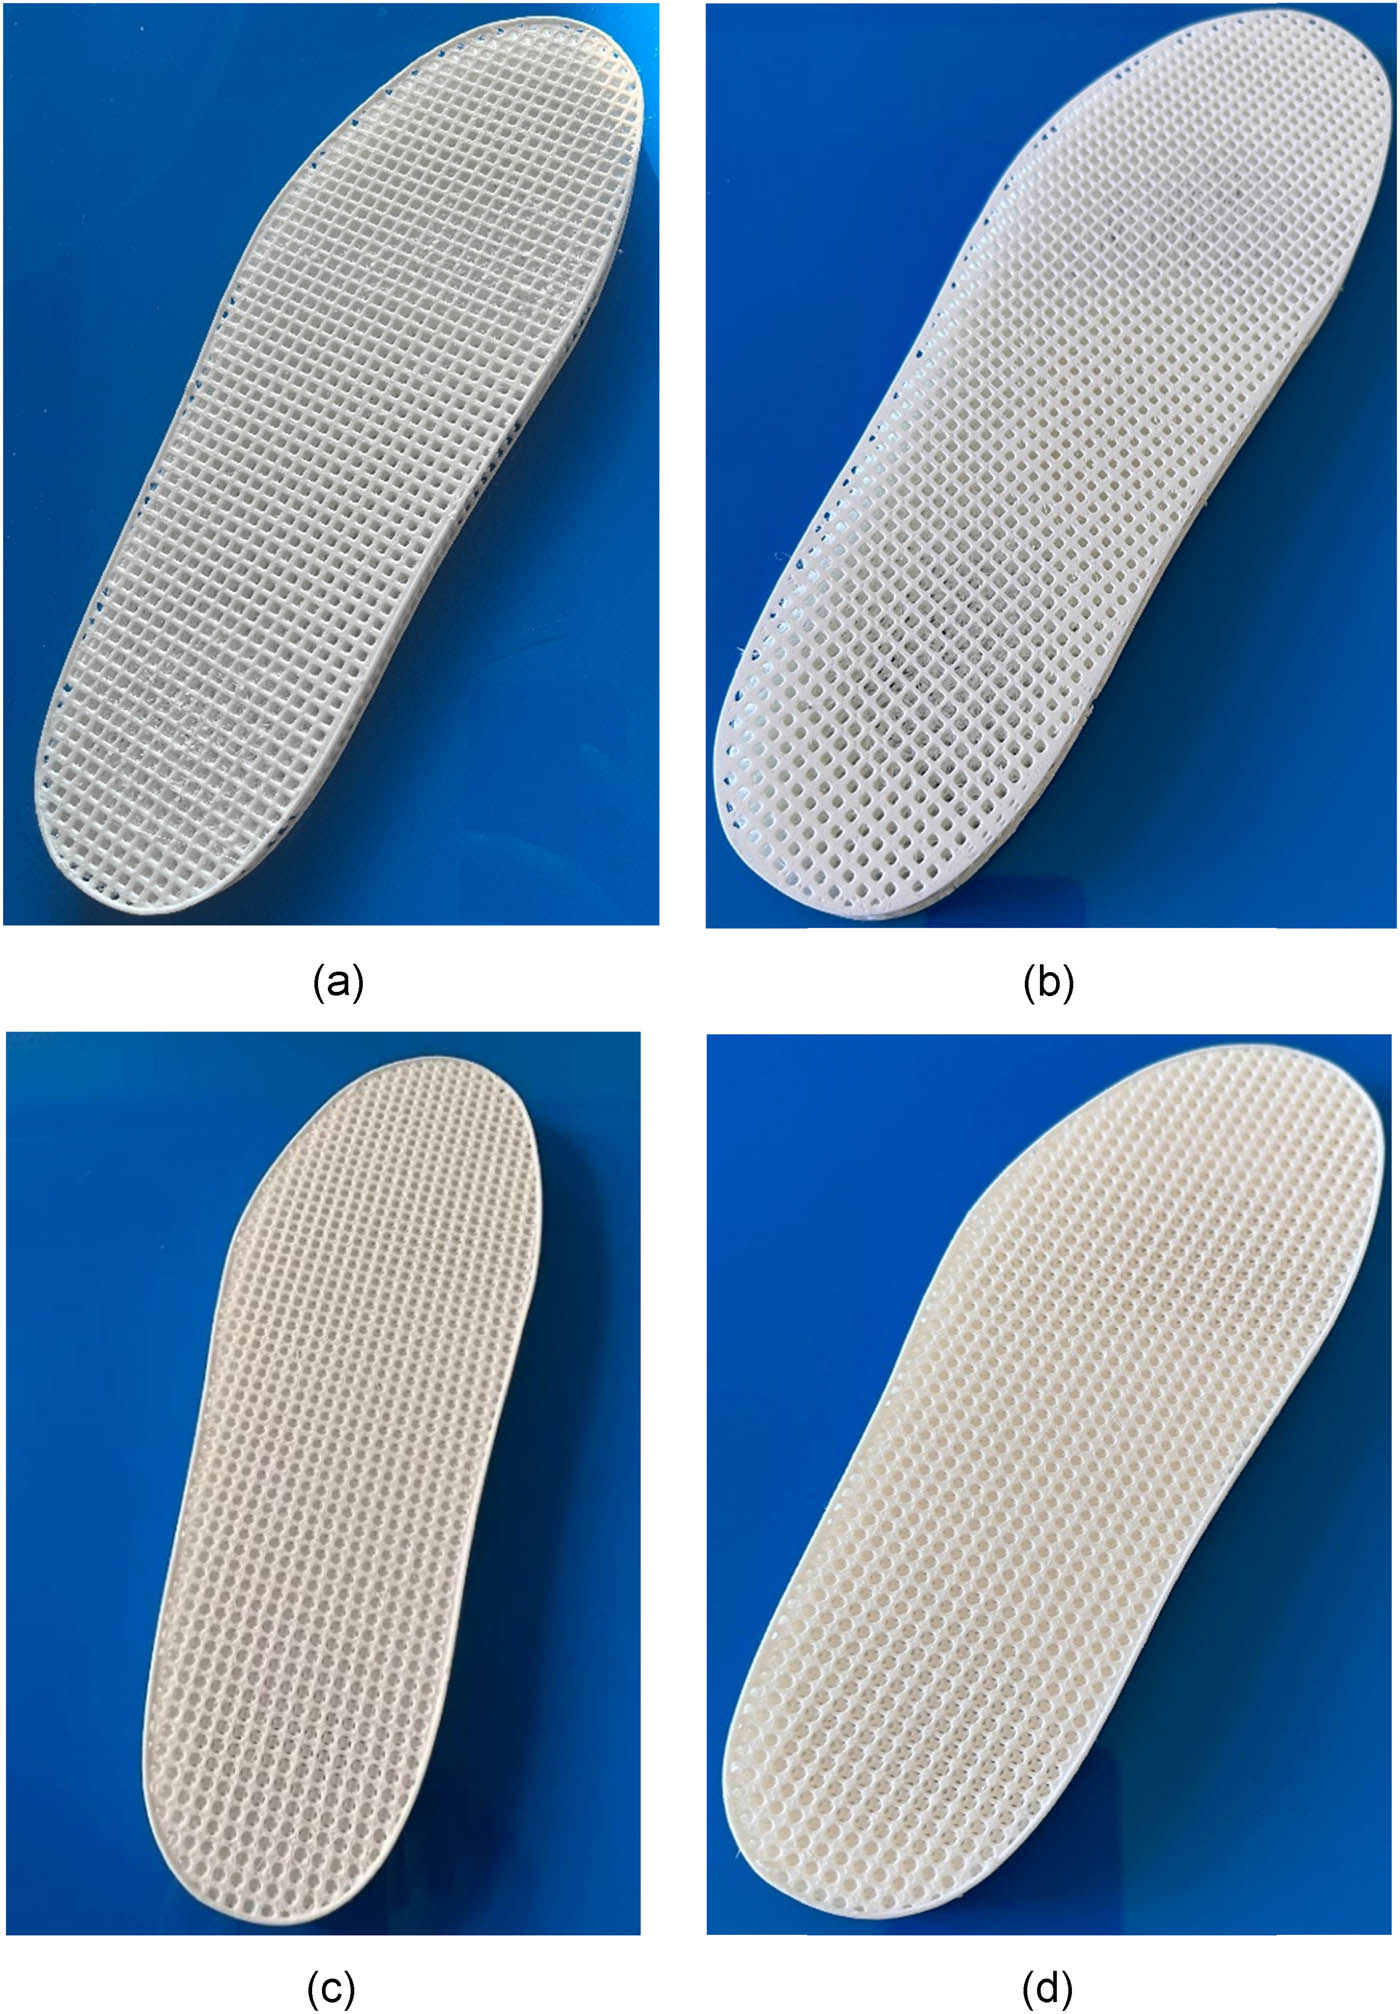
Results of 3D printed insoles. (a) Uniform density VC. (b) PSO and variable density VC. (c) Uniform density BCCZ. (d) PSO and variable density BCCZ.
3.3 Result analysis
According to the experimental conditions established in Figure 1, a foot pressure analysis was conducted on the above-mentioned 3D printed insoles, and the results are shown in Figure 11.
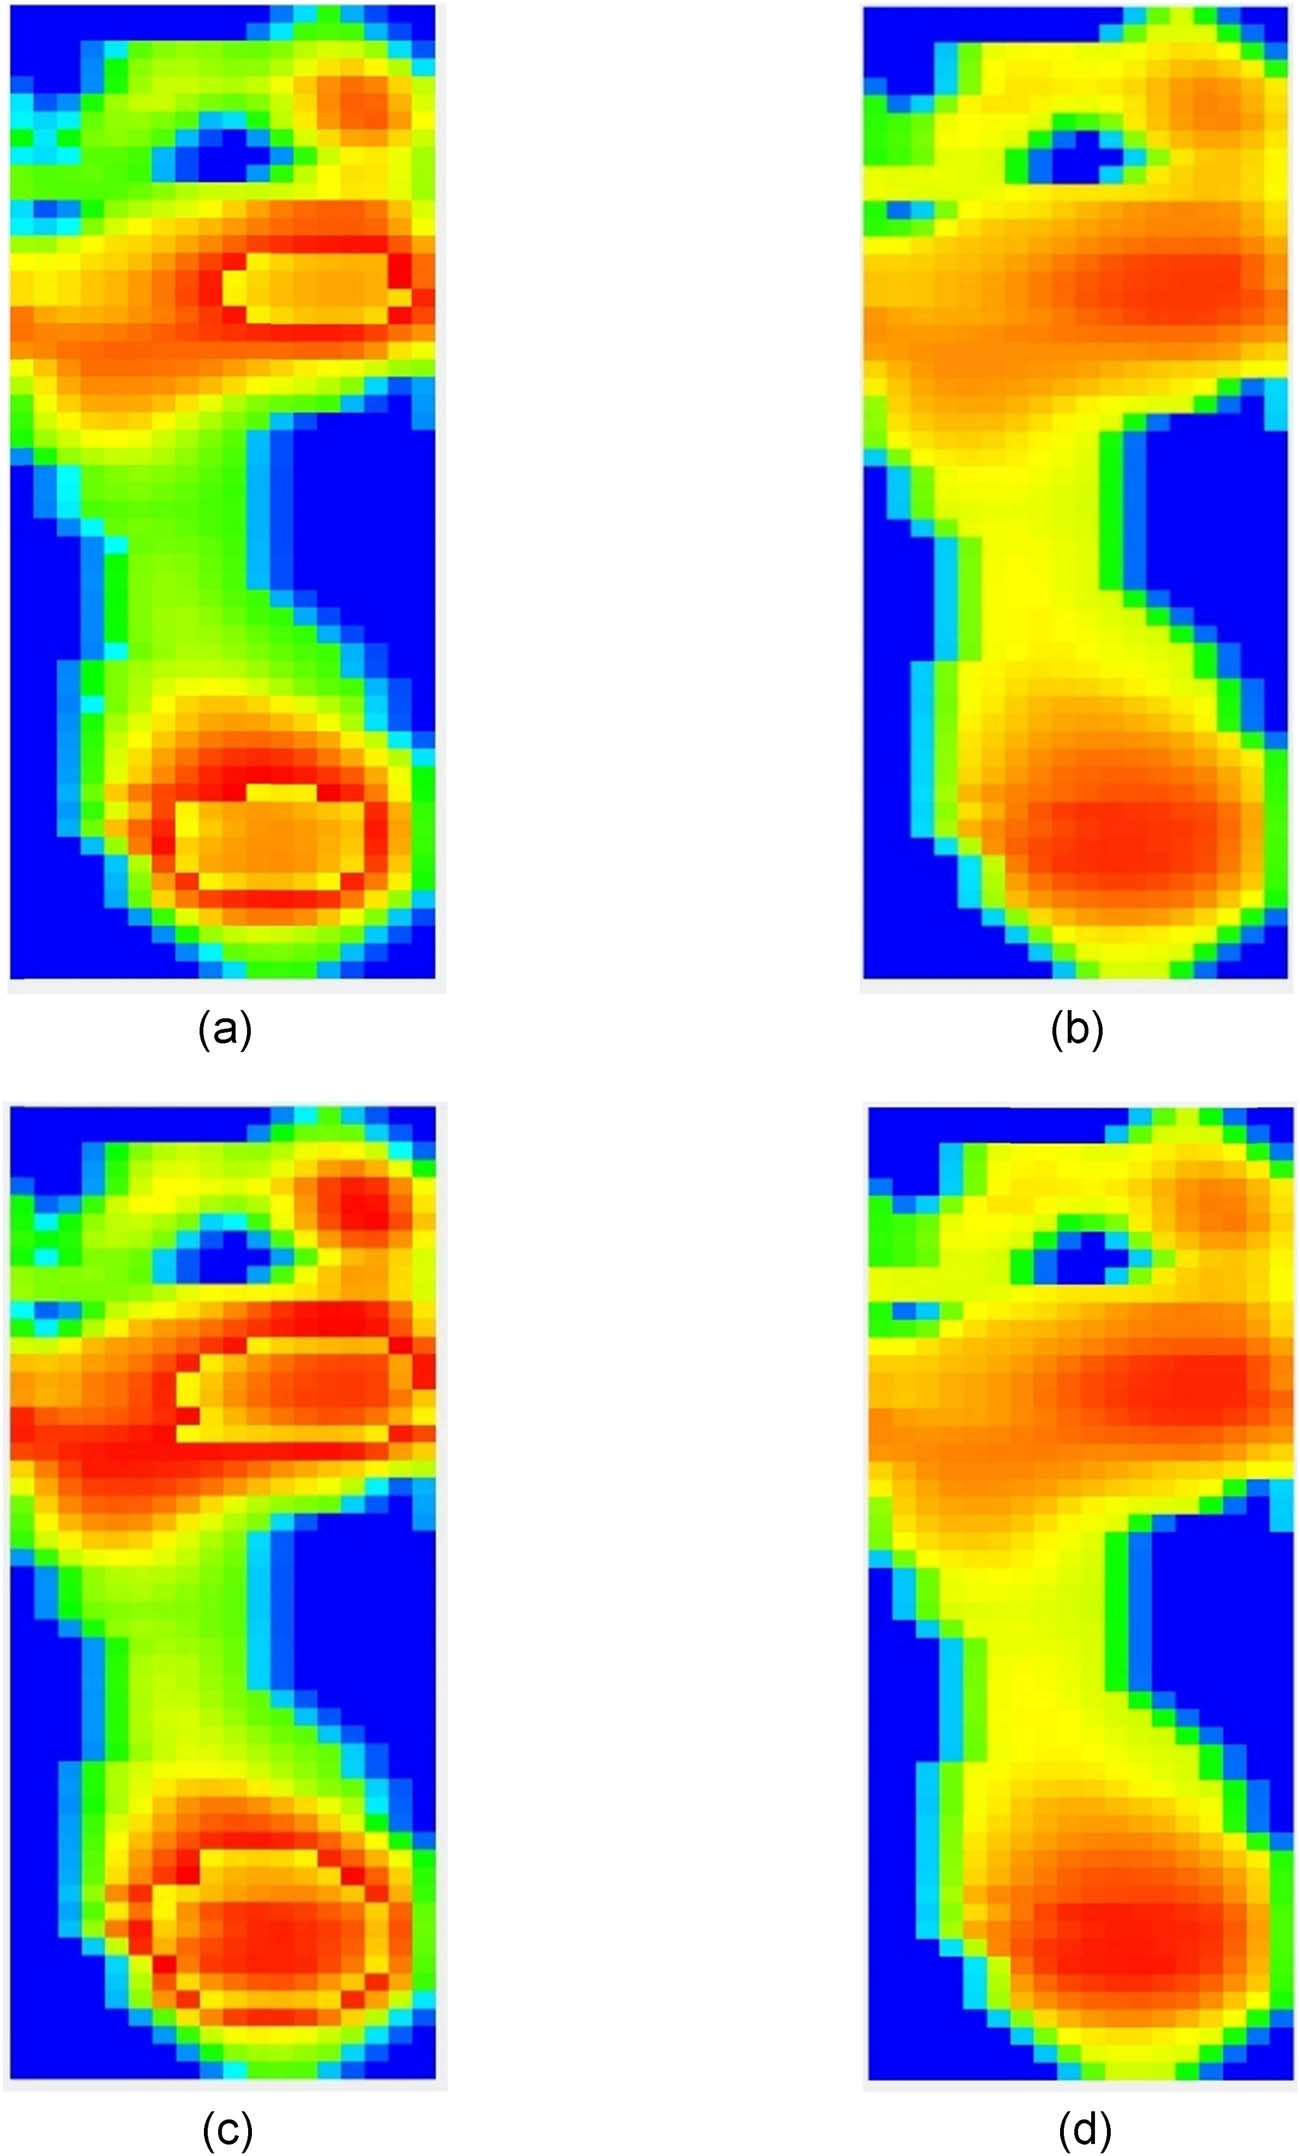
Pressure distribution cloud map of insoles before and after optimization. (a) Uniform density VC. (b) PSO and variable density VC. (c) Uniform density BCCZ. (d) PSO and variable density BCCZ.
Figure 11(a) shows the insole formed by the unoptimized VC lattice structure. Figure 11(b) shows the insole formed by the optimized VC lattice structure. Figure 11(c) shows the insole formed by the unoptimized BCCZ lattice structure. Figure 11(d) shows the insole formed by the optimized BCCZ lattice structure. By studying the pressure distribution cloud maps of the insoles before and after optimization, it is evident that the optimized lattice structure insoles demonstrate significant improvements in load-bearing performance and deformation uniformity. The insoles before optimization show a concentrated pressure distribution in the load-bearing areas, which can easily lead to stress concentration in certain regions. In contrast, the optimized insoles achieve a more uniform pressure distribution, significantly reducing the localized stress concentration and increasing the overall comfort and durability.
The results indicate that the pressure distribution of the optimized insoles has been significantly improved, especially in high-load areas, allowing for more effective dispersion of the pressure applied to the insoles, thereby enhancing comfort and functionality during wear. Experimental analysis shows that the combination of PSO and variable density algorithms plays an important role in optimizing the manufacturing and performance enhancement of lattice structure insoles, providing a reference for future insole design.
4 Conclusions
This study employed the PSO algorithm to achieve uniformity in the stress distribution of insoles, validating the effectiveness of the optimization algorithm in insole design. Through a detailed comparison of the stress distribution before and after optimization, the results demonstrated that pressure in critical areas such as the forefoot and heel was effectively dispersed after optimization, resulting in a more uniform stress distribution. This change not only enhanced the comfort of the insoles but also significantly reduced the risk of fatigue and long-term health issues caused by uneven stress.
The research indicates that reasonable structural design has a significant impact on the performance of insoles. The results of this study lay a theoretical foundation for the design and optimization of personalized 3D-printed insoles, suggesting that the combination of the PSO algorithm and variable density methods can effectively improve the comfort and performance of insoles.
Acknowledgments
The authors disclosed receipt of the following financial support for the research, authorship, and/or publication of this article: This research was financially funded by the National Natural Science Foundation of China (No. 52205248).
-
Funding information: This work was supported by the National Natural Science Foundation of China (Grant No. 52205248).
-
Author contributions: Jiali Zhao: conceptualization, methodology, writing – original draft. Jinhai Liu: data curation, formal analysis, visualization, supervision. Yuan Liu: investigation, resources, validation, writing – review & editing, project administration.
-
Conflict of interest: Authors state no conflict of interest.
-
Ethical approval: The conducted research is not related to either human or animals use.
-
Data availability statement: The datasets generated during and/or analysed during the current study are available from the corresponding author on reasonable request.
References
[1] Spencer, S. R., Watts, L. K. (2020). Three-dimensional printing in medical and allied health practice: a literature review. Journal of Medical Imaging and Radiation Sciences, 51(3), 489–500. 10.1016/j.jmir.2020.06.003.Search in Google Scholar PubMed
[2] Jandova, S., Mendricky, R. (2022). Benefits of 3D printed and customized anatomical footwear insoles for plantar pressure distribution. 3D Printing and Additive Manufacturing, 9(6), 547–556. 10.1089/3dp.2021.0002.Search in Google Scholar PubMed PubMed Central
[3] Zhao, S., Qi, Z., Cao, Z., Yu, B. (2022). Effect of 3D printed arch-support insoles on plantar pressure distribution in flat feet. Leather Science and Engineering, 32(3), 85–89. 10.19677/j.issn.1004-7964.2022.03.0016.Search in Google Scholar
[4] Cherni, Y., Desmyttere, G., Hajizadeh, M, Bleau J., Mercier C., Begon M. (2022). Effect of 3D printed foot orthoses stiffness on muscle activity and plantar pressures in individuals with flexible flatfeet: a statistical non-parametric mapping study. Clinical Biomechanics (Bristol, Avon), 92, 105553. 10.1016/j.clinbiomech.2021.105553.Search in Google Scholar PubMed
[5] Berkeley, R., Tennant, S., Saifuddin, A. (2021). Multimodality imaging of the paediatric flatfoot. Skeletal Radiology, 50(11), 2133–2149. 10.1007/s00256-021-03806-8.Search in Google Scholar PubMed
[6] Desmyttere, G., Hajizadeh, M., Bleau, J, Leteneur, S., Begon, M. (2021). Anti-pronator components are essential to effectively alter lower-limb kinematics and kinetics in individuals with flexible flatfeet. Clinical Biomechanics (Bristol, Avon), 86, 105390. 10.1016/j.clinbiomech.2021.105390.Search in Google Scholar PubMed
[7] Cheng, K. W., Peng, Y., Chen, T. L., Zhang, G., Cheung, J. C., Lam, W. K., et al. (2021). A three-dimensional printed foot orthosis for flexible flatfoot: an exploratory biomechanical study on arch support reinforcement and undercut. Materials (Basel), 14(18), 5297. 10.3390/ma14185297.Search in Google Scholar PubMed PubMed Central
[8] Guerra Silva, R., Salinas Estay, C., Morales Pavez, G, Zahr Viñuela, J., Torres, M. J. (2021). Influence of geometric and manufacturing parameters on the compressive behavior of 3D printed polymer lattice structures. Materials, 14(6), 1462. 10.3390/ma14061462.Search in Google Scholar PubMed PubMed Central
[9] Hsu, C. Y., Wang, C. S., Lin, K. W, Chien, M. J., Wei, S. H., Chen, C. S. (2022). Biomechanical analysis of the flatfoot with different 3D-printed insoles on the lower extremities. Bioengineering (Basel), 9(10), 563. 10.3390/bioengineering9100563.Search in Google Scholar PubMed PubMed Central
[10] Seharing, A., Azman, A. H., Abdullah, S. (2020). A review on integration of lightweight gradient lattice structures in additive manufacturing parts. Advances in Mechanical Engineering, 12(6), 1687814020916951. 10.1177/1687814020916951.Search in Google Scholar
[11] Yuan, S., Li, S., Zhu, J, Tang, Y. (2021). Additive manufacturing of polymeric composites from material processing to structural design. Composites Part B: Engineering, 219, 108903. 10.1016/j.compositesb.2021.108903.Search in Google Scholar
[12] Chen, K., Zhou, F. Y., Liu, A. L. (2018). Chaotic dynamic weight particle swarm optimization for numerical function optimization. Knowledge-Based Systems, 139, 23–40. 10.1016/j.knosys.2017.10.011.Search in Google Scholar
[13] Li, W., Sun, B., Huang, Y., Mahmoodi, S. (2022). Adaptive complex network topology with fitness distance correlation framework for particle swarm optimization. Journal of Intelligent Systems, 37(8), 5217–5247. 10.1002/int.22790.Search in Google Scholar
[14] Sina, R., Wang, J., Huang, J. D. (2023). Neural network-assisted design: a study of multiscale topology optimization with smoothly graded cellular structures. Journal of Mechanical Design, 145(1), 011701. 10.1115/1.4055505.Search in Google Scholar
[15] Li, C. H., Yang, S. X., Trung, T. N. (2012). A self-learning particle swarm optimizer for global optimization problems. IEEE Transactions on Systems, Man, and Cybernetics, Part B (Cybernetics), 42(3), 627–646. 10.1109/TSMCB.2011.2171946.Search in Google Scholar PubMed
[16] Wang, R., Hao, K., Chen, L., Wang, T., Jiang, C. (2021). A novel hybrid particle swarm optimization using adaptive strategy. Information Sciences, 579, 231–250. 10.1016/j.ins.2021.07.093.Search in Google Scholar
[17] Wang, Z., Srinivasa, A., Reddy, J. N., Dubrowski, A. (2022). Topology optimization of lightweight structures with application to bone scaffolds and 3D printed shoes for diabetics. Journal of Applied Mechanics, 89(4), 041009. 10.1115/1.4053396.Search in Google Scholar
[18] de Souza, K. C. L., de Lima Batista, A. M., Duarte, E. B., Martins, J. E. R., Modesto Filho, A. N., Dias, J. W. G, et al. (2022). Physical characterization of material for the development of orthopedic orthosis for diabetic foot. Processes, 10(5), 884. 10.3390/pr10050884.Search in Google Scholar
[19] Shi, Q. Q., Li, P. L., Yick, K. L., Li, N. W., Jiao, J. (2022). Effects of contoured insoles with different materials on plantar pressure offloading in diabetic elderly during gait. Scientific Reports, 12(1), 15395. 10.1038/s41598-022-19814-0.Search in Google Scholar PubMed PubMed Central
[20] Zheng M., Qian, Z., Zou, Z., Peach, C., Akrami, M., Ren, L. (2020). Subject-specific finite element modelling of the human shoulder complex Part 1: Model construction and quasi-static abduction simulation. Journal of Bionic Engineering, 17, 1224–1238. 10.1007/s42235-020-0098-0.Search in Google Scholar
© 2025 the author(s), published by De Gruyter
This work is licensed under the Creative Commons Attribution 4.0 International License.
Articles in the same Issue
- Study and restoration of the costume of the HuoLang (Peddler) in the Ming Dynasty of China
- Texture mapping of warp knitted shoe upper based on ARAP parameterization method
- Extraction and characterization of natural fibre from Ethiopian Typha latifolia leaf plant
- The effect of the difference in female body shapes on clothing fitting
- Structure and physical properties of BioPBS melt-blown nonwovens
- Optimized model formulation through product mix scheduling for profit maximization in the apparel industry
- Fabric pattern recognition using image processing and AHP method
- Optimal dimension design of high-temperature superconducting levitation weft insertion guideway
- Color analysis and performance optimization of 3D virtual simulation knitted fabrics
- Analyzing the effects of Covid-19 pandemic on Turkish women workers in clothing sector
- Closed-loop supply chain for recycling of waste clothing: A comparison of two different modes
- Personalized design of clothing pattern based on KE and IPSO-BP neural network
- 3D modeling of transport properties on the surface of a textronic structure produced using a physical vapor deposition process
- Optimization of particle swarm for force uniformity of personalized 3D printed insoles
- Development of auxetic shoulder straps for sport backpacks with improved thermal comfort
- Image recognition method of cashmere and wool based on SVM-RFE selection with three types of features
- Construction and analysis of yarn tension model in the process of electromagnetic weft insertion
- Influence of spacer fabric on functionality of laminates
- Design and development of a fibrous structure for the potential treatment of spinal cord injury using parametric modelling in Rhinoceros 3D®
- The effect of the process conditions and lubricant application on the quality of yarns produced by mechanical recycling of denim-like fabrics
- Textile fabrics abrasion resistance – The instrumental method for end point assessment
- CFD modeling of heat transfer through composites for protective gloves containing aerogel and Parylene C coatings supported by micro-CT and thermography
- Comparative study on the compressive performance of honeycomb structures fabricated by stereo lithography apparatus
- Effect of cyclic fastening–unfastening and interruption of current flowing through a snap fastener electrical connector on its resistance
- NIRS identification of cashmere and wool fibers based on spare representation and improved AdaBoost algorithm
- Biο-based surfactants derived frοm Mesembryanthemum crystallinum and Salsοla vermiculata: Pοtential applicatiοns in textile prοductiοn
- Predicted sewing thread consumption using neural network method based on the physical and structural parameters of knitted fabrics
- Research on user behavior of traditional Chinese medicine therapeutic smart clothing
- Effect of construction parameters on faux fur knitted fabric properties
- The use of innovative sewing machines to produce two prototypes of women’s skirts
- Numerical simulation of upper garment pieces-body under different ease allowances based on the finite element contact model
- The phenomenon of celebrity fashion Businesses and Their impact on mainstream fashion
- Marketing traditional textile dyeing in China: A dual-method approach of tie-dye using grounded theory and the Kano model
- Contamination of firefighter protective clothing by phthalates
- Sustainability and fast fashion: Understanding Turkish generation Z for developing strategy
- Digital tax systems and innovation in textile manufacturing
- Applying Ant Colony Algorithm for transport optimization in textile industry supply chain
- Innovative elastomeric yarns obtained from poly(ether-ester) staple fiber and its blends with other fibers by ring and compact spinning: Fabrication and mechanical properties
- Design and 3D simulation of open topping-on structured crochet fabric
- The impact of thermal‒moisture comfort and material properties of calf compression sleeves on individuals jogging performance
- Calculation and prediction of thread consumption in technical textile products using the neural network method