Marketing traditional textile dyeing in China: A dual-method approach of tie-dye using grounded theory and the Kano model
-
 ,
,


Abstract
As cultural heritage preservation and sustainable development concepts become increasingly integrated, China’s traditional textile dyeing protection and development gain heightened attention. This study focuses on tie-dyeing, a representative intangible cultural heritage (ICH) craft, to investigate the expectations of its current and potential consumers. The ultimate goal is to translate these expectations into actionable guidance that supports the long-term viability of the tie-dyeing industry. Through a combined methodology of grounded theory and the Kano model, the study initially identified demand indicators via grounded theory, yielding 4 dimensions and 26 demand items. The Kano model analysis was then applied to 239 valid responses. By combining the Better–Worse coefficient and quadrant analysis, the study established a classification system for consumer expectations and prioritized demand importance. The research indicates that the five primary consumer expectations for tie-dyed products are as follows: ease of maintenance, esthetic expression, natural materials, product diversity, and cultural symbolism. These elements represent core consumer demands and warrant primary consideration during product development. Based on these findings, the study presents targeted strategic recommendations for tie-dyeing enterprises regarding product development, market promotion, and brand building. This research contributes to the theoretical understanding of consumer expectations within the ICH domain while offering novel perspectives for promoting the sustainable inheritance and innovative development of tie-dyeing in contemporary markets.
1 Introduction
Intangible cultural heritage (ICH), functioning as a vessel of human civilization, encompasses the historical memory, cultural genes, and creativity of nations. UNESCO emphasizes that ICH promotes human interaction and mutual understanding. It supports the preservation of regional cultural elements to maintain cultural identity and enhance the understanding of cultural continuity while emphasizing the importance of cultural diversity and human creativity [1,2]. However, in the context of globalization and modernization, ICH encounters substantial challenges including intergenerational transmission gaps, erosion of traditional skills, and declining market demand. Thus, the protection, transmission, and utilization of ICH have become crucial global priorities, generating extensive academic research and practical investigation [2,3,4,5].
China, with its rich ICH resources, has implemented a four-tier protection system at the national, provincial, municipal, and county levels. Within this framework, tie-dyeing, an artisanal tradition dating back to the Qin and Han dynasties, has developed through thousands of years into an essential element of traditional Chinese culture. It achieved formal recognition on China’s National Intangible Cultural Heritage List in 2006 [6,7]. Tie-dyeing holds profound cultural significance, embodying a distinctive combination of art and craftsmanship, particularly within ethnic minority cultures such as the Bai ethnic group. These communities have carefully preserved and transmitted the sophisticated techniques of tie-dyeing across generations, making it a living testament to China’s cultural diversity [8]. Moreover, tie-dyeing, characterized by natural dyes and environmentally conscious processes, demonstrates both traditional Chinese esthetic values and alignment with modern sustainable development principles. With China’s economic growth and rising cultural awareness, tie-dyeing has emerged as a vital component of the cultural and creative industries and cultural soft power. It serves a crucial function in developing China’s cultural heritage protection and transmission, contributing significantly to national comprehensive strength [9]. However, traditional tie-dyeing faces multiple challenges: mechanical dyeing technologies have diminished the market for handcrafted products, threatening traditional workshops, while shifting consumer preferences influenced by modernization and industrialization have reduced the appeal of traditional tie-dye products [10,11]. Thus, the essential challenge involves adapting traditional techniques to contemporary demands while preserving their cultural authenticity, presenting an urgent issue requiring resolution.
Current research on tie-dyeing predominantly examines its techniques and artistic characteristics, along with the application of digital technologies in pattern design and craft presentation [12,13,14]. Although these studies have extensively explored the cultural and artistic significance of tie-dyeing, limited research has applied systematic theoretical frameworks to analyze consumer demand comprehensively. The Chinese market, marked by rapid economic growth and evolving cultural paradigms, requires a thorough understanding of multifaceted consumer needs. This understanding is essential for businesses and artisans aiming to innovate and preserve traditional crafts effectively [5,15]. This research utilizes primary data gathered through field research. Through a dual-method approach combining grounded theory and the Kano model, this study examines consumer expectations regarding tie-dye products. The methodology involves applying grounded theory to systematically collect and analyze user requirements, followed by the Kano model’s classification and prioritization of these requirements based on their influence on customer satisfaction. This integrated approach captures both qualitative aspects of consumer expectations and establishes a structured framework for scientifically prioritizing these needs. Such a comprehensive methodology enables a thorough understanding of consumer preferences and their underlying drivers, providing practical guidance for product development and marketing strategies in tie-dye product commercialization. Additionally, cultural heritage development serves as a significant pathway for employment generation, rural economic revitalization, cultural identity enhancement, and social capital strengthening [16–18]. Thus, by enhancing the market relevance of tie-dye products, this research may contribute to improved income levels and employment opportunities for regional artisans, supporting the intergenerational transmission of traditional skills. Moreover, through introducing and conveying Chinese tie-dyeing esthetics, this study holds practical significance for preserving and promoting Chinese intangible culture. In the current context where traditional cultures face potential marginalization, this theoretical analysis and empirical research aims to enhance public awareness of traditional dyeing crafts and promote cultural diversity preservation. The study objectives are as follows: (1) identify consumer demand attributes for tie-dye products in the Chinese market; (2) apply the Kano model to identify, classify, and prioritize these demand attributes, examining key factors influencing Chinese consumer demand; (3) provide empirical evidence for developing tie-dye product development and marketing strategies. To define the research scope, the following research questions are proposed:
RQ1: What are the defining characteristics of traditional Chinese tie-dyeing techniques and patterns?
RQ2: What are the specific demands of Chinese consumers regarding tie-dye products?
RQ3: How can these consumer demands for tie-dye products be effectively categorized and prioritized based on importance?
RQ4: Based on the prioritized demand attributes, how can innovative product development and marketing strategies for tie-dye products be formulated?
In summary, this study investigates and categorizes Chinese consumer expectations and demands for tie-dye products through field research, grounded theory, and the Kano model. This research aims to connect traditional craftsmanship with contemporary consumer needs, providing valuable insights for sustainable and culturally sensitive transmission and innovation of Chinese tie-dyeing techniques.
2 Literature review
2.1 Characteristics of Chinese tie-dyeing techniques and patterns
Tie-dyeing, also known as “Jiao Xie” (绞缬), encompasses tying, clamping, or stitching fabric with thread or simple auxiliary tools to resist dye penetration. The tightly bound sections prevent complete dye penetration, creating white patterns through this resist-dyeing technique [14]. The tie-dyeing production process involves several sequential steps: initially, conceptualizing and designing the intended pattern and effect, followed by tool preparation. Complex patterns may require drawing design templates directly onto the fabric for precise tie positioning. Subsequently, executing the tying process through methods including stitching, binding, knotting, and tool-based clamping or folding. Finally, the tied fabric undergoes dip-dyeing or vat-dyeing through immersion or boiling. Post-dyeing procedures include removing ties, rinsing the fabric, and smoothing wrinkles while damp before drying [19]. Figure 1 illustrates the main tie-dyeing process steps.
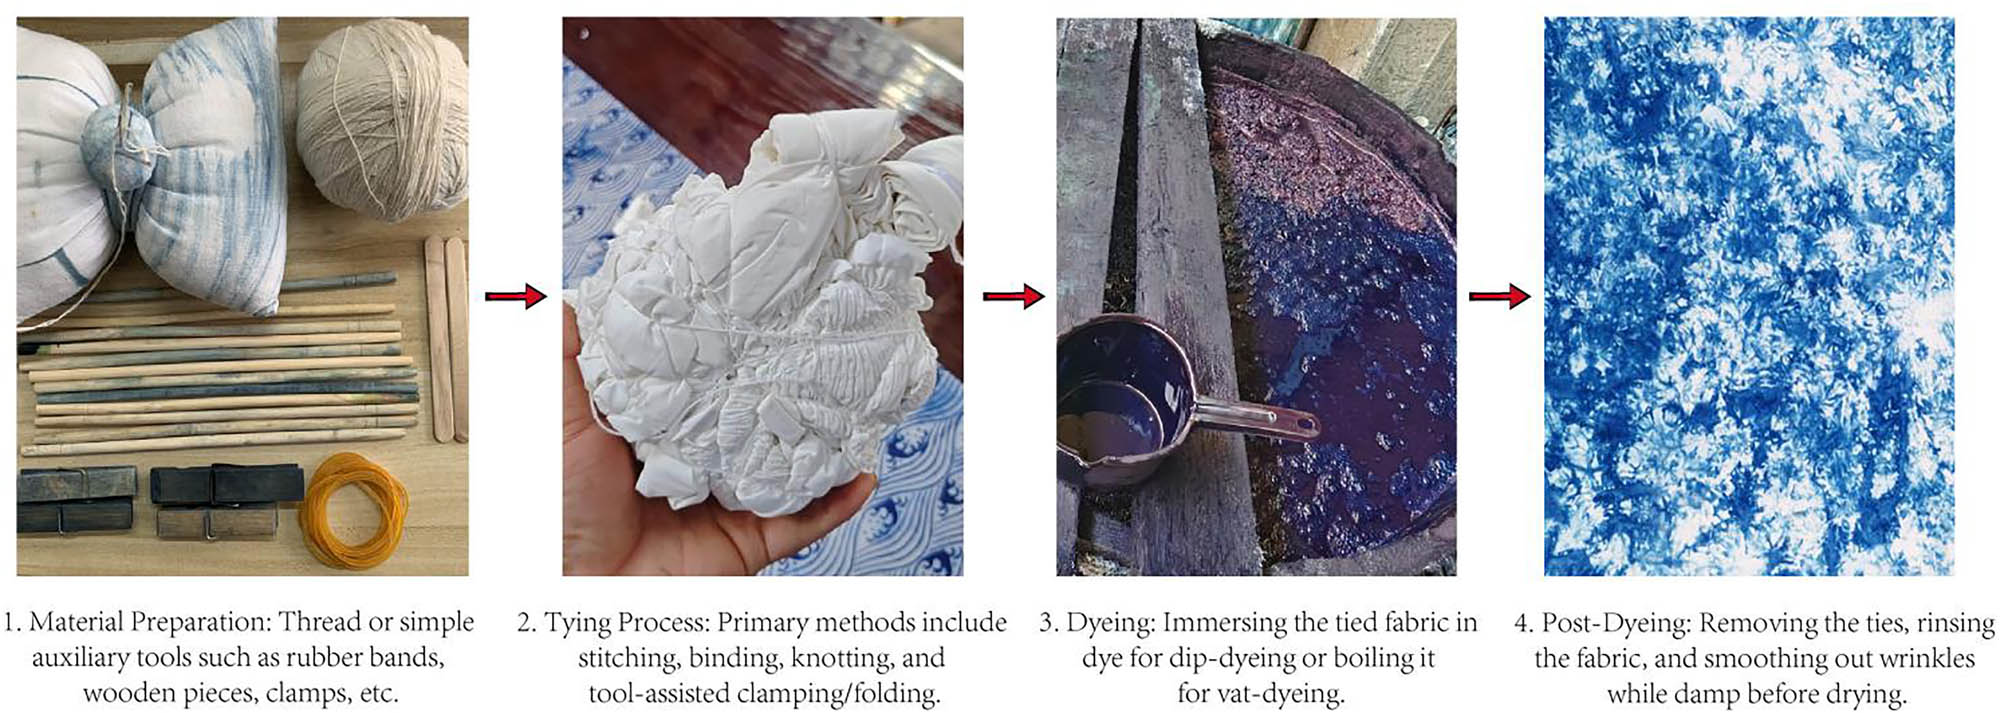
Main steps of the tie-dyeing process (the photo was taken at the PuZhen Tie-Dye Museum in Yunnan).
Tie-dyeing produces diverse patterns through varied tying methods. These patterns are unique and non-reproducible, featuring irregular color gradations and random multicolored motifs across the fabric surface. The tying process inhibits dye diffusion, generating color halos at pattern edges that create soft, hazy color gradient effects [19]. Tie-dye patterns exhibit greater abstraction and dynamism compared to other resist-dyeing patterns. Even figurative designs demonstrate enhanced spontaneity and expressive flexibility [20]. The stitching and binding processes create distinctive tying marks, whose interplay of dots, lines, and planes generates unique visual rhythm and variation [14]. Figure 2 summarizes the primary characteristics of tie-dye patterns.
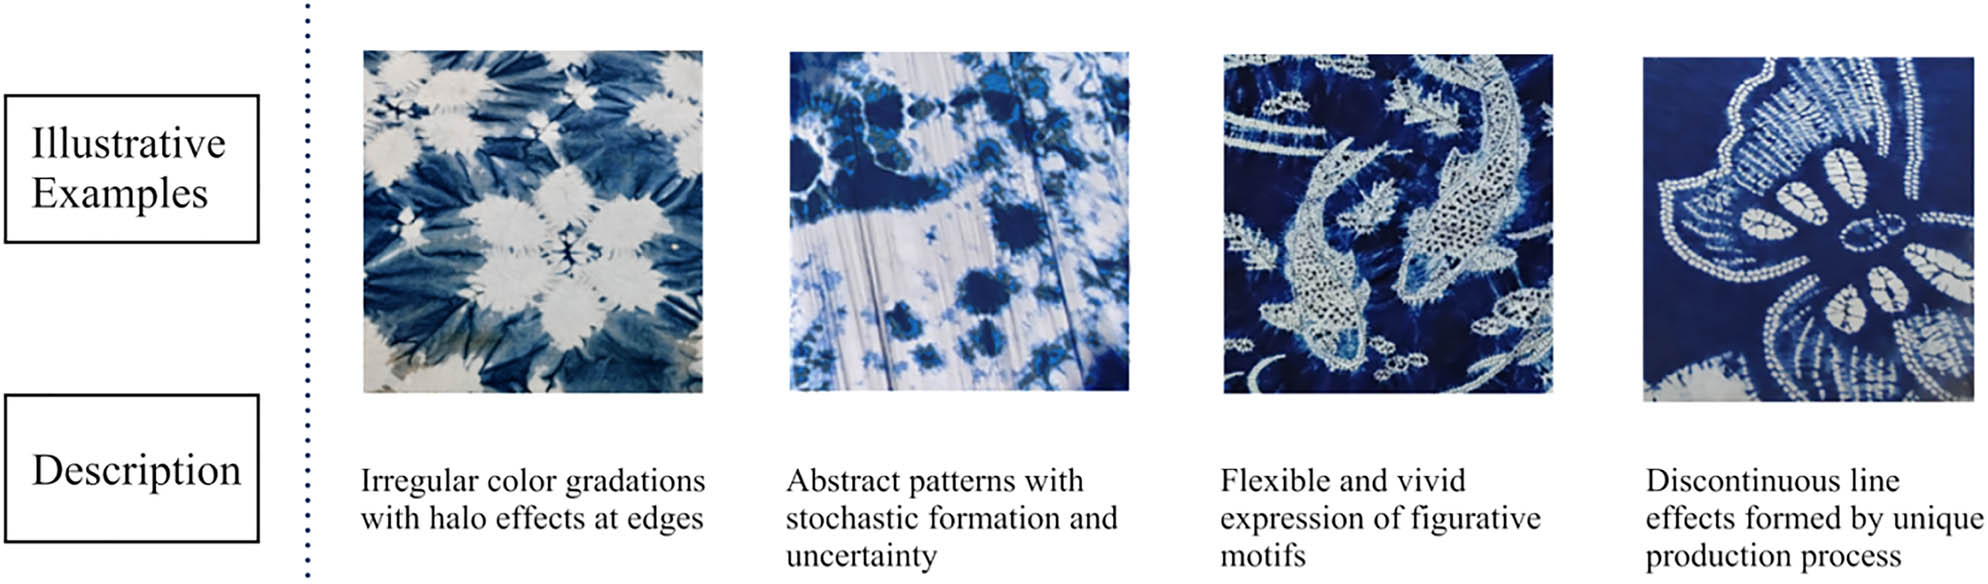
Characteristics of tie-dye patterns.
2.2 Research status of Chinese tie-dying techniques
Contemporary research on ICH tie-dyeing techniques primarily encompasses traditional craftsmanship and cultural studies, skill transmission and cultural education, and modern technology-driven innovative design. Regarding traditional techniques and cultural research, Chinese tie-dyeing art represents an ancient ethnic handicraft characterized by natural, minimalist, serene, and distinctive esthetic qualities valued by communities. As one of the earliest resist-dyeing techniques, it was widely used in apparel and textile production during the Eastern Jin dynasty and flourished in the Sui and Tang dynasties through advancements in plant-derived dyes and dyeing processes [9,14,21]. Throughout history, tie-dyeing developed into an artistic form reflecting local ethnic traditions and customs, embodying specific regional historical and social contexts. Its patterns and colors frequently express deep symbolic meanings, representing human aspirations toward nature, life, and beauty. Moreover, the transmission and evolution of tie-dyeing techniques reflect changing ideologies and esthetic preferences across different historical periods [12,22–24]. Thus, tie-dyeing functions not only as artistic expression but also as a crucial medium for cultural exchange and heritage preservation.
Regarding skill transmission and cultural education, tie-dyeing – a historic textile dyeing technique – has transformed from traditional household production to collective factory manufacturing, subsequently returning to domestic production. Research indicates that its familial transmission model has evolved beyond exclusive “secret techniques” toward greater accessibility, with technical knowledge and designs being widely shared and reproduced. Additionally, tie-dyeing’s production function has expanded beyond basic utility into a commercial activity [25]. Present initiatives explore various transmission and collaboration models; for instance, the “Momthandworks” project effectively connects fashion designers with elderly women from Chinese ethnic minorities, creating an interactive platform for “heritage innovation” through cooperatives. This initiative preserves traditional tie-dyeing techniques while facilitating collaborative innovation between designers and elderly Bai ethnic women to develop patterns, enhance traditional designs, and incorporate modern themes, thereby advancing tie-dyeing’s artistic development. Beyond ICH preservation, the project enhances participants’ psychological well-being and quality of life [26]. Additionally, Yangyingying Pan’s research examines tie-dyeing culture integration in primary education within Yunnan Province’s ethnic minority regions, identifying challenges including insufficient curricula, limited adoption, and suboptimal teaching quality. The study recommends solutions including specialized teacher training, extracurricular activities, school-based curriculum development, practical fieldwork implementation, and comprehensive primary education management systems. These measures strengthen educational administration, enhance esthetic education, and establish viable ICH transmission pathways in minority regions [27].
Within industrialized mass production, traditional tie-dyeing processes present challenges for large-scale manufacturing [28], making technological innovation essential for improving the efficiency and enabling pattern innovation. For instance, Tu and Kim explored novel tie-dyeing tools utilizing 3D printing technology, specifically applying SLS laser 3D printing to miniaturized clamping tools. Their findings demonstrate that these tools make innovative, versatile designs that meet contemporary fabric fashion demands [29]. Liu et al. developed a rapid digital pattern generation algorithm based on auxiliary classifier deep convolutional generative adversarial networks and image processing to achieve authentic tie-dye effects. The generated patterns exhibit seamless color transitions, uniform stitching edges, and distinctive tie-dye characteristics [30]. While existing research illuminates tie-dyeing’s cultural and artistic value across multiple dimensions – emphasizing preservation imperatives and exploring transmission models – limited studies analyze consumer demand characteristics for tie-dye products. This research systematically examines consumer needs to provide detailed decision-making foundations for market development, enabling enterprises to formulate precise marketing strategies, develop market-aligned products, enhance competitiveness, and foster sustainable industry growth through effective cultural heritage monetization.
3 Methodology
This study employs a mixed-method approach integrating grounded theory and the Kano model (Figure 3). First, qualitative research was conducted using grounded theory methodology, wherein data were collected through semi-structured interviews and analyzed via open coding, axial coding, and selective coding. Upon reaching theoretical saturation, a comprehensive inventory of Chinese consumers’ demands for tie-dye products was derived. Subsequently, quantitative research was implemented using the Kano model to classify and prioritize the consumer requirements identified through grounded theory. This process revealed key factors influencing consumer satisfaction at the current stage, enabling evidence-based recommendations for product development and design strategies.
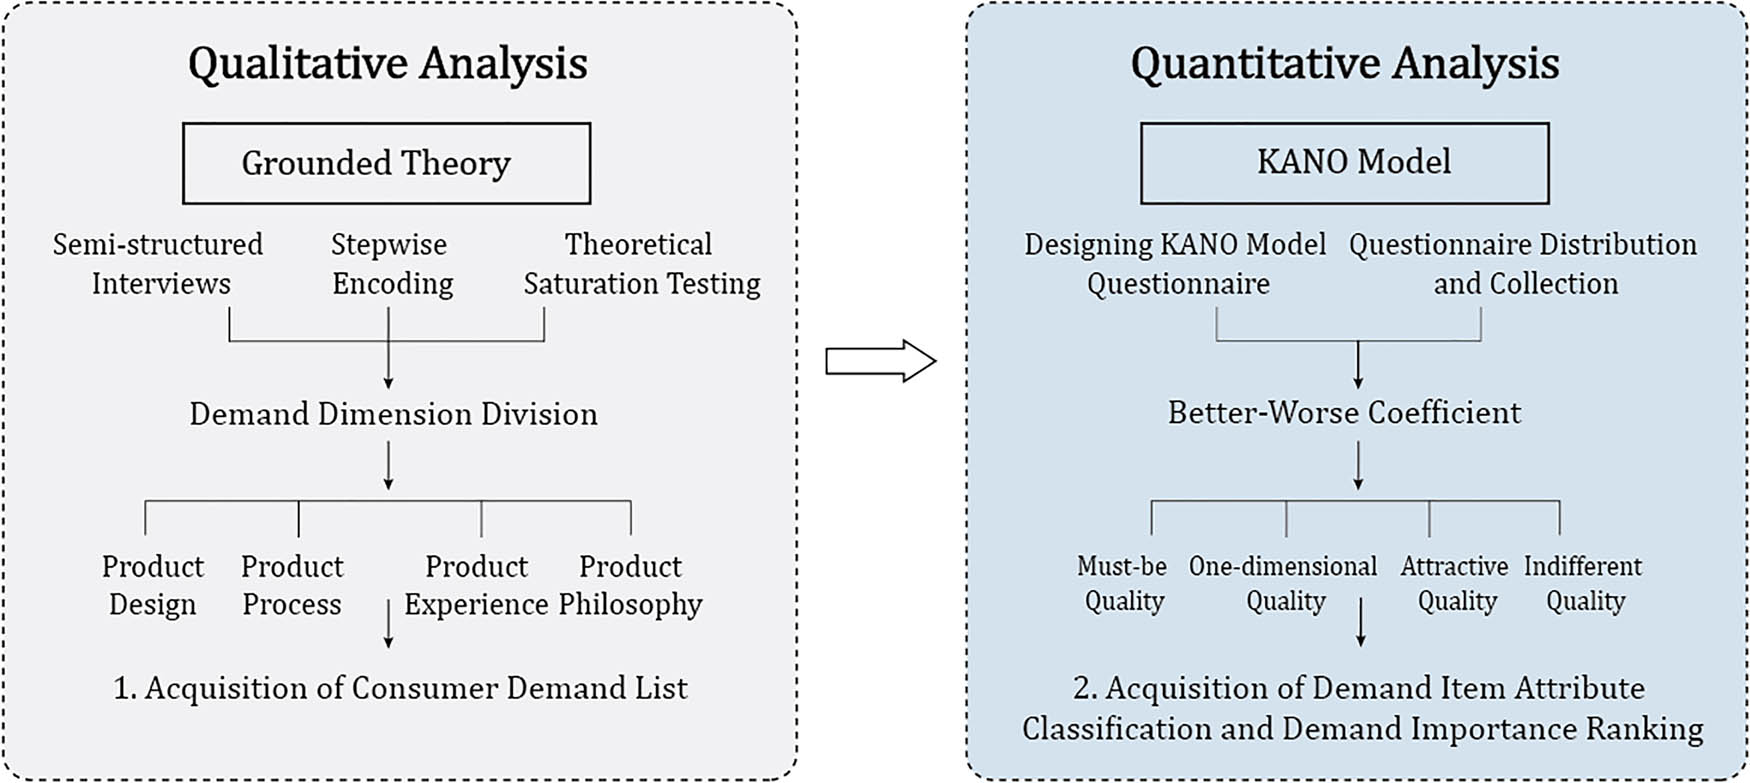
Research flowchart.
3.1 Grounded theory for demand attribute extraction
Grounded theory is a systematic inductive methodology for conducting qualitative research aimed at theory construction [31]. Focusing on consumer expectations for tie-dye products, this study employs grounded theory to derive a comprehensive inventory of consumer demands.
3.1.1 Participant recruitment and semi-structured interviews
This study employed purposeful sampling to select participants based on their relevance to the research objectives [32]. Prior to conducting formal interviews, an initial survey was administered through an online questionnaire. This preliminary survey aimed to gather participants’ background information and assess their willingness to participate in subsequent face-to-face in-depth interviews. The survey was conducted from May 3 to 10, 2025, targeting potential respondents across various locations: brand counters selling tie-dye products in large shopping malls, handmade botanical-dyeing apparel design studios, tie-dye museums, and tie-dye experience centers. The participant pool included consumers, craft enthusiasts with hands-on experience, sales personnel, designers, and ICH inheritors of tie-dyeing. The questionnaire was distributed through Wenjuanxing (wjx.cn). The pre-survey garnered 106 complete responses, with 36 respondents indicating their willingness to participate in follow-up interviews.
Following the pre-survey analysis, 23 interviewees were selected from the willing participants, with priority given to those demonstrating extensive craft knowledge or substantial purchasing experience. The final sample consisted of 15 females and 8 males, with the following age distribution: 20–29 years (22%), 30–39 years (39%), 40–49 years (26%), 50–59 years (9%), and ≥60 years (4%). The demographic characteristics of participants are presented in Table 1.
Information about respondents
| No. | Gender | Age group | Identity | No. | Gender | Age group | Identity |
| 1 | Female | 30–39 | Consumer | 13 | Female | 30–39 | Experiencer |
| 2 | Female | 30–39 | Consumer | 14 | Female | 50–59 | Experiencer |
| 3 | Female | 20–29 | Consumer | 15 | Male | 20–29 | Practitioner |
| 4 | Male | 30–39 | Consumer | 16 | Female | 30–39 | Practitioner |
| 5 | Female | 20–29 | Consumer | 17 | Male | 30–39 | Practitioner |
| 6 | Female | 40–49 | Consumer | 18 | Male | 40–49 | Dyeing and printing arts and crafts master |
| 7 | Female | >60 | Consumer | 19 | Female | 30–39 | Dyeing and printing arts and crafts master |
| 8 | Male | 40–49 | Consumer | 20 | Female | 20–29 | Fashion designer |
| 9 | Female | 40–49 | Experiencer | 21 | Female | 30–39 | Textile designer |
| 10 | Male | 30–39 | Experiencer | 22 | Male | 40–49 | Inheritor of ICH |
| 11 | Female | 40–49 | Experiencer | 23 | Female | 50–59 | Inheritor of ICH |
| 12 | Male | 20–29 | Experiencer |
Face-to-face semi-structured interviews were conducted intensively from May 14 to 20, 2025, with each interview lasting between 30 and 60 min. All participants voluntarily participated in this study, whether it was the pre-survey or the interview survey, and signed written informed consent forms outlining the research purpose and procedures before the experiment commenced. The study adhered to academic ethical guidelines, and appropriate ethical approval was obtained. The interviews sought to investigate participants’ perspectives and expectations regarding tie-dye products, with the sequential arrangement of specific interview questions presented in Table 2.
Interview questions
| No. | Interview questions |
|---|---|
| 1 | Please describe your feelings about the process of tie-dyeing? What aspects do you focus on the most when selecting tie-dyed products? |
| 2 | What categories of products do you think tie-dyeing is suitable for? What are the reasons? |
| 3 | What problems do you think exist in current tie-dyed products? What do you think are the causes of these problems? |
| 4 | What are your expectations for tie-dyed products? In addition to these, what other support and assistance do you hope to receive? |
| 5 | Besides the above questions, is there any additional information you would like to provide? |
Each audio recording was transcribed into text using automatic speech recognition software, followed by content summarization of the interview text. This process generated 23 valid transcripts, yielding raw data of over 70,000 words. In grounded theory, “saturation” denotes the point at which researchers determine that sufficiently comprehensive data have been collected, with no additional information or perspectives emerging. This indicates that the study has obtained thorough information on the topic, permitting the conclusion of data collection and initiation of data analysis [33]. Subsequently, 75% of the sample (n = 17) was randomly selected for framework model construction, while the remaining 25% (n = 6) was reserved for grounded theory saturation test analysis.
3.1.2 Hierarchical coding
Grounded theory is commonly defined as an inductive data collection process [34]. In this research, NVivo 14.0 software facilitated the coding of collected raw data, following three essential steps of procedural grounded theory: open coding, axial coding, and selective coding. The open coding phase approached all interview data with an unbiased perspective. The researcher conducted line-by-line analysis of the filtered comment texts, applying provisional labels. Through iterative comparison and content organization, relevant information was systematically condensed and consolidated into initial concepts. The second stage, axial coding, focused on summarizing the categorized concepts and content while identifying relationships between distinct categories established during open coding. This stage also reconstructed logical relationships among concepts to group the outputs from open coding. Selective coding, the third stage, involved mapping the structural relationships and systematic connections among concepts identified within the axial coding framework. This process integrated and synthesized these concepts to establish the core conceptual framework. The data collection and analysis process utilizing grounded theory is illustrated in Figure 4.
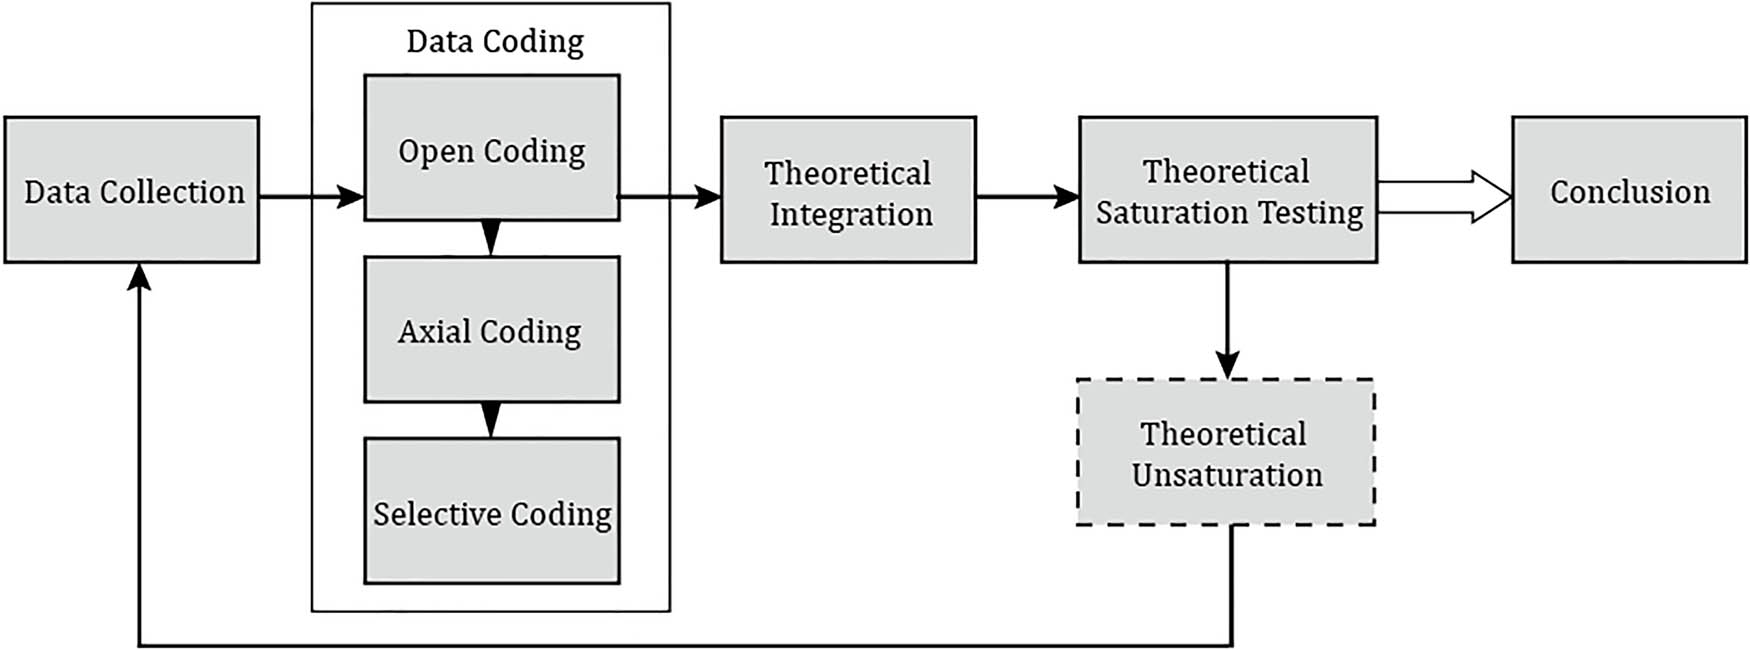
Process of data collection and analysis in grounded theory.
3.1.3 Theoretical saturation testing
Theoretical saturation testing represents a crucial step in determining whether sample collection can conclude during a grounded theory study. Theoretical saturation occurs when no new initial concepts or categories emerge from the collected sample data. To strengthen the research’s reliability and validity, six interview transcripts were reserved for a secondary analysis round to conduct the theoretical saturation test. The application of open coding and axial coding processes to these six respondents’ raw interview data revealed no new categories or themes. Thus, the coding results confirmed theoretical saturation, eliminating the need for additional sampling.
Based on the analysis results derived from grounded theory, the demand for tie-dye products was classified into four dimensions: product design, product craftsmanship, product experience, and product philosophy. This analysis produced a comprehensive demand inventory comprising 26 items (Table 3).
List of requirements for tie-dye products
| Dimension | Code | Requirements | Description |
|---|---|---|---|
| Product design | A1 | Abstract style | Features abstract patterns with irregular esthetic appeal |
| A2 | Gradient coloration | Exhibits rich color layers and gradient effects | |
| A3 | Pattern uniqueness | Each piece possesses non-replicable uniqueness due to artisanal techniques | |
| A4 | Ethnic characteristics | Embodies ethnic identity through traditional dyeing methods and motifs | |
| A5 | Versatility | Functions as a versatile fashion item compatible with diverse apparel/home decor | |
| A6 | Classic elegance | Classic design with minimalist sophistication and comfortable esthetics | |
| A7 | Contemporary esthetics | Integrates current trends to align with modern sensibilities | |
| A8 | Product diversity | Offers varied patterns, styles, and product types adaptable to different age groups, genders, and usage scenarios | |
| Product craftsmanship | B1 | Traditional craftsmanship | Employs Chinese heritage dyeing techniques with distinctive ethnic production processes |
| B2 | Exquisite craftsmanship | Well-crafted, with delicate handling of dyeing details, avoiding issues like uneven dyeing and messy binding marks. | |
| B3 | Natural materials | Biodegradable plant-based dyes/fabrics; sustainable sourcing of non-rare renewable materials | |
| B4 | Eco-dyeing technology | Minimal chemical reactions in dye preparation reducing the environmental impact | |
| Product experience | C1 | Comfort performance | The product should be comfortable to wear or use, without causing harm or health problems |
| C2 | Durability | High color fastness resistant to fading from washing/sun exposure | |
| C3 | Easy maintenance | Low-effort cleaning and care requirements | |
| C4 | Cost-effectiveness | Reasonable price-to-value ratio without excessive premium | |
| C5 | Purchase accessibility | Multi-channel availability and convenient acquisition | |
| C6 | Cultural promotion | Multi-platform education about tie-dye techniques and value proposition | |
| C7 | Customization service | Bespoke production according to consumer specifications | |
| C8 | Experiential production | Hands-on workshops enabling participatory creation | |
| C9 | Quality supervision | Standardized monitoring against misrepresented quality or defective outputs | |
| C10 | After-sales support | Post-purchase guidance on preservation and issue resolution | |
| Product philosophy | D1 | Cultural symbolism | Embodiment of traditional cultural narratives through ethnic motifs |
| D2 | Esthetic expression | Medium for personal style articulation and taste manifestation | |
| D3 | Social connectivity | Gift-suitability, conversation catalyst, and activity-based social engagement | |
| D4 | Social responsibility | Demonstrated commitment to cultural preservation and ecological stewardship |
3.2 Prioritizing consumer demands using the Kano model questionnaire
The Kano model, a dual-dimensional cognitive framework for classifying and prioritizing consumer demands based on satisfaction analysis, was developed by a Japanese management scholar Noriaki Kano through comprehensive research on the two-dimensional nonlinear relationship between product quality attributes, performance, and user satisfaction [35]. This model finds extensive application in product design, interaction design, and service design due to its effectiveness in illuminating the relationship between consumer demands and satisfaction [36]. The Kano model classifies product/service quality attributes into five distinct categories based on their influence on consumer satisfaction (Figure 5): Must-be Quality (M): attributes whose presence does not enhance satisfaction but whose absence results in significant dissatisfaction. One-dimensional Quality (O): attributes demonstrating linear satisfaction relationships where fulfillment proportionally increases satisfaction and vice versa. Attractive Quality (A): attributes that increase satisfaction when present but generate no dissatisfaction when absent. Indifferent Quality (I): attributes that negligibly impact satisfaction regardless of its presence. Reverse Quality (R): attributes that reduce satisfaction when present and may increase satisfaction when absent [37,38].
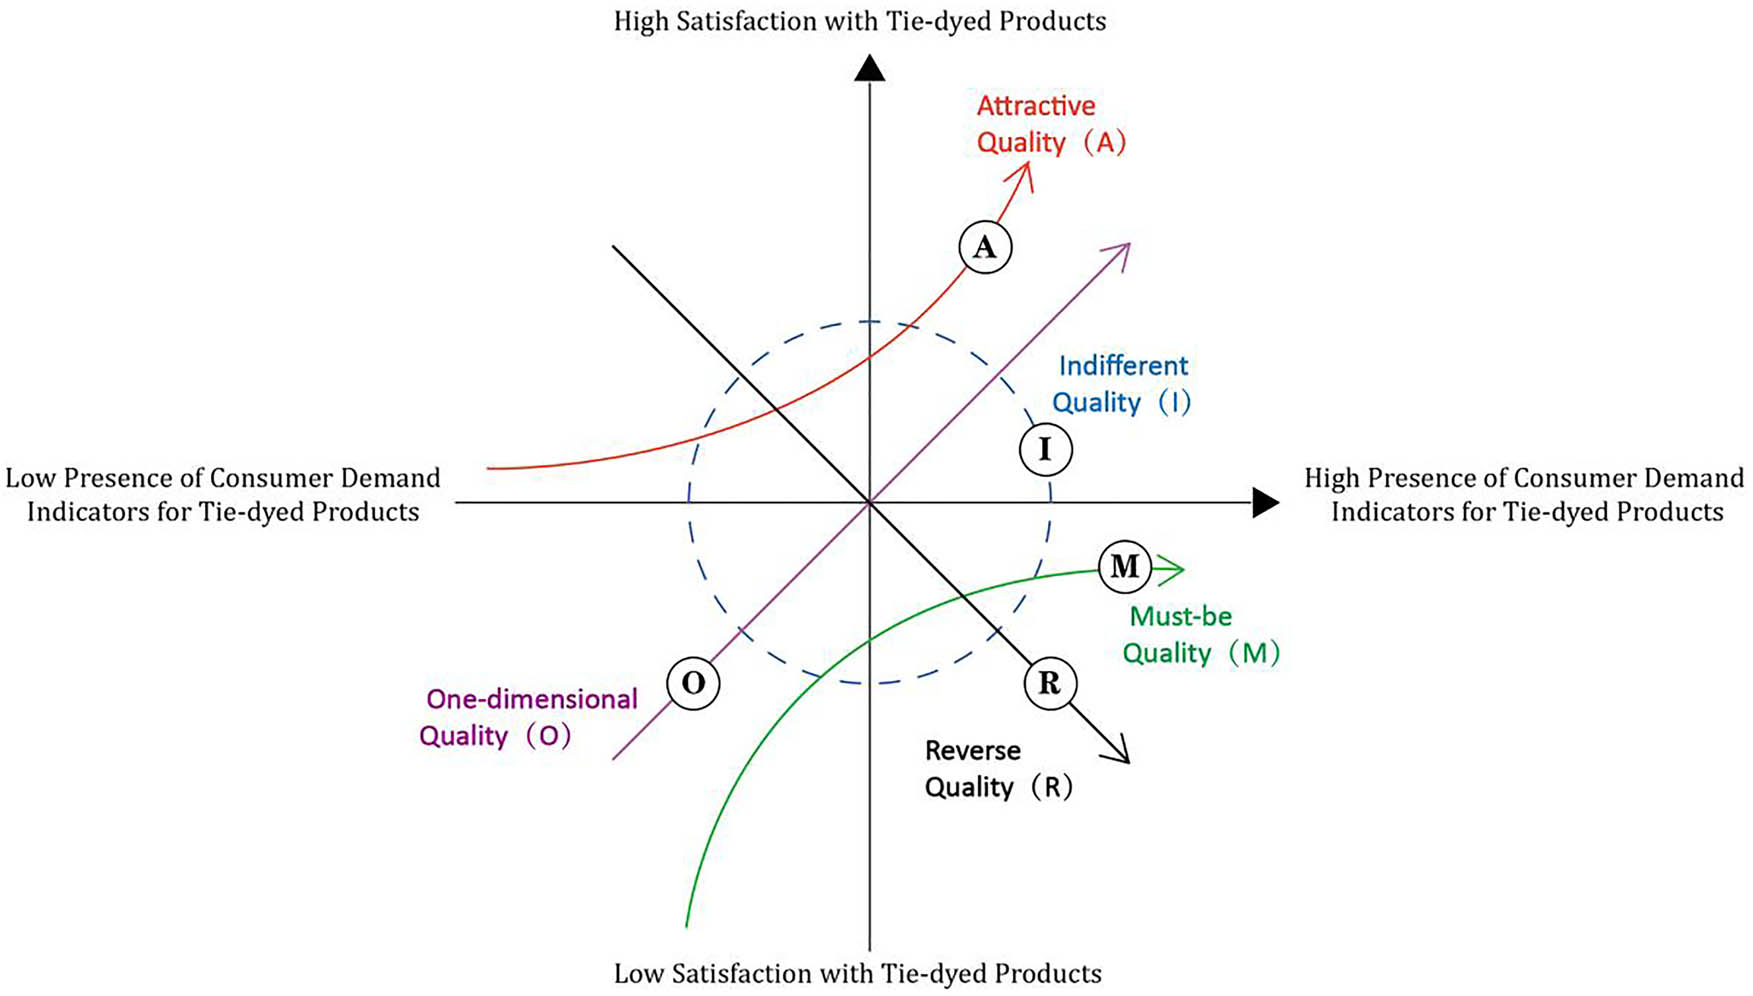
Schematic diagram of the Kano model.
In this research, the Kano model offers valuable insights into consumer demands and expectations regarding tie-dye products. Through structured questionnaires, the model evaluates the satisfaction impact and functional significance of product attributes. Organizations can utilize these assessments to identify diverse consumer needs and optimize product features accordingly. The Kano questionnaire adopts a structured format where each demand attribute undergoes evaluation through paired functional (positive) and dysfunctional (negative) questions. These questions assess consumer responses to the presence or absence of specific attributes. The implementation process consists of the following steps: initially, gather consumer requirements and develop a questionnaire. Then request target consumers to evaluate product satisfaction and dissatisfaction using options such as “Like” and “Neutral.” Evaluate the impact of requirements on consumer satisfaction. Categorize requirements according to the Kano model (Table 4). The attribute category with the highest frequency becomes the final classification [39].
Kano model evaluation result classification comparison
| Consumer response to functional (F) and dysfunctional (D) questions | Dysfunctional question (absence of feature) | |||||
|---|---|---|---|---|---|---|
| Like | Must-be | Neutral | Live-with | Dislike | ||
| Functional question (presence of feature) | Like | Q | A | A | A | O |
| Must-be | R | I | I | I | M | |
| Neutral | R | I | I | I | M | |
| Live-with | R | I | I | I | M | |
| Dislike | R | R | R | R | Q | |
A: Attractive Quality; O: One-dimensional Quality; M: Must-be Quality; I: Indifferent Quality; R: Reverse Quality; Q: Suspicious Quality.
3.2.1 Questionnaire design and distribution
Based on the demand inventory derived from grounded theory, the Kano model questionnaire comprised two primary sections: (1) Demographic Profile: This section gathered information about respondents’ gender, age, educational attainment, monthly income, and previous tie-dye product purchase frequency to ensure sample representativeness and diversity. (2) Bidirectional Attribute Evaluation: This section contained 26 paired demand items evaluating consumer experiences during tie-dye product purchase and usage. Each attribute was assessed through two questions: a functional question measuring satisfaction when a feature was present and a dysfunctional question measuring satisfaction when the feature was absent. The study ensured anonymity and maintained strict confidentiality, obtaining informed consent before participation. Participants completed questions in a vertical format, addressing the functional question followed by the dysfunctional question for each attribute. The study implemented validity checks with specific exclusion criteria: completion time less than 120 s, more than 10% missing responses, and patterned response behavior. These invalid responses were removed from the analysis. All items utilized a 5-point Likert scale: Like; Must-be; Neutral; Live-with; Dislike. Table 5 presents a sample questionnaire structure.
Sample questionnaire structure
| Dimension | Function | Question | Like | Must-be | Neutral | Live-with | Dislike |
|---|---|---|---|---|---|---|---|
| Product craftsmanship | B1. Traditional Craftsmanship: Employs Chinese heritage dyeing techniques with distinctive ethnic production processes | Functional question (presence) | □ | □ | □ | □ | □ |
| Dysfunctional question (absence) | □ | □ | □ | □ | □ |
This investigation employed a dual-mode survey methodology (online and offline) targeting consumers and potential purchasers of tie-dye products. Online questionnaires were distributed through Wenjuanxing (wjx.cn) and disseminated via social media platforms, including WeChat. Offline surveys were administered at tie-dye museums, experiential workshops, and brand boutiques specializing in tie-dye products, implementing random sampling among visitors, workshop participants, consumers, and relevant personnel. All participants received acknowledgment and modest tokens of appreciation upon completion. The survey was conducted from June 6 to 15, 2025, with 196 online and 71 offline questionnaires distributed (total N = 267). Following the application of exclusion criteria, 28 invalid responses were eliminated, resulting in 239 valid questionnaires (89.5% validity rate).
The final sample comprised 239 participants who completed the questionnaire. The gender distribution showed 56.9% female and 43.1% male respondents. The age distribution revealed a predominant group of participants aged 31–40 (30.13%), followed by those aged 26–30 (22.59%) and 41–50 (19.67%). The majority of participants fell within the 26–50 age range, constituting over 72% of the sample. Educational attainment data indicated that 45.19% held a Bachelor’s degree and 20.08% possessed an associate degree. Regarding monthly income, the majority earned between 3,001 and 9,000 yuan, with 46.86% in the 6,001–9,000 yuan category and 26.36% in the 3,001–6,000 yuan range. Purchase history data revealed that 53.56% had acquired tie-dyed products 1–3 times. Comprehensive participant characteristics are presented in Table 6.
Sample demographic characteristics
| Item | Indicator | Frequency | Percentage |
|---|---|---|---|
| Gender | Male | 103 | 43.1 |
| Female | 136 | 56.9 | |
| Age | <18 | 9 | 3.77 |
| 18–25 | 15 | 6.28 | |
| 26–30 | 54 | 22.59 | |
| 31–40 | 72 | 30.13 | |
| 41–50 | 47 | 19.67 | |
| 51–60 | 37 | 15.48 | |
| >60 | 5 | 2.09 | |
| Education level | Junior high or below | 21 | 8.79 |
| High school/vocational | 38 | 15.9 | |
| Associate degree | 48 | 20.08 | |
| Bachelor’s degree | 108 | 45.19 | |
| Postgraduate or above | 24 | 10.04 | |
| Monthly income (CNY) | <3,000 | 27 | 11.3 |
| 3,001–6,000 | 63 | 26.36 | |
| 6,001–9,000 | 112 | 46.86 | |
| >9,000 | 37 | 15.48 | |
| Purchase experience | Never purchased | 42 | 17.57 |
| Purchased 1–3 times | 128 | 53.56 | |
| Purchased >3 times | 69 | 28.87 |
3.2.2 Reliability and validity testing
Data collected from the questionnaires were analyzed using SPSSAU [40]. Reliability assessment utilized Cronbach’s α, where higher values signify greater internal consistency. As presented in Table 7, the overall Cronbach’s α equals 0.802; functional questions yielded a Cronbach’s α of 0.908; dysfunctional questions demonstrated a Cronbach’s α of 0.930. All values surpass the threshold of 0.8, confirming robust inter-item correlations and establishing the questionnaire as a psychometrically sound instrument [41]. Validity analysis evaluates a questionnaire’s truthfulness and accuracy. Generally, a KMO value above 0.7 indicates acceptable validity [42]. As illustrated in Table 8, this questionnaire achieved a KMO value of 0.874. The Bartlett’s test of sphericity produced a statistical value of 0.000, with significance below 0.01, indicating positive correlation. These results demonstrate the data’s suitability for factor analysis and confirm the questionnaire’s strong validity. The reliability and validity test results validate the questionnaire’s appropriateness for Kano model analysis and ensure test reliability.
Reliability test
| Item | Cronbach’s α value |
|---|---|
| All questions | 0.802 |
| Positive questions | 0.908 |
| Negative questions | 0.930 |
Validity test
| KMO and Bartlett’s test | ||
|---|---|---|
| KMO value | 0.874 | |
| Bartlett’s test of sphericity | Approximate chi-square | 6582.857 |
| df | 1326.000 | |
| Sig. | 0.000 | |
3.2.3 Satisfaction coefficients
To enhance demand classification and importance weighting, this study applies a refined version of the traditional Kano model using consumer satisfaction coefficients introduced by Berger et al. [43,44]. The Better–Worse coefficient method quantifies demand weights through the following formulas:
where Better represents the satisfaction coefficient; Worse denotes the dissatisfaction coefficient; A, O, M, and I represent the frequency counts of Attractive, One-dimensional, Must-be, and Indifferent attributes, respectively.
Satisfaction coefficients measure how demand fulfillment or non-fulfillment affects the overall satisfaction. The Better coefficient indicates the proportion of Attractive (A) and One-dimensional (O) demands within total demands, with higher values indicating greater prominence of these categories. The Worse coefficient represents the proportion of One-dimensional (O) and Must-be (M) demands, where a larger absolute value suggests a more substantial impact on overall satisfaction, thus identifying critical factors for consumer satisfaction [42,45].
4 Analysis and results
4.1 Results of demand quality type
The traditional Kano model frequently demonstrates a high occurrence of Indifferent Quality (I) attributes during demand classification [46,47], potentially introducing evaluation bias. To mitigate this limitation, this study employs an enhanced methodology incorporating Better–Worse coefficients, providing a comprehensive framework for determining demand quality types of tie-dye products [38]. The Better and Worse coefficients for each demand item were calculated using equations (1) and (2). Table 9 presents the statistical classification of demand quality attributes for tie-dye products.
Classification of demand quality attributes for tie-dye products
| Dimension | Code | A (%) | O (%) | M (%) | I (%) | R (%) | Q (%) | Better | Worse | R | Ranking | Classification |
|---|---|---|---|---|---|---|---|---|---|---|---|---|
| Product design | A1 | 25.40 | 12.86 | 20.05 | 39.59 | 1.29 | 0.79 | 0.3908 | −0.3362 | 0.5155 | 24 | I |
| A2 | 30.19 | 14.51 | 15.94 | 33.16 | 3.52 | 2.67 | 0.4765 | −0.3246 | 0.5766 | 9 | A | |
| A3 | 21.82 | 10.91 | 20.36 | 40.71 | 4.08 | 2.11 | 0.3489 | −0.3334 | 0.4826 | 25 | I | |
| A4 | 26.79 | 14.46 | 19.43 | 35.98 | 1.92 | 1.43 | 0.4268 | −0.3506 | 0.5523 | 16 | A | |
| A5 | 27.14 | 14.64 | 19.24 | 35.66 | 2.00 | 1.32 | 0.4321 | −0.3504 | 0.5563 | 13 | A | |
| A6 | 23.36 | 10.86 | 19.30 | 41.50 | 3.26 | 1.73 | 0.3601 | −0.3174 | 0.4800 | 26 | I | |
| A7 | 22.80 | 12.94 | 21.47 | 37.82 | 3.15 | 1.81 | 0.3761 | −0.3621 | 0.5221 | 23 | M | |
| A8 | 27.10 | 16.22 | 18.75 | 31.33 | 3.72 | 2.88 | 0.4638 | −0.3744 | 0.5961 | 4 | O | |
| Product craftsmanship | B1 | 23.93 | 13.68 | 21.03 | 36.81 | 2.82 | 1.75 | 0.3940 | −0.3636 | 0.5361 | 19 | M |
| B2 | 23.77 | 14.82 | 22.95 | 36.81 | 1.03 | 0.65 | 0.3924 | −0.3840 | 0.5490 | 18 | M | |
| B3 | 27.98 | 17.87 | 20.45 | 32.01 | 0.93 | 0.75 | 0.4664 | −0.3898 | 0.6078 | 3 | O | |
| B4 | 30.12 | 15.35 | 17.29 | 33.92 | 1.94 | 1.39 | 0.4703 | −0.3376 | 0.5789 | 8 | A | |
| Product experience | C1 | 23.85 | 15.95 | 22.96 | 34.31 | 1.73 | 1.20 | 0.4100 | −0.4008 | 0.5734 | 10 | M |
| C2 | 25.39 | 12.69 | 18.32 | 36.53 | 4.19 | 2.92 | 0.4098 | −0.3337 | 0.5285 | 22 | I | |
| C3 | 23.82 | 20.04 | 23.75 | 28.24 | 2.66 | 1.88 | 0.4576 | −0.4569 | 0.6466 | 1 | O | |
| C4 | 25.90 | 13.21 | 18.60 | 36.48 | 3.51 | 2.29 | 0.4152 | −0.3377 | 0.5352 | 20 | I | |
| C5 | 26.78 | 13.93 | 18.44 | 35.45 | 3.16 | 2.24 | 0.4303 | −0.3422 | 0.5498 | 17 | A | |
| C6 | 28.44 | 15.46 | 17.87 | 32.87 | 3.09 | 2.29 | 0.4639 | −0.3522 | 0.5825 | 7 | A | |
| C7 | 27.94 | 14.34 | 17.75 | 34.59 | 3.66 | 2.20 | 0.4468 | −0.3391 | 0.5609 | 11 | A | |
| C8 | 28.67 | 13.97 | 17.43 | 35.77 | 3.07 | 1.69 | 0.4449 | −0.3276 | 0.5525 | 15 | A | |
| C9 | 22.95 | 14.98 | 23.51 | 36.03 | 2.27 | 0.98 | 0.3891 | −0.3949 | 0.5544 | 14 | M | |
| C10 | 26.87 | 14.43 | 18.62 | 34.69 | 3.74 | 2.22 | 0.4365 | −0.3493 | 0.5591 | 12 | A | |
| Product philosophy | D1 | 25.98 | 16.88 | 21.03 | 32.34 | 2.11 | 1.65 | 0.4454 | −0.3940 | 0.5947 | 5 | O |
| D2 | 26.96 | 17.53 | 20.08 | 30.88 | 2.55 | 2.02 | 0.4661 | −0.3940 | 0.6103 | 2 | O | |
| D3 | 25.55 | 13.11 | 19.12 | 37.25 | 3.06 | 1.93 | 0.4068 | −0.3392 | 0.5297 | 21 | I | |
| D4 | 27.23 | 15.69 | 18.17 | 31.52 | 4.26 | 3.14 | 0.4634 | −0.3656 | 0.5903 | 6 | O |
M: must-be, A: attractive, O: one-dimensional, R: reverse, I: indifferent, Q: questionable qualities.
4.2 Demand importance analysis
Through the integration of Better–Worse coefficients, a four-quadrant scatter plot of tie-dye product demand satisfaction was developed using the Better value as the x-axis and the absolute value of Worse as the y-axis, with their respective means serving as critical thresholds [48]. This visualization facilitates systematic evaluation of consumer satisfaction levels across demand attributes and enhances demand classification (Figure 6). This analytical method addresses the limitations of traditional Kano methodology, which relies exclusively on maximum frequency for attribute classification [38].
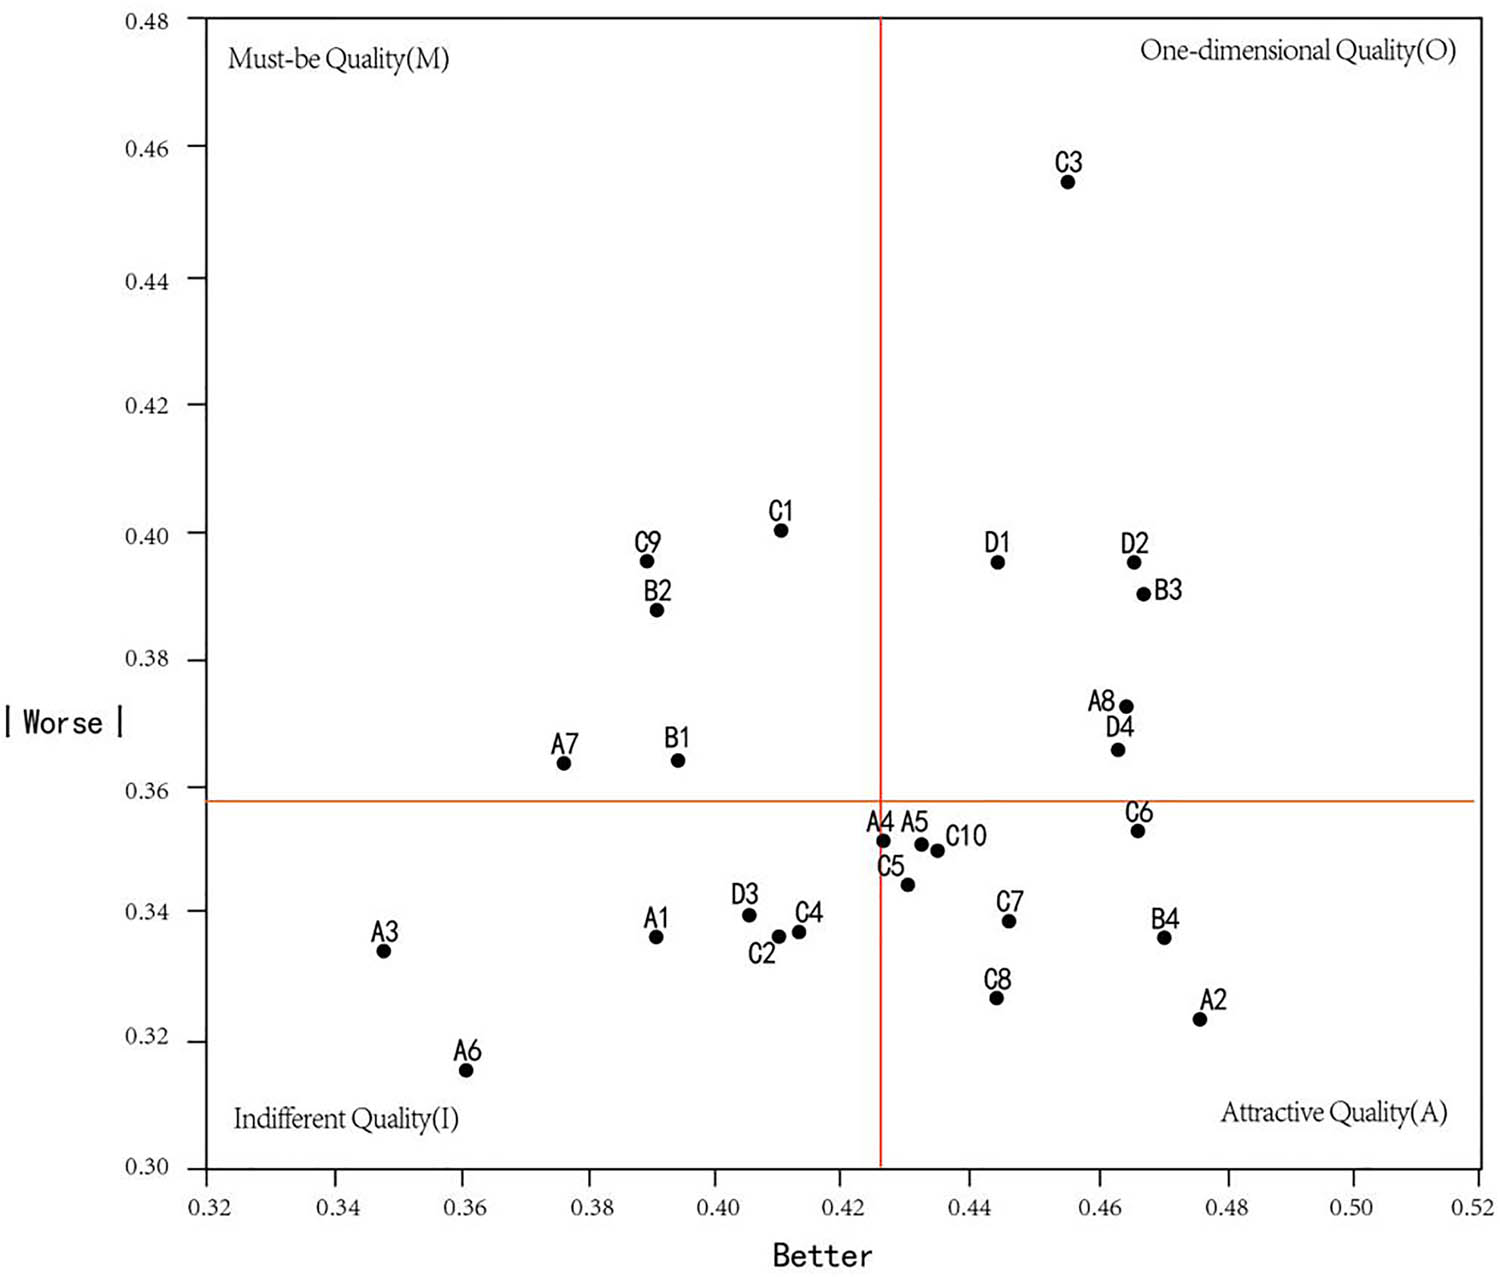
Four-quadrant scatter plot of demand satisfaction for tie-dye products.
As illustrated in Figure 6, the demands in the first quadrant represent One-dimensional Quality, encompassing six demand indicators: Easy maintenance (C3), Esthetic expression (D2), Natural materials (B3), Product diversity (A8), Cultural symbolism (D1), and Social responsibility (D4). Both the Better value and the absolute value of Worse in this quadrant exceed the mean, indicating that these features enhance consumer satisfaction, while their absence leads to dissatisfaction. These factors demand significant attention and constitute key priorities in tie-dye product design and development.
The demands in the second quadrant constitute Must-be Quality, comprising five demand indicators: Comfort performance (C1), Quality supervision (C9), Exquisite craftsmanship (B2), Traditional craftsmanship (B1), and Contemporary esthetics (A7). A Better value below the mean indicates limited impact on satisfaction improvement; lower Better values suggest consumers consider these as baseline expectations. An absolute Worse value above the mean indicates that absence of these features increases dissatisfaction, with higher values corresponding to stronger dissatisfaction. While fulfilling these demands may not enhance satisfaction, their absence generates significant dissatisfaction. Consumers typically overlook these features when present, but their omission substantially increases discontent, necessitating critical attention.
The demands in the third quadrant represent Indifferent Quality, including six demand indicators: High cost-effectiveness (C4), Social connectivity (D3), Durability (C2), Abstract style (A1), Pattern uniqueness (A3), and Classic elegance (A6). Both coefficients falling below the mean indicate minimal impact on satisfaction. Future developments may elevate these demands to higher-level needs. These attributes maintain relatively low importance for consumers, receiving minimal attention and exercising limited influence on satisfaction.
The demands in the fourth quadrant constitute Attractive Quality, encompassing nine demand indicators: Cultural promotion (C6), Eco-dyeing techniques (B4), Gradient coloration (A2), Customization services (C7), After-sales support (C10), Versatility (A5), Experiential production (C8), Ethnic characteristics (A4), and Purchase accessibility (C5). A Better value above the mean indicates these features enhance satisfaction (higher Better correlates with higher satisfaction). An absolute Worse value below the mean confirms no reduction in satisfaction. These attributes function as unexpected delight factors that exceed consumer expectations.
Consumer selection of and satisfaction with product demand attributes represent two critical considerations in corporate decision-making. To optimize consumer need fulfillment and provide clear data references for product development teams, demand satisfaction coefficients were prioritized through importance calculations. Using the demand sensitivity index (importance coefficient), sensitivity values and importance rankings for tie-dye product demands were calculated from Better–Worse coefficients:
where the “R” value represents each indicator’s sensitivity to users. It is calculated as the distance from a point to the matrix origin. Comparing R values determines each indicator’s importance. Table 9 presents the overall ranking of the sensitivity coefficient R. A greater R value, from points farther from the matrix origin, indicates a higher ranking and greater sensitivity, thus a larger consumer impact. Conversely, a smaller R value suggests a lower ranking, less sensitivity, and a smaller consumer impact, and such indicators may be temporarily disregarded [38].
The demand importance ranking for tie-dye products is presented in Table 10. Must-be quality (M) attributes demonstrate the highest priority, ranked by sensitivity coefficient as follows: Comfort performance (C1) > Quality supervision (C9) > Exquisite craftsmanship (B2) > Traditional craftsmanship (B1) > Contemporary esthetics (A7). One-dimensional Quality (O) attributes rank second: Easy maintenance (C3) > Esthetic expression (D2) > Natural materials (B3) > Product diversity (A8) > Cultural symbolism (D1) > Social responsibility (D4), indicating these features significantly enhance satisfaction when fulfilled. Attractive Quality (A) attributes rank third: Cultural promotion (C6) > Eco-dyeing techniques (B4) > Gradient coloration (A2) > Customization service (C7) > After-sales support (C10) > Versatility (A5) > Experiential production (C8) > Ethnic characteristics (A4) > Purchase accessibility (C5). Indifferent Quality (I) attributes rank the lowest: Cost-effectiveness (C4) > Social connectivity (D3) > Durability (C2) > Abstract style (A1) > Pattern uniqueness (A3) > Classic elegance (A6), with Classic elegance (A6), exhibiting the lowest sensitivity coefficient, confirming its non-essential status.
Ranking of demand importance for tie-dye products
| Ranking method | Demand importance ranking |
|---|---|
| Must-be (M) | C1 > C9 > B2 > B1 > A7 |
| One-dimensional (O) | C3 > D2 > B3 > A8 > D1 > D4 |
| Attractive (A) | C6 > B4 > A2 > C7 > C10 > A5 > C8 > A4 > C5 |
| Indifferent (I) | C4 > D3 > C2 > A1 > A3 > A6 |
| Product design | A8 > A2 > A5 > A4 > A7 > A1 > A3 > A6 |
| Product craftsmanship | B3 > B4 > B2 > B1 |
| Product experience | C3 > C6 > C1 > C7 > C10 > C9 > C8 > C5 > C4 > C2 |
| Product philosophy | D2 > D1 > D4 > D3 |
In the product design dimension: Product diversity (A8) demonstrates the highest sensitivity coefficient and belongs to One-dimensional Quality, establishing it as a crucial factor for consumer satisfaction. Attributes with relatively high sensitivity include: Gradient coloration (A2) > Versatility (A5) > Ethnic characteristics (A4). Classified as Attractive Quality, these features function as delight factors – while their absence does not generate dissatisfaction, their presence markedly enhances satisfaction. Contemporary esthetics (A7) falls under Must-be Quality, indicating consumers expect tie-dye products to align with contemporary fashion trends. Attributes with low sensitivity – Abstract style (A1), Pattern uniqueness (A3), and Classic elegance (A6) – are Indifferent Quality, indicating minimal consumer preference for specific design elements.
In the production craft dimension: Natural materials (B3) exhibits the highest sensitivity (One-dimensional Quality), followed by Eco-dyeing techniques (B4) (Attractive Quality), demonstrating strong consumer demand for eco-friendly materials and sustainable technologies. Exquisite craftsmanship (B2) and Traditional craftsmanship (B1) are Must-be Quality, representing essential expectations for detail-oriented execution and heritage preservation. Failure to meet these standards risks consumer dissatisfaction and purchase abandonment.
Among the dimensions of product experience requirements, Easy maintenance (C3) demonstrates the highest sensitivity coefficient and is classified as One-dimensional Quality. This indicates that product maintenance ease directly influences consumer satisfaction and purchase decisions, emerging as a key expectation in product experience. Cultural promotion (C6) follows with a high sensitivity coefficient and is categorized as an attractive-type requirement. This suggests consumers value not only product practicality and basic functions but also cultural and value-added dimensions, which fulfill their cultural and spiritual needs. Comfort performance (C1), ranking third in sensitivity, is a must-be-type requirement, indicating its role as a core factor in evaluating product satisfaction. Any deficiency here can affect purchase decisions and usage experience, necessitating its fulfillment or enhancement. Customization service (C7) and after-sales support (C10), as attractive-type requirements, reflect consumers’ desire for personalized experiences and high service quality. Meeting these requirements can significantly enhance satisfaction and loyalty. Quality supervision (C9), a must-be-type requirement, underscores consumers’ expectation for robust quality control throughout production and distribution to ensure product safety, reliability, and stability. Inadequate quality supervision can erode trust, impacting purchase decisions and brand reputation. Experiential production (C8) and Purchase accessibility (C5), with lower sensitivity coefficients and categorized as attractive-type requirements, are less critical but can positively surprise consumers if well-executed. Lastly, cost-effectiveness (C4) and durability (C2), with the lowest sensitivity coefficients and classified as indifferent-type requirements, indicate low consumer attention and minimal expectations. Their fulfillment or lack thereof minimally affects purchase decisions and satisfaction.
In the product philosophy dimension, esthetic expression (D2) demonstrates the highest sensitivity coefficient and is One-dimensional quality. It represents a key factor in establishing consumer satisfaction. Therefore, brands should consider esthetic expression as a core competitive advantage. They can appeal to target consumer groups and meet their needs for self-expression and individuality through unique designs and fashion elements. Cultural symbolism (D1) and social responsibility (D4) follow in sensitivity coefficient, both categorized as One-dimensional requirements. This indicates that consumers desire products that reflect ethnic characteristics and traditional culture while demonstrating brand cultural inheritance and environmental responsibility. Strong performance in these aspects can increase the product value and brand loyalty, thereby enhancing market competitiveness. Finally, Social connectivity (D3) shows the lowest sensitivity coefficient and is categorized as an indifferent-type requirement. This indicates minimal consumer concern regarding the social function of tie-dye products, suggesting it need not be prioritized in product design and development.
5 Discussion
5.1 Discussion of results and recommendations
This study employs the Kano model to establish a satisfaction framework for tie-dye products, utilizing Better–Worse coefficients to determine sensitivity values and prioritize demand attributes. This analysis identifies strategic priorities for product research and development, marketing, and after-sales services. The findings offer practical guidance for optimizing product functionality, improving consumer satisfaction and loyalty, and fostering innovation in the tie-dye industry while preserving cultural heritage.
This research establishes a demand classification framework to identify characteristics of tie-dye products and develop a consumer expectation-aligned demand indicator inventory. Twenty-six demand indicators for tie-dyed products were identified: eight for product design, four for production craftsmanship, ten for product experience, and four for product philosophy. Results demonstrate that Attractive Quality attributes predominate across categories, indicating consumers now exceed basic functionality expectations and seek diversified value from tie-dye products. Enterprises can achieve competitive differentiation by delivering unique, innovative, and expectation-exceeding features to capture consumer attention and secure market advantage [49].
This study develops a satisfaction framework for tie-dye products by integrating demand dimensions with satisfaction priorities. Application of the Better–Worse coefficient formula calculated sensitivity values and importance rankings for all demand attributes. The top five attributes are as follows: Easy maintenance (C3) > Esthetic expression (D2) > Natural materials (B3) > Product diversity (A8) > Cultural symbolism (D1). These demonstrate the highest sensitivity coefficients among 26 indicators, establishing them as core consumer demands requiring prioritized R&D focus. First, Easy maintenance (C3), ranking first in sensitivity, indicates consumers’ emphasis on the practicality of tie-dyed products. Maintenance difficulties can decrease usage frequency and recommendation likelihood. Secondly, Esthetic Expression (D2), Product Diversity (A8), and Cultural Symbolism (D1), ranking second, fourth, and fifth, respectively, reflect consumers’ desire for personalized emotional expression and cultural connotation in tie-dyed products. Finally, Natural Materials (B3), with the third-highest sensitivity coefficient, demonstrates consumers’ commitment to environmental protection and social responsibility. Moreover, these five demands span four dimensions, illustrating the complexity and diversity of consumer needs for tie-dyed products. This multi-dimensional demand indicates consumers evaluate multiple aspects when selecting tie-dyed products to fulfill their expectations in use, emotion, and psychology. Therefore, companies must achieve excellence across product design, process, experience, and concept rather than relying on singular advantages. For instance, “easy maintenance,” the primary concern, can be addressed through process improvements (e.g., fabric pre-treatment) or additional services (e.g., free care guidance). Product design and development should transcend traditional craft conventions through innovative diversification while preserving heritage essence, enabling esthetic self-expression. Finally, material selection should prioritize natural fabric and dye attributes, emphasizing environmental features in marketing to attract environmentally conscious consumers, expand the consumer base, and enhance brand development.
From a demand category prioritization perspective, Must-be Quality (M) > One-dimensional Quality (O) > Attractive Quality (A) [50]. Thus, competitive product development requires all M attributes, superior O attributes versus competitors, and differentiated A attributes. Among the 26 demands studied, M attributes ranked by sensitivity coefficient are as follows: Comfort performance (C1) > Quality supervision (C9) > Exquisite craftsmanship (B2) > Traditional craftsmanship (B1) > Contemporary esthetics (A7). Comfort and quality control are particularly significant, both in the product experience dimension. Comfort is essential for consumer satisfaction and directly influences product usability, serving as a primary evaluation standard. As the most sensitive must-be need, comfort determines consumer loyalty. Poor comfort results in strong dissatisfaction and product abandonment, demonstrating consumers’ strict “basic experience standard,” particularly for skin-contact or long-term use products. Quality control ensures products meet quality standards during production, guaranteeing reliable performance and consumer expectation alignment. These factors are crucial in consumers’ purchase decisions. Consumers prioritize products with comfort and quality assurance. Poor performance in these areas can lead to immediate purchase abandonment, regardless of other product features. Craftsmanship, as a visible “quality indicator,” represents the primary process-dimension need, requiring strict quality control. Thus, product developers should emphasize basic quality, implement strict quality control systems, ensure production steps meet quality standards, and enhance consumer trust through transparent supply chains and quality reports. Traditional craftsmanship (B1) and Contemporary esthetics (A7), also must-be needs, indicate consumers’ desire for emotional connection through traditional crafts without outdated designs. Product designers should balance tradition and modernity by preserving core manual processes while modernizing esthetics. For example, they should extract traditional element essences, employ modern minimalist lines to reshape pattern visuals, embodying Chinese traditional tie-dyeing’s profound meaning while meeting contemporary consumer expectations.
After fundamental requirements (Must-be attributes) are satisfied, consumers demonstrate high sensitivity to six one-dimensional quality attributes. Enhancement of these attributes markedly increases satisfaction, while their deficiency notably reduces it. In order of sensitivity coefficient, these attributes are as follows: Easy maintenance (C3) > Esthetic Expression (D2) > Natural Materials (B3) > Product Diversity (A8) > Cultural Symbolism (D1) > Social Responsibility (D4). The Product Philosophy dimension encompasses the majority of these attributes (D2, D1, and D4), with Esthetic Expression (D2) demonstrating particularly high sensitivity. This pattern suggests contemporary consumers prioritize products’ spiritual attributes and brand values. Consequently, product development should allocate resources toward innovative design to establish a distinctive visual identity. Cultural elements should be incorporated through sophisticated esthetic design to create unique product differentiation. Additionally, sustainable practices should be implemented throughout the product lifecycle, incorporating recyclable design, low-emission manufacturing, and sustainable materials. These initiatives should be emphasized in marketing communications to fulfill social obligations and establish enduring brand value.
The attractive quality attributes, ordered by sensitivity, are as follows: Cultural Promotion (C6) > Eco-dyeing Technology (B4) > Gradient Coloration (A2) > Customization Service (C7) > After-sales Support (C10) > Versatility (A5) > Production Experience (C8) > Ethnic Characteristics (A4) > Purchase Accessibility (C5). These elements substantially enhance satisfaction when present but generate minimal dissatisfaction when absent. Encompassing experience, craft, and design dimensions, these attributes require organizations to deliver exceptional service throughout the product lifecycle. Design should incorporate gradient colors and irregular patterns with fluid, organic forms to create relaxed, contemporary, and versatile patterns. Traditional elements, including auspicious symbols, should be integrated for cultural significance. Production should emphasize environmentally sustainable processes to address eco-conscious consumer preferences. Service and marketing should emphasize cultural heritage by communicating tie-dyeing’s historical and artistic significance. Additionally, offering customization and recycling services can enhance customer satisfaction and referrals. Sales channels should be expanded through contemporary media platforms (e.g., Douyin/Xiaohongshu) to improve accessibility and marketing effectiveness.
The indifferent quality attributes comprise High Cost-effectiveness (C4) > Social Connectivity (D3) > Durability (C2) > Abstract Style (A1) > Pattern Uniqueness (A3) > Classic Elegant (A6). These attributes currently demonstrate limited consumer relevance, particularly the three lowest-sensitivity attributes (all within Product Design dimension), indicating no strong stylistic preferences. However, Product Diversity (A8), also within the design dimension, represents a one-dimensional quality attribute ranking fourth in sensitivity. This suggests consumer dissatisfaction with current product offerings and desire for expanded tie-dye design variety. Future tie-dye product development should therefore extend beyond traditional clothing applications to encompass cultural products, footwear, accessories, and home furnishings. Clothing applications should explore diverse styles appropriate for various demographics and occasions to address diverse consumer preferences.
However, this analysis should not be considered definitive. According to the Kano model, quality attribute classifications are dynamic. Attributes may evolve over time and with functional development [51]. Demand attributes typically progress from left to right (I–A–O–M). Indifferent Quality may transform into Attractive Quality; Attractive Quality may become One-dimensional Quality; and One-dimensional Quality may evolve into Must-be quality. Therefore, dismissing indifferent needs lacks scientific merit. Instead, identifying and monitoring indifferent needs represent an ongoing process. Organizations must continuously evaluate changes in user preferences, market conditions, and product offerings, adjusting strategies accordingly to optimize user satisfaction.
5.2 Research limitations and future directions
Despite rigorous efforts, this study has limitations requiring future refinement. First, sampling bias may exist in interviewee selection due to dynamic complexities. Future work is needed to expand geographical, cultural, and demographic coverage to enrich China’s tie-dye demand inventory. Second, the limited sample size in the Kano survey may constrain generalizability. Multi-channel recruitment (e.g., social media, forums, and industry platforms) and cross-regional offline sampling will validate demand sustainability. Finally, while the Kano model effectively classifies demands, it fails to reveal inter-demand relationships [38,52]. Future studies should integrate analytical methods (e.g., structural equation modeling) to explore attribute correlations and guide holistic product development.
6 Conclusions
The modernization and transformation of traditional crafts require market-driven approaches, where consumer demand selection and satisfaction represent crucial factors in corporate product decision-making. This study employed grounded theory to identify authentic consumer needs, developing a demand inventory for tie-dye products across the following four dimensions: Product Design, Product Craftsmanship, Product Experience, and Product Philosophy. Through Kano model analysis with Better–Worse coefficients, these demands were classified and prioritized. Core consumer requirements emerged as: Easy maintenance, Esthetic expression, Natural materials, Product diversity, and Cultural symbolism. This indicates that tie-dye products must combine practicality, environmental consciousness, and esthetic expression, while preserving cultural heritage through usability, design, and health value. Their development and marketing should align with consumer preferences, reflecting Chinese traditional tie-dyeing’s essence while meeting contemporary expectations.
This research provides both theoretical and practical contributions. From a theoretical perspective, it establishes an analytical framework for demand analysis by combining grounded theory (for identifying latent expectations) and the Kano model (for systematic classification and prioritization). From a practical standpoint, it provides businesses with strategic guidance for product innovation and marketing through quantitative analysis of tie-dyeing product demand priorities. Additionally, it validates the effectiveness of mixed-method approaches in cultural consumption research, informing tie-dyeing product development while offering valuable insights for innovations in other ICH products.
Acknowledgments
We have no acknowledgements to declare.
-
Funding information: This research did not receive any specific grant from funding agencies in the public, commercial, or not-for-profit sectors.
-
Author contributions: Conceptualization, T.X. and H.X.; methodology, T.X. and H.X.; software, P.W. and H.X.; validation, H.X.; formal analysis, H.X.; investigation, P.W.; resources, P.W.; data curation, P.W. and H.X.; writing – original draft preparation, H.X.; writing – review and editing, T.X.; visualization, P.W. and H.X.; supervision, T.X.; project administration, T.X. All authors have read and agreed to the published version of the manuscript.
-
Conflict of interest: The authors declare that there are no conflicts of interest regarding the publication of this article.
-
Data availability statement: All data generated in this research are included in this article. Further enquiries can be directed to the corresponding author.
References
[1] Wang, C. (2018). Building a network for preserving intangible cultural heritage through education: A study of Indonesian batik. International Journal of Art & Design Education, 38(2), 398–415.10.1111/jade.12200Suche in Google Scholar
[2] Wang, S., Chen, C. (2025). Revitalizing Intangible cultural heritage via derivative design: A focus on chinese woodblock printing. PLoS ONE, 20(4), e0318807. 10.1371/journal.pone.0318807.Suche in Google Scholar PubMed PubMed Central
[3] Lee, K.-S. (2023). Cooking up food memories: A taste of intangible cultural heritage. Journal of Hospitality and Tourism Management, 54, 1–9.10.1016/j.jhtm.2022.11.005Suche in Google Scholar
[4] Ning, H. (2023). Analysis of the value of folk music intangible cultural heritage on the regulation of mental health. Frontiers in Psychiatry, 14, 1067753. 10.3389/fpsyt.2023.1067753.Suche in Google Scholar PubMed PubMed Central
[5] Zhang, M., Guo, X., Guo, X., Jolibert, A. (2023). Consumer purchase intention of intangible cultural heritage products (ICHP): effects of cultural identity, consumer knowledge and manufacture type. Asia Pacific Journal of Marketing and Logistics, 35(3), 726–744. 10.1108/APJML-11-2021-0831.Suche in Google Scholar
[6] The Central People’s Government of the People’s Republic of China. (2008). Notice of the State Council on Publishing the First Batch of the National Intangible Cultural Heritage List. Retrieved Jun 20, 2025. https://www.gov.cn/zhengce/content/2008-03/28/content_5917.htm.Suche in Google Scholar
[7] China Intangible Cultural Heritage Protection Center. (2006). National representative list of intangible cultural heritage. Retrieved Jun 20, 2025. https://www.ihchina.cn/project.html#target1.Suche in Google Scholar
[8] Xiang, G., Pintong, S. (2024). Exploring strategies for the development of tie-dyeing in modern society through interdisciplinary integration. The Fine and Applied Arts Journal, 17(2), 158–178. https://so05.tci-thaijo.org/index.php/fineartstujournal/article/view/272128.Suche in Google Scholar
[9] Meng, X., Yang, C., Zhu, C. (2023). Impact of tie-dye techniques on the durability and aesthetic appeal of textiles. Fibres & Textiles in Eastern Europe, 31(5), 43–55. 10.2478/ftee-2023-0044.Suche in Google Scholar
[10] Wang, Y., Zhou, Y. (2025). Artificial intelligence-driven interactive experience for intangible cultural heritage: Sustainable innovation of blue clamp-resist dyeing. Sustainability, 17(3), 898–898. 10.3390/su17030898.Suche in Google Scholar
[11] Pan, Y. (2024). The integration of intangible tie-dye culture into primary education in minority areas: a case study of Yunnan Province. [Doctoral dissertation]. Bangkok: Siam University.Suche in Google Scholar
[12] Ju, F. (2017). Traditional tie-dye handicrafts and modern design concept combined. Journal of Arts and Humanities, 6(9), 12–15. 10.18533/journal.v6i9.1230.Suche in Google Scholar
[13] Liu, S., Gao, W., Xue, W., Gu, M., Liang, H. (2016). Tie-dye technique and pattern features. Indian Journal of Fibre & Textile Research (IJFTR), 41(2), 180–187. http://op.niscair.res.in/index.php/IJFTR/article/view/5927.Suche in Google Scholar
[14] Tang, F. (2018). Elementary introduction to traditional chinese plant dyeing art and its inheritance in modern times. In International Conference of Design, User Experience, and Usability (pp. 96–109). Cham: Springer International Publishing. 10.1007/978-3-319-91803-7_8.Suche in Google Scholar
[15] Li, C., Cui, Z., Chen, J., Zhou, N. (2019). Brand revitalization of heritage enterprises for cultural sustainability in the digital era: A case study in China. Sustainability, 11(6), 1769. 10.3390/su11061769.Suche in Google Scholar
[16] Chen, Z., Ren, X., Zhang, Z. (2020). Cultural heritage as rural economic development: Batik production amongst China’s Miao population. Journal of Rural Studies, 81, 182–193. 10.1016/j.jrurstud.2020.10.024.Suche in Google Scholar
[17] Galluccio, C., Giambona, F. (2024). Cultural heritage and economic development: measuring sustainability over time. Socio-Economic Planning Sciences, 95, 101998. 10.1016/j.seps.2024.101998.Suche in Google Scholar
[18] Syafrini, D., Mardhiah, D., Permata, B. D., Saputri, F. (2025). Social capital and cultural heritage tourism development in former mining town, West Sumatra, Indonesia. Environment, Development and Sustainability, 27(3), 7141–7161. 10.1007/s10668-023-04184-y.Suche in Google Scholar
[19] Wang, F. (2023). Handmade dyeing art and technology, 1st ed. Shanghai: Donghua University Press.Suche in Google Scholar
[20] Zhang, J., Shang, Y. (2018). Application of Hand Dyeing and Printing Techniques in the Artistic Style Expression of Batik and Tie-dye. Textile Dyeing and Finishing Journal, 38(12), 19–24. https://kns.cnki.net/kcms2/article/abstract?v=aBsOvapnXdUKxvGa5NaWKehg3-HP_9KcrbwKFm00Lhmbw-24Ll8_nsY30tVez2uToLAxrVJeVEelKZTR7lVNFjjs0_LQqaWIxvsMdpYjyw7fjShJAh_XoFhO8pJhXGJKRvj4R9tVxrrWgvGU3Q4wewweE-VgjivPQrVY6wiZCIEiaofmDa-KaA==&uniplatform=NZKPT&language=CHS.Suche in Google Scholar
[21] Sun, Y., Liu, M. (2021). An inductive study on the application of tie-dye in Tang Dynasty. Advances in Social Science, Education and Humanities Research, 572, 135–139. 10.2991/assehr.k.210813.023.Suche in Google Scholar
[22] Hu, Y. (2016). The creation manifestation of tie-dyeing craft in modern fashion design. In International Conference on Electronics, Mechanics, Culture and Medicine (pp. 700–707). Atlantis Press. 10.2991/emcm-15.2016.128.Suche in Google Scholar
[23] Wang, X., Xiao, X. (2021). Intangible cultural heritage tourism innovation and development education. In Proceedings of the 5th International Conference on Digital Technology in Education (pp. 176–181). 10.1145/3488466.3488487.Suche in Google Scholar
[24] Hu, Y. (2016). The influence of modern digital design on traditional tie-dye. In 2016 International Conference on Sensor Network and Computer Engineering (pp. 418–422). Atlantis Press. 10.2991/icsnce-16.2016.81.Suche in Google Scholar
[25] Yang, N., Zang, X., Chen, C. (2022). Inheritance patterns under cultural ecology theory for the sustainable development of traditional handicrafts. Sustainability, 14(22), 14719. 10.3390/su142214719.Suche in Google Scholar
[26] Bian, X., Li, L. (2021). Collaborations between older women of Chinese ethnic minority and fashion designers: The “Momhandworks” project. Fashion Practice, 13(1), 177–184. 10.1080/17569370.2021.1874103.Suche in Google Scholar
[27] Pan, Y. (2024). The integration of intangible tie-dye culture into primary education in minority areas: A case study of Yunnan Province. [Doctoral dissertation]. Bangkok: Siam University.Suche in Google Scholar
[28] Hu, Y. (2018). Research computer software technology auxiliary material dyeing process. EURASIP Journal on Image and Video Processing, 2018(82), 1–9. 10.1186/s13640-018-0314-6.Suche in Google Scholar
[29] Tu, D., Kim, S. (2022). Research of a new tie-dyeing tool based on 3D printing technology. The Research Journal of the Costume Culture, 30(1), 161–171. 10.29049/rjcc.2022.30.1.161.Suche in Google Scholar
[30] Liu, S., Xing, X., Wang, S., Zhou, J. (2023). Tie-dyeing pattern fast-generation method based on deep-learning and digital-image-processing technology. AUTEX Research Journal, 23(4), 474–482. 10.2478/aut-2022-0034.Suche in Google Scholar
[31] Charmaz, K. (2014). Constructing grounded theory, 2nd ed. Thousand Oaks: SAGE Publications Ltd.Suche in Google Scholar
[32] Kathy, C. (2006). Constructing grounded theory: A practical guide through qualitative analysis. London: SAGE Publications Ltd.Suche in Google Scholar
[33] Yun, S., Jung, H., Choo, H. (2015). Consumer experiences in fitting rooms in SPA stores. Fashion and Textiles, 2(18), 1–14. 10.1186/s40691-015-0044-7.Suche in Google Scholar
[34] Li, F., Pan, Y. (2021). Research on influencing factors of service interactive experience of digital gas station – the case from China. Journal of Theoretical and Applied Electronic Commerce Research, 16(6), 2151–2169. 10.3390/jtaer16060120.Suche in Google Scholar
[35] Kano, N., Seraku, N., Takahashi, F., Tsuji, S.-I. (1984). Attractive quality and must–bequality. Journal of the Japanese Society for Quality Control, 14, 39–48.Suche in Google Scholar
[36] Jiang, R., Jin, P., Xu, X. (2024). Research on optimal design of pleated cheongsam based on Kano–HOQ–Pugh model. AUTEX Research Journal, 24(1), 1–9. 10.1515/aut-2023-0025.Suche in Google Scholar
[37] Chen, M., Hsu, C., Lee, L. (2019). Service quality and customer satisfaction in pharmaceutical logistics: An analysis based on Kano model and importance-satisfaction model. International Journal of Environmental Research and Public Health, 16(21), 4091. 10.3390/ijerph16214091.Suche in Google Scholar PubMed PubMed Central
[38] Deng, L., Romainoor, N., Zhang, B. (2023). Evaluation of the usage requirements of hospital signage systems based on the Kano model. Sustainability, 15(6), 4972. 10.3390/su15064972.Suche in Google Scholar
[39] Zheng, L., Wo, C., Wang, S., Li, Y., Mao, Y. (2022). Experience design of batik techniques based on KANO model. Journal of Silk, 59, 102–108. https://kns.cnki.net/kcms2/article/abstract?v=aBsOvapnXdVM7vw07Ez-i3TJqzeHAeCPhpC3aOI1sY0SlHau12QvFpuP-aaQNb0wdb76k3WcaSVlMgBOSzn_kBJEsxl6EqO1xQEECqWIzmXhYBZOLtT7dSj26Dd6A0CzcDnZWr2gBpvTS7RfExDf-ovxviRK1UlfgvYjjz8TT54PmYpoe7rleQ==&uniplatform=NZKPT&language=CHS.Suche in Google Scholar
[40] SPSSAU (Data science analytics platform). Retrieved Jun 10, 2025. Web site: https://spssau.com/index.html.Suche in Google Scholar
[41] Li, H., Shi, L. (2024). Applied research on the design of protective clothing based on the Kano-QFD-PUGH method. PLoS ONE, 19(10), e0312045. 10.1371/journal.pone.0312045.Suche in Google Scholar PubMed PubMed Central
[42] Qiao, L., Zhang, Y. (2022). Analysis of MOOC Quality Requirements for Landscape Architecture Based on the KANO Model in the Context of the COVID-19 Epidemic. Sustainability, 14(23), 15775. 10.3390/su142315775.Suche in Google Scholar
[43] Berger, C., Blauth, R., Boger, D. (1993). Kano’s methods for understanding customer-defined quality. Center for Quality of Management Journal, 2(4), 3–35.Suche in Google Scholar
[44] Zhu, Y., Peng, Y., Xin, L., Zhang, X. (2025). Public demand and optimization of smart government service platform from the perspective of service life cycle based on the Kano model: A Chinese case study. PLoS ONE, 20(4), e0319707. 10.1371/journal.pone.0319707.Suche in Google Scholar PubMed PubMed Central
[45] Matzler, K., Hinterhuber, H. (1998). How to make product development projects more successful by integrating Kano’s model of customer satisfaction into quality function deployment. Technovation, 18, 25–38.10.1016/S0166-4972(97)00072-2Suche in Google Scholar
[46] Mu, Y., Zhang, J., Wang, A., Li, M. (2020). Design research on trench coat product based on KJ-technique and Kano analysis. Wool Textile Journal, 48(5), 42–48. https://kns.cnki.net/kcms2/article/abstract?v=aBsOvapnXdVM9GLVpThiyl3da_ETtTFoiLqrfZWdw3hM6BDe0_GTNL2vwffzNwUYssVU7PFle7BlvkMYdfwKsl6t_LkVDz-dMbkp1v3AVUlyG4iL2vaMHydjvHwDE9LqHdmbNmf-s2gw5q4AmWsFlYtboBI4fAmAvBsIl0Qmvat4TT2a8fPnwA==&uniplatform=NZKPT&language=CHS.Suche in Google Scholar
[47] Liu, H., Wang, Y., Huang, Z., Romainoor, N. (2022). Research on the charming attributes of Guo Chao T-shirts based on consumer emotional experience. Journal of Silk, 59(2), 55–67. https://kns.cnki.net/kcms2/article/abstract?v=aBsOvapnXdXstWQc99opNkAun3U1mmxrxvKup4EvMqed7BC5AwE18SQ_tuKcAPvrYej4Ll9e2oP0qvhhQDHEp4QpdiSwg7S1c973rZDhDrl75pxABlUGvLmBMQA4ytdXZ0iIflRKPjQlV0sqEHmTc9IwIiNIWKAKsuNUxU-dafdN5RLCM0f98Q==&uniplatform=NZKPT&language=CHS.Suche in Google Scholar
[48] Choudhury, D., Gulati, U. (2020). Product attributes based on customer’s perception and their effect on customer satisfaction: the Kano analysis of mobile brands. Decision, 47, 49–60. 10.1007/s40622-020-00233-x.Suche in Google Scholar
[49] Zhao, M., Liu, M., Xu, C., Zhang, C. (2023). Classifying travellers’ requirements from online reviews: an improved Kano model. International Journal of Contemporary Hospitality Management, 36(1), 91–112. 10.1108/ijchm-06-2022-0726.Suche in Google Scholar
[50] Jiang, X., Zhang, J., Yang, C., Wan, R. (2023). Evaluating the service quality of insular and coastal recreational fisheries by integration of the SERVQUAL-fuzzy Kano model and importance-performance analysis. Ocean & Coastal Management, 243, 106753. 10.1016/j.ocecoaman.2023.106753.Suche in Google Scholar
[51] Kano, N. (2001). Life cycle and creation of attractive quality. In The 4th QMOD Conference, Linkoeping, Sweden, 2001.Suche in Google Scholar
[52] Mikulić, J., Prebežac, D. (2011). A critical review of techniques for classifying quality attributes in the Kano model. Managing Service Quality: An International Journal, 21(1), 46–66. 10.1108/09604521111100243.Suche in Google Scholar
© 2025 the author(s), published by De Gruyter
This work is licensed under the Creative Commons Attribution 4.0 International License.
Artikel in diesem Heft
- Study and restoration of the costume of the HuoLang (Peddler) in the Ming Dynasty of China
- Texture mapping of warp knitted shoe upper based on ARAP parameterization method
- Extraction and characterization of natural fibre from Ethiopian Typha latifolia leaf plant
- The effect of the difference in female body shapes on clothing fitting
- Structure and physical properties of BioPBS melt-blown nonwovens
- Optimized model formulation through product mix scheduling for profit maximization in the apparel industry
- Fabric pattern recognition using image processing and AHP method
- Optimal dimension design of high-temperature superconducting levitation weft insertion guideway
- Color analysis and performance optimization of 3D virtual simulation knitted fabrics
- Analyzing the effects of Covid-19 pandemic on Turkish women workers in clothing sector
- Closed-loop supply chain for recycling of waste clothing: A comparison of two different modes
- Personalized design of clothing pattern based on KE and IPSO-BP neural network
- 3D modeling of transport properties on the surface of a textronic structure produced using a physical vapor deposition process
- Optimization of particle swarm for force uniformity of personalized 3D printed insoles
- Development of auxetic shoulder straps for sport backpacks with improved thermal comfort
- Image recognition method of cashmere and wool based on SVM-RFE selection with three types of features
- Construction and analysis of yarn tension model in the process of electromagnetic weft insertion
- Influence of spacer fabric on functionality of laminates
- Design and development of a fibrous structure for the potential treatment of spinal cord injury using parametric modelling in Rhinoceros 3D®
- The effect of the process conditions and lubricant application on the quality of yarns produced by mechanical recycling of denim-like fabrics
- Textile fabrics abrasion resistance – The instrumental method for end point assessment
- CFD modeling of heat transfer through composites for protective gloves containing aerogel and Parylene C coatings supported by micro-CT and thermography
- Comparative study on the compressive performance of honeycomb structures fabricated by stereo lithography apparatus
- Effect of cyclic fastening–unfastening and interruption of current flowing through a snap fastener electrical connector on its resistance
- NIRS identification of cashmere and wool fibers based on spare representation and improved AdaBoost algorithm
- Biο-based surfactants derived frοm Mesembryanthemum crystallinum and Salsοla vermiculata: Pοtential applicatiοns in textile prοductiοn
- Predicted sewing thread consumption using neural network method based on the physical and structural parameters of knitted fabrics
- Research on user behavior of traditional Chinese medicine therapeutic smart clothing
- Effect of construction parameters on faux fur knitted fabric properties
- The use of innovative sewing machines to produce two prototypes of women’s skirts
- Numerical simulation of upper garment pieces-body under different ease allowances based on the finite element contact model
- The phenomenon of celebrity fashion Businesses and Their impact on mainstream fashion
- Marketing traditional textile dyeing in China: A dual-method approach of tie-dye using grounded theory and the Kano model
- Contamination of firefighter protective clothing by phthalates
- Sustainability and fast fashion: Understanding Turkish generation Z for developing strategy
- Digital tax systems and innovation in textile manufacturing
- Applying Ant Colony Algorithm for transport optimization in textile industry supply chain
- Innovative elastomeric yarns obtained from poly(ether-ester) staple fiber and its blends with other fibers by ring and compact spinning: Fabrication and mechanical properties
- Design and 3D simulation of open topping-on structured crochet fabric
- The impact of thermal‒moisture comfort and material properties of calf compression sleeves on individuals jogging performance
- Calculation and prediction of thread consumption in technical textile products using the neural network method