Renewable-integrated power conversion architecture for urban heavy rail systems using bidirectional VSC and MPPT-controlled PV arrays as an auxiliary power source
-
Jakkrit Pakdeeto


Abstract
This study proposes a modern architecture for heavy railway systems that integrates renewable energy from photovoltaic arrays. This study introduces a transformation of the existing 12-pulse diode rectifier circuit in traditional power distribution systems into a bidirectional voltage source converter that regulates the direct current (DC) bus voltage. When the DC bus is constant, it can connect with solar energy sources, including the maximum power point tracker, under varying irradiance conditions. The PI controller parameters were designed using basic control system theory based on a time-invariant mathematical model. The simulation results demonstrate the system’s capability to maintain DC bus voltage despite load variations while achieving maximum power from the photovoltaic (PV) arrays. Furthermore, this study presents an assessment highlighting the cost savings associated with renewable energy sources from PV arrays in the proposed system.
1 Introduction
Global warming has emerged as one of humanity’s most critical challenges. Renewable energy technologies, such as solar and wind power, have emerged as sustainable solutions to reduce the dependence on finite fossil resources [1]. In Thailand, urban transit systems play a vital role in reducing road congestion and transportation-related emissions [2]. The Mass Rapid Transit (MRT) Purple Line, which connects Nonthaburi and Bangkok, exemplifies the country’s commitment to enhancing public transportation, which is the case study in this work [3]. From the literature review [4], 16 passenger stations cover 23 km from the Khlong Bang Phai Station located in Nonthaburi Province to the Tao Poon Station in Bangkok. The conventional MRT Purple Line system in Thailand obtains an alternating current (AC) power of 115 kV from the Metropolitan Electricity Authority (MEA), as illustrated in Figure 1 [4], which will be stepped down to 24 kV at the distributed substations. However, the traction system for train cars uses a direct current (DC) power distribution of 750 Vdc. For the traction system, the output voltage from the distributed transformer is converted to DC power using a 12-pulse rectifier. The conventional system with this rectifier technology poses limitations regarding efficiency and compatibility with renewable energy. The conventional rectifier, designed for unidirectional power conversion, cannot facilitate energy recovery or effectively integrate renewable energy sources. As a result, the conventional MRT system cannot be operated within Thailand’s broader renewable energy strategy designed to meet Thailand’s Power Development Plan [5]. From the literature reviews [6], current information and future architectural directions of intelligent hybrid AC to DC systems in railway microgrids have been proposed. The systems integrated renewable energies can support the railway electrification systems in Thailand following with the national Power Development Plan. To achieve this goal, it is necessary to replace the existing DC railway grids with hybrid AC-DC system. This transition includes converting conventional unidirectional rectifiers to bidirectional rectifiers. Such an upgrade would enhance the flexibility of incorporating renewable energy into the system and contribute to long-term sustainability. Additionally, various international applications of photovoltaic (PV) arrays in electric railway systems are summarized in Table 1 [6,7,8].
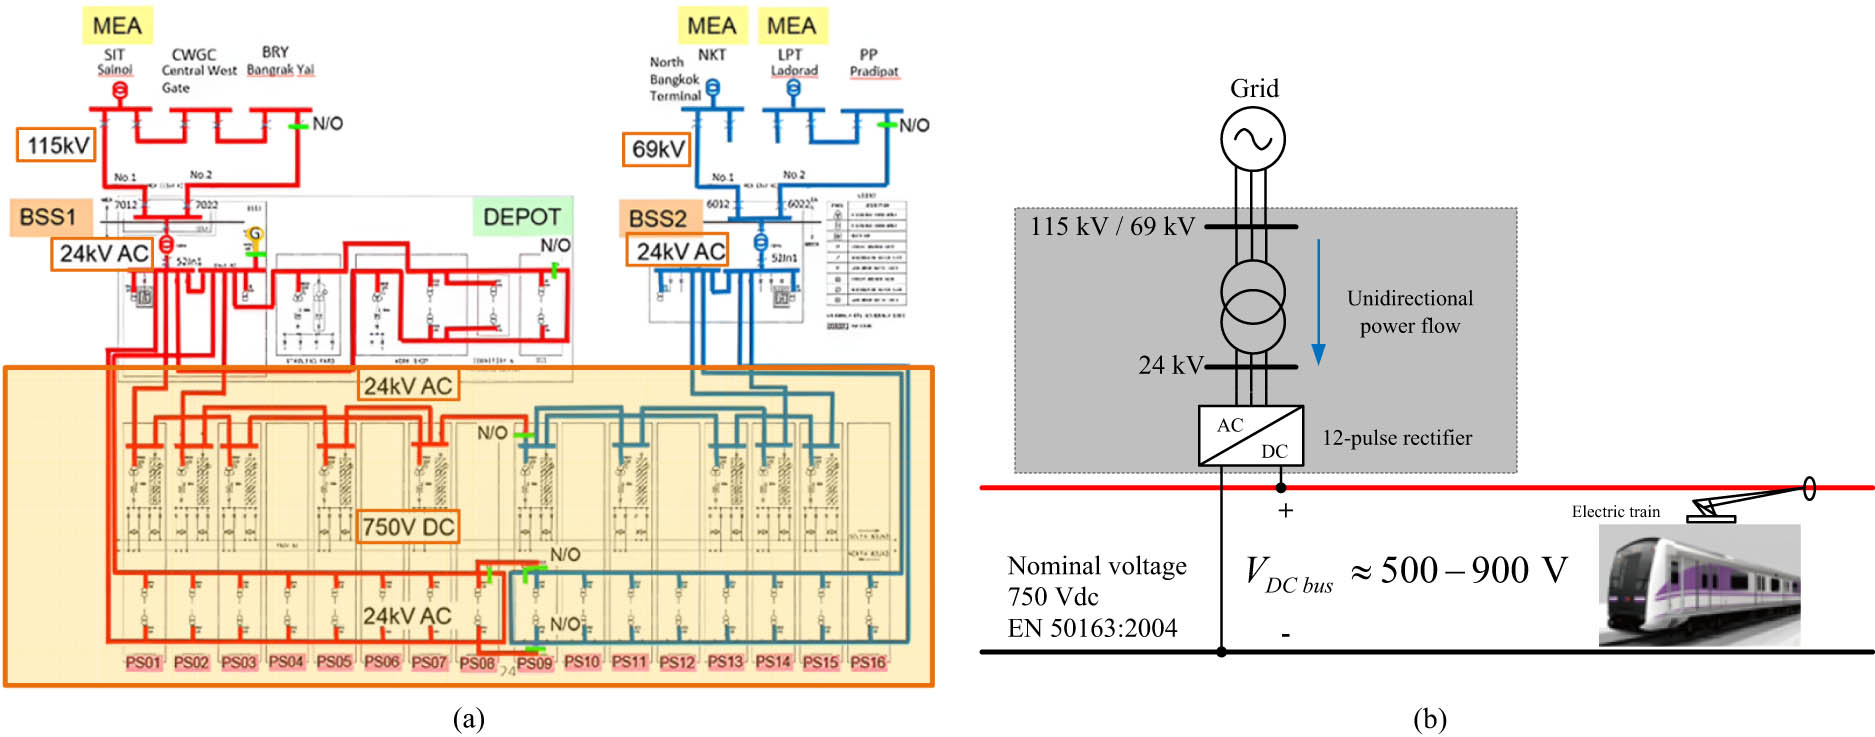
Conventional architecture of the MRT Purple Line. (a) Conventional MRT Purple Line power system. (b) Conventional MRT Purple Line schematic.
Existing railway systems with PV arrays installation
| Location | Installation areas | Rated power |
|---|---|---|
| Beijing South railway station, China | Station/depot/tunnel rooftop | 220 kWp |
| Hangzhou East railway station, China | 10 MWp | |
| Shaling depot, China | 2.4 MWp | |
| Xizhaotong depot, China | 1 MWp | |
| Yuzhu depot, China | 5 MWp | |
| Tokyo Station, Japan | 453 kWp | |
| Keiyo Rolling Stock Center, Japan | 1.05 MWp | |
| Belgium | 3,300 MWh | |
| Madhya Pradesh and Diwana in Haryana, India | 2 MWp | |
| Byron Bay Railway, Australia | Train rooftop | 6.5 kWp |
| DEMU, India | 4.8 kWp | |
| Bhilai, India | Trackside | 50 MWp |
| Pendolino Hall, Finland | 800 kWp |
Based on Table 1, many countries have already developed electric railway systems that utilize solar PV energy as a power source for train operations. However, the implementations of such systems in Thailand have not been applied. Therefore, this study investigates the potential benefits of replacing the conventional 12-pulse rectifier with a bidirectional voltage source converter (VSC) in the MRT Purple Line system. This conversion aims to enable the integration of PV arrays into the railway power system in which the proposed converter can regulate the DC bus voltage constant of 750 Vdc to work efficiently with the traction system.
Figure 1a shows an overview of the conventional MRT Purple Line power system, with its schematic circuit shown in Figure 1b. In the conventional system, the 12-pulse rectifier is used to convert the AC power to DC power; however, this rectifier supports only unidirectional power flow and lacks flexibility for integrating renewable energy sources. To overcome these limitations, the rectifier can be replaced by a bidirectional VSC, as illustrated in the grey area of Figure 1b. After the bidirectional VSC is applied, PV arrays can be installed on the rooftops of each station in which the new system architecture proposed in this work is illustrated in Figure 2.

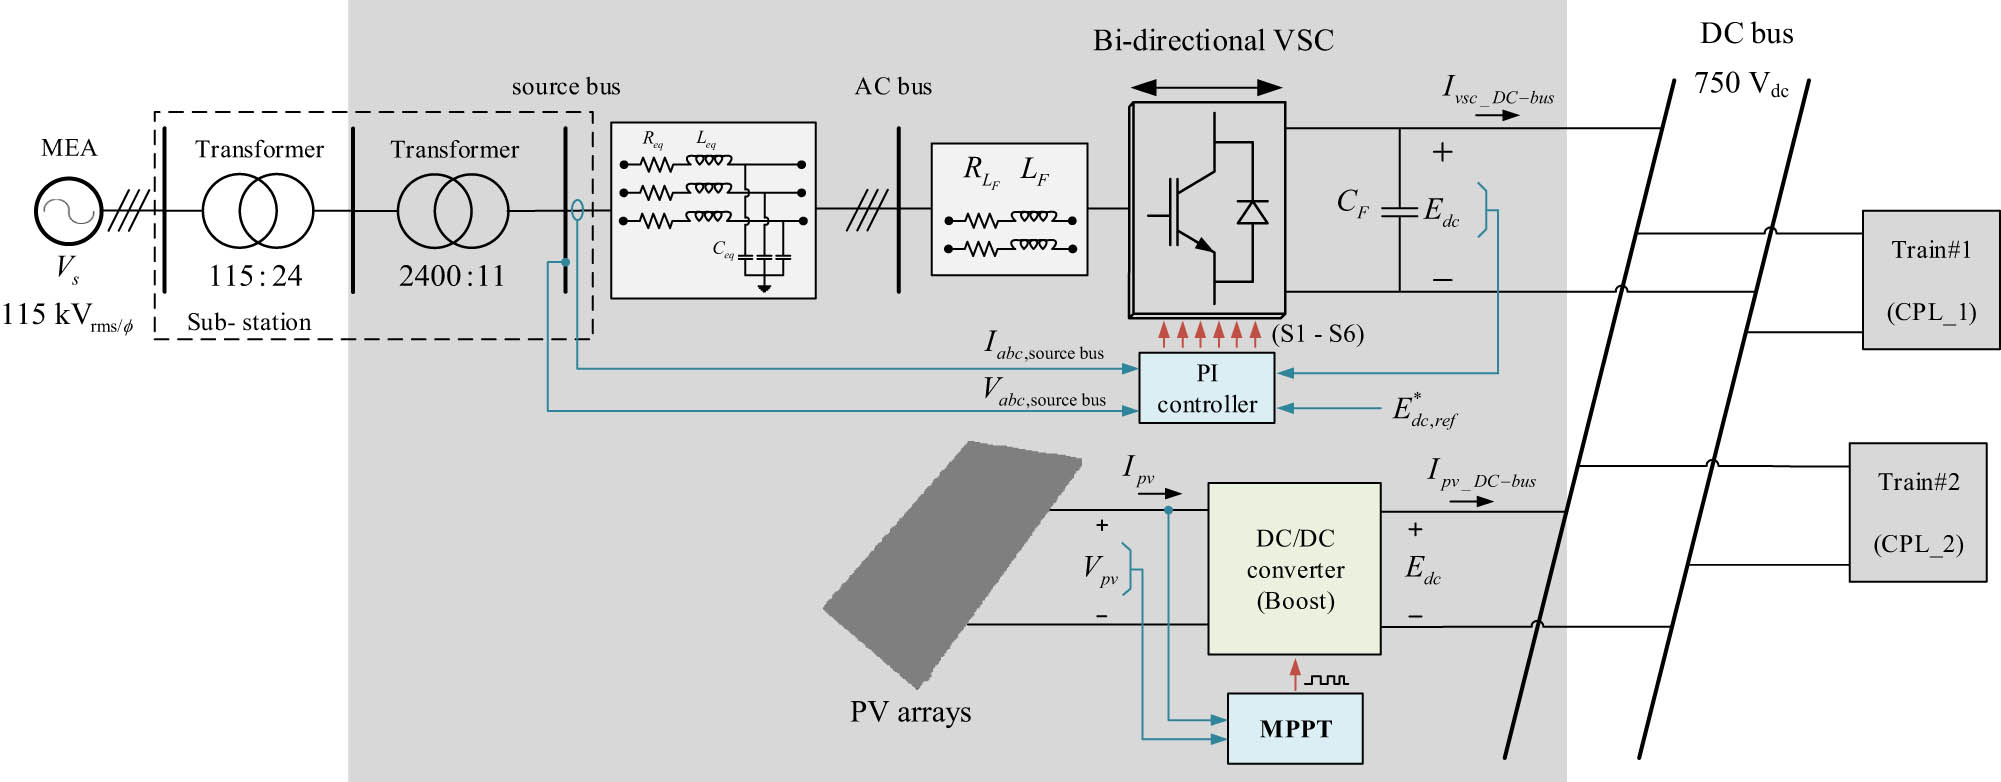
Proposed architecture for heavy railway with PV integration.
As seen in Figure 2, modifications to the conventional system can be categorized into two categories. The first is the replacement of the AC power supplied by the MEA and the diode rectifiers with the bidirectional VSC to regulate the DC bus at a constant 750 Vdc using the PI controller. Moreover, this bidirectional VSC can obtain energy from the electric train under regenerative braking mode [9]. The second is the installation of PV arrays, which can be done on the passenger station rooftop to achieve renewable energy [10]. It can connect with the PV arrays controlled by the boost converter to track the maximum power point (MPP), which supplies power to the DC bus as the auxiliary source. Nevertheless, this study focuses on this modification at only one station, before extending it to other stations in the future. Therefore, two controllers must be designed to meet the voltage standard agreements [11]. The advantages of the new architecture proposed in this work are as follows:
Renewable energy from PV arrays connected to a boost converter controlled by the MPP tracking (MPPT) algorithm to achieve the MPP can be installed for the modern architecture of the heavy electrical railway system.
The ways to design the controllers for the bidirectional VSC and the boost converter are presented.
Simulation using hardware-in-loop (HIL) can ensure that both controllers can be implemented without errors from the C language programming code.
It is cost-effective.
The remainder of this study is structured as follows: Section 2 presents the proposed system, including the mathematical model. Section 3 presents the proposed system’s controllers. Section 4 discusses the simulation results using HIL and the cost-effectiveness evaluation of the proposed system. Finally, Section 5 provides the conclusion.
2 Considered system
Figure 3 shows the proposed architecture of the heavy electrical railway system. The structure consists of three main parts. The first part is the utility grid 115 kV from the MEA of Thailand, feeding the main power into the DC bus through the transformer, transmission line, and bidirectional VSC. For the second part, the PV arrays, as the auxiliary source, supply the maximum power tracked by the MPPT algorithm via the boost converter. This converter is used to step up the DC voltage from the PV arrays. The last part is the constant power loads (CPLs) represented for the two trains per passenger station.
The schematic of the proposed electric railway system.
In Figure 3, the gray area is modified from the conventional structure to be available for renewable energy. Two controllers for the converters in the proposed electrical railway system are concerned. PI controllers are used to regulate the DC bus voltage for a bidirectional converter. At the same time, the MPPT algorithm is applied to the boost converter to track the maximum power from the PV arrays. For the controller design process, the dynamic model is very important. However, the proposed system has many converters, resulting in a time-varying model that is complicated for controller design or stability prediction in the future. The literature reviews [12,13,14,15,16] show that the direct–quadrature (DQ) and generalized state space averaging (GSSA) approaches are suitable for analyzing a three-phase power system and a DC/DC converter, respectively. To obtain the time-invariant model, the DQ and GSSA methods are then applied, and basic circuit theories, such as Ohm’s and Kirchhoff’s laws, are also applied. The resulting mathematical model of the considered system is given in (1). The details of the model derivation can be found in the study by Pakdeeto et al. [14].
The proposed mathematical model in (1) can be used to provide the system responses with a fast computational time compared with those of the exact topological model from the MATLAB program [14]. It can also be used for the controller design, which will be presented in the next section.
3 Controller design
For the considered system, two controllers will be designed for both the bidirectional VSC and boost converter. The PI controller regulates the DC bus voltage to be constant via the bidirectional VSC. Meanwhile, the MPPT algorithm was used to force the boost converter to track the maximum power from the PV arrays. The details of these controllers will be explained as follows:
3.1 PI controller for the bidirectional VSC
Figure 4 shows the PI controller diagram for the considered system. In this figure, there are four inputs, and the output is the control signal. This signal will be compared with the sinusoid carrier signal to provide the pulse width modulation called “SPWM” for the bidirectional VSC. Furthermore, in Figure 4, there are two loops, the voltage and current loops, forming a cascade control in the d-q axes. The output from the voltage loop in the d-axis is the reference current. The reference current in the q-axis is set to zero, resulting in the unity power factor. The output from the current loop in both the d and q axes is the modulation index in the d–q axes. These values will be changed into a three-phase signal using the inverse Park’s transformation [12].

PI controller structure for DC bus voltage regulation.
As shown in Figure 4, the parameters following
where
These equations are used to design the PI controller parameters in which
3.2 MPPT for the boost converter
Besides the PI controller, the perturbation and observation (P&O) algorithm [19] is used in this study to provide the maximum power from the PV arrays. This algorithm controls the boost converter while the irradiances are changed. The P&O algorithm is simple and can reliably track the MPP in both simulations and experiments [20]. The principle of the P&O algorithm operates in a time-stepped manner by adjusting the output voltage of the PV arrays. During the perturbation step, the voltage and current of the PV arrays were measured to calculate the power output. This power output is then compared between the current and previous time steps to determine whether to adjust the PV output voltage. This adjustment process is referred to as the observation process. The voltage adjustment of the PV cells is achieved by modifying the duty cycle of the boost converter. The principle of MPPT using the P&O algorithm can be explained using the characteristic curves in Figure 5, which represent different irradiances.

Characteristic curves demonstrating the P&O algorithm.
The P–V curve is also illustrated using the characteristic curves in Figure 5. The
where
The P&O algorithm presented in this study is straightforward, similar to the hill-climbing algorithm presented by Abdelsalam et al. [21]. It can be implemented in the experiment with the flowchart shown in Figure 6.

Flowchart of the P&O algorithm for MPPT.
The flow chart of the P&O algorithm shown in Figure 6 can be implemented with the C-programing language in five steps, as follows:
Step I: Set the initial duty cycle.
Step II: Measure the voltage and current from the PV arrays.
Step III: Evaluate
Step IV: If the ratio
Step V: Update the variable to the old values for the next iteration and return to Step II.
The P&O algorithm will be operated following the abovementioned steps until the MPPT is achieved. However, in this study, the maximum power of the proposed PV arrays is equal to 496 kW, which equals power generated by 1,240 PV panels with each generating 400 W [14]. The number of PV arrays is calculated from the width × length of one passenger station [10]. Figure 7 shows the P–V and I–V curves involving the proposed PV arrays. The P–V characteristic shows the MPP at any irradiance, and they will be used to confirm the MPPT using the P&O method in Section 4.
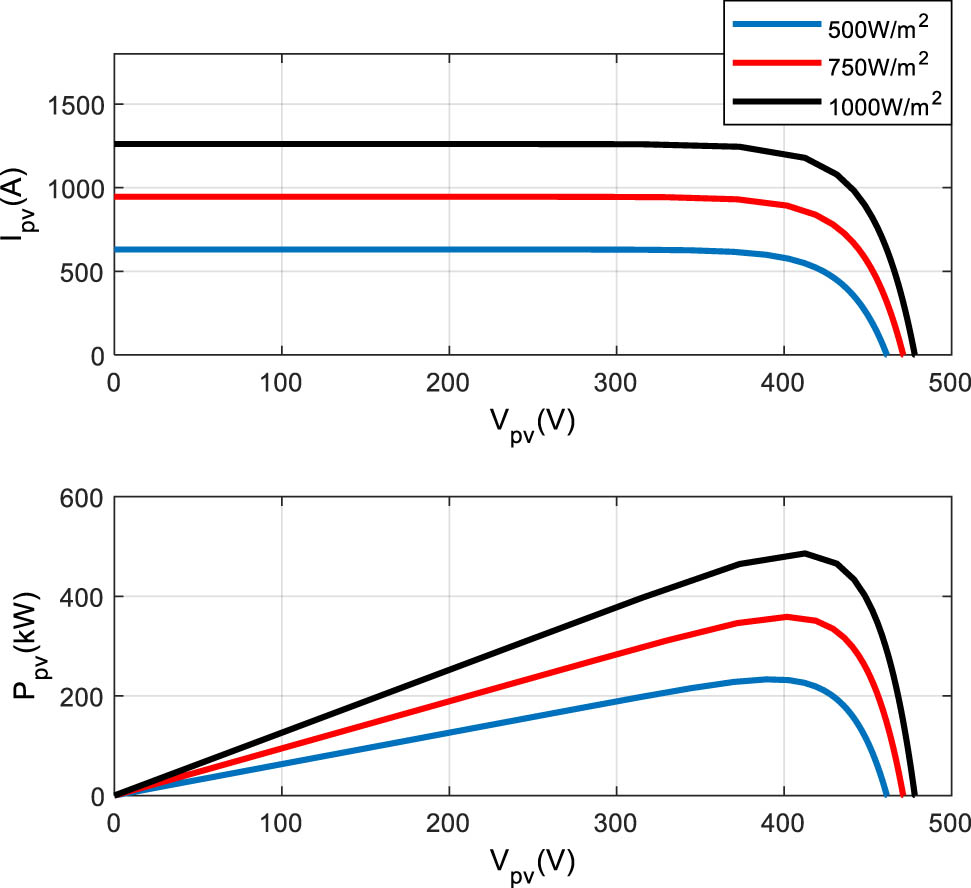
P–V and I–V characteristic of the proposed system.
4 Simulation results
To confirm both controllers for the proposed system in this study, a simulation on the MATLAB program processed by a high-performance microcontroller board, sometimes called HIL, is presented. In addition, a cost-effectiveness assessment is also provided in this section.
4.1 HIL
HIL testing is a popular tool in modern engineering, ensuring that systems perform as intended under practical conditions [22]. In this study, the power converter models were used via the SimPowerSystem® block set, while the proposed controllers will be implemented in a physical microcontroller board TMDSDOCK28335 produced by Texas Instruments. This will result in enhanced safety and reduced costs. It can also ensure that the proposed architecture can be implemented without errors from the controller program. Figure 8 shows a signal flow diagram of the HIL simulation.

HIL signal flow diagram of a HIL simulation.
As seen in Figure 8, the input of the HIL microcontroller board, TMDSDOCK28335, comprises six signals.

Microcontroller board interface with MATLAB program.
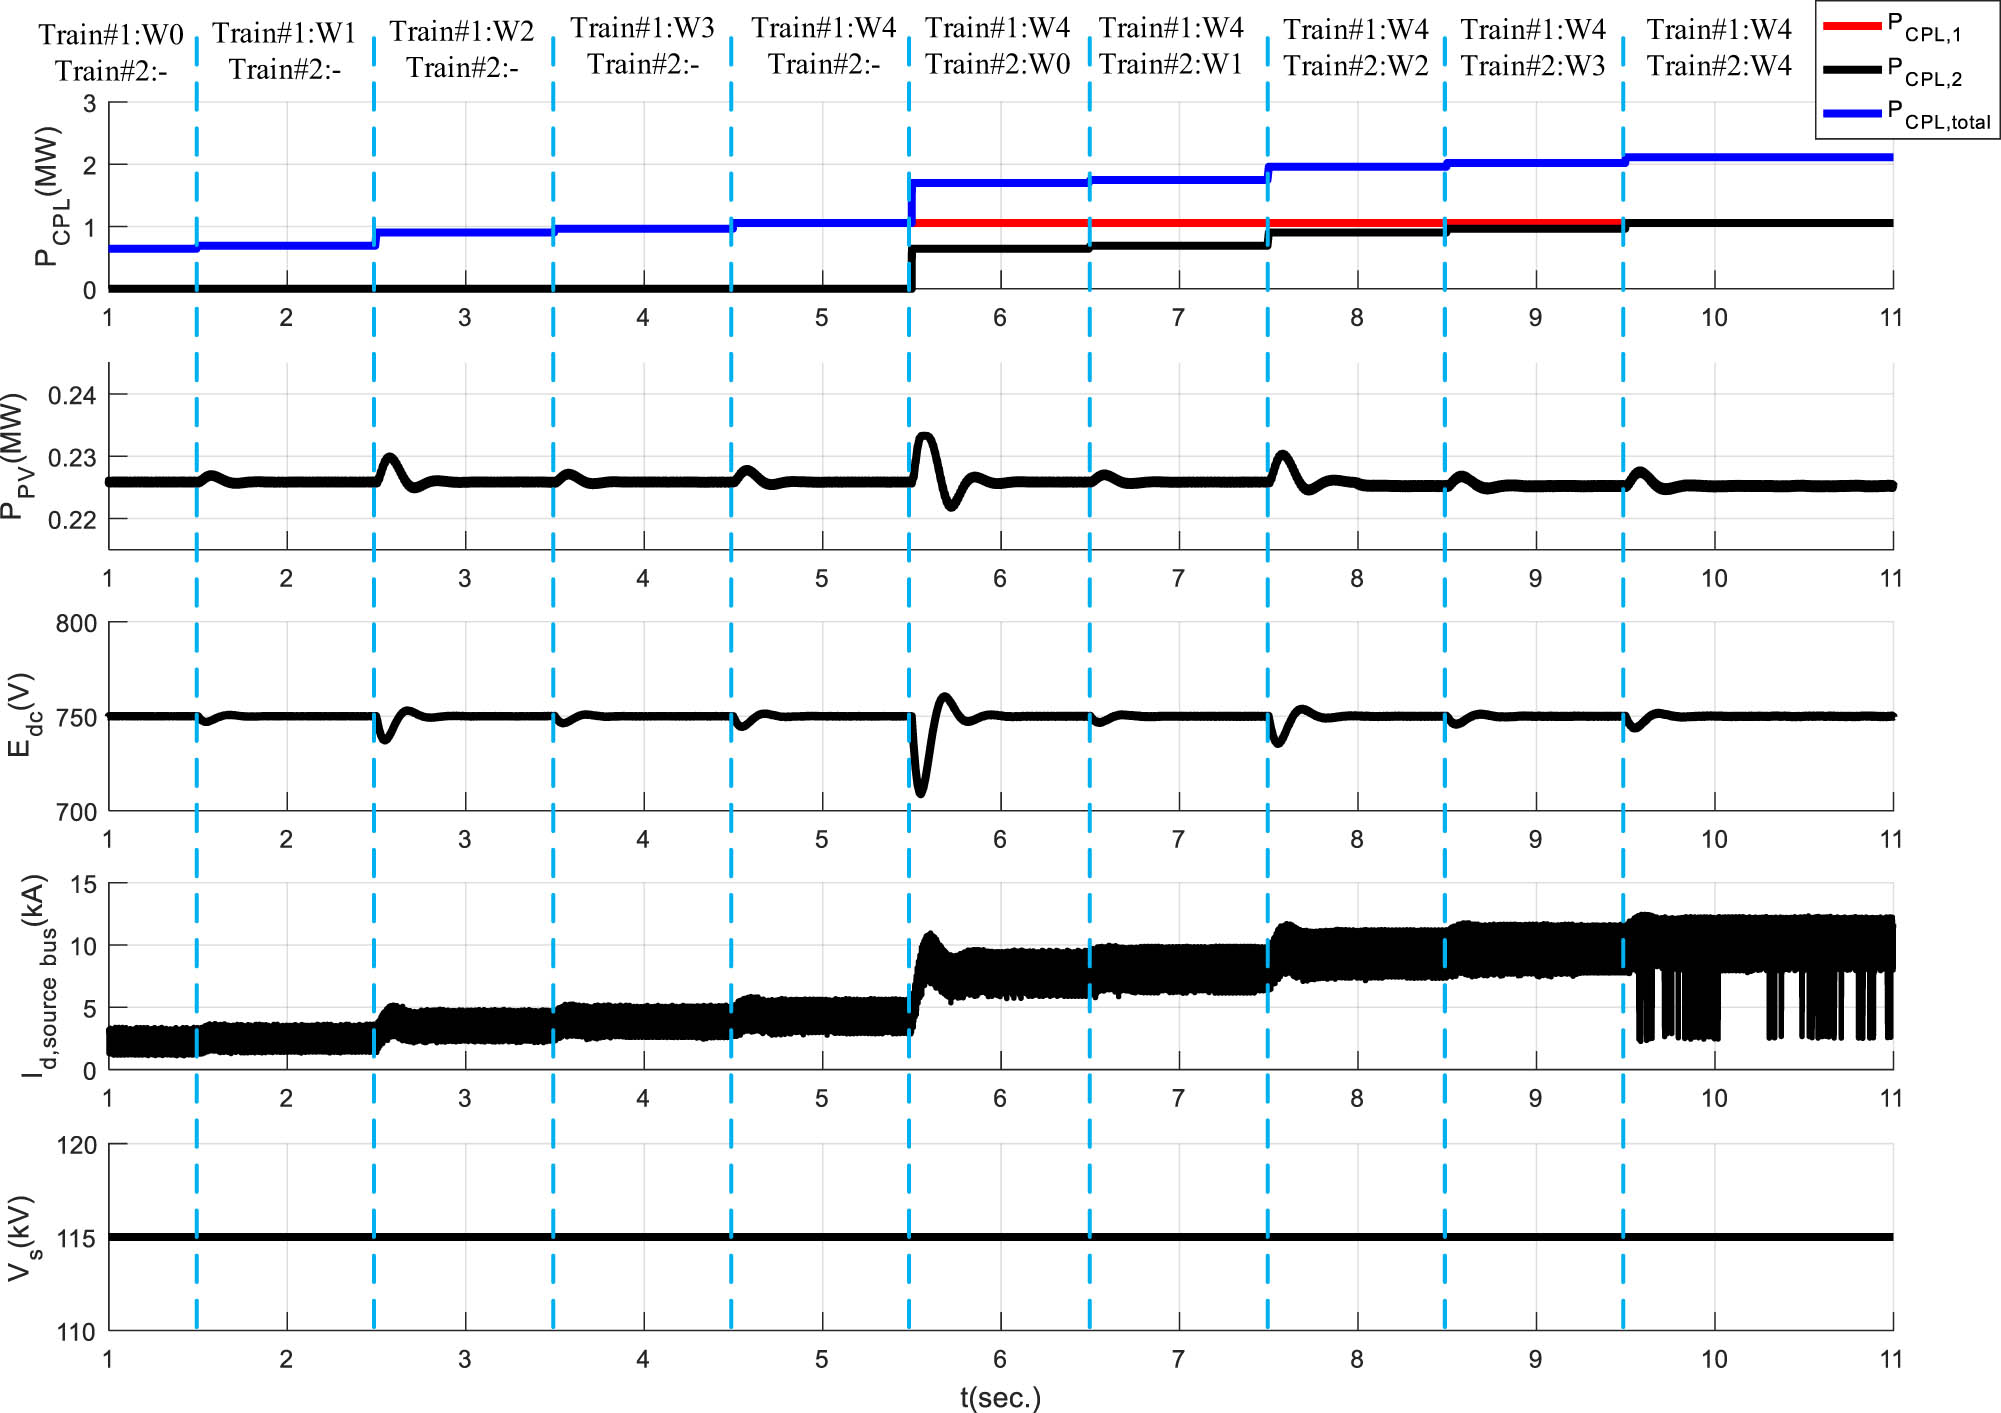
In this study, two cases will be simulated by HIL while considering fixed irradiance and fixed CPL. The first case is load variations following the number of passengers per train, as shown in Table 2 [18], while the irradiance is a constant value of 1,000 W/m2, as shown in the system responses in Figure 10. The
Load power depending on the passengers
| Load type | Passenger load | TE (N) |
|
|---|---|---|---|
| W0 | Tare load | 19.1 | 0.642 |
| W1 | Seating | 20.6 | 0.692 |
| W2 | Seating + Standee (5/m2) | 26.9 | 0.904 |
| W3 | Seating + Standee (6/m2) | 28.6 | 0.965 |
| W4 | Seating + Standee (8/m2) | 31.4 | 1.055 |
TE is the tractive effort per motor. P train is the load power per train.

System responses when the irradiance is equal to 1,000 W/m2.
It can be seen from Figure 10 that

System responses when the irradiance is equal to 750 W/m2.
System responses when the irradiance is equal to 500 W/m2.
The responses in Figures 10–12 were used to confirm the PI controller that the system can be operated even when the system loads are changed. To confirm the MPPT, the HIL result when the irradiance is varied and with fixed

PV power output under varying solar irradiance levels.
The result in Figure 13 shows the system responses focusing on the output power
4.2 Cost-effectiveness assessment
About 1,240 PV panels can be installed on the roof of a train station terminal, generating 496 kW of power under a solar irradiance of 1,000 W/m². To estimate the energy, the PV arrays can be produced around the 10 h daylight period (7 a.m. to 5 p.m.). The results are summarized in Table 3.
Electrical energy generated by the 1,240 PV panels
| Solar irradiance (W/m2) | Maximum power (kW) | Energy (kW h) | Units in the 3-phase power system | Electricity cost (THB/kWh) [23] | Estimated daily savings (THB) |
|---|---|---|---|---|---|
| 1,000 | 496 | 4,960 | 1653.33 | 2.3845 | 3942.37 |
| 750 | 358 | 3,580 | 1193.33 | 2845.50 | |
| 500 | 233 | 2,330 | 776.67 | 1851.97 |
When considering the electricity generated from solar panels as an auxiliary energy source, it is revealed that these installed PV panels can significantly reduce the daily electricity costs of running the considered system. The approximate daily savings at one station are shown in Table 3, demonstrating the effectiveness of the solar panel installations in reducing electricity expenses.
5 Conclusion
This study proposes a modern architecture for the heavy railway system in Thailand. The proposed modern architecture uses a bidirectional VSC instead of the 12-pulse diode rectifier used in the conventional system. As a result, the energy from the regenerative braking and PV arrays and the constant DC bus voltage can be achieved. The PI controller controls the bidirectional VSC, resulting in a constant DC bus voltage, and the parameters of this controller are designed from the model to achieve the desirable performance. When the DC bus voltage is controlled, the P&O method tracking the MPP from the PV arrays is applied. In addition, the proposed mathematical model derived from the combination of the DQ and GSSA methods is presented. The simulation results via HIL are provided to ensure that the proposed system can be operated according to the voltage standard at the DC bus and that the MPP is tracked from PV arrays achieved at any irradiance. Moreover, a cost-effectiveness assessment is presented to clearly show the advantages of the proposed architecture for the heavy railway system.
Acknowledgments
This work was supported by Suranaree University of Technology.
-
Funding information: This work was funded by (i) Thailand Science Research and Innovation (TSRI), and (ii) National Science, Research and Innovation Fund (NSRF) (NRIIS no. 195631).
-
Author contributions: All authors have accepted responsibility for the entire content of this manuscript, consented to its submission to the journal, reviewed all results, and approved the final version. Jakkrit Pakdeeto contributed to the conceptualization, methodology, mathematical model derivation and validation, controller design and investigation, as well as writing and editing the original draft. Tanatip Boontawee was responsible for simulation, data curation, and manuscript formatting. Kongpan Areerak provided supervision, resources, visualization, funding acquisition, and project administration.
-
Conflict of interest: Authors state no conflict of interest.
-
Data availability statement: All data generated or analyzed during this study are included in this published article.
Appendix
Table A1 shows the system parameters, including the descriptions used for the controller designs and the simulation results.
System parameters
| Parameters | Values | Descriptions |
|---|---|---|
|
|
115 kV | MEA’s voltage source |
|
|
50 Hz | System frequency |
|
|
0.001 Ω | Transmission line resistance |
|
|
0.01 µH | Transmission line inductance |
|
|
12 nF | Transmission line capacitance |
|
|
0.5 µΩ | Inductor’s inner resistance of the filter circuit |
|
|
1.2 µH | Inductor value of the filter circuit |
|
|
500 mF | Capacitor value of the filter circuit |
|
|
44.9881 | Proportional gain of the voltage loop |
|
|
1443.98 | Integral gain of the voltage loop |
|
|
−0.00001 | Proportional gain of the current loop |
|
|
−0.04000 | Integral gain of the current loop |
|
|
124 | Amount of parallel PV stack |
|
|
10 | Amount of PV per stack connected in series |
|
|
10.17 A | Short-circuit current of the PV module |
|
|
47.8 V | Open-circuit voltage of a PV module |
|
|
1,000 W/m2 | Standard irradiance value |
|
|
25°C | Standard temperature value |
|
|
5 µΩ | Shunt resistor value of the PV module |
|
|
5 MΩ | Series resistor value of the PV module |
References
[1] Alrikabi NKMA. Renewable energy types. J Clean Energy Technol. 2014;2(1):61–4.10.7763/JOCET.2014.V2.92Search in Google Scholar
[2] Lieophairot C, Rojniruttikul N. Factors affecting state railway of Thailand (SRT) passenger train service use decision: A structural equation model. Heliyon. 2023;9(5):e15660. 10.1016/j.heliyon.2023.e15660.Search in Google Scholar PubMed PubMed Central
[3] Chatwongtong K, Kulworawanichpong T, Ratniyomchai T. Energy saving with on-board supercapacitors in MRT Purple Line, Bangkok. In 2021 International Conference on Power, Energy and Innovations (ICPEI); 2021. p. 77–80.10.1109/ICPEI52436.2021.9690672Search in Google Scholar
[4] Tanada J. Power facilities for the Purple Line, the Kingdom of Thailand. Meiden Rev. 2018;174(3):35–41.Search in Google Scholar
[5] Kusumadewi TV, Winyuchakrit P, Misila P, Limmeechokchai B. GHG mitigation in power sector: Analyzes of renewable energy potential for Thailand’s NDC roadmap in 2030. Energy Procedia. 2017;138:69–74. 10/01/2017.10.1016/j.egypro.2017.10.054Search in Google Scholar
[6] Jafari Kaleybar H, Hafezi H, Brenna M, Faranda RS. Smart AC-DC coupled hybrid railway microgrids integrated with renewable energy sources: Current and next generation architectures. Energies. 2024;17(5):1179. 10.3390/en17051179.Search in Google Scholar
[7] Mingliang W, Weiying W, Wenli D, Huabo C, Chaohua D, Weirong C. Back-to-back PV generation system for electrified railway and its control strategy. In 2017 IEEE Transportation Electrification Conference and Expo, Asia-Pacific (ITEC Asia-Pacific); 2017. p. 1–6.10.1109/ITEC-AP.2017.8080799Search in Google Scholar
[8] Cheng P, Wu C, Kong H, Blaabjerg F, Quan Y. Connection and control strategy of PV converter integrated into railway traction power supply system. Energies. 2020;13(22):5989. 10.3390/en13225989.Search in Google Scholar
[9] Li S, Wu S, Xiang S, Zhang Y, Guerrero JM, Vasquez JC. Research on synchronverter-based regenerative braking energy feedback system of urban rail transit. Energies. 2020;13(17):4418. 10.3390/en13174418.Search in Google Scholar
[10] Mingpruk N, Mongkoldee K, Homjan J, Panpean C. Utilisation of solar rooftops for energy reduction: A case study for Airport Rail Link. In 2023 International Electrical Engineering Congress (iEECON); 2023. p. 193–7.10.1109/iEECON56657.2023.10127021Search in Google Scholar
[11] Alnuman H. Modelling a DC electric railway system and determining the optimal location of wayside energy storage systems for enhancing energy efficiency and energy management. Energies. 2024;17(12):2825. 10.3390/en17122825.Search in Google Scholar
[12] O’Rourke CJ, Qasim MM, Overlin MR, Kirtley JL. A geometric interpretation of reference frames and transformations: dq0, Clarke, and Park. IEEE Trans Energy Convers. 2019;34(4):2070–83.10.1109/TEC.2019.2941175Search in Google Scholar
[13] Pakdeeto J, Areerak K-N, Areerak K-L. Modelling and stability analysis of AC-DC power systems feeding a speed controlled DC motor. J Electr Eng & Technol. 2018;13(4):1566–77.Search in Google Scholar
[14] Pakdeeto J, Thanommuang A, Areerak K, Areerak K. Averaged model of DCMGs with PV arrays for traction substation in heavy rail systems. Suranaree J Sci TechnolArticle. 2023;30(6):010265-1.10.55766/sujst-2023-06-e02497Search in Google Scholar
[15] Emadi A. Modeling of power electronic loads in AC distribution systems using the generalized state-space averaging method. IEEE Trans Ind Electron. 2004;51(5):992–1000.10.1109/TIE.2004.834950Search in Google Scholar
[16] Emadi A. Modelling and analysis of multi-converter DC power electronic systems using the generalized state space averaging method. In Industrial Electronics Society, 2001. IECON ‘01. The 27th Annual Conference of the IEEE. Vol. 2, 2001. p. 1001–7.10.1109/IECON.2001.975908Search in Google Scholar
[17] Nise NS. Control systems engineering. Hoboken: J. Wiley; 2011.Search in Google Scholar
[18] Pakdeeto J, Thanommuang A, Areerak K. The DC voltage controller design of traction substation in heavy rail systems. In 2024 12th International Electrical Engineering Congress (iEECON); 2024. p. 1–4.10.1109/iEECON60677.2024.10537888Search in Google Scholar
[19] Mohamed SA, Abd El Sattar M. A comparative study of P&O and INC maximum power point tracking techniques for grid-connected PV systems. SN Appl Sci. 2019;1(2):174. 01/22 2019.10.1007/s42452-018-0134-4Search in Google Scholar
[20] Salman S, Ai X, Wu Z. Design of a P-&-O algorithm based MPPT charge controller for a stand-alone 200W PV system. Prot Control Mod Power Syst. 2018;3(1):25. 08/17 2018.10.1186/s41601-018-0099-8Search in Google Scholar
[21] Abdelsalam AK, Massoud AM, Ahmed S, Enjeti PN. High-performance adaptive perturb and observe MPPT technique for photovoltaic-based microgrids. IEEE Trans Power Electron. 2011;26(4):1010–21.10.1109/TPEL.2011.2106221Search in Google Scholar
[22] Poon JJ, Kinsy MA, Pallo NA, Devadas S, Celanovic IL. Hardware-in-the-loop testing for electric vehicle drive applications. In 2012 Twenty-Seventh Annual IEEE Applied Power Electronics Conference and Exposition (APEC); 2012. p. 2576–82.10.1109/APEC.2012.6166186Search in Google Scholar
[23] Payakkamas P, Bangviwat A, Menke C, Trinuruk P. Price determination of electricity supply in Thailand based on externalities, wheeling charges, and losses. Sci Technol Asia. 2017;22:3.Search in Google Scholar
© 2025 the author(s), published by De Gruyter
This work is licensed under the Creative Commons Attribution 4.0 International License.
Articles in the same Issue
- Research Article
- Modification of polymers to synthesize thermo-salt-resistant stabilizers of drilling fluids
- Study of the electronic stopping power of proton in different materials according to the Bohr and Bethe theories
- AI-driven UAV system for autonomous vehicle tracking and license plate recognition
- Enhancement of the output power of a small horizontal axis wind turbine based on the optimization approach
- Design of a vertically stacked double Luneburg lens-based beam-scanning antenna at 60 GHz
- Synergistic effect of nano-silica, steel slag, and waste glass on the microstructure, electrical resistivity, and strength of ultra-high-performance concrete
- Expert evaluation of attachments (caps) for orthopaedic equipment dedicated to pedestrian road users
- Performance and rheological characteristics of hot mix asphalt modified with melamine nanopowder polymer
- Second-order design of GNSS networks with different constraints using particle swarm optimization and genetic algorithms
- Impact of including a slab effect into a 2D RC frame on the seismic fragility assessment: A comparative study
- Analytical and numerical analysis of heat transfer from radial extended surface
- Comprehensive investigation of corrosion resistance of magnesium–titanium, aluminum, and aluminum–vanadium alloys in dilute electrolytes under zero-applied potential conditions
- Performance analysis of a novel design of an engine piston for a single cylinder
- Modeling performance of different sustainable self-compacting concrete pavement types utilizing various sample geometries
- The behavior of minors and road safety – case study of Poland
- The role of universities in efforts to increase the added value of recycled bucket tooth products through product design methods
- Adopting activated carbons on the PET depolymerization for purifying r-TPA
- Urban transportation challenges: Analysis and the mitigation strategies for road accidents, noise pollution and environmental impacts
- Enhancing the wear resistance and coefficient of friction of composite marine journal bearings utilizing nano-WC particles
- Sustainable bio-nanocomposite from lignocellulose nanofibers and HDPE for knee biomechanics: A tribological and mechanical properties study
- Effects of staggered transverse zigzag baffles and Al2O3–Cu hybrid nanofluid flow in a channel on thermofluid flow characteristics
- Mathematical modelling of Darcy–Forchheimer MHD Williamson nanofluid flow above a stretching/shrinking surface with slip conditions
- Energy efficiency and length modification of stilling basins with variable Baffle and chute block designs: A case study of the Fewa hydroelectric project
- Renewable-integrated power conversion architecture for urban heavy rail systems using bidirectional VSC and MPPT-controlled PV arrays as an auxiliary power source
- Review Articles
- A modified adhesion evaluation method between asphalt and aggregate based on a pull off test and image processing
- Architectural practice process and artificial intelligence – an evolving practice
- Special Issue: 51st KKBN - Part II
- The influence of storing mineral wool on its thermal conductivity in an open space
- Use of nondestructive test methods to determine the thickness and compressive strength of unilaterally accessible concrete components of building
- Use of modeling, BIM technology, and virtual reality in nondestructive testing and inventory, using the example of the Trzonolinowiec
- Tunable terahertz metasurface based on a modified Jerusalem cross for thin dielectric film evaluation
- Integration of SEM and acoustic emission methods in non-destructive evaluation of fiber–cement boards exposed to high temperatures
- Non-destructive method of characterizing nitrided layers in the 42CrMo4 steel using the amplitude-frequency technique of eddy currents
- Evaluation of braze welded joints using the ultrasonic method
- Analysis of the potential use of the passive magnetic method for detecting defects in welded joints made of X2CrNiMo17-12-2 steel
- Analysis of the possibility of applying a residual magnetic field for lack of fusion detection in welded joints of S235JR steel
- Eddy current methodology in the non-direct measurement of martensite during plastic deformation of SS316L
- Methodology for diagnosing hydraulic oil in production machines with the additional use of microfiltration
- Special Issue: IETAS 2024 - Part II
- Enhancing communication with elderly and stroke patients based on sign-gesture translation via audio-visual avatars
- Optimizing wireless charging for electric vehicles via a novel coil design and artificial intelligence techniques
- Evaluation of moisture damage for warm mix asphalt (WMA) containing reclaimed asphalt pavement (RAP)
- Comparative CFD case study on forced convection: Analysis of constant vs variable air properties in channel flow
- Evaluating sustainable indicators for urban street network: Al-Najaf network as a case study
- Node failure in self-organized sensor networks
- Comprehensive assessment of side friction impacts on urban traffic flow: A case study of Hilla City, Iraq
- Design a system to transfer alternating electric current using six channels of laser as an embedding and transmitting source
- Security and surveillance application in 3D modeling of a smart city: Kirkuk city as a case study
- Modified biochar derived from sewage sludge for purification of lead-contaminated water
- Special Issue: AESMT-7 - Part II
- Experimental study on behavior of hybrid columns by using SIFCON under eccentric load