Thermogravimetric (TG/DTG) characterization of cold-pressed oil blends and Saccharomyces cerevisiae-based microcapsules obtained with them
-
Ewa Ostrowska-Ligęza
 ,
Wojciech Cichocki
,
Hanna Maria Baranowska
und
Przemysław Łukasz Kowalczewski
,
Wojciech Cichocki
,
Hanna Maria Baranowska
und
Przemysław Łukasz Kowalczewski


Abstract
The aim of this study was to develop yeast-based microcapsules (YBMCs) containing vegetable oil blends with n3/n6 fatty acids in a ratio of 5:1. The oil blends, as well as YBMCs with these oils, were analyzed in nitrogen and oxygen. The shape and course of the TG and DTG curves were observed for yeast cells with all types of oil blends. No differences were observed in shape because of the microencapsulation curves with all oil blends between YMBCs prepared using native and autolyzed yeast. The results show that the yeast cells could be used as efficient microcarriers for the encapsulation of cold-pressed oils in order to provide thermal stable ingredients for the food industry.
1 Introduction
A properly balanced diet should contain an adequate amount of fat [1]. However, it is worth remembering that fats and oils of various origins differ significantly not only in their nutritional values but also in their technological properties [2,3]. The presence of various fatty acids and also many other phytocomponents present in vegetable oils, such as vitamins, phenolic compounds, and dyes, can limit oxidative changes in unsaturated fatty acids during oil storage [4,5,6]. However, despite the presence of the above-mentioned compounds in cold-pressed oils, many of them are not recommended for use in dishes prepared at high temperatures [7]. Changes in oils during heating not only reduce the quality and nutritional value of oils but may also lead to the formation of compounds that are potentially harmful to our health [8,9].
In the context of changes in the eating habits of many consumers and limiting the consumption of animal products, especially fish, it also seems crucial to ensure access to appropriate quality oils with a favorable n3/n6 fatty acid ratio [10]. The deficiency of n3 acids in plant-based diets is particularly important, and it is necessary to create products that are a good source of them [11]. Blends of vegetable oils in the right proportions may have nutritionally beneficial properties. Our previous research has shown that it is possible to compose oil blends from various vegetable oils that will be characterized by an appropriate and recommended nutritional point of view with a n6/n3 ratio of 5:1 [12,13]. Some of the raw materials used for grinding the blends are also characterized by very high variability of technological properties, which is why three compositions of oil blends were selected that have an economic justification for their use. Unfortunately, these oil blends may also be characterized by different, sometimes low, stability during thermal processing; therefore, it seems advisable to use different methods of protecting the oils against the influence of external factors. Among many methods described in the literature, immobilization in biopolymers or yeast cells is most often suggested [14,15,16,17]. The microcapsules prepared in this way are characterized by higher thermal stability and slow down the degradation changes in the oils immobilized inside. The use of thermogravimetric analysis (TGA) allows for quick and precise observation of thermal changes over a wide temperature range [18,19]. Unlike traditional methods of heating the material and analyzing it under specific conditions, TGA allows for a complete analysis of the entire temperature range and changes occurring therein.
Taking into account the above, the yeast-based microcapsules (YBMCs) containing vegetable oil blends developed using the patented method [20] were analyzed in detail in the context of changes during heating using the TGA method.
2 Materials and methods
2.1 Sample materials
The study examined three oil blends made from cold-pressed oils, such as rapeseed, black cumin, wheat germ, evening primrose, and camelina, along with refined rice bran oil. These oils were obtained directly from the manufacturers, with the cold-pressed oils sourced from SemCo (Śmiłowo, Poland) and the rice bran oil from Kasisuri Group (Bangkok, Thailand). The blends were created by mixing the individual oils according to the designated ratios, as shown in Table 1.
Composition of oil blends
| Code | Type of oil | Share (%) | ||||
|---|---|---|---|---|---|---|
| RBWg | Rapeseed oil | Black cumin oil | Wheat germ oil | 50 | 30 | 20 |
| REp | Rapeseed oil | Evening primrose oil | 65 | 35 | — | |
| CRb | Camelina oil | Rice bran oil | 12 | 88 | — | |
2.2 YBMC preparation
To eliminate any residual culture medium and cell debris, Saccharomyces cerevisiae baker’s yeast was subjected to a triple rinse with 0.01 M phosphate buffer in a 5:1 buffer/yeast ratio, followed by centrifugation to separate the biomass. After each rinse, the buffer was decanted, and the yeast was frozen, freeze-dried, and ground. The resulting native yeast (NY) was used for further encapsulation. To enhance the yeast’s capacity for encapsulation, the washed NY biomass was subjected to autolysis by adjusting the pH to 5.5 with 0.5 N HCl and incubating at 55°C for 48 h with stirring. After rinsing and freeze-drying, the autolyzed yeast (AY) was used for encapsulation. The microencapsulation of oil blends in yeast biomass followed a procedure based on our methodology, outlined in a Polish patent application [20] and described in detail previously [21]. This involved preparing a pre-emulsion by homogenizing a water-emulsifier solution with the oil blend, followed by ultrasonic homogenization to form the final emulsion. The mixture was then incubated with agitation, centrifuged to separate the biomass, washed, and freeze-dried. The resulting YBMCs were stored for TGA at −20°C.
2.3 TGA
The analyses were performed using a Discovery TGA (TA Instruments, New Castle, DE, USA [22]. Briefly, measurements were made under nitrogen and oxygen at a flow rate of 25 mL·min−1. Samples (7–8 mg) were placed in platinum containers. The range of operation was from 50 to 1,000°C, and measurements were made with a heating rate of 10°C·min−1 [23]. TGA curves were obtained for temperature dependence on mass loss, and the first derivative thermogravimetric (DTG) was calculated.
3 Results and discussion
The results for the research of REp (rapeseed oil and evening primrose oil) oil blend, RBWg (rapeseed oil, black cumin oil, and wheat germ oil) oil blend, and CRb (camelina oil and rice bran oil) oil blend in an atmosphere of nitrogen are shown in Figure 1a–c.
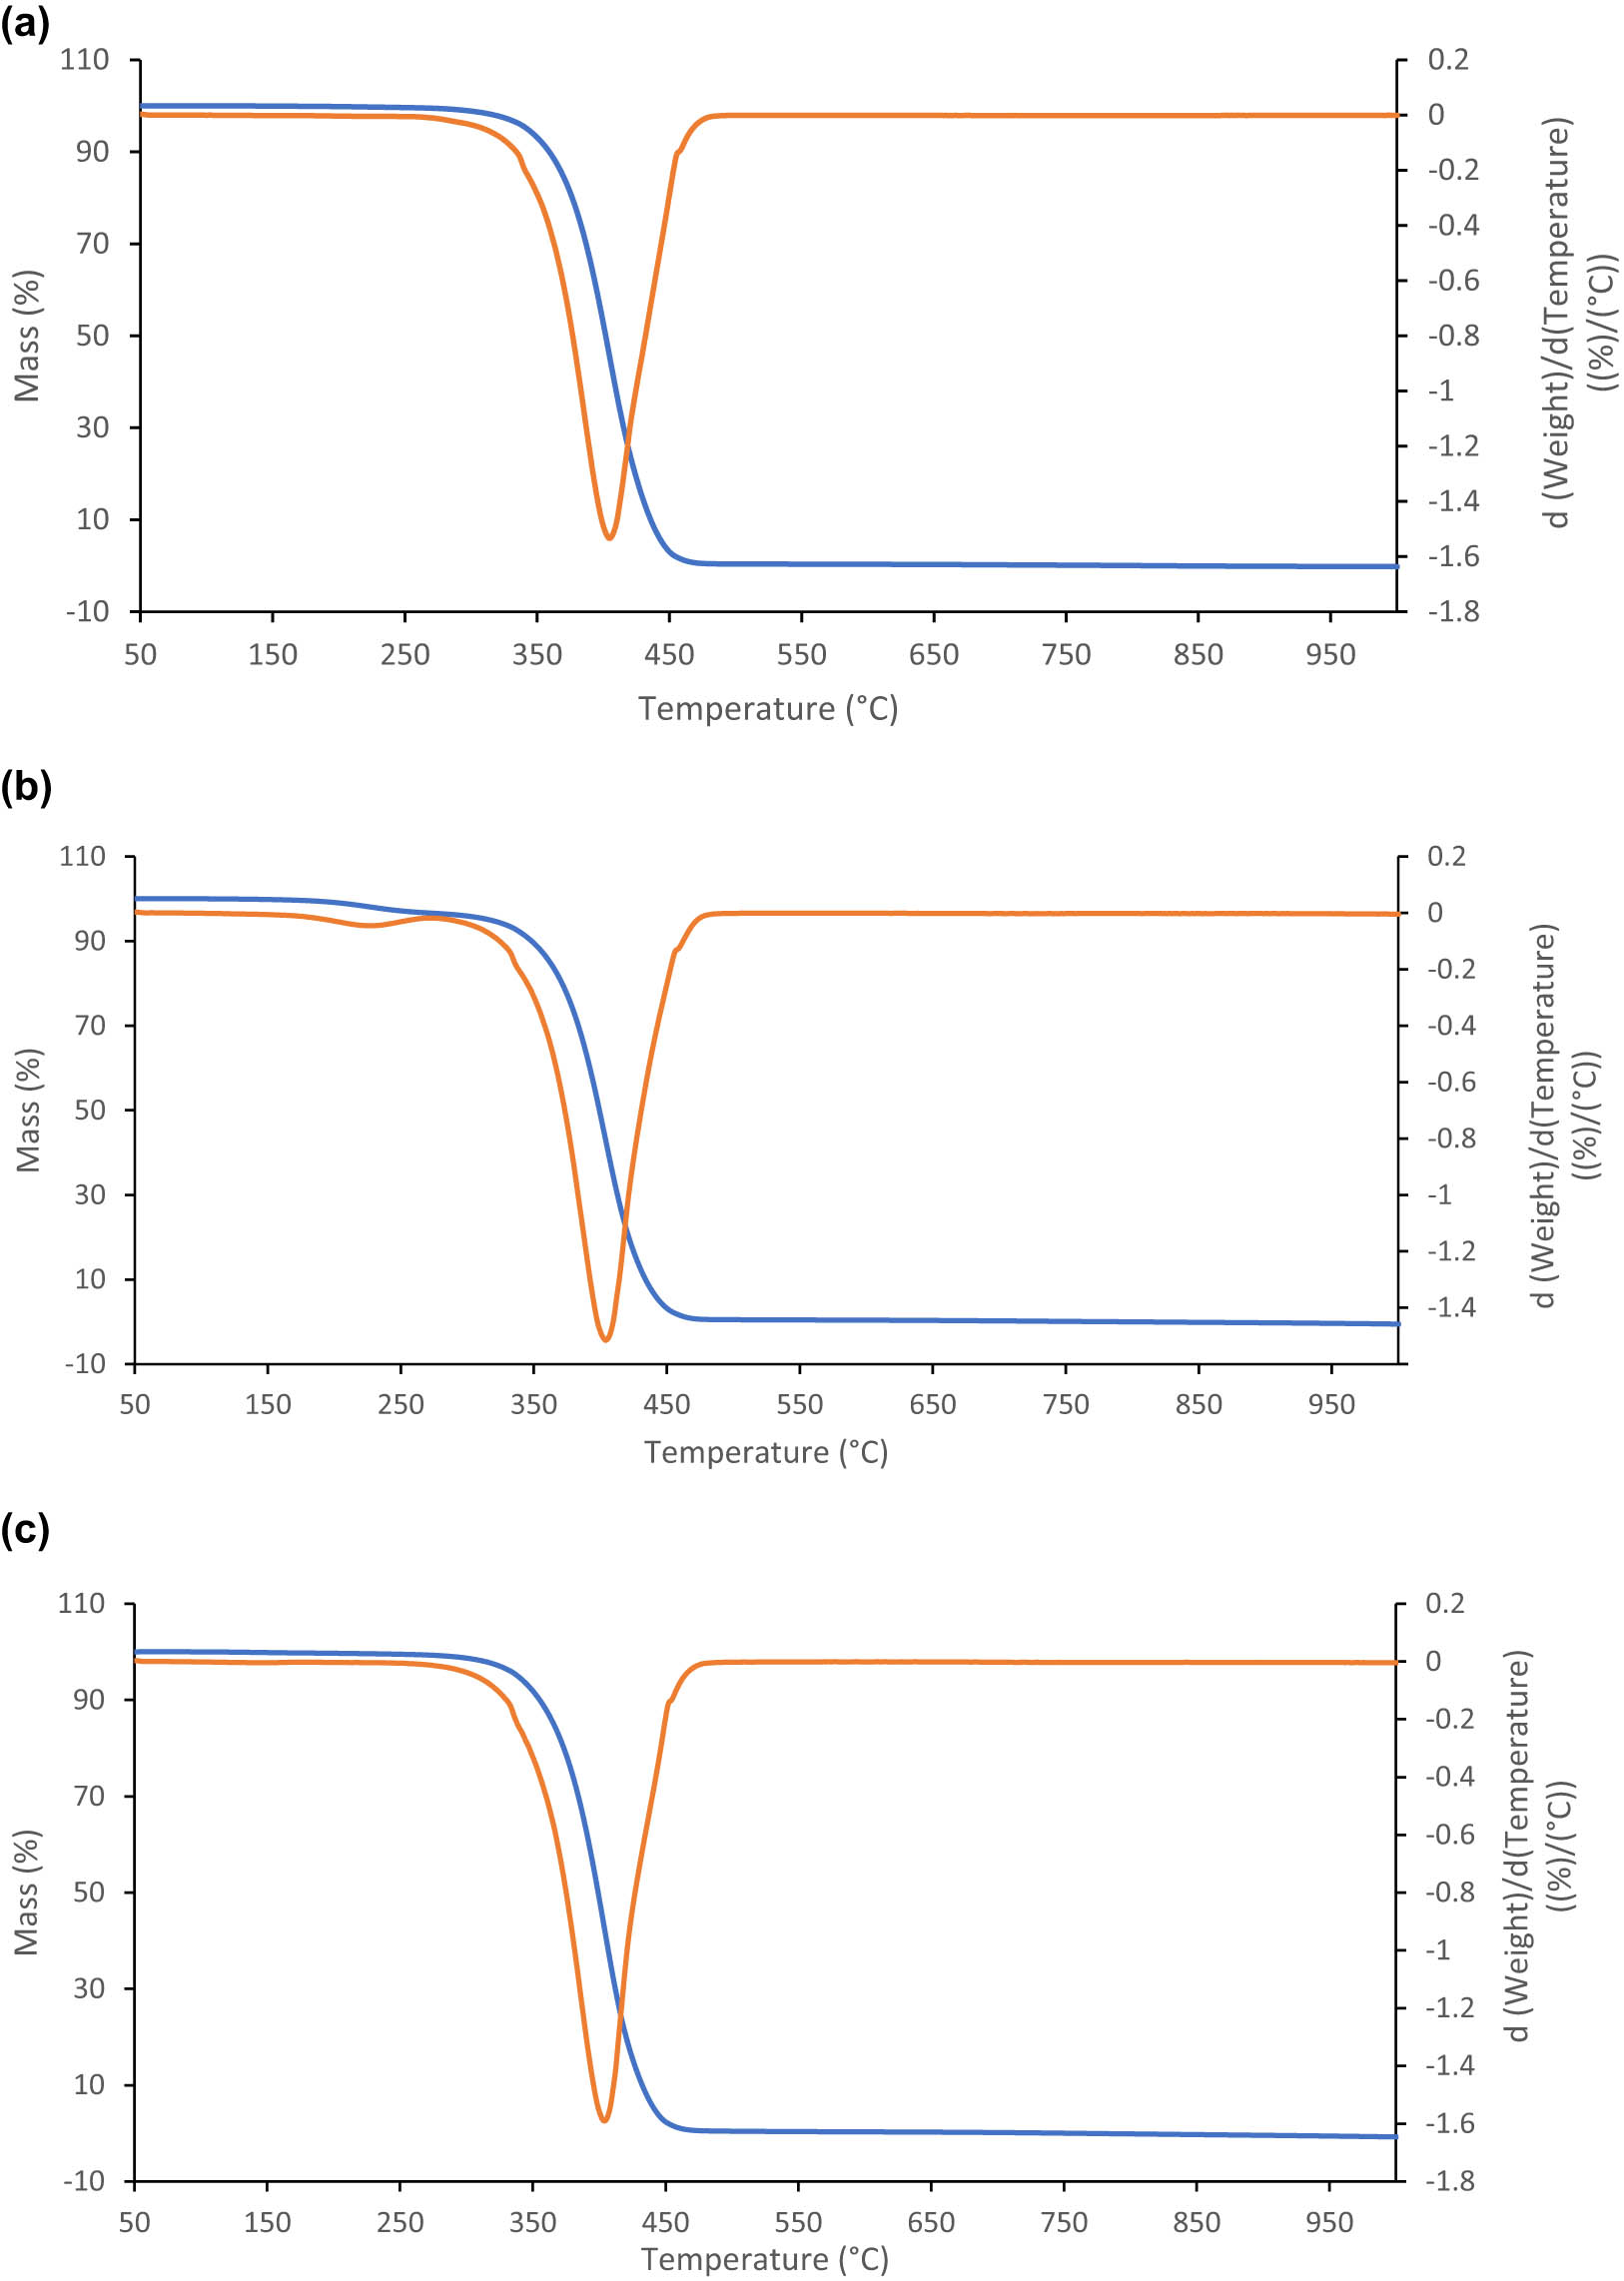
(a) TG and DTG curves in the nitrogen of the REp oil blend. The blue line shows the TG curve, and the orange line shows its first derivative. (b) TG and DTG curves in the nitrogen of the RBWg oil blend. The blue line shows the TG curve, and the orange line shows its first derivative. (c) TG and DTG curves in the nitrogen of the CRb oil blend. The blue line shows the TG curve, and the orange line shows its first derivative.
The TG and DTG curves were characterized by a similar, mild course in the nitrogen atmosphere for all types of oil blends. The thermal decomposition occurred over the temperature range of 267.88–497.96°C and corresponded to the mass loss of 100% for all oil blends. Nitrogen is an inert gas and allows analysis of the thermal resistance of the studied oil blends. The maximum temperature peaks were observed at 406.68, 404.02, and 403.91°C for REp, RBWg, and CRb oil blends, respectively.
Figure 2a–c shows the TG and DTG curves of REp, RBWg, and CRb oil blends in an atmosphere of pure oxygen.
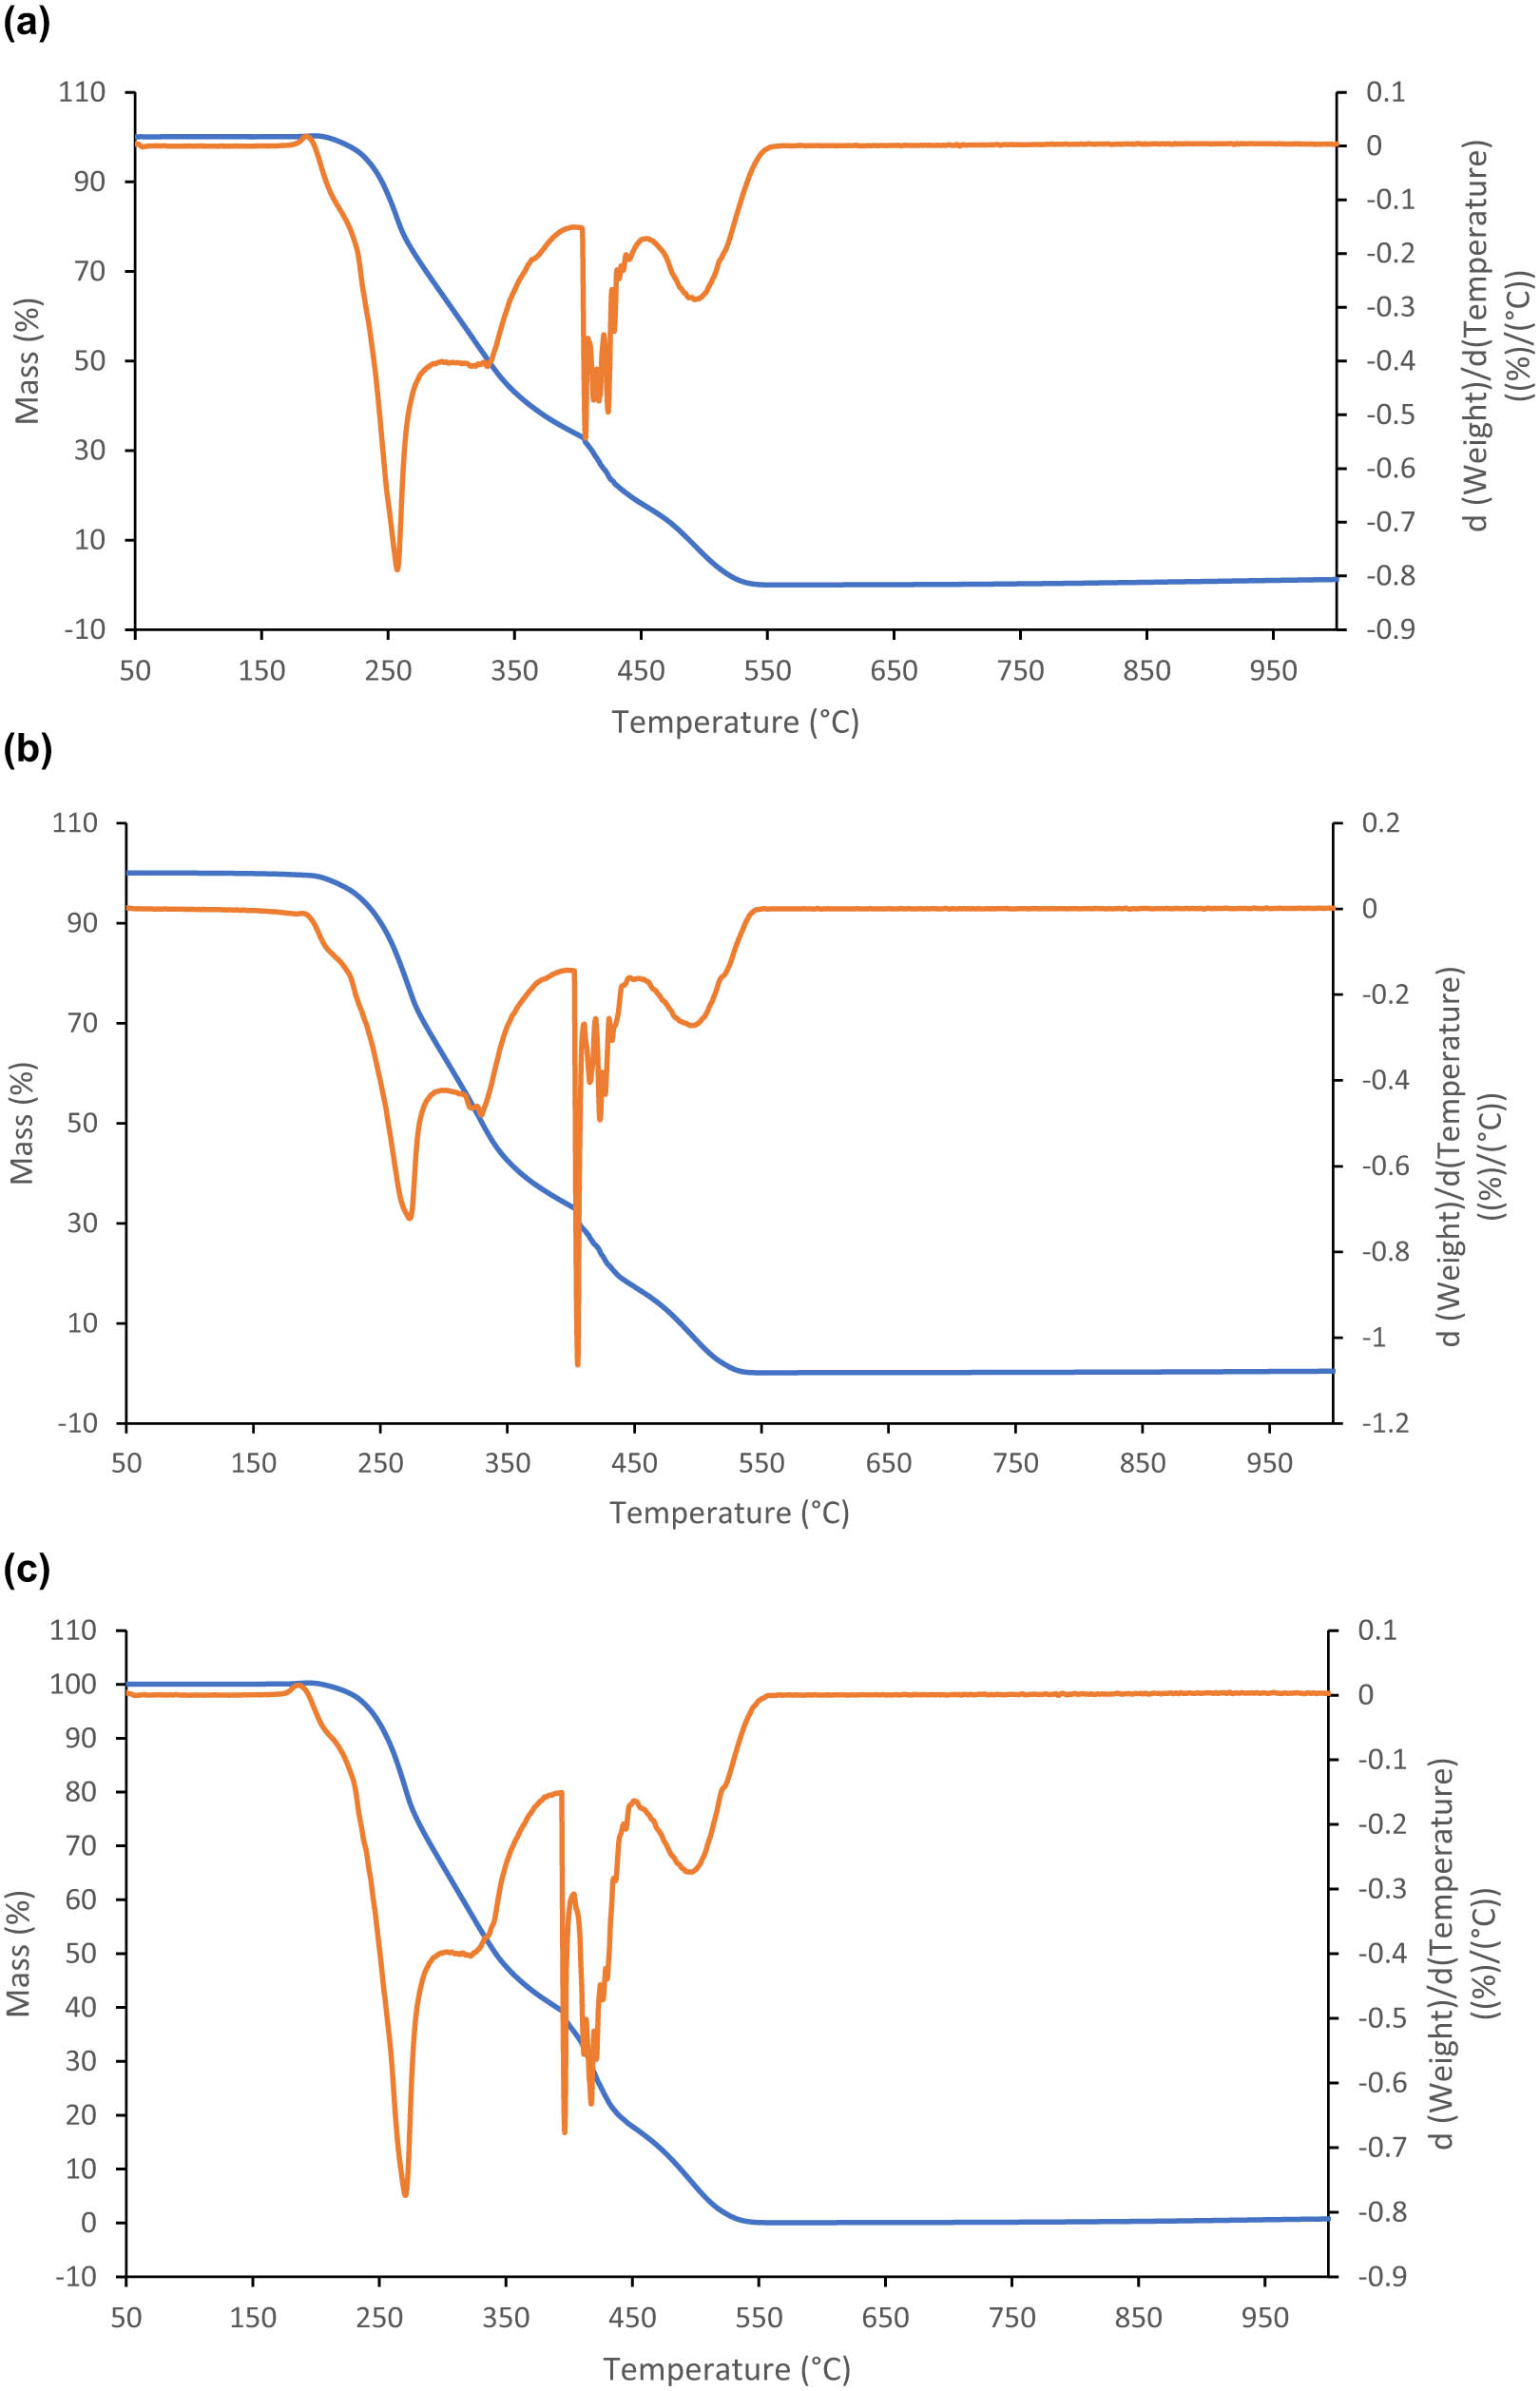
(a) TG and DTG curves in the oxygen of the REp oil blend. The blue line shows the TG curve, and the orange line shows its first derivative. (b) TG and DTG curves in the oxygen of the RBWg oil blend. The blue line shows the TG curve, and the orange line shows its first derivative. (c) TG and DTG curves in the nitrogen of the CRb oil blend. The blue line shows the TG curve, and the orange line shows its first derivative.
The mixture of rapeseed and evening primrose oils was thermally stable up to a temperature of 192.04°C, as shown by the TG curve in Figure 2a. The first stage of decomposition of the REp oil blend occurred within the temperature range from 193.56 to 402.76°C, and mass loss was 65.71%. In this range, the maximum loss occurred at 257.23°C. The sharpness of the obtained phase transition was characterized by one distinct peak and a mild peak (Figure 2a). de Souza et al. [24] found that the oxidation of polyunsaturated fatty acids was responsible for this transformation. Polyunsaturated fatty acids were the main component of triacylglycerols in this oil blend [21].
The RBWg and CRb oil blends were characterized by similar values of ranges of transitions – from 196.47 to 402.79°C and from 192.60 to 393.51°C, respectively. Mass loss for the transitions obtained 65.24 and 59.24%, respectively. The maximum temperatures of peaks for the first transition were obtained for the RBWg oil blend at 273.30°C and for the CRb oil blend at 270.84°C (Figure 2b and c).
Szabo et al. [25] and de Souza et al. [24] described the second stage of decomposition of edible oils and fats. The second stage of decomposition of edible oils and fats is the decomposition of monounsaturated fatty acids such as oleic acid. The transition was obtained for all oil blends. The temperature ranges for oil blends were obtained from 403.68 to 464.41°C for the REp oil blend (Figure 2a), from 403.68 to 464.11°C for the RBWg oil blend (Figure 2b), and from 394.26 to 446.41°C for the CRb oil blend (Figure 2c). The maximum temperature peaks for the second transition were obtained for the REp oil blend at 406.07°C, for the RBWg oil blend at 405.35°C, and for the CRb oil blend at 398.50°C (Figure 2a–c). In the second stage, mass loss for the REp oil blend was characterized by a value of 17.18%; for the RBWg oil blend, it was 17.82%, and for the CRb oil blend, it was 23.93% (Figure 2a–c). The peaks were characterized by very sharp courses, which could indicate a very violent oxidation reaction.
The peaks of the third stage were characterized by mild course and low intensity. The temperature ranges for oil blends were obtained from 465.78 to 554.93°C for the REp oil blend (Figure 2a), from 469.24 to 549.90°C for the RBWg oil blend (Figure 2b), and from 466.19 to 560.82°C for the CRb oil blend (Figure 2c). The maximum temperature peaks for the second transition were obtained for the REp oil blend at 495.88°C, for the RBWg oil blend at 497.56°C, and for the CRb oil blend at 497.18°C (Figure 2a–c). In the third stage, the mass loss for the REp oil blend was characterized by a value of 17.38%; for the RBWg oil blend, it was– 16.83%, and for the CRb oil blend, it was 16.36% (Figure 2a–c).
The third phase represents the decomposition of saturated fatty acids and other substances formed during the polymerization of the fatty acid degradation products formed during the earlier stage. The products of these reactions can themselves react to produce cyclic monomers, dimers, and polymers [26,27,28].
The results of the research of native (NY) and autolyzed (AY) yeasts in an atmosphere of nitrogen and oxygen are shown in Figure 3a–d.
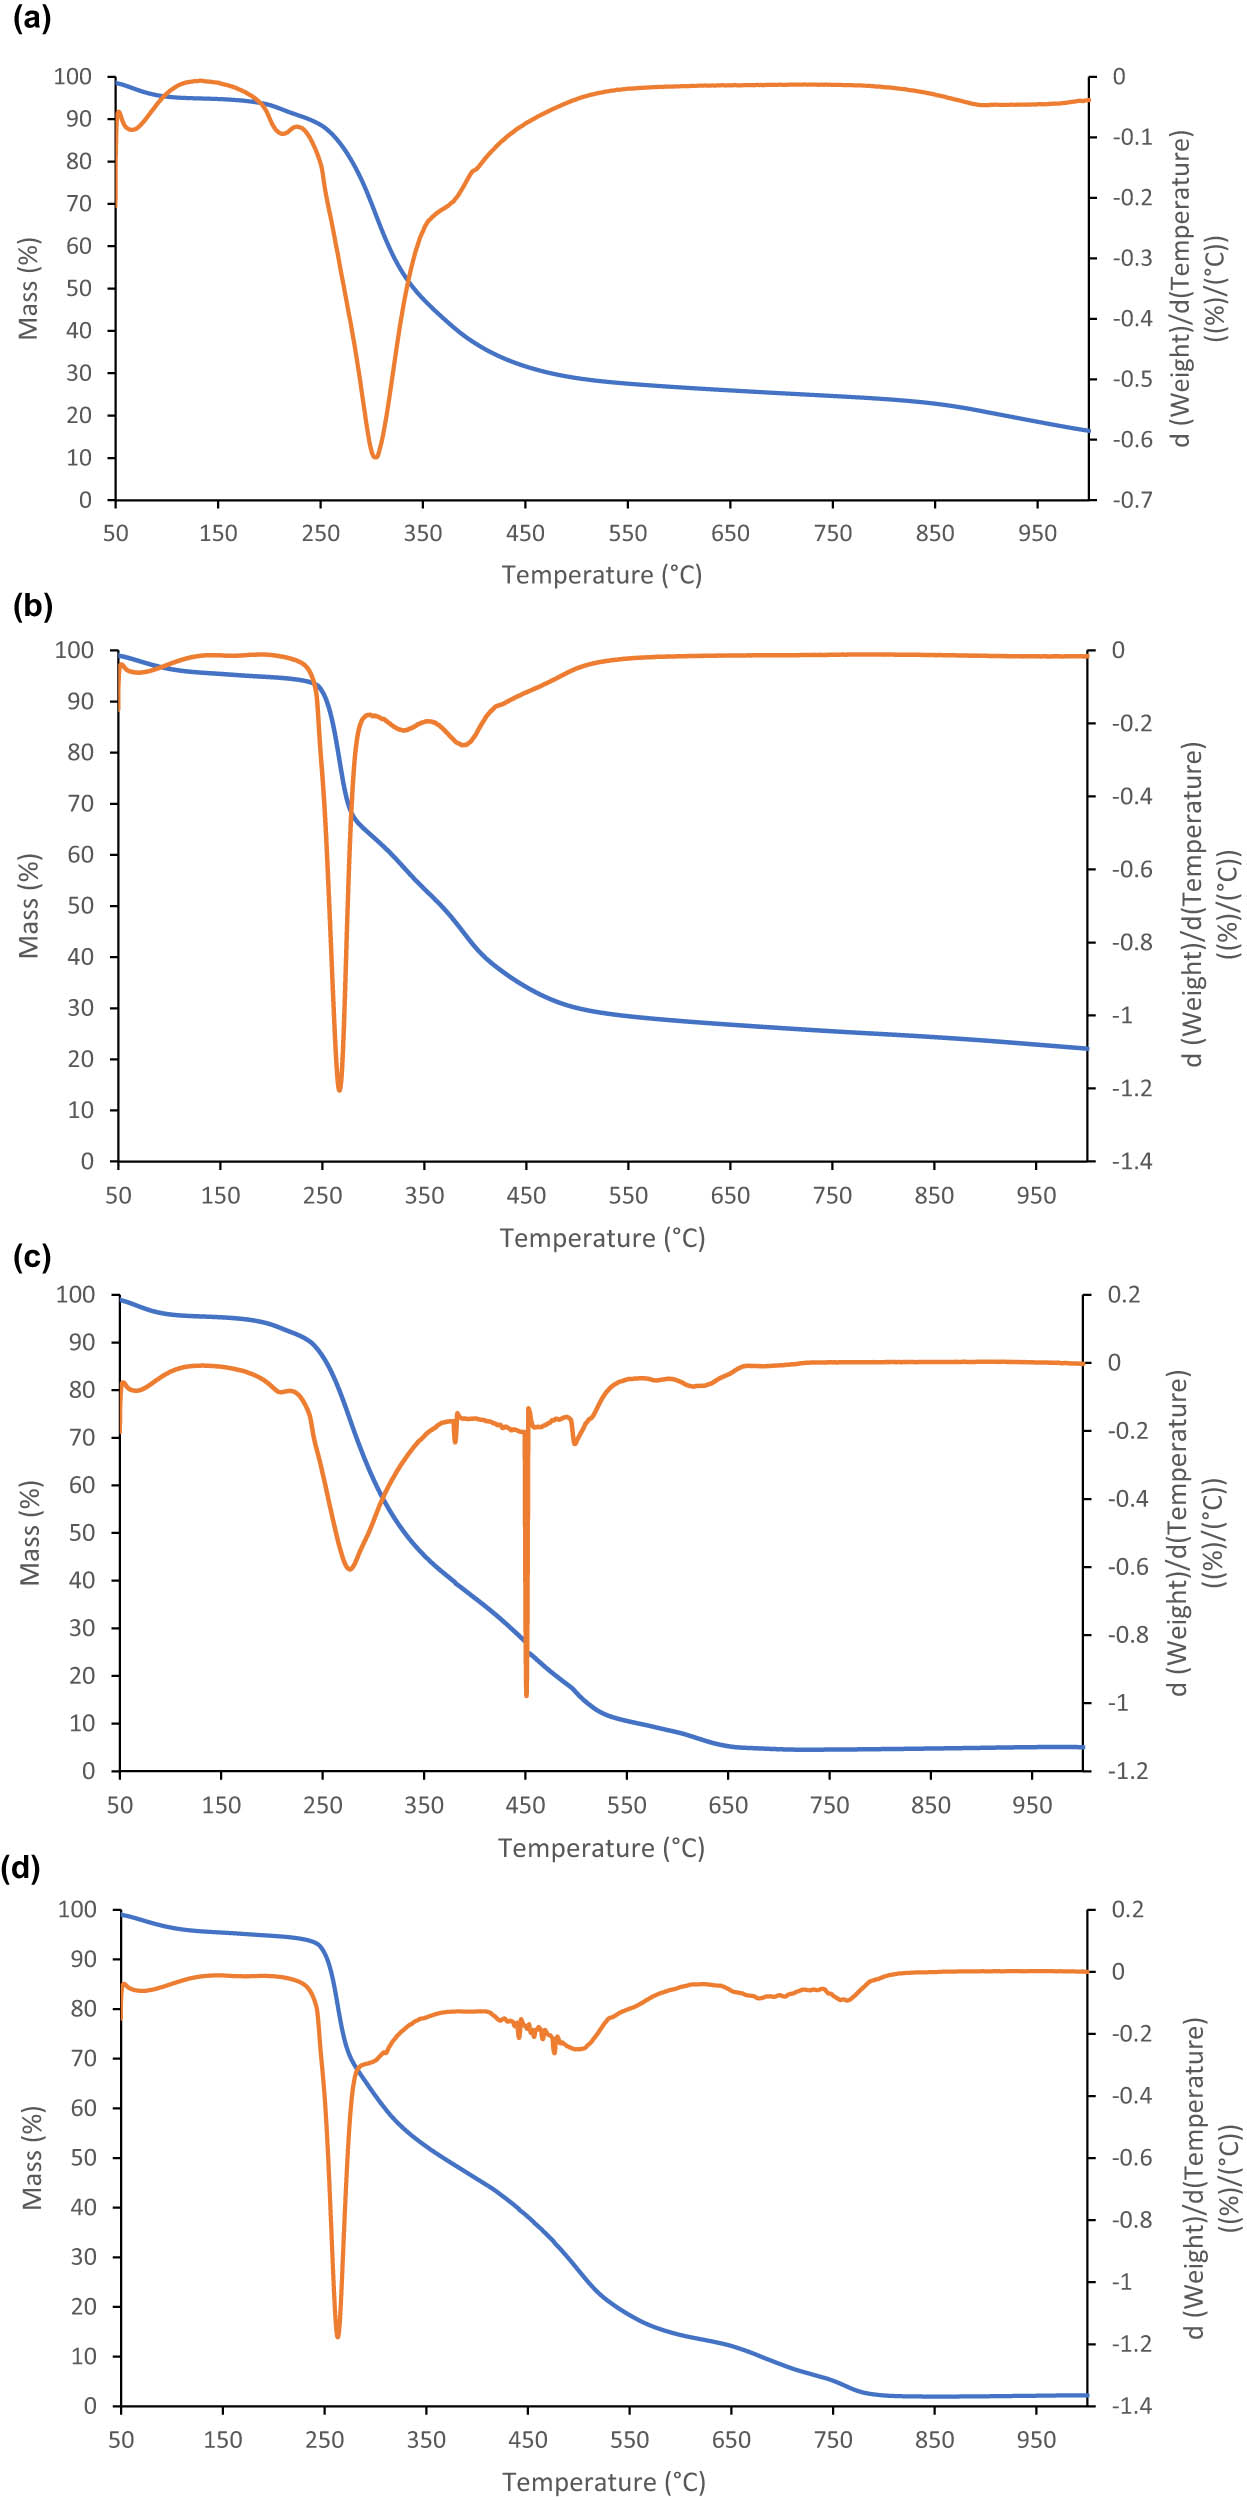
(a) TG and DTG curves in the nitrogen of NY. The blue line shows the TG curve, and the orange line shows its first derivative. (b) TG and DTG curves in the nitrogen of AY. The blue line shows the TG curve, and the orange line shows its first derivative. (c) TG and DTG curves in the oxygen of NY. The blue line shows the TG curve, and the orange line shows its first derivative. (d) TG and DTG curves in the oxygen of AY. The blue line shows the TG curve, and the orange line shows its first derivative.
The first mild peaks at maximum temperatures of 67.96°C (Figure 3a) and 73.44°C (Figure 3b) showed the loss of free water by yeast cells. Similar results were obtained by Alcázar et al. [29] by examining the water loss through yeast cells using thermogravimetry in an air atmosphere. The mass losses were characterized by values of 3.78% (NY) and 3.58% (AY). The distinct, high peak was obtained, as shown in Figure 3a for NY. The peak was characterized by two maximum temperatures: 210.74 and 304.51°C. The first maximum temperature illustrated the decomposition of low molecular weight carbohydrates. The second maximum temperature indicated the decomposition of complex carbohydrates [30,31,32]. The mass losses corresponding to these transformations were 3.79 and 66.11%, respectively. In Figure 3b, the observed peak obtained by AY was with two maximum temperatures: 266.80 and 329.81°C. This transformation corresponded to the decomposition of carbohydrates. Banerjee et al. [33] studied de-oiled yeast biomass by using thermogravimetry in a nitrogen atmosphere. They stated that the degradation of carbohydrates in the temperature range of 164–467°C. The mannan and glucan are the main building components of the yeast cell wall, which decompose at such high temperatures. The whole mass loss of these transformations obtained was 56.22% (Figure 3b). The third peak at a maximum temperature of 380.04°C indicated the presence of fat in the yeast cell and cell wall [33]. The mass loss of fat decomposition obtained was about 19.14%.
The TG and DTG curves for NY and AY in an atmosphere of oxygen are shown in Figure 3c and d. The thermal transitions of all yeast ingredients were characterized by more distinct courses.
On the DTG curves of the NY sample, four peaks were distinguished, indicating the thermal transitions of ingredients of yeast (Figure 3c). The mass loss of saccharide decomposition obtained was about 58.31%. The peak was characterized at a maximum temperature of 278.19°C. A similar thermal transition for AY observed was characterized by a peak with a maximum temperature of 263.06°C and mass loss of 48.81% (Figure 3d). The second transformation for NY was characterized by a very sharp and distinct peak with a maximum temperature of 451.04°C and mass loss of 14.53%. The third transformation for NY observed on the DTG curve was characterized by a sharp, small peak with a maximum temperature of 466.41°C and mass loss of 10.61%. These changes indicated the oxidation of yeast fat (Figure 3c). The course of fat oxidation for AY was milder. One broad peak characterized by several sharp peaks and a broad peak maximum temperature of 476.07°C was observed. The mass loss of fat decomposition obtained was about 32.58% (Figure 3d). The last thermal transitions for both types of yeast were characterized by mild, broad peaks with a maximum temperature of about 579.05°C (Figures 3c) and 763.93°C (Figure 3d). The mass losses corresponding to these transformations were 3.77 and 11.29%, respectively. Dassanayake et al. [34] studied the decomposition temperature of chitin and chitosan using thermogravimetry in a nitrogen atmosphere. Chitin in the cell wall of yeast degrades at a higher temperature than chitosan. The maximum decompositions of chitin and chitosan were reported to be around 391 and 300°C, respectively. The decomposition of these polysaccharides may occur at higher temperatures in an oxygen atmosphere.
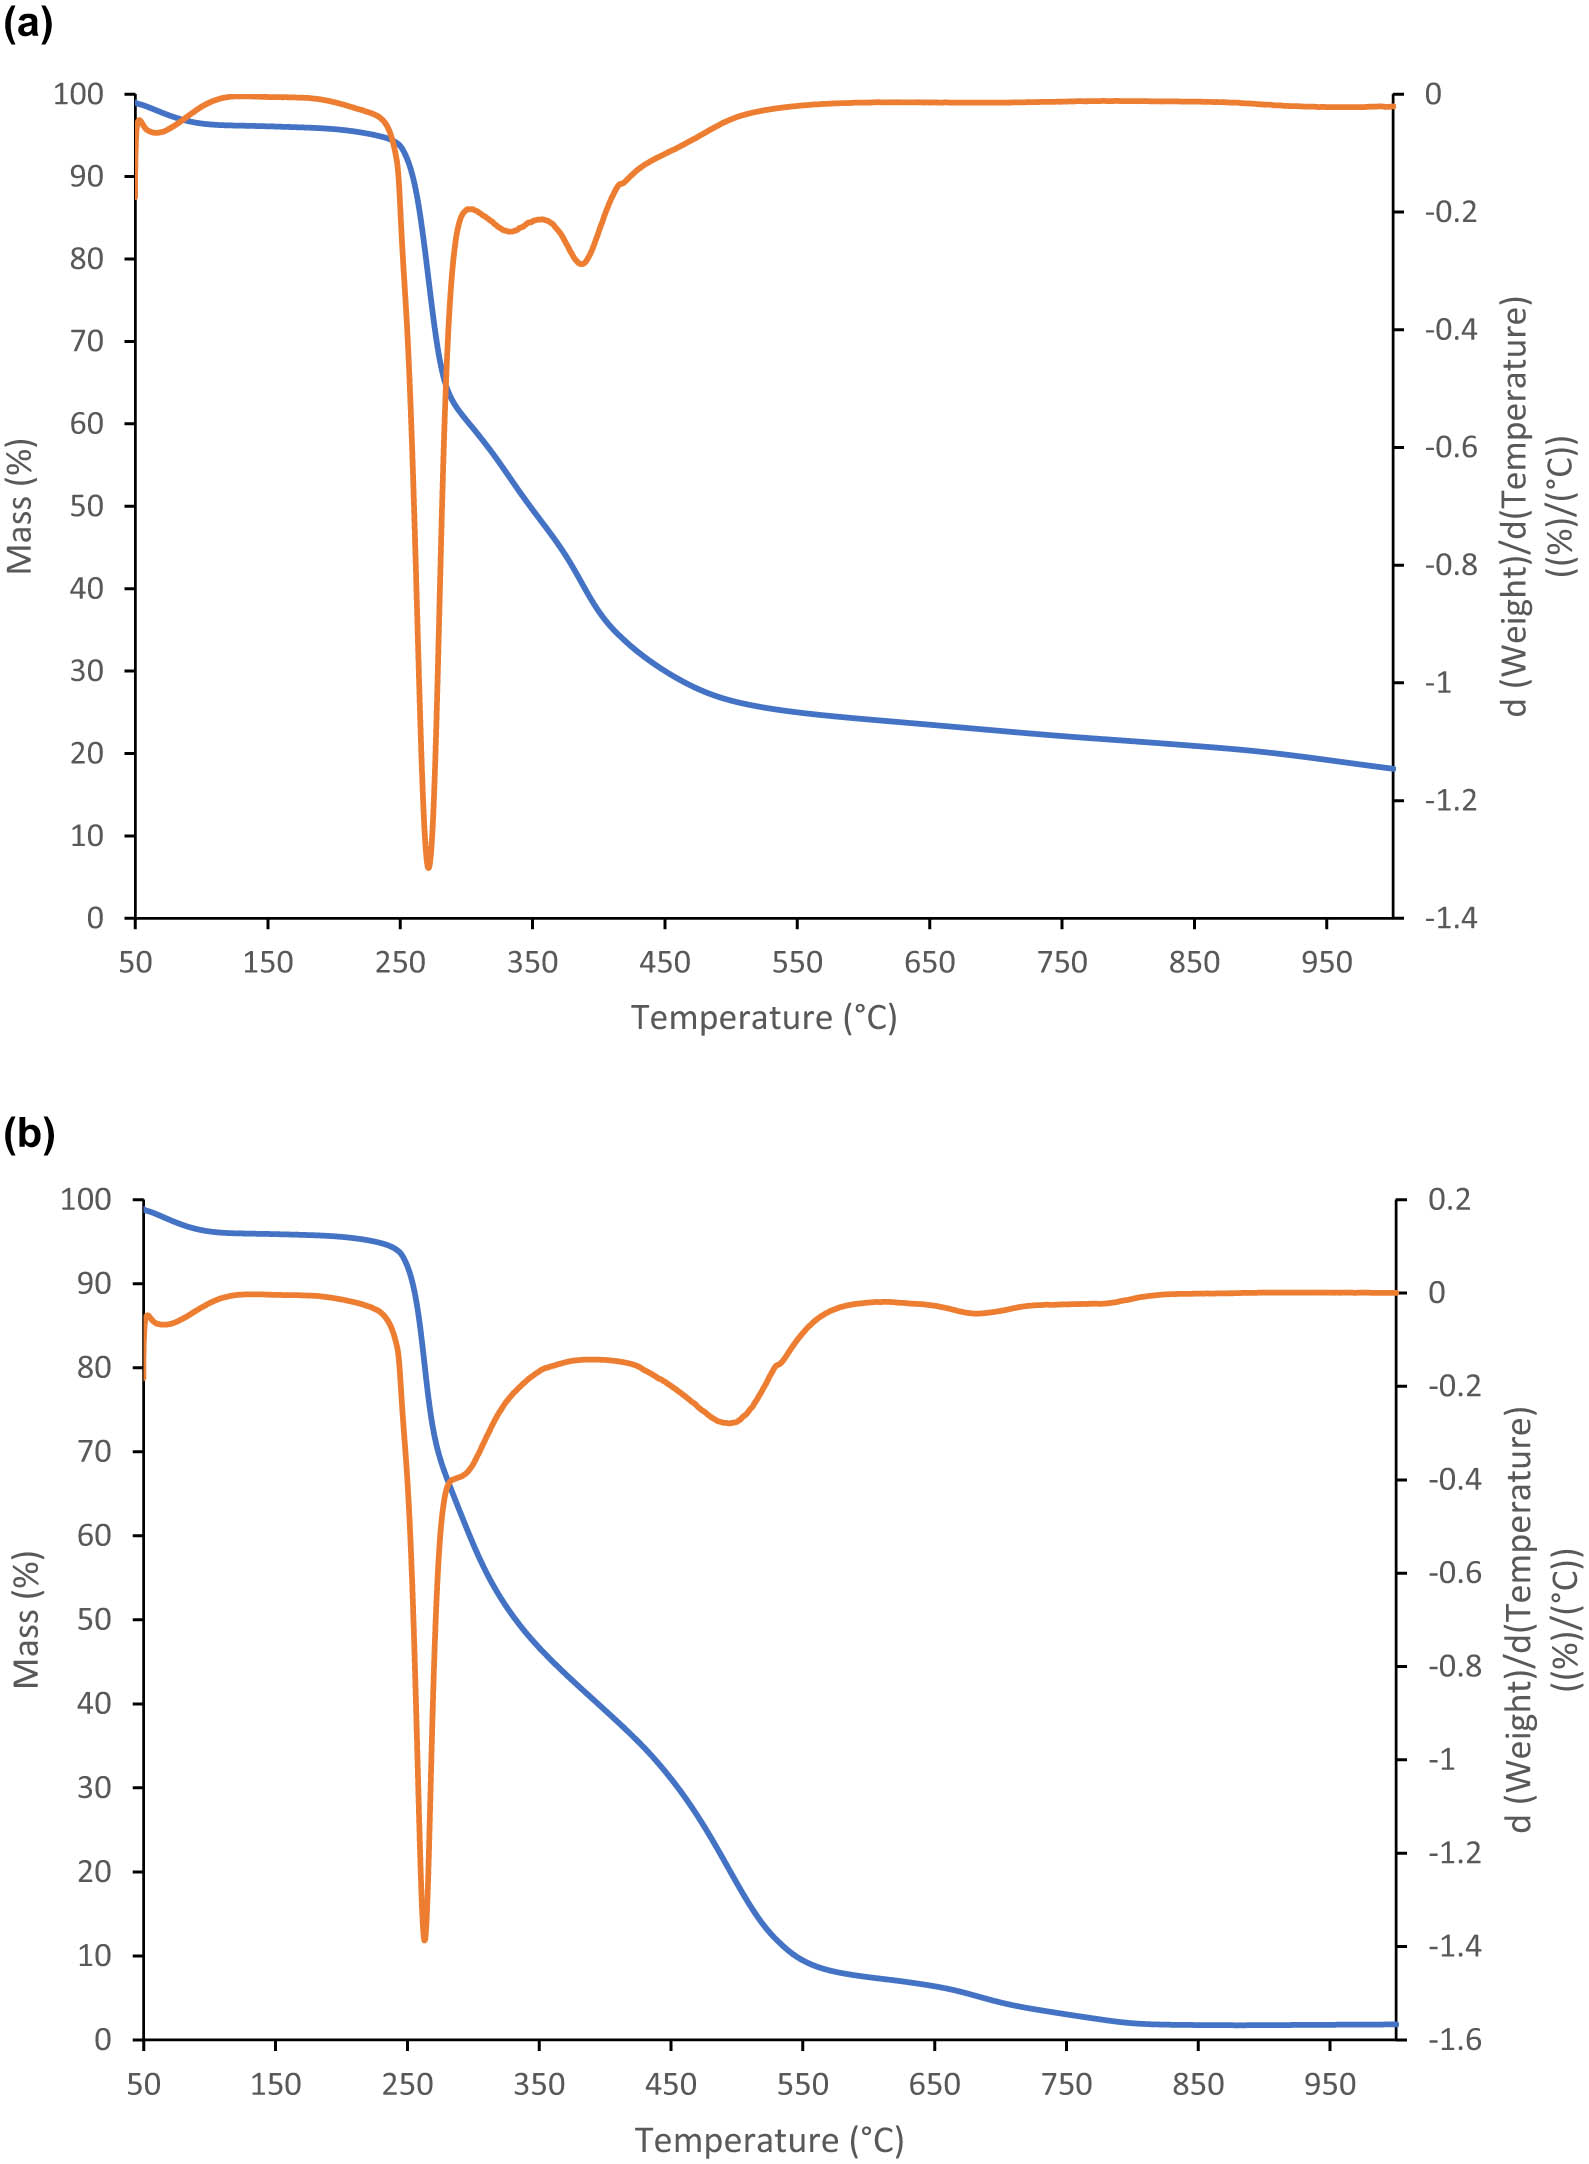
Figure 4a shows the TG and DTG curves in the nitrogen of microencapsulation of the oil blend (rapeseed oil and evening primrose oil) in NY.
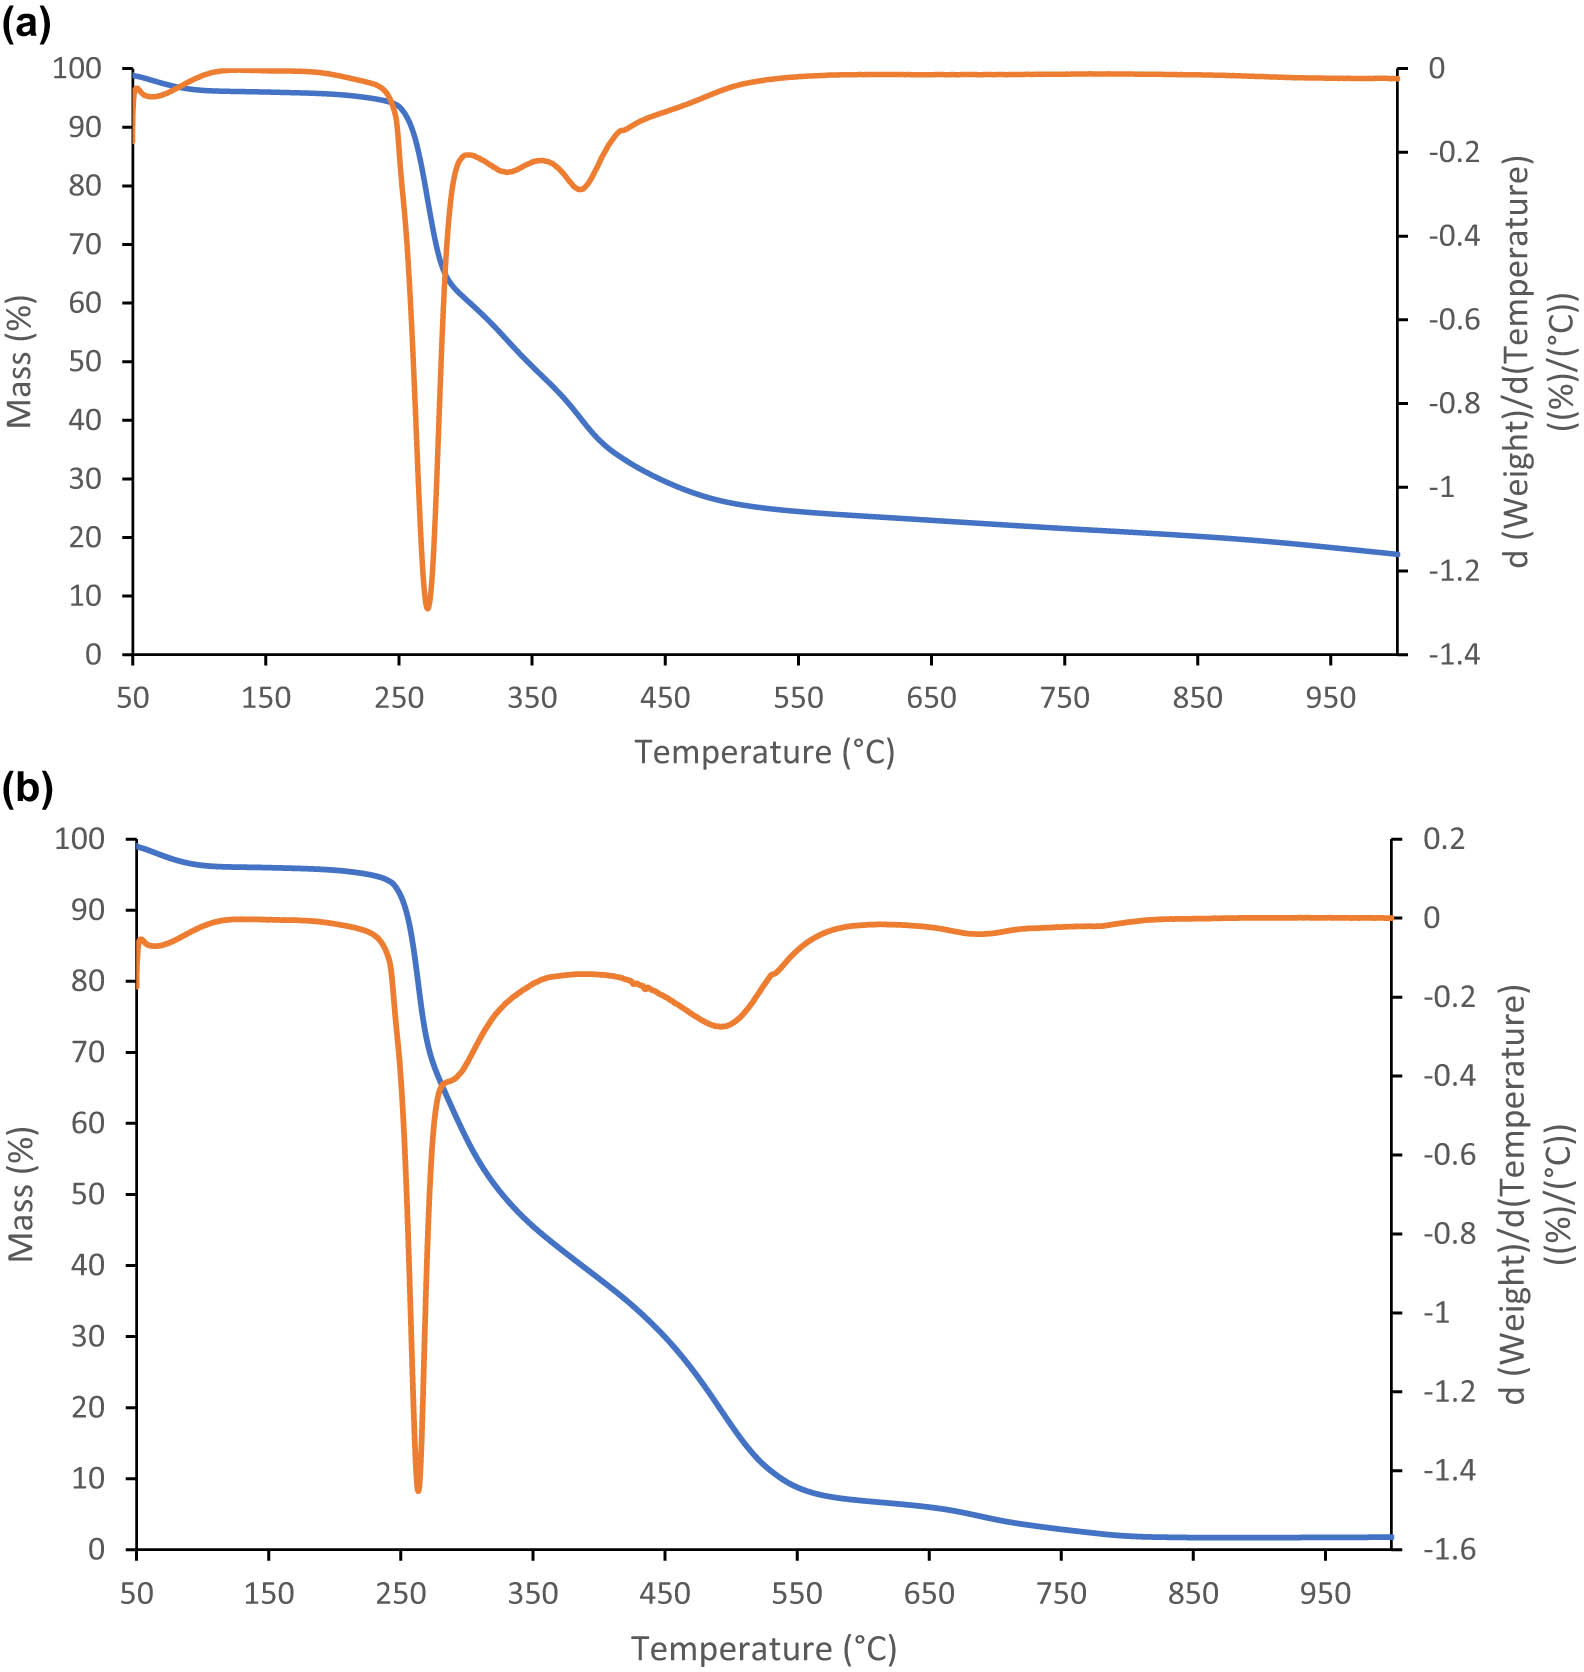
(a) TG and DTG curves in the nitrogen of microcapsules of the REp oil blend in NY. The blue line shows the TG curve, and the orange line shows its first derivative. (b) TG and DTG curves in the oxygen of microcapsules of the REp oil blend in NY. The blue line shows the TG curve, and the orange line shows its first derivative.
The course of the DTG curve in Figure 4a is similar to the course of the DTG curve in Figure 3a initially. In both figures, sharp and distinct peaks were observed at maximum temperatures of 304.51°C (Figure 3a) and 271.54°C (Figure 4a). The DTG curve of microcapsules was characterized by two small, mild peaks at maximum temperatures of 332.39 and 386.83°C (Figure 4a). The mass loss corresponding to this transformation was 34.27%. The occurrence of these two peaks indicated the microencapsulation of the oil blend in the yeast biomass. In Figure 3a, no peaks were found at these temperatures.
Figure 4b shows the TG and DTG curves in the oxygen of microencapsulation of the oil blend (rapeseed oil and evening primrose oil) in NY. The DTG curve of microcapsules in oxygen was characterized by a much milder course than the DTG curve of NY (Figure 3c). The microcapsules of the DTG curve were characterized by two peaks. The first peak in the DTG curve was observed at a maximum temperature of 263.23°C. The peak was distinct and sharp.
The mild, small peak was observed in the temperature range from 393.32 to 611.63°C at a maximum temperature of 495.17°C. The maximum peak temperature at such a high level and the mass loss for this transformation amounted to 32.99%, indicating the presence of fats in the microcapsules.
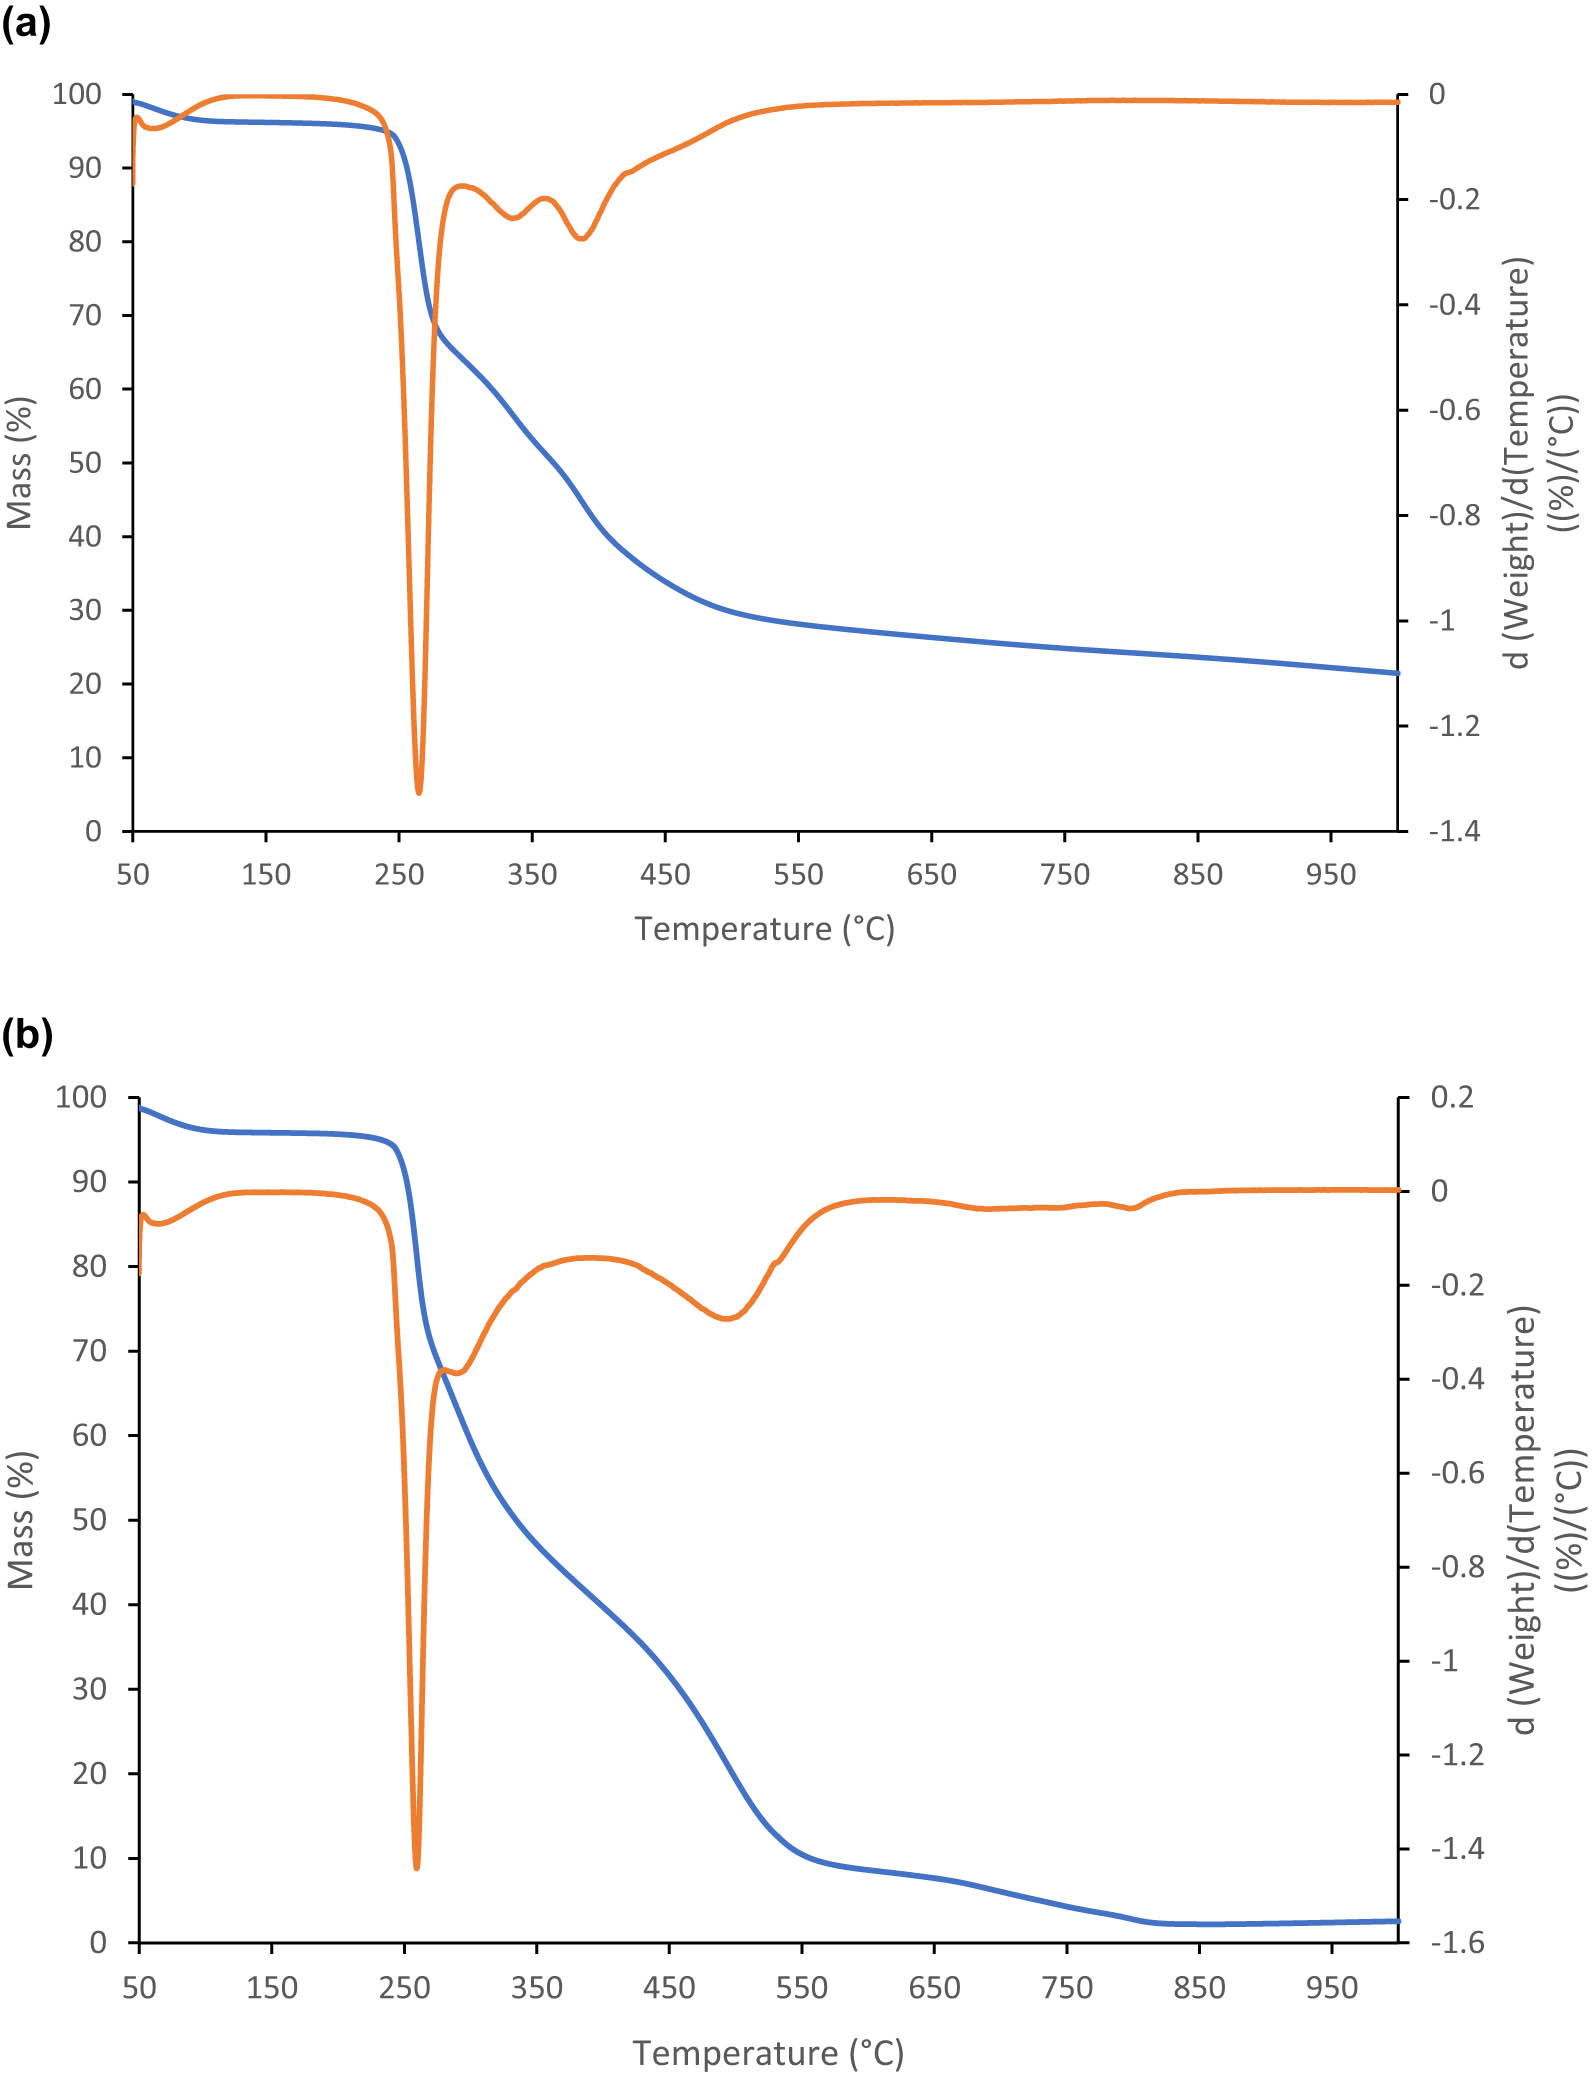
Figure 5a shows the TG and DTG curves in the nitrogen of microencapsulation of the oil blend (rapeseed oil and evening primrose oil) in AY. The course of the DTG curve in Figure 5a is similar to the course of the DTG curve in Figure 3a initially. In Figure 5a, sharp, distinct peaks at a maximum temperature of 264.53°C were observed (Figure 5a). The DTG curve of the microcapsules was characterized by two small, mild peaks at maximum temperatures of 333.94 and 386.72°C (Figure 5a). The mass loss corresponding to this transformation was 35.59%. The occurrence of these two peaks indicated the microencapsulation of the oil blend in the yeast biomass.

(a) TG and DTG curves in the nitrogen of microcapsules of the REp oil blend in AY. The blue line shows the TG curve, and the orange line shows its first derivative. (b) TG and DTG curves in the oxygen of microcapsules of the REp oil blend in AY. The blue line shows the TG curve, and the orange line shows its first derivative.
Figure 5b shows the TG and DTG curves in the oxygen of microencapsulation of the oil blend (rapeseed oil and evening primrose oil) in AY. The DTG curve of the microcapsules in oxygen was characterized by a much milder course than the DTG curve of NY (Figure 3c). The DTG curve of the microcapsules was characterized by two peaks. The first peak on the DTG curve was observed at a maximum temperature of 258.96°C. The peak was distinct and sharp. The mild, small peak was observed at a maximum temperature of 495.21°C. The maximum peak temperature at such a high level and the mass loss for this transformation, amounting to 32.66%, indicated the presence of fats in the microcapsules.
All figures showing TG and DTG charts of NY and AY with the encapsulated blend of rapeseed oil and evening primrose oil are similar to the figures showing those of pure NY and AY. In the figures obtained in a nitrogen atmosphere, peaks probably correspond to the blend of rapeseed oil and evening primrose oil, and microencapsulation was observed for both types of NY and AY.
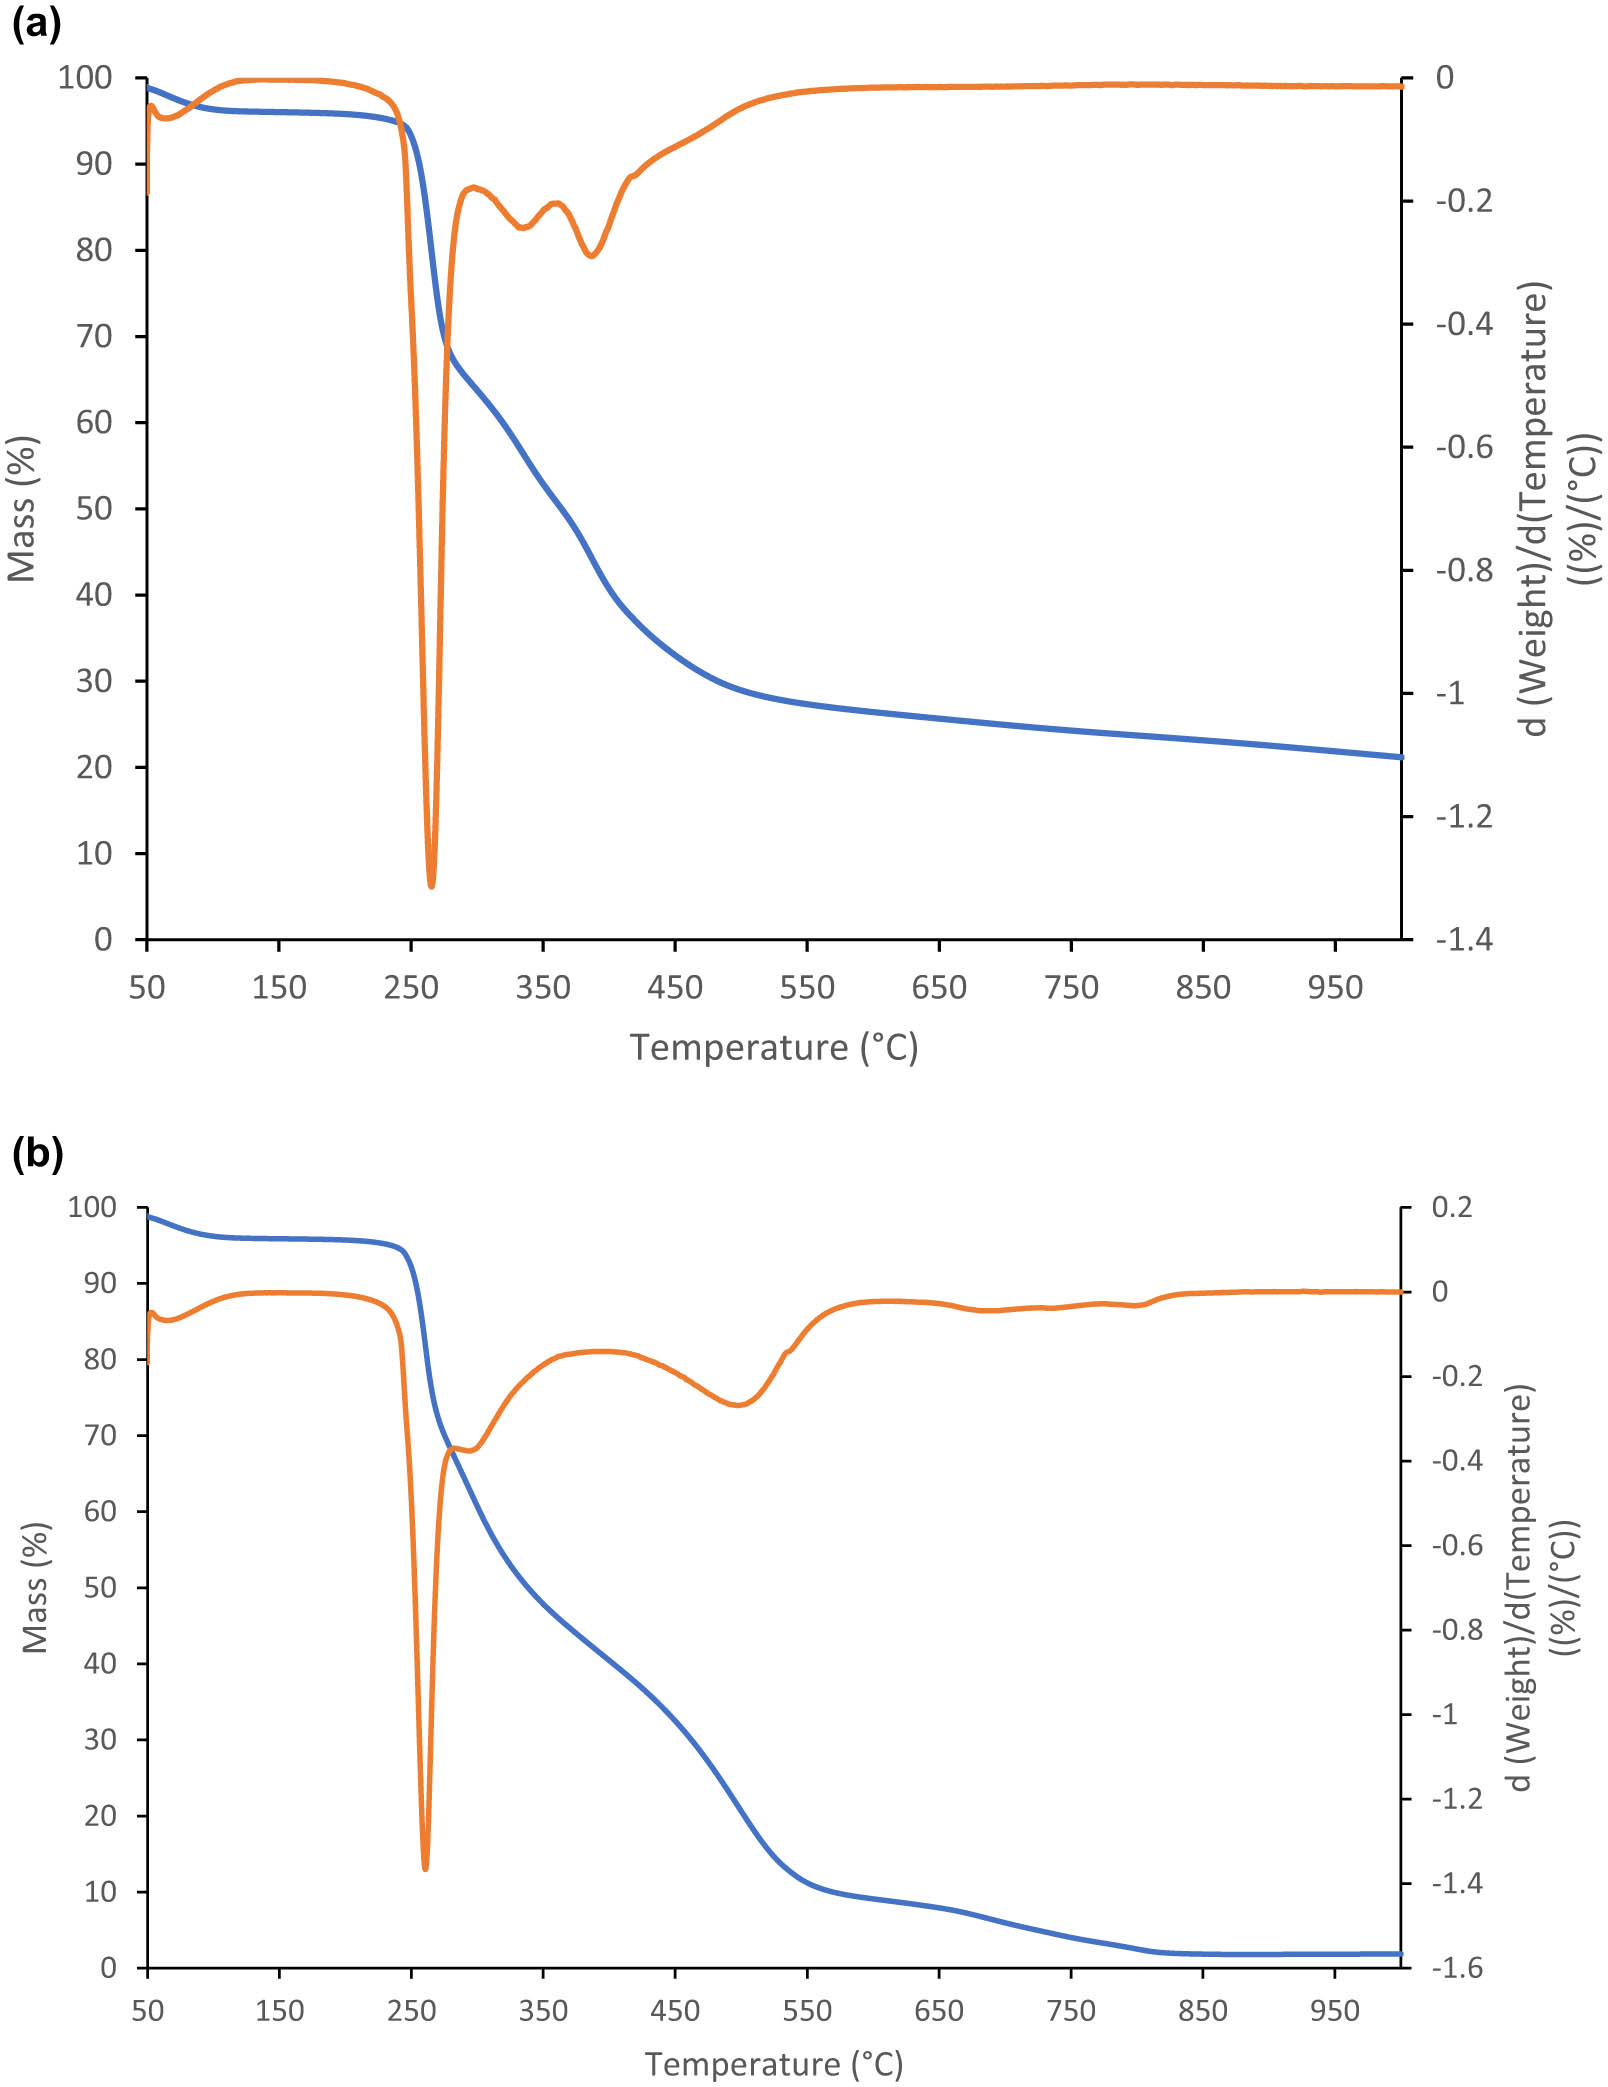
The TG and DTG curves in nitrogen and oxygen of microencapsulation of the oil blend (rapeseed oil, black cumin oil, and wheat germ oil) of NY and AY are shown in Figures 6a, b, and 7a, b. The TG and DTG curves in nitrogen and oxygen of microencapsulation of the oil blend (camelina oil and rice bran oil) of NY and AY are shown in Figures 8a, b, and 9a, b.
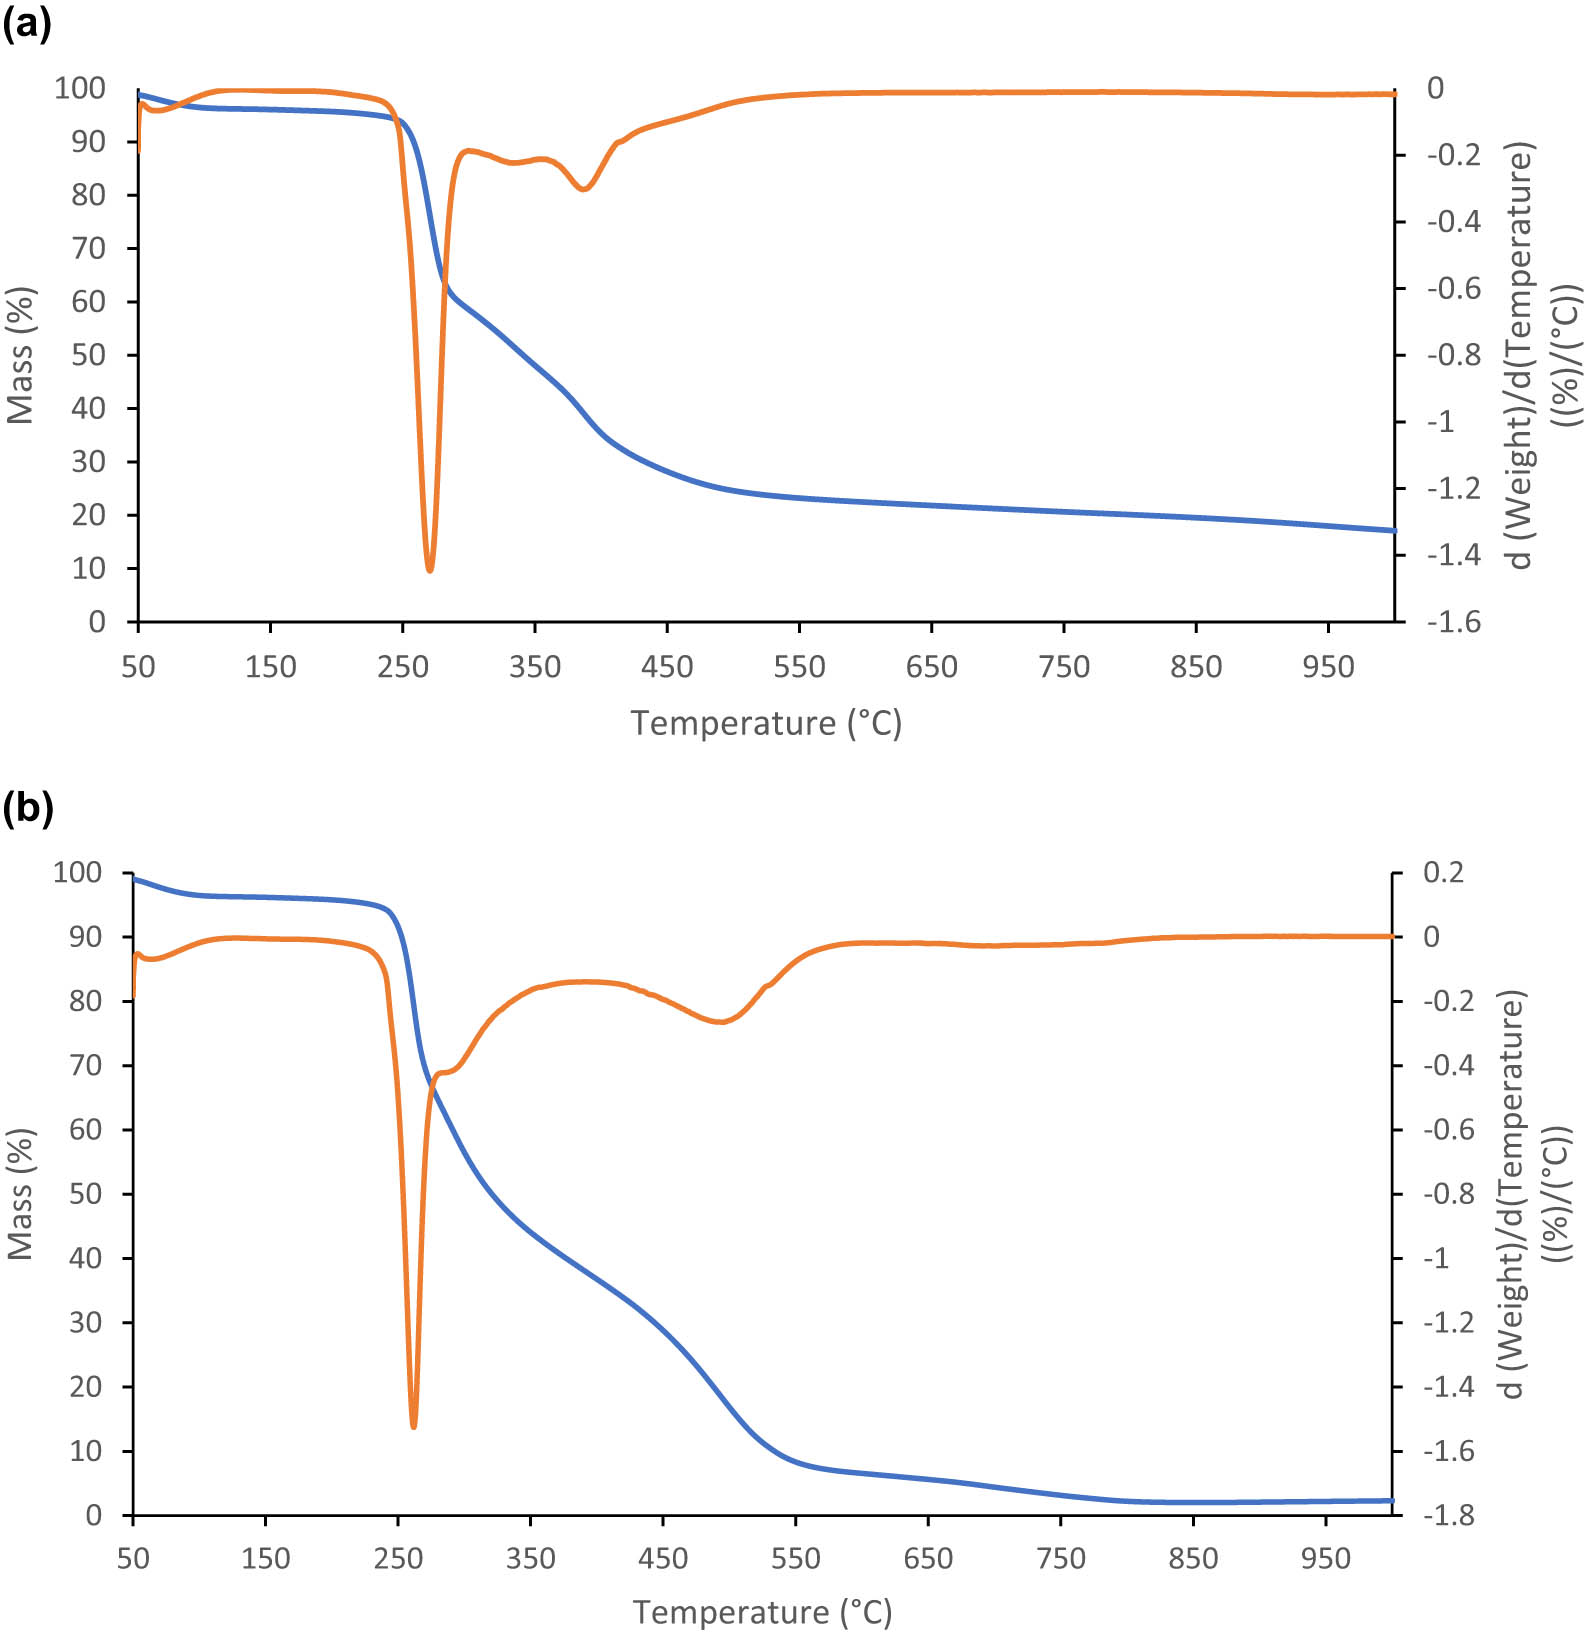
(a) TG and DTG curves in the nitrogen of microcapsules of the RBWg oil blend in NY. The blue line shows the TG curve, and the orange line shows its first derivative. (b) TG and DTG curves in the oxygen of microcapsules of the RBWg oil blend in NY. The blue line shows the TG curve, and the orange line shows its first derivative.
(a) TG and DTG curves in the nitrogen of microcapsules of the RBWg oil blend in AY. The blue line shows the TG curve, and the orange line shows its first derivative. (b) TG and DTG curves in the oxygen of microcapsules of the RBWg oil blend in AY. The blue line shows the TG curve, and the orange line shows its first derivative.
(a) TG and DTG curves in the nitrogen of microcapsules of the CRb oil blend in NY. The blue line shows the TG curve, and the orange line shows its first derivative. (b) TG and DTG curves in the oxygen of microcapsules of the CRb oil blend in NY. The blue line shows the TG curve, and the orange line shows its first derivative.
(a) TG and DTG curves in the nitrogen of microcapsules of the CRb oil blend in AY. The blue line shows the TG curve, and the orange line shows its first derivative. (b) TG and DTG curves in the oxygen of microcapsules of the CRb oil blend in AY. The blue line shows the TG curve, and the orange line shows its first derivative.
In the integrated figures (Figures 10 and 11) obtained for NY and AY in nitrogen and oxygen, the TG and DTG curves have a very similar shape and course. The differences between the maximum temperatures of peaks are very small, as are the differences in mass loss of each sample. This regularity was observed in Figures 10 and 11.

All DTG curves for microencapsulated blend oils in the nitrogen of NY and AY.
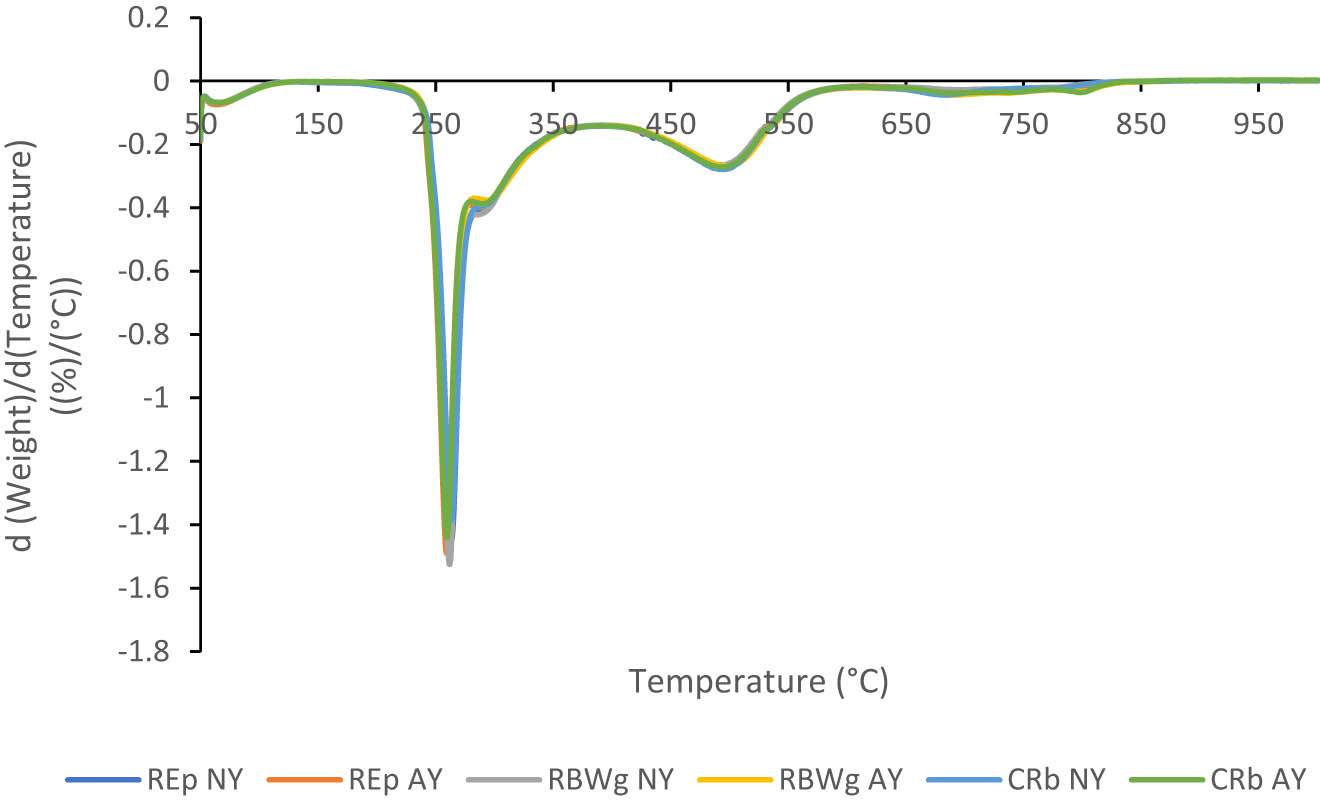
All DTG curves for microencapsulated blends oils in the oxygen of NY and AY.
Karaman [35] studied gallic acid encapsulation using yeast cells (S. cerevisiae) and the effects of plasmolysis treatment and solvent type of encapsulation media (H2O or EtOH:H2O) on encapsulation performance, bioactive properties, morphological–conformational characteristics and release behavior. Gallic acid was successfully encapsulated in both plasmolyzed and nonplasmolyzed yeast cells. The results showed that plasmolysis treatment had a significant effect on the characteristic properties of loaded yeast cell microcapsules. These findings demonstrated that the yeast cell could be used as an efficient microcarrier for the encapsulation of gallic acid in order to provide controlled release properties for both the food and pharmaceutical industries.
Sabu et al. [36] presented an approach against type 1 diabetes mellitus using yeast microcapsules. Thus, a drug can be expected to be delivered to the systemic circulation via lymphatic transport if it is attached to the surface of a yeast microcapsule. For the first time, this possibility has been explored by surface loading of insulin onto a yeast microcapsule. The electrostatic interaction between the oppositely charged yeast microcapsule and insulin resulted in the formation of an insulin-loaded yeast microcapsule. Alginate coating provided to the insulin-loaded yeast microcapsule protects the yeast microcapsule from the harsh environment of the gastrointestinal tract and prevents the degradation of insulin in the insulin-loaded yeast microcapsule.
4 Conclusion
Differences in the shape and course of the TG and DTG curves were observed for NY in nitrogen and oxygen and for microcapsules with all types of oil blends. Differences in the shape and course of the TG and DTG curves were observed for AY in oxygen and for microcapsules with all types of oil blends. No differences were observed in the shape and course of TG and DTG curves of the microcapsule curves with all oil blends between microcapsules prepared using NY and AY. Based on the shape and course of TG and DTG curves, it can be concluded that microencapsulation of oil blends using NY and AY is effective.
-
Funding information: The National Centre for Research and Development of Poland (NCBR) is acknowledged for funding provided under the program LIDER with grant agreement No. LIDER/27/0105/L-11/19/NCBR/2020 (PI: Przemysław Kowalczewski). The publication was financed by the Polish Minister of Science and Higher Education as part of the Strategy of the Poznan University of Life Sciences for 2024-2026 in the field of improving scientific research and development work in priority research areas.
-
Author contributions: All authors have accepted responsibility for the entire content of this manuscript and approved its submission.
-
Conflict of interest: The authors state no conflict of interest.
-
Data availability statement: All data generated or analyzed during this study are included in this published article.
References
[1] Snetselaar, L. G., J. M. de Jesus, D. M. DeSilva, and E. E. Stoody. Dietary guidelines for Americans, 2020–2025. Nutrition Today, Vol. 56, 2021, pp. 287–295.10.1097/NT.0000000000000512Suche in Google Scholar PubMed PubMed Central
[2] Chew, S. C. Cold-pressed rapeseed (Brassica napus) oil: Chemistry and functionality. Food Research International, Vol. 131, 2020, id. 108997.10.1016/j.foodres.2020.108997Suche in Google Scholar PubMed
[3] Maurya, A., J. Prasad, S. Das, and A. K. Dwivedy. Essential oils and their application in food safety. Front Sustainable Food System, Vol. 5, 2021, id. 653420.10.3389/fsufs.2021.653420Suche in Google Scholar
[4] Mildner-Szkudlarz, S., M. Różańska, A. Siger, P. Ł. Kowalczewski, and M. Rudzińska. Changes in chemical composition and oxidative stability of cold-pressed oils obtained from by-product roasted berry seeds. LWT, Vol. 111, 2019, pp. 541–547.10.1016/j.lwt.2019.05.080Suche in Google Scholar
[5] Zhou, Y., W. Zhao, Y. Lai, B. Zhang, and D. Zhang. Edible plant oil: global status, health issues, and perspectives. Frontiers of Plant Science, Vol. 11, 2020, id. 1315.10.3389/fpls.2020.01315Suche in Google Scholar PubMed PubMed Central
[6] Kmiecik, D., M. Fedko, M. Rudzińska, A. Siger, A. Gramza-Michałowska, and J. Kobus-Cisowska. Thermo-oxidation of phytosterol molecules in rapeseed oil during heating: the impact of unsaturation level of the oil. Foods, Vol. 10, 2020, id. 50.10.3390/foods10010050Suche in Google Scholar PubMed PubMed Central
[7] Erickson, M. D., D. P. Yevtushenko, and Z.-X. Lu. Oxidation and thermal degradation of oil during frying: a review of natural antioxidant use. Food Reviews International, Vol. 39, No. 7, 2022, pp. 4665–4696.10.1080/87559129.2022.2039689Suche in Google Scholar
[8] Ramesh, S. V., R. Pandiselvam, R. Thushara, M. R. Manikantan, K. B. Hebbar, S. Beegum, et al. Engineering intervention for production of virgin coconut oil by hot process and multivariate analysis of quality attributes of virgin coconut oil extracted by various methods. Journal of Food Process Engineering, Vol. 43, 2020, id. e13395.10.1111/jfpe.13395Suche in Google Scholar
[9] Zhang, Q., A. S. M. Saleh, J. Chen, and Q. Shen. Chemical alterations taken place during deep-fat frying based on certain reaction products: A review. Chemistry and Physics of Lipids, Vol. 165, 2012, pp. 662–681.10.1016/j.chemphyslip.2012.07.002Suche in Google Scholar PubMed
[10] WHO and FAO joint consultation: fats and oils in human nutrition. Nutrition Reviews, Vol. 53, 2009, pp. 202–205.10.1111/j.1753-4887.1995.tb01552.xSuche in Google Scholar PubMed
[11] Cholewski, M., M. Tomczykowa, and M. Tomczyk. A comprehensive review of chemistry, sources and bioavailability of omega-3 fatty acids. Nutrients, Vol. 10, 2018, id. 1662.10.3390/nu10111662Suche in Google Scholar PubMed PubMed Central
[12] Kmiecik, D., M. Fedko, A. Siger, and P. Ł. Kowalczewski. Nutritional quality and oxidative stability during thermal processing of cold-pressed oil blends with 5:1 ratio of ω6/ω3 fatty acids. Foods, Vol. 11, 2022, id. 1081.10.3390/foods11081081Suche in Google Scholar PubMed PubMed Central
[13] Cichocki, W., D. Kmiecik, H. M. Baranowska, H. Staroszczyk, A. Sommer, and P. Ł. Kowalczewski. Chemical characteristics and thermal oxidative stability of novel cold-pressed oil blends: GC, LF NMR, and DSC studies. Foods, Vol. 12, 2023, id. 2660.10.3390/foods12142660Suche in Google Scholar PubMed PubMed Central
[14] Grajzer, M., K. Szmalcel, Ł. Kuźmiński, M. Witkowski, A. Kulma, and A. Prescha. Characteristics and antioxidant potential of cold-pressed oils—possible strategies to improve oil stability. Foods, Vol. 9, 2020, id. 1630.10.3390/foods9111630Suche in Google Scholar PubMed PubMed Central
[15] Czerniak, A., P. Kubiak, W. Białas, and T. Jankowski. Improvement of oxidative stability of menhaden fish oil by microencapsulation within biocapsules formed of yeast cells. Journal of Food Engineering, Vol. 167, 2015, pp. 2–11.10.1016/j.jfoodeng.2015.01.002Suche in Google Scholar
[16] Machado, M., L. M. Rodriguez-Alcalá, A. M. Gomes, and M. Pintado. Vegetable oils oxidation: mechanisms, consequences and protective strategies. Food Reviews International, Vol. 39, No. 7, 2022, pp. 1–18.10.1080/87559129.2022.2026378Suche in Google Scholar
[17] Vargas-Ramella, M., M. Pateiro, F. J. Barba, D. Franco, P. C. B. Campagnol, P. E. S. Munekata, et al. Microencapsulation of healthier oils to enhance the physicochemical and nutritional properties of deer pâté. LWT, Vol. 125, 2020, id. 109223.10.1016/j.lwt.2020.109223Suche in Google Scholar
[18] Saadatkhah, N., A. Carillo Garcia, S. Ackermann, P. Leclerc, M. Latifi, S. Samih, et al. Experimental methods in chemical engineering: Thermogravimetric analysis – TGA. Cancer Journal of Chemical Engineering, Vol. 98, 2020, pp. 34–43.10.1002/cjce.23673Suche in Google Scholar
[19] Górska, A., R. Brzezińska, M. Wirkowska-Wojdyła, J. Bryś, E. Domian, and E. Ostrowska-Ligęza. Application of thermal methods to analyze the properties of coffee silverskin and oil extracted from the studied roasting by-product. Applied Sciences, Vol. 10, 2020, id. 8790.10.3390/app10248790Suche in Google Scholar
[20] Kowalczewski, P. Ł., A. Czerniak, M. Lesiecki, D. Kmiecik, and K. Smarzyński. The method of encapsulation of oils in yeast cells. Polish Patent Application No. P.440018, 2021.Suche in Google Scholar
[21] Cichocki, W., A. Czerniak, K. Smarzyński, P. Jeżowski, D. Kmiecik, H. M. Baranowska, et al. Physicochemical and morphological study of the Saccharomyces cerevisiae cell-based microcapsules with novel cold-pressed oil blends. Applied Sciences, Vol. 12, 2022, id. 6577.10.3390/app12136577Suche in Google Scholar
[22] Ostrowska-Ligęza, E., A. Górska, M. Wirkowska-Wojdyła, J. Bryś, K. Dolatowska-Żebrowska, M. Shamilowa, et al. Thermogravimetric characterization of dark and milk chocolates at different processing stages. Journal of Thermal Analysis and Calorimetry, Vol. 134, 2018, pp. 623–631.10.1007/s10973-018-7091-4Suche in Google Scholar
[23] Materazzi, S., S. De Angelis Curtis, S. V. Ciprioti, R. Risoluti, and J. Finamore. Thermogravimetric characterization of dark chocolate. Journal of Thermal Analysis and Calorimetry, Vol. 116, 2014, pp. 93–98.10.1007/s10973-013-3495-3Suche in Google Scholar
[24] de Souza, A. G., J. C. O. Santos, M. M. Conceição, M. C. D. Silva, and S. Prasad. A thermoanalytic and kinetic study of sunflower oil. Brazilian Journal of Chemical Engineering, Vol. 21, 2004, pp. 265–273.10.1590/S0104-66322004000200017Suche in Google Scholar
[25] Szabo, M.-R., D. Chambre, and C. Idiţoiu. TG/DTG/DTA for the oxidation behavior characterization of vegetable and animal fats. Journal of Thermal Analysis and Calorimetry, Vol. 110, 2012, pp. 281–285.10.1007/s10973-012-2253-2Suche in Google Scholar
[26] Neto, V. Q., O. A. Bakke, C. M. P. Ramos, P. S. Bora, J. C. Letelier, and M. M. Conceição. Brazil nut (Bertholletia excelsa HBK) seed kernel oil: characterization and thermal stability. Revista de biologia e farmácia, Vol. 3, 2009, pp. 33–42.Suche in Google Scholar
[27] Nehdi, I. A., H. Sbihi, C. P. Tan, and S. I. Al-Resayes. Evaluation and characterisation of Citrullus colocynthis (L.) Schrad seed oil: Comparison with Helianthus annuus (sunflower) seed oil. Food Chemistry, Vol. 136, 2013, pp. 348–353.10.1016/j.foodchem.2012.09.009Suche in Google Scholar PubMed
[28] Piasecka, I., A. Górska, E. Ostrowska-Ligęza, and S. Kalisz. The study of thermal properties of blackberry, chokeberry and raspberry seeds and oils. Applied Sciences, Vol. 11, 2021, id. 7704.10.3390/app11167704Suche in Google Scholar
[29] Alcázar, E. B., M. H. M. Rocha-Leăo, and J. Dweck. Yeast intracellular water determination by thermogravimetry. Journal of Thermal Analysis and Calorimetry, Vol. 59, 2000, pp. 643–648.10.1023/A:1010172830355Suche in Google Scholar
[30] Fagerson, I. S. Thermal degradation of carbohydrates; a review. Journal of Agricultural and Food Chemistry, Vol. 17, 1969, pp. 747–750.10.1021/jf60164a019Suche in Google Scholar
[31] Puddington, I. E. The thermal decomposition of carbohydrates. Canadian Journal of Research, Vol. 26b, 1948, pp. 415–431.10.1139/cjr48b-041Suche in Google Scholar PubMed
[32] Shafizadeh, F. Thermal behavior of carbohydrates. Journal of Polymer Science, Part C: Polymer Symposia, Vol. 36, 1971, pp. 21–51.10.1002/polc.5070360105Suche in Google Scholar
[33] Banerjee, A., T. Vithusha, B. B. Krishna, J. Kumar, T. Bhaskar, and D. Ghosh. Pyrolysis of de-oiled yeast biomass of Rhodotorula mucilaginosa IIPL32: Kinetics and thermodynamic parameters using thermogravimetric analysis. Bioresource Technology, Vol. 340, 2021, id. 125534.10.1016/j.biortech.2021.125534Suche in Google Scholar PubMed
[34] Dassanayake, S., R. Acharya, S. Abidi, and N. Biopolymer-Based. Materials from polysaccharides: properties, processing, characterization and sorption applications. Advanced sorption process applications, IntechOpen, London, 2019.10.5772/intechopen.80898Suche in Google Scholar
[35] Karaman, K. Fabrication of gallic acid loaded yeast (Saccharomyces cerevisiae) microcapsules: Effect of plasmolysis treatment and solvent type on bioactivity and release kinetics. LWT, Vol. 148, 2021, id. 111640.10.1016/j.lwt.2021.111640Suche in Google Scholar
[36] Sabu, C., D. Raghav, U. S. Jijith, P. Mufeedha, P. P. Naseef, K. Rathinasamy, et al. Bioinspired oral insulin delivery system using yeast microcapsules. Materials Science & Engineering, C: Materials for Biological Applications, Vol. 103, 2019, id. 109753.10.1016/j.msec.2019.109753Suche in Google Scholar PubMed
© 2024 the author(s), published by De Gruyter
This work is licensed under the Creative Commons Attribution 4.0 International License.
Artikel in diesem Heft
- Review Articles
- Effect of superplasticizer in geopolymer and alkali-activated cement mortar/concrete: A review
- Experimenting the influence of corncob ash on the mechanical strength of slag-based geopolymer concrete
- Powder metallurgy processing of high entropy alloys: Bibliometric analysis and systematic review
- Exploring the potential of agricultural waste as an additive in ultra-high-performance concrete for sustainable construction: A comprehensive review
- A review on partial substitution of nanosilica in concrete
- Foam concrete for lightweight construction applications: A comprehensive review of the research development and material characteristics
- Modification of PEEK for implants: Strategies to improve mechanical, antibacterial, and osteogenic properties
- Interfacing the IoT in composite manufacturing: An overview
- Advances in processing and ablation properties of carbon fiber reinforced ultra-high temperature ceramic composites
- Advancing auxetic materials: Emerging development and innovative applications
- Revolutionizing energy harvesting: A comprehensive review of thermoelectric devices
- Exploring polyetheretherketone in dental implants and abutments: A focus on biomechanics and finite element methods
- Smart technologies and textiles and their potential use and application in the care and support of elderly individuals: A systematic review
- Reinforcement mechanisms and current research status of silicon carbide whisker-reinforced composites: A comprehensive review
- Innovative eco-friendly bio-composites: A comprehensive review of the fabrication, characterization, and applications
- Review on geopolymer concrete incorporating Alccofine-1203
- Advancements in surface treatments for aluminum alloys in sports equipment
- Ionic liquid-modified carbon-based fillers and their polymer composites – A Raman spectroscopy analysis
- Emerging boron nitride nanosheets: A review on synthesis, corrosion resistance coatings, and their impacts on the environment and health
- Mechanism, models, and influence of heterogeneous factors of the microarc oxidation process: A comprehensive review
- Synthesizing sustainable construction paradigms: A comprehensive review and bibliometric analysis of granite waste powder utilization and moisture correction in concrete
- 10.1515/rams-2025-0086
- Research Articles
- Coverage and reliability improvement of copper metallization layer in through hole at BGA area during load board manufacture
- Study on dynamic response of cushion layer-reinforced concrete slab under rockfall impact based on smoothed particle hydrodynamics and finite-element method coupling
- Study on the mechanical properties and microstructure of recycled brick aggregate concrete with waste fiber
- Multiscale characterization of the UV aging resistance and mechanism of light stabilizer-modified asphalt
- Characterization of sandwich materials – Nomex-Aramid carbon fiber performances under mechanical loadings: Nonlinear FE and convergence studies
- Effect of grain boundary segregation and oxygen vacancy annihilation on aging resistance of cobalt oxide-doped 3Y-TZP ceramics for biomedical applications
- Mechanical damage mechanism investigation on CFRP strengthened recycled red brick concrete
- Finite element analysis of deterioration of axial compression behavior of corroded steel-reinforced concrete middle-length columns
- Grinding force model for ultrasonic assisted grinding of γ-TiAl intermetallic compounds and experimental validation
- Enhancement of hardness and wear strength of pure Cu and Cu–TiO2 composites via a friction stir process while maintaining electrical resistivity
- Effect of sand–precursor ratio on mechanical properties and durability of geopolymer mortar with manufactured sand
- Research on the strength prediction for pervious concrete based on design porosity and water-to-cement ratio
- Development of a new damping ratio prediction model for recycled aggregate concrete: Incorporating modified admixtures and carbonation effects
- Exploring the viability of AI-aided genetic algorithms in estimating the crack repair rate of self-healing concrete
- Modification of methacrylate bone cement with eugenol – A new material with antibacterial properties
- Numerical investigations on constitutive model parameters of HRB400 and HTRB600 steel bars based on tensile and fatigue tests
- Research progress on Fe3+-activated near-infrared phosphor
- Discrete element simulation study on effects of grain preferred orientation on micro-cracking and macro-mechanical behavior of crystalline rocks
- Ultrasonic resonance evaluation method for deep interfacial debonding defects of multilayer adhesive bonded materials
- Effect of impurity components in titanium gypsum on the setting time and mechanical properties of gypsum-slag cementitious materials
- Bending energy absorption performance of composite fender piles with different winding angles
- Theoretical study of the effect of orientations and fibre volume on the thermal insulation capability of reinforced polymer composites
- Synthesis and characterization of a novel ternary magnetic composite for the enhanced adsorption capacity to remove organic dyes
- Couple effects of multi-impact damage and CAI capability on NCF composites
- Mechanical testing and engineering applicability analysis of SAP concrete used in buffer layer design for tunnels in active fault zones
- Investigating the rheological characteristics of alkali-activated concrete using contemporary artificial intelligence approaches
- Integrating micro- and nanowaste glass with waste foundry sand in ultra-high-performance concrete to enhance material performance and sustainability
- Effect of water immersion on shear strength of epoxy adhesive filled with graphene nanoplatelets
- Impact of carbon content on the phase structure and mechanical properties of TiBCN coatings via direct current magnetron sputtering
- Investigating the anti-aging properties of asphalt modified with polyphosphoric acid and tire pyrolysis oil
- Biomedical and therapeutic potential of marine-derived Pseudomonas sp. strain AHG22 exopolysaccharide: A novel bioactive microbial metabolite
- Effect of basalt fiber length on the behavior of natural hydraulic lime-based mortars
- Optimizing the performance of TPCB/SCA composite-modified asphalt using improved response surface methodology
- Compressive strength of waste-derived cementitious composites using machine learning
- Melting phenomenon of thermally stratified MHD Powell–Eyring nanofluid with variable porosity past a stretching Riga plate
- Development and characterization of a coaxial strain-sensing cable integrated steel strand for wide-range stress monitoring
- Compressive and tensile strength estimation of sustainable geopolymer concrete using contemporary boosting ensemble techniques
- Customized 3D printed porous titanium scaffolds with nanotubes loading antibacterial drugs for bone tissue engineering
- Facile design of PTFE-kaolin-based ternary nanocomposite as a hydrophobic and high corrosion-barrier coating
- Effects of C and heat treatment on microstructure, mechanical, and tribo-corrosion properties of VAlTiMoSi high-entropy alloy coating
- Study on the damage mechanism and evolution model of preloaded sandstone subjected to freezing–thawing action based on the NMR technology
- Promoting low carbon construction using alkali-activated materials: A modeling study for strength prediction and feature interaction
- Entropy generation analysis of MHD convection flow of hybrid nanofluid in a wavy enclosure with heat generation and thermal radiation
- Friction stir welding of dissimilar Al–Mg alloys for aerospace applications: Prospects and future potential
- Fe nanoparticle-functionalized ordered mesoporous carbon with tailored mesostructures and their applications in magnetic removal of Ag(i)
- Study on physical and mechanical properties of complex-phase conductive fiber cementitious materials
- Evaluating the strength loss and the effectiveness of glass and eggshell powder for cement mortar under acidic conditions
- Effect of fly ash on properties and hydration of calcium sulphoaluminate cement-based materials with high water content
- Analyzing the efficacy of waste marble and glass powder for the compressive strength of self-compacting concrete using machine learning strategies
- Experimental study on municipal solid waste incineration ash micro-powder as concrete admixture
- Parameter optimization for ultrasonic-assisted grinding of γ-TiAl intermetallics: A gray relational analysis approach with surface integrity evaluation
- Producing sustainable binding materials using marble waste blended with fly ash and rice husk ash for building materials
- Effect of steam curing system on compressive strength of recycled aggregate concrete
- A sawtooth constitutive model describing strain hardening and multiple cracking of ECC under uniaxial tension
- Predicting mechanical properties of sustainable green concrete using novel machine learning: Stacking and gene expression programming
- Toward sustainability: Integrating experimental study and data-driven modeling for eco-friendly paver blocks containing plastic waste
- A numerical analysis of the rotational flow of a hybrid nanofluid past a unidirectional extending surface with velocity and thermal slip conditions
- A magnetohydrodynamic flow of a water-based hybrid nanofluid past a convectively heated rotating disk surface: A passive control of nanoparticles
- Prediction of flexural strength of concrete with eggshell and glass powders: Advanced cutting-edge approach for sustainable materials
- Efficacy of sustainable cementitious materials on concrete porosity for enhancing the durability of building materials
- Phase and microstructural characterization of swat soapstone (Mg3Si4O10(OH)2)
- Effect of waste crab shell powder on matrix asphalt
- Improving effect and mechanism on service performance of asphalt binder modified by PW polymer
- Influence of pH on the synthesis of carbon spheres and the application of carbon sphere-based solid catalysts in esterification
- Experimenting the compressive performance of low-carbon alkali-activated materials using advanced modeling techniques
- Thermogravimetric (TG/DTG) characterization of cold-pressed oil blends and Saccharomyces cerevisiae-based microcapsules obtained with them
- Investigation of temperature effect on thermo-mechanical property of carbon fiber/PEEK composites
- Computational approaches for structural analysis of wood specimens
- Integrated structure–function design of 3D-printed porous polydimethylsiloxane for superhydrophobic engineering
- Exploring the impact of seashell powder and nano-silica on ultra-high-performance self-curing concrete: Insights into mechanical strength, durability, and high-temperature resilience
- Axial compression damage constitutive model and damage characteristics of fly ash/silica fume modified magnesium phosphate cement after being treated at different temperatures
- Integrating testing and modeling methods to examine the feasibility of blended waste materials for the compressive strength of rubberized mortar
- Special Issue on 3D and 4D Printing of Advanced Functional Materials - Part II
- Energy absorption of gradient triply periodic minimal surface structure manufactured by stereolithography
- Marine polymers in tissue bioprinting: Current achievements and challenges
- Quick insight into the dynamic dimensions of 4D printing in polymeric composite mechanics
- Recent advances in 4D printing of hydrogels
- Mechanically sustainable and primary recycled thermo-responsive ABS–PLA polymer composites for 4D printing applications: Fabrication and studies
- Special Issue on Materials and Technologies for Low-carbon Biomass Processing and Upgrading
- Low-carbon embodied alkali-activated materials for sustainable construction: A comparative study of single and ensemble learners
- Study on bending performance of prefabricated glulam-cross laminated timber composite floor
- Special Issue on Recent Advancement in Low-carbon Cement-based Materials - Part I
- Supplementary cementitious materials-based concrete porosity estimation using modeling approaches: A comparative study of GEP and MEP
- Modeling the strength parameters of agro waste-derived geopolymer concrete using advanced machine intelligence techniques
- Promoting the sustainable construction: A scientometric review on the utilization of waste glass in concrete
- Incorporating geranium plant waste into ultra-high performance concrete prepared with crumb rubber as fine aggregate in the presence of polypropylene fibers
- Investigation of nano-basic oxygen furnace slag and nano-banded iron formation on properties of high-performance geopolymer concrete
- Effect of incorporating ultrafine palm oil fuel ash on the resistance to corrosion of steel bars embedded in high-strength green concrete
- Influence of nanomaterials on properties and durability of ultra-high-performance geopolymer concrete
- Influence of palm oil ash and palm oil clinker on the properties of lightweight concrete