Experimenting the compressive performance of low-carbon alkali-activated materials using advanced modeling techniques
-
Xue Yang
 ,
Tong Wu
,
Tong Wu

Abstract
Activated alkali materials (AAMs) are progressively utilized as an alternative to Portland cement concrete owing to their widespread application and reduced environmental impact. This research employed multi-expression programming (MEP) and gene expression programming (GEP) to create predictive models for the compressive strength (CS) of AAMs based on a dataset of 381 entries with eight distinct variables. To further assess the significance of the factors influencing the CS of AAMs, sensitivity analysis was employed. In comparison to GEP, MEP was better at predicting AAM’s CS. The R 2 score of the GEP model was 0.953, which is lower than the MEP model’s 0.970 level. This was further backed up by the results of the statistical study and Taylor’s diagram. The results of the sensitivity analysis showed that specific surface area, aggregate volumetric ratio, and silicate modulus were the three most important parameters influencing the models’ outcomes. In comparison to models built in Python, the produced models yield novel empirical equations for AAM strength characteristic prediction. Researchers and professionals in the field could use these equations to find the best proportions for mix designs, cutting down on the need for repeated laboratory tests.
List of notations
- AAMs
-
alkali-activated materials
- Adm
-
admixture volumetric ratio
- Ag
-
aggregate volumetric ratio
- CS
-
compressive strength
- ET
-
expression tree
- GA
-
genetic algorithm
- GPV
-
geopolymer paste volume to total concrete ratio
- GGBFS
-
ground granulated blast furnace slag
- GP
-
gene programming
- GEP
-
gene expression programming
- LBR
-
liquid-to-binder volumetric ratio
- MEP
-
multi-expression programming
- MAPE
-
mean absolute percentage error
- MAE
-
mean absolute error
- ML
-
machine learning
- Ms
-
silicate modulus-SiO2/Na2O
- NSE
-
nash-Sutcliffe efficiency
- OPC
-
ordinary Portland cement
- R
-
Pearson’s correlation coefficient
- R 2
-
coefficient of determination
- RMSE
-
root mean square error
- RRMSE
-
relative root mean square error
- RSE
-
relative squared error
- RT
-
reactivity
- SHC
-
sodium hydroxide concentration
- SSA
-
specific surface area
- w/b
-
water/binder ratio
1 Introduction
Currently, the percentage of CO₂ emissions caused by the manufacturing of ordinary Portland cement (OPC) is dropping, but current predictions indicate that it will account for an extra 8% of all emissions by 2050. The zero-emissions aim of the Paris Agreement is being called into question [1,2]. Discovering less detrimental substitutes for OPC is crucial in order to reduce the OPC business’s carbon dioxide emissions [3]. The eco-friendliness and low-energy use of alkali-activated materials (AAMs) have made them a highly sought-after potential game-changing construction material in recent decades [4,5]. Industrial by-products, minerals, and mining waste are all examples of materials that include alumino-silicates. By reacting these materials with alkaline activators, they can be transformed into AAMs [6]. Among the several alumino-silicates that could be employed as AAMs building blocks are those that are discussed in detail, followed by red mud, fly ash, met kaolin, blast furnace slag, and ashes from rice husks [7,8,9,10]. A lot of people have used sodium activators to get the right technical attributes for a good price [11]. This includes sodium carbonate, water glass, and sodium hydroxide, to name a few. Utilization of AAMs has been widespread in the construction industry, with applications ranging from offshore structures to waterproof buildings, dwellings, and heavy metal immobilizations [12]. In chemical science, AAMs refer to a broad category that includes many different types of precursors that are activated by an alkaline solution. Geopolymers are AAMs made by polymerizing aluminosilicate minerals under alkaline conditions. Geopolymers, unlike AAMs, have a wide range of configurations and geometries. Their distinctive and easily controlled polymerization process makes them ideal for usage in high-performance concrete [6,13]. Despite some negatives, such as shrinkage cracking, AAMs are now more effective than OPC concrete [14]. The reason for the shrinkage cracking is due to rapid chemical reactions between the alkali activator and the precursor materials, leading to high internal stresses. These stresses result from the rapid formation of hydration products and the loss of moisture during the curing process, which contributes to volumetric changes and ultimately causes shrinkage. Besides shrinkage cracking, AAMs face disadvantages such as a high carbon footprint of activators, potential durability issues, limited standardization, workability challenges, and higher costs of raw materials [15,16,17]. Figure 1 shows the advantages of AAMs.
![Figure 1
Merits of AAMs [18].](/document/doi/10.1515/rams-2024-0068/asset/graphic/j_rams-2024-0068_fig_001.jpg)
Merits of AAMs [18].
This machine learning (ML) research focuses on compressive strength (CS), a key structural material performance indicator. Numerous studies have explored the influence of precursor type, curing conditions, water-to-binder ratio (w/b), and activator measure on CS to develop models and perform predictive assessments, with a particular emphasis on structural reliability. The purpose of the study by Yang et al. was to investigate how changing the water-to-binder ratio affected the mechanical characteristics of alkali-slag concrete that had been activated with chloroform [19]. The results indicated that the CS increased at a similar rate as OPC concrete when the w/b ratio was decreased. Alkali activation facilities commonly use both fly ash and ground granulated blast furnace slag (GGBFS) as precursors. According to Xie et al., the mechanical strength of geo-polymer concrete stimulated by alkali and recycled aggregate was influenced by GGBFS and fly ash [20]. A higher ratio of GGBS to fly ash was shown to be correlated with an increased CS. The findings support previous research indicating that the use of NaOH to activate fly ash/slag blends leads to an enhanced CS, particularly when the proportion of slag is increased [21]. Table 1 provides a concise overview of the literature on ML, which shows that ML models are very accurate in predicting many concrete and mortar parameters. The number of building applications discovered by AAMs and utilization of ML is quite small. A big worry is that not enough is understood about how these various characteristics impact their CS performance.
Previous ML-based similar studies
| Ref. | Materials investigated | Attributes projected | ML technique utilized | R 2 value (max) |
|---|---|---|---|---|
| [22] | GP-mortar | Flexural strength (FS) | Bagging regressor and support vector machine (SVM) | 0.92 |
| [23] | RHA-based concrete | CS | AdaBoost, extreme gradient boosting, and gradient boosting | 0.89 |
| [24] | Mining waste-based cements | CS | SVM, decision tree, and random forest | 0.97 |
| [25] | Geopolymer concrete | CS | MEP and GEP | 0.97 |
| [26] | Metakaolin-centered concrete | CS & FS | MEP and GEP | 0.96 |
In order to adjust the mechanical characteristics of AAMs, it is possible to modify the types and ratios of activators. In their pursuit of knowledge, Aydn and Baradan dug deeper into the topic of alkali activation by investigating the impacts of NaOH and NA2SiO3 to activate the mechanical characteristics of slag from Turkey [27]. The specimens activated with NaOH had a lower CS than the slag mortars treated with NA2SiO3, as shown in the results. The amount of Na2O and the ratio of SiO2Na2O concentration were presented to exhibit a substantial impact on CS. For instance, after 28 days, mortars containing NA2SiO3 and NaOH, with a SiO2/Na2O ratio of 1.2 and an 8% Na2O slag component, attained the highest CS. Due to its sensitivity to temperature, curing is the first stage of geopolymerization. According to Rovnank, a geopolymer containing kaolin was tested using a range of curing temperatures (from 10 to 80°C) to regulate its impression on microstructural and mechanical attributes [28]. The CS of AAM designs should be determined by considering the aforementioned criteria. Uncovering the optimal computer science solution formerly required doing numerous experimental trials in the laboratory. Nevertheless, it is an expensive and time-consuming technique to prepare a big quantity of AAM specimens. Improved estimates of AAM CS can be obtained without squandering resources on ineffective batch experiments.
Soft computing has made it possible to more faithfully model the technical properties of a wide range of materials. Prediction accuracy relies heavily on data-fed ML models. Because of their complicated complexity and inherent unpredictability, construction materials are notoriously difficult to quantify accurately. A notable area of use for ML algorithms has been the estimation of engineering characteristics of construction materials. Different varieties of concrete, including both new and old, have had their characteristics studied using ML techniques. These types of concrete include fiber-reinforced concrete, lightweight concrete, self-compacting concrete, recycled aggregate concrete, and concrete integrated with phase change materials [29,30,31,32,33]. Several research have shown that powerful ML models are more effective than traditional physical and empirical methods in accurately assessing specific engineering attributes. To obtain accurate forecasts on the characteristics of concrete, it is important to address certain computational challenges. The intricate mechanisms of cement hydration and microstructure formation, along with the nonlinear relationship between time, temperature, and the activity of cement paste, present substantial challenges [34,35,36]. Training ML models with input data on combination proportions and curing circumstances allows for reliable prediction of desired attributes. The use of ML models has various benefits, such as generalizability, accuracy, and reproducibility in predictions, as well as minimal computing requirements and ease of use.
A reliable computational framework for CS prediction of AAM composites might be developed with the assistance of well-trained ML algorithms, according to the study. This study aims to analyze AAM’s CS using strong ML models. We utilized publically available research material to create regression models that utilized gene expression programming (GEP) and multi-expression programming (MEP) to forecast the CS of AAMs. In all, there are 381 points in the dataset. All the models were double-checked using mathematical tests and Taylor’s diagram. To find out how the variables affected the prediction, a sensitivity analysis was run. The invention of new techniques and instruments for conducting controlled assessments of material properties with minimal human involvement implies that the results may have extensive ramifications for the entire building industry.
2 Methods of research
2.1 Dataset selection and analysis
A dataset with 381 data points was analyzed using the MEP and GEP techniques in this study. The dataset was gathered from a laboratory experiment that attempted to estimate the CS of AAMs [37,38,39,40,41,42,43,44,45,46,47,48,49,50,51,52,53,54,55,56,57,58,59,60]. Eight parameters were used to predict the CS in this study: sodium hydroxide concentration (SHC), silicate modulus-SiO2/Na2O (Ms), reactivity (RT), admixture volumetric ratio (Adm), geopolymer paste volume-to-total concrete ratio (GPV), aggregate volumetric ratio (Ag), liquid-to-binder volumetric ratio (LBR), and specific surface area (SSA). The data collection and consolidation processes relied heavily on thorough data pretreatment. Methods for preparing data for data mining aid in discovering new knowledge from existing data, which is a common objective, but it is not without its difficulties. Data cleansing and standardization through the removal of inaccuracies and unnecessary elements is the main objective of data preparation. Data cleansing involves identifying and correcting errors, such as missing values, duplicates, or incorrect entries, to ensure data accuracy. Standardization involves converting data into a consistent format or scale, such as unifying date formats or normalizing numerical values. This process helps eliminate inconsistencies and ensures that the data is reliable and ready for analysis, leading to more accurate and meaningful results. The model analysis included regression and error-distribution approaches. As shown in Table 2, we ran a number of descriptive statistics on these numbers. Additionally, the efficacy and validity of the models utilized have been assessed. Violin plots in Figure 2(a)–(i) demonstrate the frequency of various values. It shows the data’s probability density at various levels, as well as its distribution across several categories. The graphic gives a thorough look at the distribution and variability of the data, with features such as a median marker, an interquartile range box, and the density curve on each side.
Data-based variable descriptions
| Statistical parameters | SSA (m2·kg−1) | Ms | RT | GPV (%) | Ag | SHC (M) | LBR | Adm | CS (MPa) |
|---|---|---|---|---|---|---|---|---|---|
| Mean | 785.989 | 1.033 | 3.677 | 0.676 | 0.316 | 5.386 | 1.046 | 0.013 | 52.143 |
| Standard error | 47.244 | 0.039 | 0.576 | 0.015 | 0.015 | 0.230 | 0.023 | 0.003 | 1.385 |
| Median | 429.000 | 0.900 | 1.810 | 0.640 | 0.350 | 5.110 | 0.960 | 0.000 | 48.300 |
| Mode | 338.300 | 0.750 | 1.810 | 1.000 | 0.000 | 0.000 | 0.780 | 0.000 | 40.000 |
| Standard deviation | 922.176 | 0.755 | 11.239 | 0.289 | 0.291 | 4.495 | 0.456 | 0.054 | 27.038 |
| Sample variance | 850407.796 | 0.570 | 126.326 | 0.084 | 0.085 | 20.208 | 0.208 | 0.003 | 731.039 |
| Kurtosis | 10.314 | 33.548 | 110.023 | −1.183 | −1.179 | −0.973 | −0.385 | 39.703 | 0.248 |
| Skewness | 3.053 | 4.530 | 9.998 | −0.246 | 0.290 | 0.380 | 0.681 | 6.307 | 0.358 |
| Range | 6118.850 | 7.940 | 136.640 | 0.920 | 0.920 | 16.000 | 2.000 | 0.390 | 145.200 |
| Minimum | 290.000 | 0.000 | 0.580 | 0.080 | 0.000 | 0.000 | 0.150 | 0.000 | 0.000 |
| Maximum | 6408.850 | 7.940 | 137.220 | 1.000 | 0.920 | 16.000 | 2.150 | 0.390 | 145.200 |
| Sum | 299461.790 | 393.440 | 1400.850 | 257.580 | 120.430 | 2052.240 | 398.390 | 4.960 | 19866.500 |
| Count | 381.000 | 381.000 | 381.000 | 381.000 | 381.000 | 381.000 | 381.000 | 381.000 | 381.000 |


Database input/output violin plots: (a) RT; (b) SSA; (c) silicate modulus-SiO2/Na2O; (d) SHC; (e) liquid-to-binder ratio; (f) GPV; (g) aggregate volumetric ratio; (h) admixture; and (i) CS.
2.2 ML modeling
To measure the CS of AAMs, a controlled setting was utilized. The output (CS) was obtained by requiring eight inputs. Using state-of-the-art ML algorithms such as GEP and MEP, AAM’s CS predictions were generated. When analyzing ML algorithms, it is usual practice to compare the outputs of the algorithms to the data that they were given as input. 50% of the data was utilized for training the ML models, while the remaining 30% was used for testing. In order to demonstrate that the model is successful, the R 2 score of the expected outcome is utilized. The coefficient of determination (R 2) is quite low for a significant difference, which indicates that the expected and actual values diverge to a minor degree [61]. The accuracy of the model is validated by a variety of methods, including statistical testing and evaluations of errors in the model. The scenario model depicted in Figure 3 is an example of a scenario model. A representation of the hyper-parameter parameters that are involved in the GEP and MEP models is shown in Table 3.

Comprehensive study approach overview.
Standardized MEP/GEP model factors
| MEP | GEP | ||
|---|---|---|---|
| Hyper-parameters | Settings | Hyper-parameters | Settings |
| Terminal set | Problem input | Data type | Floating number |
| Cross over probability | 0.9 | Constant per gene | 10 |
| Num. of generations | 300 | Two-point recombination rate | 0.00277 |
| Sub-population size | 150 | Head size | 10 |
| Mutation probability | 0.01 | Stumbling mutation | 0.00141 |
| Operators/variables | 0.5 | Inversion rate | 0.00546 |
| Number of generations | 450 | Mutation rate | 0.00138 |
| Number of treads | 2 | Linking function | Addition |
| Error | MSE, MAE | Genes | 6 |
| Problem type | Regression | General | CS |
| Code length | 30 | Chromosomes | 250 |
| Replication number | 15 | Lower bound | −10 |
| Number of runs | 15 | Leaf mutation | 0.00546 |
| Number of sub-populations | 60 | Upper bound | 10 |
| Function set | +, −, ×, ÷, power, square root | One-point recombination rate | 0.00277 |
| Gene recombination rate | 0.00277 | ||
| One-point recombination rate | 0.00277 | ||
| Function set | +, −, ×, ÷, power, square root | ||
| RIS transposition rate | 0.00546 | ||
| Random chromosomes | 0.0026 | ||
2.2.1 GEP model
Holland invented the genetic algorithm (GA), commonly referred to as the GA, based on Darwin’s theory of evolution. This algorithm simulates the process of natural selection to solve optimization problems by evolving solutions over generations, mimicking the survival of the fittest [62]. A sequence of GAs represents the genomic process, which ends with consistent-length chromosomes. A new GA called “gene programming (GP)” by Koza [63]. GP uses GAs to generate an evolutionary model, which is a general method for problem resolution [64]. The adaptability of GP is derived from its capacity to replace binary characters of arbitrary length with nonlinear structures, such as parse trees of varying lengths. The current AI system, in keeping with Darwin’s hypothesis [65], uses naturally existing genomic components (such as reproduction, crossover, and alteration) to handle reproduction concerns. Replanting the area using our preferred method makes use of the trees that remain after removing the ones that will not function, just as in the previous case. Early convergence is protected by evolution, though [65,66]. Prior to implementing the GP methodology, it is essential to identify the following four factors: significant field activities, fitness evaluation, core purposeful operators (such as population extent and crossover), and results from method-specific endpoints [65]. Despite GP’s recurring model construction, a crossover genetic processor handles most of the parse tree creation [48]. Nonlinear GP forms must fulfill the dual role of genotype and phenotype, resulting in increased complexity in the expressions for desired traits [66].
GP was initially proposed by Candida Ferreira, who also invented GEP. This method enhances traditional GP by encoding programs as linear chromosomes, which are then expressed as tree structures, improving the efficiency and capability of the evolutionary process [66]. GEP modeling employs parse trees and static-length lined chromosomes based on population generation theory. By using basic, fixed-length chromosomes, the extended GP, also known as GEP, encrypts software of intermediate size. In order to forecast complex and nonlinear issues, one can use GEP to create equations [67,68]. Similar to GP, the circumstances for termination, the final set, and the fitness function are all supplied. The GEP method utilizes random numbers to generate chromosomes, which are then identified as such using the “Karva” dialectal before they are manufactured. The fundamental principle of GEP is a line that maintains a constant length. Conversely, the code dispensation of data that GP performs presents parse trees of variable lengths. Beginning with their definition as static-length genomes, these individual cords thereafter depict chromosomes through the use of nonlinear manifestation/parse trees characterized by pronged morphologies of varying sizes [65]. Different genetic codes are present in these genotypes and phenol strains [34]. GEP safeguards the genome across generations, thereby eradicating expensive structural transformations and replications. GEP chromosomes are uniquely structured with a “head” and a “tail,” allowing them to produce complex multi-gene expressions from a single chromosome. This efficient structure enhances the algorithm’s capability to evolve sophisticated solutions [65]. Mathematical, arithmetic, logical, and Boolean instructions are provided by these genes. Activators connect genetic instructions to their corresponding cell functions. Equations based on empirical data are now possible because of a new language called Karva, which can decipher these chromosomes. Following the expression tree (ET), a prominent revolutionary starts their journey at Karva. By using Eq. (1), ET assigns nodes to the underlying layer [67]. The extent and length of GEP gene K-expression can be influenced by the overall quantity of ETs
where
As an advanced ML method, GEP is able to function without prior associations. Figure 4 shows the many stages involved in creating GEP mathematical equations. Each cell possesses an equal amount of chromosomes from the moment of birth. In order to assess the health of individuals, it is necessary to verify the certification of these chromosomes as ETs. Only persons who possess the highest level of physical fitness and health are capable of reproducing. Optimal outcomes are achieved when highly accomplished individuals engage in an iterative process. The final result is the product of three generations of breeding, mutation, and crossover.
![Figure 4
Process flow diagram for the GEP method [23].](/document/doi/10.1515/rams-2024-0068/asset/graphic/j_rams-2024-0068_fig_004.jpg)
Process flow diagram for the GEP method [23].
2.2.2 MEP model
Due to the fact that it makes use of linear chromosomes, the MEP is considered to be a demonstrative linear-based GP approach that is very advanced. The capability of MEP to encode several software options into a single chromosome is what differentiates it from other variants of the GP technique. With the help of fitness analysis, the result is achieved by selecting the chromosome that is most suitable [69,70]. This is what happens when a bipolar system couples twice, which results in the creation of two new generations, as Oltean and Grosan explain themselves. Each generation acquires a parent for themselves [71]. The process will continue to operate until the optimal software is identified, which occurs prior to the termination condition, as illustrated in Figure 5. When it comes to MEP, fitness analysis is vital for assessing the efficacy of evolving mathematical expressions used to fit datasets. By comparing the actual and desired results of a program, the fitness function finds the optimal set of chromosomes to reproduce. By utilizing selection, crossover, and mutation, MEP promotes fit programs. The algorithm can be trained to stay within predefined parameters by using iterative approaches to stop when the fitness level, number of generations, or improvement limit is reached. Evolution alters linear chromosomal elements through mutations in MEP. Variation in population genetics is enhanced by small chromosomal program mutations. Unique solutions are made possible by mutations that start early in the MEP optimization process and affect the genetic material of future generations. With mutations, the algorithm becomes better at adapting to fitness landscapes and searching solution spaces. Component merging is possible in the MEP model as it is in other ML paradigms. When engaging in MEP, it is crucial to take into account factors such as the algorithm or code length, the number of functions, the frequency of crossover, and the number of subpopulation [72]. When there are as many people as there are packages, it becomes more tedious and time-consuming to evaluate the population. As the code length grows, so does the size of the resulting mathematical expressions. Table 3 presents a comprehensive inventory of MEP characteristics that are necessary for constructing a reliable mechanical property model.
![Figure 5
Methodology of the MEP flowchart [23].](/document/doi/10.1515/rams-2024-0068/asset/graphic/j_rams-2024-0068_fig_005.jpg)
Methodology of the MEP flowchart [23].
It is usual practice to use literature data sets during the evaluation and modeling stages of the MEP approach [73,74]. Several scholars have contended that widely used linear genetic programming techniques, such as the MEP, are more effective in predicting practical and tangible attributes. Grosan and Abraham came to the conclusion that the most successful technique based on neural networks was the combination of linear genomic programming and maximum likelihood estimation (MLP) [75]. The GEP’s operational mode is marginally more advanced than the MEP’s [72]. Although MEP has a lesser density than GEP, there are significant alterations between the two: (1) MEP allows for the processing of code again; (2) non-coding components, which are surrounded by chromosomes, do not need to be shown in a precise location; and (3) it explicitly represents references to function parameters. [76]. Programs with precise syntax can be easily created because of the clear instructions found in the “tail” and “head” of a typical GEP gene. As a result, numerous individuals have the belief that the GEP possesses improved capabilities [71]. A more in-depth analysis of each of these genetic methods to engineering difficulties is required as a result of this finding.
2.3 Validation of models
In order to conduct statistical analysis on the models that were developed with the help of GEP and MEP, a test set was utilized. The calculated metrics for each model include the Pearson’s correlation coefficient (R), mean absolute percentage error (MAPE), relative root mean square error (RRMSE), relative squared error (RSE), Nash–Sutcliffe efficiency (NSE), root mean square error (RMSE), and mean absolute error (MAE) [74,77,78,79,80]. MAE measures the average magnitude of errors in predictions. RRMSE is a normalized version of RMSE, making it unit-independent. MAPE expresses errors as a percentage, providing insight into relative accuracy. RMSE (root mean square error) emphasizes larger errors due to squaring. NSE compares model performance to the mean of observed data. R indicates the strength and direction of the linear relationship between observed and predicted values. RSE measures the proportion of variance unexplained by the model [81,82]. Using all these metrics provides a comprehensive evaluation of different aspects of model performance, helping to understand accuracy, bias, and error distribution. From Eqs. (2) to (8), the formulas for a variety of statistical indicators are provided.
The actual and predicted values for the ith data point are denoted by
Statistical validation is a powerful tool for assessing a model’s ability to predict and another is to use a Taylor diagram. By comparing the models’ deviations from the truth or the point of reference, this figure is helpful for analyzing the correctness and trustworthiness of the models based on the data [89,90]. The x- and y-axes indicate the standard deviation, the radial lines show the correlation coefficient, and the circular lines pinpointed at the real value point show the root-mean-squared error. These three metrics can be used to evaluate the ideal position of a model. The most trustworthy model is the one with the best forecast accuracy [89].
3 Research outcomes and scrutiny
3.1 CS-GEP model
Figure 6(a)–(d) presents the results of models created utilizing the GEP method. These models utilize ETs to estimate CS based on mathematical relationships derived from genomic frequency and head size. An Expression Tree is a hierarchical structure representing mathematical expressions, where each node corresponds to a function or operation, allowing the GEP method to explore and optimize complex equations that best fit the data. Most of the sub-ETs in the AAM’s CS models were built utilizing numerical operations such as division, multiplication, subtraction, addition, exponentiation, and square roots. The output of encoding these sub-ETs with the GEP method is an arithmetic formula. Using input data, these formulas can estimate the future CS of AAMs, as shown in Eq. (9). The resultant model can beat an ideal model in ideal circumstances given enough data. In Figure 7(a), a compact black line denotes an impeccable match to the data, whereas dotted red and green lines, respectively, reveal 10 and 20% deviations from the perfect match. The expected and experimental CS values are compared in this graphic to determine how well they line up. The values of CS that were predicted by the GEP model were very similar to the values that were measured. In the process of estimating the CS of AAMs, the GEP technique was shown to be highly effective. It achieved an R 2 value of 0.953 and predicted values within the 10 and 20% thresholds 72 and 97% of the time, respectively, suggesting a significant improvement in accuracy. The potential mismatch between the GEP model and the experimental results is illustrated in Figure 7(b), which is a graph that plots the experimental data against the absolute error. With an average absolute error of 3.95 MPa and a range that goes from 0.04 to 15.85 MPa, the results showed that the predictions made by the GEP equation are in good agreement with the facts that were obtained through experimentation. The distribution of the error values is bell-shaped, as seen in Figure 8. The strength measurements range from 22 values below 1.0 MPa to 37 values above 5.0 MPa, with 68 values between 1.0 and 5.0 MPa. It is important to note that maximal error frequencies are quite rare.
where RT: reactivity, Ag: aggregate volumetric ratio, Ms: silicate modulus (SiO2/Na2O), GPV: geopolymer paste volume to total concrete ratio, LBR: liquid-to-binder volumetric ratio, SHC: sodium hydroxide concentration, SSA: specific surface area, Adm: admixture volumetric ratio, and CS: compressive strength.

CS-GEP expression tree schematic, where d0: RT, d1: SSA, d2: Ms, d3: SHC, d4: LBR, d5: GPV, d6: Ag, d7: Adm.C0: 8.799, C1: −3.415, C4: 6.756, C5: −8.392, C6: −5.125, and C9: −3.436.

CS-AAM’s GEP model: (a) predicted-test CS connection and (b) error distribution.

Error analysis with a violin plot.
3.2 CS-MEP model
In order to determine the CS of AAMs, a mathematical formula was developed using empirical data from the MEP experiments. This model takes into account the effects of the eight independent factors. Eq. (10) presents the ultimate mathematical equation set that was developed through modeling
where RT: reactivity, Ag: aggregate volumetric ratio, Ms: silicate modulus (SiO2/Na2O), GPV: geopolymer paste volume to total concrete ratio, LBR: liquid-to-binder volumetric ratio, SHC: sodium hydroxide concentration, SSA: specific surface area, Adm: admixture volumetric ratio, CS: compressive strength.
Figure 9(a) demonstrates the durability of the MEP model against oversimplification and its high level of training, as evidenced by an exceptional R² value of 0.970. Furthermore, it demonstrates a reasonable level of performance when applied to previously untested data. The CS-MEP model demonstrates higher accuracy compared to the CS-GEP model, as demonstrated by its improved R² value. The solid black line in Figure 9(a) represents a complete alignment with the data, whereas the dashed red and green lines indicate deviations of 10 and 20% from this line, respectively. The recorded CS values closely corresponded to the estimation of the MEP model. The MEP method effectively determined the CS (confidence score) of AAMs (advanced analytical models), with predictions falling under the 10% criterion 94.4% of the time and within the 20% threshold 100% of the time, highlighting its outstanding accuracy.

CS-AAM’s MEP model: (a) predicted-test CS connection and (b) error distribution.
Figure 9(b) displays the results of the study, carried out in MEP simulations, of the absolute disparities between the target and observed values. The data provided indicates that MEP forecasts exhibit an average error margin of 1.97 MPa, with errors ranging from 0.01 to 5.66 MPa. Additionally, the mean error values remain below 5.66 MPa, with 22 values falling below 1.0 MPa, 68 values ranging from 1.0 to 5.0 MPa, and 37 values exceeding 5.0 MPa. For instance, when looking at outlier values, the MEP model shows less fluctuation in outcomes than the GEP model. Models developed using MEP and GEP have the makings of excellent predictors. However, applying the MEP equation leads to smaller error standard deviations and correlation coefficients. The MEP equation’s adaptability and brevity have made it quite popular. Figure 10 shows that the MEP model has a lower error level and a higher correlation coefficient than the GEP model, suggesting that it is the superior model.
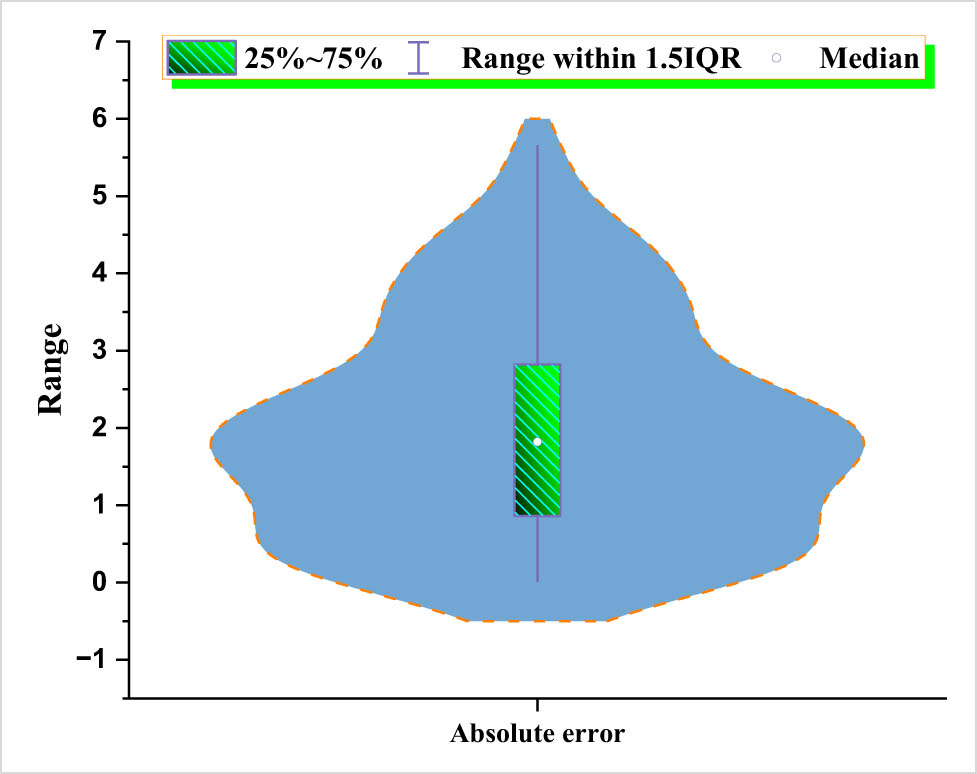
Error analysis with a violin plot.
3.3 Model’s validation
Calculations for efficacy and error, including R, RMSE, MAE, RRMSE, RSE, NSE, and those derived from Eqs. (2) to (8), are summarized in Table 4. Higher accuracy in model predictions is associated with smaller error values. Notably, the CS-MEP model surpasses its CS-GEP counterpart, with a substantial reduction in MAE from 3.954 to 1.968 MPa, and a substantial decrease in the MAPE value from 8.40 to 4.20%. Further measures that are based on errors show a consistent pattern, such as RRMSE, RSE, and RMSE. When matching both the models’ efficiency, the CS-MEP model performs better with a slightly higher Nash–Sutcliffe efficiency (0.980) than the CS-GEP model (0.970), as measured by Pearson’s coefficient (R). Pearson’s coefficient (R) yields comparable results for both models. As shown in Figure 11, the Taylor diagram presents a comprehensive comparison of all forecasting models, highlighting MEP models’ proximity in predicting the CS of AAMs, while GEP models demonstrate relatively distant predictions. With its minimal standard deviation, maximum efficiency, lowest error, and highest R² value, the MEP model emerges as the most accurate ML-based technique for predicting the CS of AAMs, consistent with previous research findings.
Statistical analysis results
| Property | CS (MPa) | |
|---|---|---|
| GEP | MEP | |
| MAE | 3.954 | 1.968 |
| MAPE | 8.400 | 4.200 |
| RMSE | 5.035 | 2.411 |
| R | 0.977 | 0.985 |
| RSE | 0.286 | 0.244 |
| NSE | 0.970 | 0.980 |
| RRMSE | 0.732 | 0.552 |

Models validating employing Taylor’s diagram.
3.4 Sensitivity investigation
This study investigates the impact of input parameters on the prediction of AAM CS. There is a significant link between the input components and the projected output [91]. A look into the future of concrete and construction materials is offered in Figure 12, which sheds light on the effect of each variable on the CS of AAMs. Among the factors examined, the SSA exerts the highest impact, accounting for 28% of the variability in forecasting the CS of AAMs, followed by the aggregate volumetric ratio at 25.0%, silicate modulus at 17.0%, SHC at 9.5%, RT at 9.0%, LBR ratio at 6.0%, geopolymer paste volume to total concrete ratio at 3.5%, and admixture volumetric ratio at 2%. The outcomes were significantly influenced by the quantity of model parameters and data points incorporated in the sensitivity analysis. Notably, when the ML technique was used, the results of the study were affected in different ways by different input parameters, such as the amounts of concrete mixes. In order to establish the weight of each input parameter to the model, we used Eqs. (11) and (12)
where

Radar plot for sensitivity assessments.
4 Discussions
Using the MEP and GEP models that were applied in this research, predictions that take AAMs into consideration are arrived at. A narrow range of eight input parameters is all that these models can accommodate. Consistency in unit measurements and testing techniques across all models enhances the reliability of the CS predictions they generate. By using mathematical equations, the models gain a better understanding of the mix design and the effect of every input variable. However, if there are more than eight variables in the composite assessment, the models may not perform effectively. It is crucial for the intended purpose of the models to align closely with the inputs used for their training to achieve expected results. Inconsistencies or changes in unit sizes of input parameters can lead to under- or over-predictions by the models, underscoring the importance of maintaining uniform unit measurements. ML models are highly dependent on the input parameters and the values or figures present in the dataset, which are influenced by the units used. Altering any of these factors can lead to significant changes in the model’s outcomes and performance. Consequently, even minor adjustments to the dataset can impact the accuracy and reliability of the predictions, underscoring the importance of careful data preparation and unit consistency in developing robust models. ML models have both advantages and disadvantages for the construction sector. On the one hand, they can improve energy efficiency, estimate material strength, guarantee quality, assess risk, and carry out predictive maintenance. On the other hand, they pose certain obstacles. The use of human input, which is susceptible to errors and erroneous data, is one such obstacle. Integrating Internet of Things strategies, developing cross models, employing explicable artificial intelligence approaches, considering sustainability, and tailoring data collection and dissemination for explicit industries are all potential future research topics that might be pursued in order to enhance ML-based solutions and overcome the constraints that have been identified. Modern technology has the capacity to transform the construction sector by augmenting efficiency, facilitating the comprehension and transparency of data, and enabling workers to make educated decisions. Consequently, this should result in a reduction in project delays, improved safety, and increased sustainability. More widespread use of sustainable, environmentally friendly materials and a shift toward more environmentally friendly building practices could result from the findings of this study. Figure 13 shows that ML has many real-world engineering uses.

Civil engineering ML applications.
5 Conclusions
In order to study and forecast the CS of AAMs, the purpose of this project is to make use of GEP and MEP. Using 381 different sets of CS data, the model was trained, tested, and verified, each comprising eight input parameters derived from laboratory experimental setups. The following are the primary results of the study:
For forecasting the CS of AAMs, the GEP method exhibited a commendable level of accuracy, achieving an R² value of 0.953. However, the MEP method surpassed this, demonstrating even higher precision with an R² value of 0.970.
The GEP approach had an average error of 3.95 MPa in predicting CS, while the MEP method had an average error of 1.97 MPa. The error rates emphasized the precision of the GEP model, while also demonstrating the greater predictive ability of the MEP technique for determining the compressible strength of AAMs.
ML models showed gains in both R² values and error rates, confirming their usefulness through statistical validation. The MAPE for the GEP model was 8.40%, which is greater than the 4.20% shown by the MEP model. Furthermore, when comparing the two models, the MEP model had a better RMSE of 2.411 MPa compared to the GEP model’s 5.035 MPa. These choices further reinforce the validation of the model’s performance across various aspects.
According to the sensitivity analysis, the following factors had the greatest impact on the prediction of CS of AAMs: SSA (28.0%), aggregate volumetric ratio (25.0%), silicate modulus (17.0%), SHC (9.5%), RT (9.0%), LBR (6.0%), geopolymer paste volume to total concrete ratio (3.5%), and additive volumetric ratio (2%).
To enhance the reliability and performance of ML models, programs should be developed to ensure consistent results across varying dataset units, making the models unit independent. Additionally, incorporating robust cross-validation techniques and optimizing feature selection can further improve model accuracy and generalizability.
Acknowledgments
The authors acknowledge the Deanship of Scientific Research, Vice Presidency for Graduate Studies and Scientific Research, King Faisal University, Saudi Arabia (Grant No. KFU242151). The authors extend their appreciation for the financial support that made this study possible.
-
Funding information: This work was supported by the Deanship of Scientific Research, Vice Presidency for Graduate Studies and Scientific Research, King Faisal University, Saudi Arabia (Grant No. KFU242151).
-
Author contributions: X.Y.: conceptualization, supervision, formal analysis, resources, writing-original draft. T.W.: data acquisition, validation, resources, visualization, writing, reviewing, and editing. M.N.A.: funding acquisition, investigation, conceptualization, project administration, writing, reviewing, and editing. A.H.A.: validation, investigation, resources, writing, reviewing, and editing. S.A.K.: software, supervision, validation, formal analysis, writing-original draft, reviewing, and editing. M.T.Q.: investigation, project administration, writing, reviewing, and editing. M.F.J.: methodology, formal analysis, writing, reviewing, and editing. All authors have accepted responsibility for the entire content of this manuscript and approved its submission.
-
Conflict of interest: The authors state no conflict of interest.
-
Data availability statement: The datasets generated and/or analyzed during the current study are available from the corresponding author upon reasonable request.
References
[1] Castro-Alonso, M. J., L. E. Montañez-Hernandez, M. A. Sanchez-Muñoz, M. R. Macias Franco, R. Narayanasamy, and N. Balagurusamy. Microbially induced calcium carbonate precipitation (MICP) and its potential in bioconcrete: microbiological and molecular concepts. Frontiers in Materials, Vol. 6, 2019, id. 126.10.3389/fmats.2019.00126Search in Google Scholar
[2] Habert, G., S. A. Miller, V. M. John, J. L. Provis, A. Favier, A. Horvath, et al. Environmental impacts and decarbonization strategies in the cement and concrete industries. Nature Reviews Earth and Environment, Vol. 1, 2020, pp. 559–573.10.1038/s43017-020-0093-3Search in Google Scholar
[3] Poudyal, L. and K. Adhikari. Environmental sustainability in cement industry: An integrated approach for green and economical cement production. Resources, Environment and Sustainability, Vol. 4, 2021, id. 100024.10.1016/j.resenv.2021.100024Search in Google Scholar
[4] Nazar, S., J. Yang, M. N. Amin, M. Husnain, F. Ahmad, H. Alabduljabbar, et al. Investigating the influence of PVA and PP fibers on the mechanical, durability, and microstructural properties of one-part alkali-activated mortar: an experimental study. Journal of Materials Research and Technology, Vol. 25, 2023, pp. 3482–3495.10.1016/j.jmrt.2023.06.115Search in Google Scholar
[5] Nazar, S., J. Yang, M. Ashraf, F. Aslam, M. F. Javed, S. M. Eldin, et al. Formulation and characterization of cleaner one-part novel fly ash/lime-based alkali-activated material. Journal of Materials Research and Technology, Vol. 23, 2023, pp. 3821–3839.10.1016/j.jmrt.2023.02.022Search in Google Scholar
[6] Gökçe, H. S., M. Tuyan, and M. L. Nehdi. Alkali-activated and geopolymer materials developed using innovative manufacturing techniques: A critical review. Construction and Building Materials, Vol. 303, 2021, id. 124483.10.1016/j.conbuildmat.2021.124483Search in Google Scholar
[7] Siddique, S. and J. G. Jang. Acid and sulfate resistance of seawater based alkali activated fly ash: A sustainable and durable approach. Construction and Building Materials, Vol. 281, 2021, id. 122601.10.1016/j.conbuildmat.2021.122601Search in Google Scholar
[8] Kim, T. Characteristics of alkali-activated slag cement-based ultra-lightweight concrete with high-volume cenosphere. Construction and Building Materials, Vol. 302, 2021, id. 124165.10.1016/j.conbuildmat.2021.124165Search in Google Scholar
[9] Sun, K., X. Peng, S. Wang, L. Zeng, P. Ran, and G. Ji. Effect of nano-SiO2 on the efflorescence of an alkali-activated metakaolin mortar. Construction and Building Materials, Vol. 253, 2020, id. 118952.10.1016/j.conbuildmat.2020.118952Search in Google Scholar
[10] He, J., Y. Jie, J. Zhang, Y. Yu, and G. Zhang. Synthesis and characterization of red mud and rice husk ash-based geopolymer composites. Cement and Concrete Composites, Vol. 37, 2013, pp. 108–118.10.1016/j.cemconcomp.2012.11.010Search in Google Scholar
[11] Provis, J. L. and J. S. J. Van Deventer. Alkali activated materials: state-of-the-art report, RILEM TC 224-AAM, Vol. 13, Springer Science & Business Media, Heidelberg, Germany, 2013.10.1007/978-94-007-7672-2Search in Google Scholar
[12] Tian, X., F. Rao, R. Morales-Estrella, and S. Song. Effects of aluminum dosage on gel formation and heavy metal immobilization in alkali-activated municipal solid waste incineration fly ash. Energy & Fuels, Vol. 34, 2020, pp. 4727–4733.10.1021/acs.energyfuels.9b04493Search in Google Scholar
[13] Nodehi, M. and V. M. Taghvaee. Alkali-activated materials and geopolymer: A review of common precursors and activators addressing circular economy. Circular Economy and Sustainability, Vol. 2, 2022, pp. 165–196.10.1007/s43615-021-00029-wSearch in Google Scholar
[14] Kumarappa, D. B., S. Peethamparan, and M. Ngami. Autogenous shrinkage of alkali activated slag mortars: Basic mechanisms and mitigation methods. Cement and Concrete Research, Vol. 109, 2018, pp. 1–9.10.1016/j.cemconres.2018.04.004Search in Google Scholar
[15] Provis, J. L. Alkali-activated materials. Cement and Concrete Research, Vol. 114, 2018, pp. 40–48. 10.1016/j.cemconres.2017.02.009.Search in Google Scholar
[16] Arbi, K., M. Nedeljkovic, Y. Zuo, and G. Ye. A review on the durability of alkali-activated fly ash/slag systems: advances, issues, and perspectives. Industrial and Engineering Chemistry Research, Vol. 55, 2016, pp. 5439–5453.10.1021/acs.iecr.6b00559Search in Google Scholar
[17] Tong, S., Z. Yuqi, and W. Qiang. Recent advances in chemical admixtures for improving the workability of alkali-activated slag-based material systems. Construction and Building Materials, Vol. 272, 2021, id. 121647.10.1016/j.conbuildmat.2020.121647Search in Google Scholar
[18] Amin, M. N., S. A. Khan, A. A. Alawi Al-Naghi, E. R. Latifee, N. Alnawmasi, and A. F. Deifalla. Low-carbon embodied alkali-activated materials for sustainable construction: A comparative study of single and ensemble learners. Reviews on Advanced Materials Science , Vol. 63, 2024, id. 20230162.10.1515/rams-2023-0162Search in Google Scholar
[19] Yang, K.-H., A.-R. Cho, and J.-K. Song. Effect of water–binder ratio on the mechanical properties of calcium hydroxide-based alkali-activated slag concrete. Construction and Building Materials, Vol. 29, 2012, pp. 504–511.10.1016/j.conbuildmat.2011.10.062Search in Google Scholar
[20] Xie, J., J. Wang, R. Rao, C. Wang, and C. Fang. Effects of combined usage of GGBS and fly ash on workability and mechanical properties of alkali activated geopolymer concrete with recycled aggregate. Composites Part B: Engineering, Vol. 164, 2019, pp. 179–190.10.1016/j.compositesb.2018.11.067Search in Google Scholar
[21] Puertas, F., S. Martı́nez-Ramı́rez, S. Alonso, and T. Vázquez. Alkali-activated fly ash/slag cements: Strength behaviour and hydration products. Cement and Concrete Research, Vol. 30, 2000, pp. 1625–1632.10.1016/S0008-8846(00)00298-2Search in Google Scholar
[22] Amin, M. N., H. A. Alkadhim, W. Ahmad, K. Khan, H. Alabduljabbar, and A. Mohamed. Experimental and machine learning approaches to investigate the effect of waste glass powder on the flexural strength of cement mortar. PloS One, Vol. 18, 2023, id. e0280761.10.1371/journal.pone.0280761Search in Google Scholar PubMed PubMed Central
[23] Amin, M. N., W. Ahmad, K. Khan, and A. F. Deifalla. Optimizing compressive strength prediction models for rice husk ash concrete with evolutionary machine intelligence techniques. Case Studies in Construction Materials, Vol. 18, 2023, id. e02102.10.1016/j.cscm.2023.e02102Search in Google Scholar
[24] Ma, H., J. Liu, J. Zhang, and J. Huang. Estimating the compressive strength of cement-based materials with mining waste using support vector machine, decision tree, and random forest models. Advances in Civil Engineering, Vol. 2021, 2021, pp. 1–10.10.1155/2021/6629466Search in Google Scholar
[25] Chu, H.-H., M. A. Khan, M. Javed, A. Zafar, M. I. Khan, H. Alabduljabbar, et al. Sustainable use of fly-ash: Use of gene-expression programming (GEP) and multi-expression programming (MEP) for forecasting the compressive strength geopolymer concrete. Ain Shams Engineering Journal, Vol. 12, 2021, pp. 3603–3617.10.1016/j.asej.2021.03.018Search in Google Scholar
[26] Faraz, M. I., S. U. Arifeen, M. N. Amin, A. Nafees, F. Althoey, and A. Niaz. A comprehensive GEP and MEP analysis of a cement-based concrete containing metakaolin. Structures, Vol. 53, 2023, pp. 937–948.10.1016/j.istruc.2023.04.050Search in Google Scholar
[27] Aydın, S. and B. Baradan. Effect of activator type and content on properties of alkali-activated slag mortars. Composites Part B: Engineering, Vol. 57, 2014, pp. 166–172.10.1016/j.compositesb.2013.10.001Search in Google Scholar
[28] Rovnaník, P. Effect of curing temperature on the development of hard structure of metakaolin-based geopolymer. Construction and Building Materials, Vol. 24, 2010, pp. 1176–1183.10.1016/j.conbuildmat.2009.12.023Search in Google Scholar
[29] Marani, A., A. Jamali, and M. L. Nehdi. Predicting ultra-high-performance concrete compressive strength using tabular generative adversarial networks. Materials, Vol. 13, 2020, id. 4757.10.3390/ma13214757Search in Google Scholar PubMed PubMed Central
[30] Marani, A. and M. L. Nehdi. Machine learning prediction of compressive strength for phase change materials integrated cementitious composites. Construction and Building Materials, Vol. 265, 2020, id. 120286.10.1016/j.conbuildmat.2020.120286Search in Google Scholar
[31] Nunez, I., A. Marani, and M. L. Nehdi. Mixture optimization of recycled aggregate concrete using hybrid machine learning model. Materials, Vol. 13, 2020, id. 4331.10.3390/ma13194331Search in Google Scholar PubMed PubMed Central
[32] Zhang, J., Y. Huang, F. Aslani, G. Ma, and B. Nener. A hybrid intelligent system for designing optimal proportions of recycled aggregate concrete. Journal of Cleaner Production, Vol. 273, 2020, id. 122922.10.1016/j.jclepro.2020.122922Search in Google Scholar
[33] Zhang, J., D. Li, and Y. Wang. Toward intelligent construction: Prediction of mechanical properties of manufactured-sand concrete using tree-based models. Journal of Cleaner Production, Vol. 258, 2020, id. 120665.10.1016/j.jclepro.2020.120665Search in Google Scholar
[34] Rajasekar, A., K. Arunachalam, and M. Kottaisamy. Assessment of strength and durability characteristics of copper slag incorporated ultra high strength concrete. Journal of Cleaner Production, Vol. 208, 2019, pp. 402–414.10.1016/j.jclepro.2018.10.118Search in Google Scholar
[35] Naseri, H., H. Jahanbakhsh, P. Hosseini, and F. M. Nejad. Designing sustainable concrete mixture by developing a new machine learning technique. Journal of Cleaner Production, Vol. 258, 2020, id. 120578.10.1016/j.jclepro.2020.120578Search in Google Scholar
[36] Young, B. A., A. Hall, L. Pilon, P. Gupta, and G. Sant. Can the compressive strength of concrete be estimated from knowledge of the mixture proportions?: New insights from statistical analysis and machine learning methods. Cement and Concrete Research, Vol. 115, 2019, pp. 379–388.10.1016/j.cemconres.2018.09.006Search in Google Scholar
[37] Yang, K.-H., J.-K. Song, K.-S. Lee, and A. Ashour. Flow and compressive strength of alkali-activated mortars. ACI Materials Journal, Vol 106, No. 1, 2009, pp. 50–58.10.14359/56316Search in Google Scholar
[38] Yang, K.-H. and J.-K. Song. Workability loss and compressive strength development of cementless mortars activated by combination of sodium silicate and sodium hydroxide. Journal of Materials in Civil Engineering, Vol. 21, 2009, pp. 119–127.10.1061/(ASCE)0899-1561(2009)21:3(119)Search in Google Scholar
[39] Pacheco-Torgal, F., D. Moura, Y. Ding, and S. Jalali. Composition, strength and workability of alkali-activated metakaolin based mortars. Construction and Building Materials, Vol. 25, 2011, pp. 3732–3745.10.1016/j.conbuildmat.2011.04.017Search in Google Scholar
[40] Jang, J. G., N. K. Lee, and H.-K. Lee. Fresh and hardened properties of alkali-activated fly ash/slag pastes with superplasticizers. Construction and Building Materials, Vol. 50, 2014, pp. 169–176.10.1016/j.conbuildmat.2013.09.048Search in Google Scholar
[41] Nath, P. and P. K. Sarker. Effect of GGBFS on setting, workability and early strength properties of fly ash geopolymer concrete cured in ambient condition. Construction and Building Materials, Vol. 66, 2014, pp. 163–171.10.1016/j.conbuildmat.2014.05.080Search in Google Scholar
[42] Nematollahi, B. and J. Sanjayan. Effect of different superplasticizers and activator combinations on workability and strength of fly ash based geopolymer. Materials & Design, Vol. 57, 2014, pp. 667–672.10.1016/j.matdes.2014.01.064Search in Google Scholar
[43] Gao, X., Q. L. Yu, and H. J. H. Brouwers. Properties of alkali activated slag–fly ash blends with limestone addition. Cement and Concrete Composites, Vol. 59, 2015, pp. 119–128.10.1016/j.cemconcomp.2015.01.007Search in Google Scholar
[44] Gao, X., Q. L. Yu, and H. J. H. Brouwers. Characterization of alkali activated slag–fly ash blends containing nano-silica. Construction and Building Materials, Vol. 98, 2015, pp. 397–406.10.1016/j.conbuildmat.2015.08.086Search in Google Scholar
[45] Nadoushan, M. J. and A. A. Ramezanianpour. The effect of type and concentration of activators on flowability and compressive strength of natural pozzolan and slag-based geopolymers. Construction and Building Materials, Vol. 111, 2016, pp. 337–347.10.1016/j.conbuildmat.2016.02.086Search in Google Scholar
[46] Gao, X., Q. L. Yu, and H. J. H. Brouwers. Assessing the porosity and shrinkage of alkali activated slag-fly ash composites designed applying a packing model. Construction and Building Materials, Vol. 119, 2016, pp. 175–184.10.1016/j.conbuildmat.2016.05.026Search in Google Scholar
[47] Nedeljković, M., Z. Li, and G. Ye. Setting, strength, and autogenous shrinkage of alkali-activated fly ash and slag pastes: Effect of slag content. Materials, Vol. 11, 2018, id. 2121.10.3390/ma11112121Search in Google Scholar PubMed PubMed Central
[48] Fang, G., W. K. Ho, W. Tu, and M. Zhang. Workability and mechanical properties of alkali-activated fly ash-slag concrete cured at ambient temperature. Construction and Building Materials, Vol. 172, 2018, pp. 476–487.10.1016/j.conbuildmat.2018.04.008Search in Google Scholar
[49] Najimi, M., N. Ghafoori, and M. Sharbaf. Alkali-activated natural pozzolan/slag mortars: A parametric study. Construction and Building Materials, Vol. 164, 2018, pp. 625–643.10.1016/j.conbuildmat.2017.12.222Search in Google Scholar
[50] Ramezanianpour, A. A. and M. A. Moeini. Mechanical and durability properties of alkali activated slag coating mortars containing nanosilica and silica fume. Construction and Building Materials, Vol. 163, 2018, pp. 611–621.10.1016/j.conbuildmat.2017.12.062Search in Google Scholar
[51] Ibrahim, M., M. A. M. Johari, M. Maslehuddin, and M. K. Rahman. Influence of nano-SiO2 on the strength and microstructure of natural pozzolan based alkali activated concrete. Construction and Building Materials, Vol. 173, 2018, pp. 573–585.10.1016/j.conbuildmat.2018.04.051Search in Google Scholar
[52] Oderji, S. Y., B. Chen, M. R. Ahmad, and S. F. A. Shah. Fresh and hardened properties of one-part fly ash-based geopolymer binders cured at room temperature: Effect of slag and alkali activators. Journal of Cleaner Production, Vol. 225, 2019, pp. 1–10.10.1016/j.jclepro.2019.03.290Search in Google Scholar
[53] Alanazi, H., J. Hu, and Y.-R. Kim. Effect of slag, silica fume, and metakaolin on properties and performance of alkali-activated fly ash cured at ambient temperature. Construction and Building Materials, Vol. 197, 2019, pp. 747–756.10.1016/j.conbuildmat.2018.11.172Search in Google Scholar
[54] Alrefaei, Y., Y.-S. Wang, and J.-G. Dai. The effectiveness of different superplasticizers in ambient cured one-part alkali activated pastes. Cement and Concrete Composites, Vol. 97, 2019, pp. 166–174.10.1016/j.cemconcomp.2018.12.027Search in Google Scholar
[55] Song, W., Z. Zhu, S. Pu, Y. Wan, X. Xu, S. Song, et al. Multi-technical characterization and correlations between properties of standard cured alkali-activated high-calcium FA binders with GGBS as additive. Construction and Building Materials, Vol. 241, 2020, id. 117996.10.1016/j.conbuildmat.2020.117996Search in Google Scholar
[56] Shah, S. F. A., B. Chen, S. Y. Oderji, M. A. Haque, and M. R. Ahmad. Comparative study on the effect of fiber type and content on the performance of one-part alkali-activated mortar. Construction and Building Materials, Vol. 243, 2020, id. 118221.10.1016/j.conbuildmat.2020.118221Search in Google Scholar
[57] Shah, S. F. A., B. Chen, S. Y. Oderji, M. A. Haque, and M. R. Ahmad. Improvement of early strength of fly ash-slag based one-part alkali activated mortar. Construction and Building Materials, Vol. 246, 2020, id. 118533.10.1016/j.conbuildmat.2020.118533Search in Google Scholar
[58] Alrefaei, Y., Y.-S. Wang, and J.-G. Dai. Effect of mixing method on the performance of alkali-activated fly ash/slag pastes along with polycarboxylate admixture. Cement and Concrete Composites, Vol. 117, 2021, id. 103917.10.1016/j.cemconcomp.2020.103917Search in Google Scholar
[59] Paul, E. Influence of superplasticizer on workability and strength of ambient cured alkali activated mortar. Cleaner Materials, Vol. 6, 2022, id. 100152.10.1016/j.clema.2022.100152Search in Google Scholar
[60] Dheyaaldin, M. H., M. A. Mosaberpanah, and R. Alzeebaree. Performance of fiber-reinforced alkali-activated mortar with/without nano silica and nano alumina. Sustainability, Vol. 14, 2022, id. 2527.10.3390/su14052527Search in Google Scholar
[61] Lee, B. C. and D. M. Brooks. Accurate and efficient regression modeling for microarchitectural performance and power prediction. ACM SIGOPS Operating Systems Review, Vol. 40, 2006, pp. 185–194.10.1145/1168917.1168881Search in Google Scholar
[62] Holland, J. H. Adaptation in natural and artificial systems: an introductory analysis with applications to biology, control, and artificial intelligence, MIT Press, Massachusetts, United States of America, 1992.10.7551/mitpress/1090.001.0001Search in Google Scholar
[63] Koza, J. On the programming of computers by means of natural selection. Genetic programming, 1992.Search in Google Scholar
[64] Gholampour, A., T. Ozbakkaloglu, and R. Hassanli. Behavior of rubberized concrete under active confinement. Construction and Building Materials, Vol. 138, 2017, pp. 372–382.10.1016/j.conbuildmat.2017.01.105Search in Google Scholar
[65] Topcu, I. B. and M. Sarıdemir. Prediction of compressive strength of concrete containing fly ash using artificial neural networks and fuzzy logic. Computational Materials Science, Vol. 41, 2008, pp. 305–311.10.1016/j.commatsci.2007.04.009Search in Google Scholar
[66] Ferreira, C. Gene expression programming: mathematical modeling by an artificial intelligence, Vol. 21, Springer, Berlin, Germany, 2006.10.1007/3-540-32498-4_2Search in Google Scholar
[67] Gandomi, A. H., G. J. Yun, and A. H. Alavi. An evolutionary approach for modeling of shear strength of RC deep beams. Materials and Structures, Vol. 46, 2013, pp. 2109–2119.10.1617/s11527-013-0039-zSearch in Google Scholar
[68] Gandomi, A. H., S. K. Babanajad, A. H. Alavi, and Y. Farnam. Novel approach to strength modeling of concrete under triaxial compression. Journal of Materials in Civil Engineering, Vol. 24, 2012, pp. 1132–1143.10.1061/(ASCE)MT.1943-5533.0000494Search in Google Scholar
[69] Wang, H.-L. and Z.-Y. Yin. High performance prediction of soil compaction parameters using multi expression programming. Engineering Geology, Vol. 276, 2020, id. 105758.10.1016/j.enggeo.2020.105758Search in Google Scholar
[70] Iqbal, M. F., M. F. Javed, M. Rauf, I. Azim, M. Ashraf, J. Yang, et al. Sustainable utilization of foundry waste: Forecasting mechanical properties of foundry sand based concrete using multi-expression programming. Science of The Total Environment, Vol. 780, 2021, id. 146524.10.1016/j.scitotenv.2021.146524Search in Google Scholar PubMed
[71] Oltean, M. and C. Grosan. A comparison of several linear genetic programming techniques. Complex Systems, Vol. 14, 2003, pp. 285–314.Search in Google Scholar
[72] Fallahpour, A., E. U. Olugu, and S. N. Musa. A hybrid model for supplier selection: integration of AHP and multi expression programming (MEP). Neural Computing and Applications, Vol. 28, 2017, pp. 499–504.10.1007/s00521-015-2078-6Search in Google Scholar
[73] Alavi, A. H., A. H. Gandomi, M. G. Sahab, and M. Gandomi. Multi expression programming: a new approach to formulation of soil classification. Engineering with Computers, Vol. 26, 2010, pp. 111–118.10.1007/s00366-009-0140-7Search in Google Scholar
[74] Mohammadzadeh S, D., S.-F. Kazemi, A. Mosavi, E. Nasseralshariati, and J. H. M. Tah. Prediction of compression index of fine-grained soils using a gene expression programming model. Infrastructures, Vol. 4, 2019, id. 26.10.3390/infrastructures4020026Search in Google Scholar
[75] Grosan, C. and A. Abraham. Stock market modeling using genetic programming ensembles. Genetic systems programming: Theory and experiences, Springer, Berlin, Germany, 2006, pp. 131–146.10.1007/11521433_6Search in Google Scholar
[76] Oltean, M. and D. Dumitrescu. Multi expression programming. Journal of Genetic Programming and Evolvable Machines, 2002.Search in Google Scholar
[77] Iqbal, M. F., Q.-f Liu, I. Azim, X. Zhu, J. Yang, M. F. Javed, et al. Prediction of mechanical properties of green concrete incorporating waste foundry sand based on gene expression programming. Journal of Hazardous Materials, Vol. 384, 2020, id. 121322.10.1016/j.jhazmat.2019.121322Search in Google Scholar PubMed
[78] Shahin, M. A. Genetic programming for modelling of geotechnical engineering systems, Springer Nature, Switzerland, 2015.10.1007/978-3-319-20883-1_2Search in Google Scholar
[79] Çanakcı, H., A. Baykasoğlu, and H. Güllü. Prediction of compressive and tensile strength of Gaziantep basalts via neural networks and gene expression programming. Neural Computing and Applications, Vol. 18, 2009, pp. 1031–1041.10.1007/s00521-008-0208-0Search in Google Scholar
[80] Alade, I. O., M. A. Abd Rahman, and T. A. Saleh. Predicting the specific heat capacity of alumina/ethylene glycol nanofluids using support vector regression model optimized with Bayesian algorithm. Solar Energy, Vol. 183, 2019, pp. 74–82.10.1016/j.solener.2019.02.060Search in Google Scholar
[81] Richter, K., T. B. Hank, C. Atzberger, and W. Mauser. Goodness-of-fit measures: what do they tell about vegetation variable retrieval performance from Earth observation data. Remote Sensing for Agriculture, Ecosystems, and Hydrology XIII, Vol. 8174, 2011, pp. 279–289.10.1117/12.897980Search in Google Scholar
[82] Richter, K., C. Atzberger, T. B. Hank, and W. Mauser. Derivation of biophysical variables from Earth observation data: validation and statistical measures. Journal of Applied Remote Sensing, Vol. 6, 2012, id. 063557.10.1117/1.JRS.6.063557Search in Google Scholar
[83] Alade, I. O., A. Bagudu, T. A. Oyehan, M. A. Abd Rahman, T. A. Saleh, and S. O. Olatunji. Estimating the refractive index of oxygenated and deoxygenated hemoglobin using genetic algorithm–support vector regression model. Computer Methods and Programs in Biomedicine, Vol. 163, 2018, pp. 135–142.10.1016/j.cmpb.2018.05.029Search in Google Scholar PubMed
[84] Zhang, W., R. Zhang, C. Wu, A. T. C. Goh, S. Lacasse, Z. Liu, et al. State-of-the-art review of soft computing applications in underground excavations. Geoscience Frontiers, Vol. 11, 2020, pp. 1095–1106.10.1016/j.gsf.2019.12.003Search in Google Scholar
[85] Alavi, A. H., A. H. Gandomi, H. C. Nejad, A. Mollahasani, and A. Rashed. Design equations for prediction of pressuremeter soil deformation moduli utilizing expression programming systems. Neural Computing and Applications, Vol. 23, 2013, pp. 1771–1786.10.1007/s00521-012-1144-6Search in Google Scholar
[86] Kisi, O., J. Shiri, and M. Tombul. Modeling rainfall-runoff process using soft computing techniques. Computers & Geosciences, Vol. 51, 2013, pp. 108–117.10.1016/j.cageo.2012.07.001Search in Google Scholar
[87] Alade, I. O., M. A. Abd Rahman, and T. A. Saleh. Modeling and prediction of the specific heat capacity of Al2 O3/water nanofluids using hybrid genetic algorithm/support vector regression model. Nano-Structures & Nano-Objects, Vol. 17, 2019, pp. 103–111.10.1016/j.nanoso.2018.12.001Search in Google Scholar
[88] Shahin, M. A. Use of evolutionary computing for modelling some complex problems in geotechnical engineering. Geomechanics and Geoengineering, Vol. 10, 2015, pp. 109–125.10.1080/17486025.2014.921333Search in Google Scholar
[89] Band, S. S., E. Heggy, S. M. Bateni, H. Karami, M. Rabiee, S. Samadianfard, et al. Groundwater level prediction in arid areas using wavelet analysis and Gaussian process regression. Engineering Applications of Computational Fluid Mechanics, Vol. 15, 2021, pp. 1147–1158.10.1080/19942060.2021.1944913Search in Google Scholar
[90] Taylor, K. E. Summarizing multiple aspects of model performance in a single diagram. Journal of Geophysical Research: Atmospheres, Vol. 106, 2001, pp. 7183–7192.10.1029/2000JD900719Search in Google Scholar
[91] Ahmad, A., K. A. Ostrowski, M. Maślak, F. Farooq, I. Mehmood, and A. Nafees. Comparative study of supervised machine learning algorithms for predicting the compressive strength of concrete at high temperature. Materials, Vol. 14, 2021, id. 4222.10.3390/ma14154222Search in Google Scholar PubMed PubMed Central
© 2024 the author(s), published by De Gruyter
This work is licensed under the Creative Commons Attribution 4.0 International License.
Articles in the same Issue
- Review Articles
- Effect of superplasticizer in geopolymer and alkali-activated cement mortar/concrete: A review
- Experimenting the influence of corncob ash on the mechanical strength of slag-based geopolymer concrete
- Powder metallurgy processing of high entropy alloys: Bibliometric analysis and systematic review
- Exploring the potential of agricultural waste as an additive in ultra-high-performance concrete for sustainable construction: A comprehensive review
- A review on partial substitution of nanosilica in concrete
- Foam concrete for lightweight construction applications: A comprehensive review of the research development and material characteristics
- Modification of PEEK for implants: Strategies to improve mechanical, antibacterial, and osteogenic properties
- Interfacing the IoT in composite manufacturing: An overview
- Advances in processing and ablation properties of carbon fiber reinforced ultra-high temperature ceramic composites
- Advancing auxetic materials: Emerging development and innovative applications
- Revolutionizing energy harvesting: A comprehensive review of thermoelectric devices
- Exploring polyetheretherketone in dental implants and abutments: A focus on biomechanics and finite element methods
- Smart technologies and textiles and their potential use and application in the care and support of elderly individuals: A systematic review
- Reinforcement mechanisms and current research status of silicon carbide whisker-reinforced composites: A comprehensive review
- Innovative eco-friendly bio-composites: A comprehensive review of the fabrication, characterization, and applications
- Review on geopolymer concrete incorporating Alccofine-1203
- Advancements in surface treatments for aluminum alloys in sports equipment
- Ionic liquid-modified carbon-based fillers and their polymer composites – A Raman spectroscopy analysis
- Emerging boron nitride nanosheets: A review on synthesis, corrosion resistance coatings, and their impacts on the environment and health
- Mechanism, models, and influence of heterogeneous factors of the microarc oxidation process: A comprehensive review
- Synthesizing sustainable construction paradigms: A comprehensive review and bibliometric analysis of granite waste powder utilization and moisture correction in concrete
- 10.1515/rams-2025-0086
- Research Articles
- Coverage and reliability improvement of copper metallization layer in through hole at BGA area during load board manufacture
- Study on dynamic response of cushion layer-reinforced concrete slab under rockfall impact based on smoothed particle hydrodynamics and finite-element method coupling
- Study on the mechanical properties and microstructure of recycled brick aggregate concrete with waste fiber
- Multiscale characterization of the UV aging resistance and mechanism of light stabilizer-modified asphalt
- Characterization of sandwich materials – Nomex-Aramid carbon fiber performances under mechanical loadings: Nonlinear FE and convergence studies
- Effect of grain boundary segregation and oxygen vacancy annihilation on aging resistance of cobalt oxide-doped 3Y-TZP ceramics for biomedical applications
- Mechanical damage mechanism investigation on CFRP strengthened recycled red brick concrete
- Finite element analysis of deterioration of axial compression behavior of corroded steel-reinforced concrete middle-length columns
- Grinding force model for ultrasonic assisted grinding of γ-TiAl intermetallic compounds and experimental validation
- Enhancement of hardness and wear strength of pure Cu and Cu–TiO2 composites via a friction stir process while maintaining electrical resistivity
- Effect of sand–precursor ratio on mechanical properties and durability of geopolymer mortar with manufactured sand
- Research on the strength prediction for pervious concrete based on design porosity and water-to-cement ratio
- Development of a new damping ratio prediction model for recycled aggregate concrete: Incorporating modified admixtures and carbonation effects
- Exploring the viability of AI-aided genetic algorithms in estimating the crack repair rate of self-healing concrete
- Modification of methacrylate bone cement with eugenol – A new material with antibacterial properties
- Numerical investigations on constitutive model parameters of HRB400 and HTRB600 steel bars based on tensile and fatigue tests
- Research progress on Fe3+-activated near-infrared phosphor
- Discrete element simulation study on effects of grain preferred orientation on micro-cracking and macro-mechanical behavior of crystalline rocks
- Ultrasonic resonance evaluation method for deep interfacial debonding defects of multilayer adhesive bonded materials
- Effect of impurity components in titanium gypsum on the setting time and mechanical properties of gypsum-slag cementitious materials
- Bending energy absorption performance of composite fender piles with different winding angles
- Theoretical study of the effect of orientations and fibre volume on the thermal insulation capability of reinforced polymer composites
- Synthesis and characterization of a novel ternary magnetic composite for the enhanced adsorption capacity to remove organic dyes
- Couple effects of multi-impact damage and CAI capability on NCF composites
- Mechanical testing and engineering applicability analysis of SAP concrete used in buffer layer design for tunnels in active fault zones
- Investigating the rheological characteristics of alkali-activated concrete using contemporary artificial intelligence approaches
- Integrating micro- and nanowaste glass with waste foundry sand in ultra-high-performance concrete to enhance material performance and sustainability
- Effect of water immersion on shear strength of epoxy adhesive filled with graphene nanoplatelets
- Impact of carbon content on the phase structure and mechanical properties of TiBCN coatings via direct current magnetron sputtering
- Investigating the anti-aging properties of asphalt modified with polyphosphoric acid and tire pyrolysis oil
- Biomedical and therapeutic potential of marine-derived Pseudomonas sp. strain AHG22 exopolysaccharide: A novel bioactive microbial metabolite
- Effect of basalt fiber length on the behavior of natural hydraulic lime-based mortars
- Optimizing the performance of TPCB/SCA composite-modified asphalt using improved response surface methodology
- Compressive strength of waste-derived cementitious composites using machine learning
- Melting phenomenon of thermally stratified MHD Powell–Eyring nanofluid with variable porosity past a stretching Riga plate
- Development and characterization of a coaxial strain-sensing cable integrated steel strand for wide-range stress monitoring
- Compressive and tensile strength estimation of sustainable geopolymer concrete using contemporary boosting ensemble techniques
- Customized 3D printed porous titanium scaffolds with nanotubes loading antibacterial drugs for bone tissue engineering
- Facile design of PTFE-kaolin-based ternary nanocomposite as a hydrophobic and high corrosion-barrier coating
- Effects of C and heat treatment on microstructure, mechanical, and tribo-corrosion properties of VAlTiMoSi high-entropy alloy coating
- Study on the damage mechanism and evolution model of preloaded sandstone subjected to freezing–thawing action based on the NMR technology
- Promoting low carbon construction using alkali-activated materials: A modeling study for strength prediction and feature interaction
- Entropy generation analysis of MHD convection flow of hybrid nanofluid in a wavy enclosure with heat generation and thermal radiation
- Friction stir welding of dissimilar Al–Mg alloys for aerospace applications: Prospects and future potential
- Fe nanoparticle-functionalized ordered mesoporous carbon with tailored mesostructures and their applications in magnetic removal of Ag(i)
- Study on physical and mechanical properties of complex-phase conductive fiber cementitious materials
- Evaluating the strength loss and the effectiveness of glass and eggshell powder for cement mortar under acidic conditions
- Effect of fly ash on properties and hydration of calcium sulphoaluminate cement-based materials with high water content
- Analyzing the efficacy of waste marble and glass powder for the compressive strength of self-compacting concrete using machine learning strategies
- Experimental study on municipal solid waste incineration ash micro-powder as concrete admixture
- Parameter optimization for ultrasonic-assisted grinding of γ-TiAl intermetallics: A gray relational analysis approach with surface integrity evaluation
- Producing sustainable binding materials using marble waste blended with fly ash and rice husk ash for building materials
- Effect of steam curing system on compressive strength of recycled aggregate concrete
- A sawtooth constitutive model describing strain hardening and multiple cracking of ECC under uniaxial tension
- Predicting mechanical properties of sustainable green concrete using novel machine learning: Stacking and gene expression programming
- Toward sustainability: Integrating experimental study and data-driven modeling for eco-friendly paver blocks containing plastic waste
- A numerical analysis of the rotational flow of a hybrid nanofluid past a unidirectional extending surface with velocity and thermal slip conditions
- A magnetohydrodynamic flow of a water-based hybrid nanofluid past a convectively heated rotating disk surface: A passive control of nanoparticles
- Prediction of flexural strength of concrete with eggshell and glass powders: Advanced cutting-edge approach for sustainable materials
- Efficacy of sustainable cementitious materials on concrete porosity for enhancing the durability of building materials
- Phase and microstructural characterization of swat soapstone (Mg3Si4O10(OH)2)
- Effect of waste crab shell powder on matrix asphalt
- Improving effect and mechanism on service performance of asphalt binder modified by PW polymer
- Influence of pH on the synthesis of carbon spheres and the application of carbon sphere-based solid catalysts in esterification
- Experimenting the compressive performance of low-carbon alkali-activated materials using advanced modeling techniques
- Thermogravimetric (TG/DTG) characterization of cold-pressed oil blends and Saccharomyces cerevisiae-based microcapsules obtained with them
- Investigation of temperature effect on thermo-mechanical property of carbon fiber/PEEK composites
- Computational approaches for structural analysis of wood specimens
- Integrated structure–function design of 3D-printed porous polydimethylsiloxane for superhydrophobic engineering
- Exploring the impact of seashell powder and nano-silica on ultra-high-performance self-curing concrete: Insights into mechanical strength, durability, and high-temperature resilience
- Axial compression damage constitutive model and damage characteristics of fly ash/silica fume modified magnesium phosphate cement after being treated at different temperatures
- Integrating testing and modeling methods to examine the feasibility of blended waste materials for the compressive strength of rubberized mortar
- Special Issue on 3D and 4D Printing of Advanced Functional Materials - Part II
- Energy absorption of gradient triply periodic minimal surface structure manufactured by stereolithography
- Marine polymers in tissue bioprinting: Current achievements and challenges
- Quick insight into the dynamic dimensions of 4D printing in polymeric composite mechanics
- Recent advances in 4D printing of hydrogels
- Mechanically sustainable and primary recycled thermo-responsive ABS–PLA polymer composites for 4D printing applications: Fabrication and studies
- Special Issue on Materials and Technologies for Low-carbon Biomass Processing and Upgrading
- Low-carbon embodied alkali-activated materials for sustainable construction: A comparative study of single and ensemble learners
- Study on bending performance of prefabricated glulam-cross laminated timber composite floor
- Special Issue on Recent Advancement in Low-carbon Cement-based Materials - Part I
- Supplementary cementitious materials-based concrete porosity estimation using modeling approaches: A comparative study of GEP and MEP
- Modeling the strength parameters of agro waste-derived geopolymer concrete using advanced machine intelligence techniques
- Promoting the sustainable construction: A scientometric review on the utilization of waste glass in concrete
- Incorporating geranium plant waste into ultra-high performance concrete prepared with crumb rubber as fine aggregate in the presence of polypropylene fibers
- Investigation of nano-basic oxygen furnace slag and nano-banded iron formation on properties of high-performance geopolymer concrete
- Effect of incorporating ultrafine palm oil fuel ash on the resistance to corrosion of steel bars embedded in high-strength green concrete
- Influence of nanomaterials on properties and durability of ultra-high-performance geopolymer concrete
- Influence of palm oil ash and palm oil clinker on the properties of lightweight concrete