Promoting low carbon construction using alkali-activated materials: A modeling study for strength prediction and feature interaction
-
Xiaofeng Liu
 ,
Yanli Wang
,
Yanli Wang

Abstract
In place of Portland cement concrete, alkali-activated materials (AAMs) are becoming more popular because of their widespread use and low environmental effects. Unfortunately, reliable property predictions have been impeded by the restrictions of conventional materials science methods and the large compositional variability of AAMs. A support vector machine (SVM), a bagging regressor (BR), and a random forest regressor (RFR) were among the machine learning models developed in this study to assess the compressive strength (CS) of AAMs in an effort to gain an answer to this topic. Improving predictions in this crucial area was the goal of this study, which used a large dataset with 381 points and eight input factors. Also, the relevance of contributing components was assessed using a shapley additive explanations (SHAP) approach. In terms of predicting AAMs CS, RFR outperformed BR and SVM. Compared to the RFR model’s 0.96 R 2, the SVM and BR models’ R 2-values were 0.89 and 0.93, respectively. In addition, the RFR model’s greater accuracy was indicated by an average absolute error value of 4.08 MPa compared to the SVM’s 6.80 MPa and the BR’s 5.83 MPa, which provided further proof of their validity. According to the outcomes of the SHAP research, the two factors that contributed the most beneficially to the strength were aggregate volumetric ratio and reactivity. The factors that contributed the most negatively were specific surface area, silicate modulus, and sodium hydroxide concentration. Using the produced models to find the CS of AAMs for various input parameter values can help cut down on costly and time-consuming laboratory testing. In order to find the best amounts of raw materials for AAMs, academics and industries could find this SHAP study useful.
1 Introduction
The production of ordinary Portland cement (OPC) accounts for around 5–8% of all human-caused CO2 emissions; current projections show that this will rise by an additional 8% by 2050 [1]. Because of this, people are starting to doubt that the Paris Agreement’s zero-emissions target is really achievable [2]. Finding less harmful alternatives to OPC is critical for lowering CO2 emissions from the OPC industry [3]. In recent decades, alkali-activated materials (AAMs) have gained attention as potentially game-changing construction materials due to their low energy consumption and environmental friendliness [4]. Materials containing alumino-silicates, such as industrial by-products, minerals, and mining waste, can be converted into AAMs by reacting them with alkaline activators [5]. Several alumino-silicates that have the potential to be exploited as building blocks for AAM are fly ash, metakaolin, slag, red mud, and ashes from rice husks [6,7,8]. Sodium activators have been extensively employed to obtain suitable technical qualities at a reasonable cost [9]. Some examples are sodium hydroxide, water glass, and sodium carbonate. Offshore constructions, homes, watertight buildings, and heavy metal immobilizations are just a few examples of large-scale construction projects that have made use of AAMs [10]. An umbrella word for a variety of precursors that undergo alkaline activation is alkali-activated materials or AAMs for short. The process of polymerizing aluminosilicate minerals in an alkaline environment yields geopolymers, a type of AAMs. The material is made more consistent and structured by this process. In comparison to AAMs, which encompass a wider variety of compositions and architectures, geopolymers are frequently utilized in high-performance concrete due to their distinct and manageable polymerization mechanism [11]. Although AAMs do have their drawbacks, such as shrinkage cracking, they have surpassed OPC concrete in effectiveness [12]. The benefits of materials activated by alkali are illustrated in Figure 1.
![Figure 1
Advantages of AAMs [13].](/document/doi/10.1515/rams-2024-0038/asset/graphic/j_rams-2024-0038_fig_001.jpg)
Advantages of AAMs [13].
This machine learning (ML) study primarily focuses on compressive strength (CS) because it is an important performance indicator for structural materials. A substantial amount of research has concentrated on the effects of CS on variables including precursor type, water/binder ratio (w/b), activator dosage, curing conditions, chemical admixture, reactivity (RT) of precursors, and aggregate phases in order to efficiently train models and perform predictive assessments, mostly pertaining to structural integrity. As an example, Yang et al. [14] investigated how changing the w/b ratio affected the mechanical properties of Ca(OH)2-based alkali-activated slag concrete. They found that lowering the w/b caused the CS to rise at a rate similar to OPC concrete. The precursor used by the majority of alkali activation facilities is either fly ash or ground granulated blast furnace slag (GGBFS). Xie et al. [15] investigated how GGBFS and fly ash affected the mechanical strength of geo-polymer concrete that had been activated with recycled aggregate and alkali. A higher GGBS/fly ash ratio was associated with a higher CS. Consistent with previous research, this finding confirms that boosting the slag percentage in fly ash/slag blends activated with NaOH improves their CS [16]. The strength of FA-slag concrete activated by alkali increases as the slag concentration and molarity of NaOH are increased, according to Fang et al. [17]. When Nematollahi and Sanjayan [18] tested various combinations of alkali activator and superplasticizer (SP) on alkali-activated FA paste, they discovered that adding naphthalene-based SP to 8.0 M NaOH-activated FA paste increased workability the most without sacrificing CS development compared to other types of SP. Given the foregoing, it can be inferred that the mix design is closely related to the strength performance of AAMs. Therefore, in order to attain the desired strength in the actual construction activity, the scientific mix design of AAMs is essential.
Mechanical properties of AAMs can be fine-tuned by changing the types and amounts of activators. By examining the impact of Na2SiO3 and NaOH activators on the mechanical characteristics of Turkish slag, Aydn, and Baradan sought to gain a better understanding of alkali activation [19]. According to the results, the CS of the slag mortars activated with Na2SiO3 was higher than that of the specimens activated with NaOH. A considerable influence on CS was discovered to be exerted by both the amount of Na2O present and the ratio of SiO2/Na2O concentration. The greatest CS was achieved after 28 days in Na2SiO3 and NaOH mortars, for example, with a SiO2/Na2O ratio of 1.2 and a Na2O slag fraction of 8%. The initial step of geopolymerization, curing, is highly temperature sensitive. Various curing temperatures (10, 20, 40, 60, and 80°C) were tested on a kaolin-based geopolymer to determine their impact on mechanical and microstructural qualities, according to Rovnaník [20]. The CS strength of AAM combinations should be planned, taking into account the aforementioned criteria. In the past, finding the optimal CS required numerous laboratory experimental batches. However, the process of preparing a large number of AAM specimens is both time-consuming and expensive. Without wasting time and money on batch tests, it is possible to achieve better, more resource- and material-efficient estimates of the CS of AAMs.
The technical qualities of various materials can now be more accurately simulated using soft computing technologies. ML models that are fed data are crucial for making accurate predictions. Construction materials are inherently unpredictable and have a complex architecture, making it difficult to create reliable quality estimates. Estimating the engineering parameters of construction materials has been a significant area of application for ML algorithms. Modern and traditional types of concrete, which have been analyzed for their properties using ML algorithms, encompass self-compacting concrete, fiber-reinforced concrete, recycled aggregate concrete, concrete integrated with phase change materials, lightweight concrete, and numerous others [21,22,23,24,25]. ML models outperform their more traditional physical and empirical equivalents in estimating certain concrete engineering features, according to many studies. In order to make reliable predictions about concrete properties, we need to solve some computational problems. These challenges include the complicated nature of cement hydration and microstructure formation, as well as the nonlinear time and temperature-dependent activity of cement paste [26,27]. Input data on mixture proportions and curing conditions can be used to train ML models to precisely predict desired attributes. There are many advantages to using ML models, including their ability to create accurate and general predictions, their low computing requirements, and their reproducibility.
Some studies have shown promise in developing a trustworthy computational framework for CS prediction of AAM composites using appropriately trained ML algorithms. The goal of this research is to examine AAM CS using a number of strong ML models. Academic articles that are available to the public have been used to compile a dataset comprising 381 points. There were regression models built to forecast the CS of AAMs, and they included support vector machines (SVMs), bagging regressors (BRs), and random forest regressors (RFRs). Mathematical checks validate the models, and Shapley additive explanations (SHAP) analysis checks the variables’ influence on the prediction. Innovative tools and procedures for controlled examination of material qualities with minimal human interaction might have far-reaching consequences for the construction sector. It is possible to reduce the time and effort spent on laboratory testing by using the models that are created to determine the CS of AAMs for different values of the input parameters.
2 Research methods
2.1 Data collection and analysis
A comprehensive dataset consisting of 381 data points was generated from 25 relevant experimental studies [17,18,28,29,30,31,32,33,34,35,36,37,38,39,40,41,42,43,44,45,46,47,48,49,50] to forecast the CS of AAMs using one individual ML method, i.e., SVM, and two ensemble ML methods, such as BR and RFR. This study projected the CS based on eight input parameters such as RT, specific surface area (SSA), silicate modulus-SiO2/Na2O (Ms), liquid-to-binder volumetric ratio (LBR), aggregate volumetric ratio (Ag), geopolymer paste volume to total concrete ratio (GPV), sodium hydroxide concentration (SHC), and admixture volumetric ratio (Adm). The RT of precursors in AAMs pertains to the ease with which the precursor materials dissolve and then undergo polymerization when they come into contact with an alkaline activator solution. The RT of precursors was evaluated by utilizing the activity modulus. This modulus quantifies the proportion of alkalis, such as NaOH or KOH, to the concentration of SiO2 and Al2O3 in the precursor material on a molar basis. This value is crucial because it directly affects the alkalinity and RT of the alkali activator solution, which in turn influences the properties of the resulting material. The Adm is the ratio of the volume of admixture, such as SP, to the total volume of the concrete mix. The SP dosage refers to the proportion of SP in relation to the overall volume of concrete, usually stated as a percentage or fraction. This ratio is essential in regulating the workability, strength, and other characteristics of the concrete mixture. Thorough data preprocessing played a crucial role in gathering and consolidating the data. Utilizing data preparation techniques for data mining helps overcome significant obstacles and aligns with the popular strategy of knowledge discovery from data. A primary goal of data preparation is to improve and streamline the data by eliminating errors and extraneous items. In order to analyze the models, we used regression and error-distribution techniques. Figure 2(a)–(i) depict frequency distribution graphs of input variables, offering a visual representation of value distribution within a dataset. It showcases the frequency of individual values or value ranges, facilitating swift identification of patterns, outliers, and the overall distribution shape of the data. This visual tool aids in understanding the central tendencies and variability present in the dataset at a glance.


Data unfold: frequency distribution graphs; (a) RT, (b) SSA, (c) Ms, (d) SHC, (e) LBR, (f) GPV, (g) Ag, (h) Adm, and (i) CS.
One common way to find parameter dependencies is to use Pearson’s correlation coefficient (r) [51]. The outcome of the association map plot for the characteristics is displayed in Figure 3. The r-squared test is useful for demonstrating parameter dependency and multicollinearity [52]. Within the range of −1 to +1, a strong negative relationship is provided by −1, a strong positive link by +1, and no correlation at all by 0 for the r-value [53]. This correlation between the input variables and the output (CS) is displayed in the bottom row of Pearson’s array. An issue with ML algorithms is multicollinearity, which should be mentioned [54]. To prevent multicollinearity issues in ML models, it is necessary to have an r-value below 0.8 between two variables [55]. Figure 3 shows that the r-value is less than the permissible range of 0.8, regardless of its sign. Hence, multicollinearity in CS models is quite improbable.
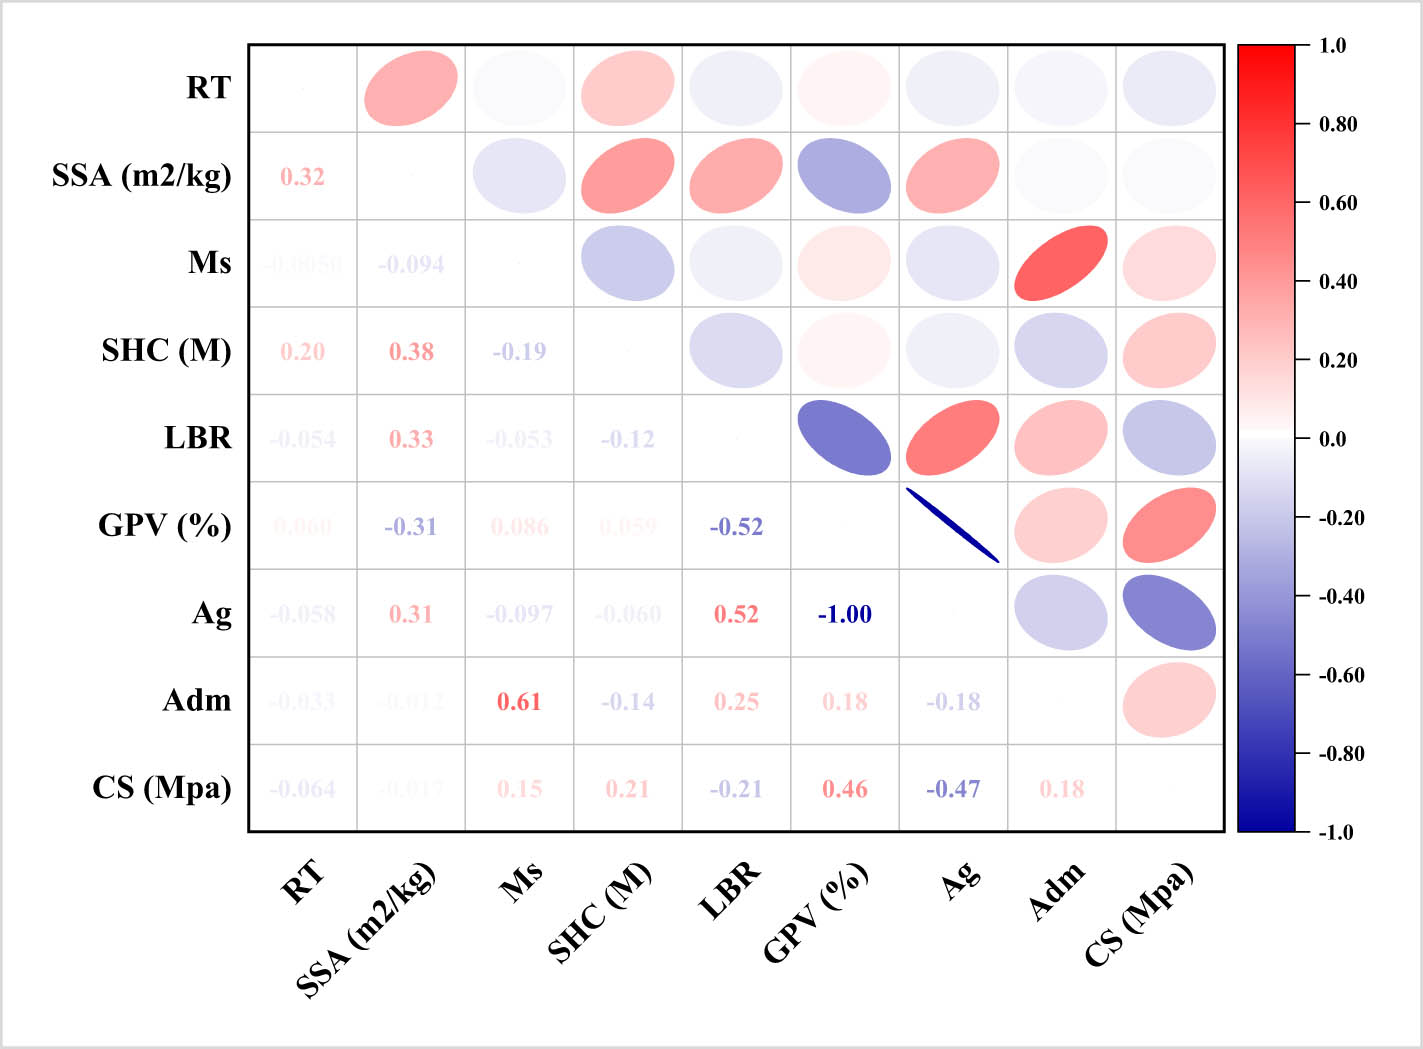
Parameter correlation heat map.
2.2 ML modeling
The main outcome of the eight inputs examined in the lab was the CS of AAMs. Analyzing input data using ML techniques made it easier to evaluate results. In order to train these models, the ML algorithms were given 70% of the dataset, while the remaining 30% was kept for testing. Modern ML methods such as SVM, BR, and RFR were used to forecast the CS of AAMs. An R 2 score of the expected results was used to evaluate the models’ performance; a small R 2 number signifies a substantial difference [56], whereas a big number suggests that the projected and actual results are very congruent. The model’s accuracy was validated through various methods, encompassing statistical tests and error evaluations. Figure 4 depicts a simplified event model diagram.

Brief overview of the research methodology.
2.2.1 Support vector machine-SVM
SVMs, which stand for SVMs, are a type of supervised ML that may be applied to classification as well as regression operations. In SVM arrangement, data samples are depicted as points within a geometric space, striving to maximize the separation between different categories. The primary objective is to delineate categories by drawing a hyper-plane that maximizes the margin between them. This separation facilitates accurate classification by ensuring that data points are appropriately assigned to their respective categories. SVMs are particularly effective in handling complex datasets and can accommodate nonlinear relationships through the use of kernel functions, enabling them to achieve high predictive accuracy across various domains. Figure 5 arranges the supplementary examples in a logical fashion based on their orientation relative to the vector. Figure 6 shows the model’s implementation technique for the SVM. Several parameters are considered by this model to ensure that it gives a credible strength estimate for the material. Through an optimization process, the SVM model’s parameters are fine-tuned.
![Figure 5
Mapping of SVM models [57].](/document/doi/10.1515/rams-2024-0038/asset/graphic/j_rams-2024-0038_fig_005.jpg)
Mapping of SVM models [57].
![Figure 6
Flowchart illustrating the SVM process [58].](/document/doi/10.1515/rams-2024-0038/asset/graphic/j_rams-2024-0038_fig_006.jpg)
Flowchart illustrating the SVM process [58].
2.2.2 Bagging regressor-BR
Figure 7 illustrates the BR approach through a simplified flow diagram. A notable feature of enhancing the forecast model with additional training data is its similarity to an ensemble technique. An asymmetrical sampling strategy is used instead of depending only on the statistics of the original dataset. Each new set of training data can potentially include the same set of observations if replacement sampling is applied. Following bagging, the chances of each component being included in the new dataset are equal. Curiously, the prediction accuracy is unaffected by the training sample size. Reducing the divergence could potentially be as simple as making the goal output approximation better. When constructing this ensemble, the predictions made by each simulation are averaged. In regression analysis, the average forecast is obtained by aggregating results from numerous simulations [59]. Utilizing 20 sub-models, the SVM-based bagging method is refined to pinpoint the most optimal output value.
![Figure 7
Bagging regressor model schematic [60].](/document/doi/10.1515/rams-2024-0038/asset/graphic/j_rams-2024-0038_fig_007.jpg)
Bagging regressor model schematic [60].
2.2.3 Random forest regressor-RFR
Using bagged decision trees and a method called random split selection is one approach to RFR [61]. A simplified diagram showing the assembly and operation of the RFR model can be found in Figure 8. The training data for each forest tree are picked at random, as are the input parameters that are utilized to generate each branch split [62]. This factor adds to the inherent variety of the tree. The forest is comprised entirely of completely developed binary trees. For all types of regressions, the RFR method has worked well. When the number of variables exceeds the limit of manageable interpretations, it is more accurate to combine the outputs of multiple randomly picked decision trees. It is useful for both premeditated and spur-of-the-moment learning since its indications evolve with the passage of time [61].
![Figure 8
Random forest modeling and structure [63].](/document/doi/10.1515/rams-2024-0038/asset/graphic/j_rams-2024-0038_fig_008.jpg)
Random forest modeling and structure [63].
2.3 Model’s validation methods
To guarantee the accuracy of the ML algorithms used, statistical and K-fold tests were carried out. In order to certify that ML models are accurate, researchers often use these methods [64,65]. One popular method for determining how well a test works is K-fold analysis, which involves arbitrary data partitioning into ten groups [66]. As depicted in Figure 9, nine classes are employed for training ML models, while only one class is used for model validation. With fewer errors and a higher R 2, the ML method becomes more precise. Also, it is necessary to perform this 10 times before you see any benefits. Much of the credit for the model’s remarkable precision goes to this effort. The accuracy of each ML technique was statistically evaluated using error assessment, which included measures such as root mean squared error (RMSE), mean absolute percentage error (MAPE), and mean absolute error (MAE). These metrics play a crucial role in validating ML models by quantifying the errors between predicted and actual values. Their significance lies in providing comprehensive insights into the performance and predictive capability of the models, essential for refining and optimizing the learning process. When testing the ML methods’ predictive abilities, Eqs. (1)–(3) were utilized to determine their statistical correctness.
where P i is the estimated results, T i is the test outcomes, and n is the dataset’s size.
![Figure 9
Flowchart of the K-fold approach [67].](/document/doi/10.1515/rams-2024-0038/asset/graphic/j_rams-2024-0038_fig_009.jpg)
Flowchart of the K-fold approach [67].
2.4 SHAP analysis
This study examined feature interactions with CS and identified feature impacts that were all-encompassing using a strategy game technique called SHAP [68]. To make the suggested model more scalable, SHAP research might be utilized. To validate case predictions, this method calculates all impact-considered attributes and then applies SHapley values derived from the coalition strategy. Every possible combination of qualities and how they affect the SHapley value is considered and, to a large extent, averaged. Attributes are ranked according to their SHAP level, which indicates their importance. The global influence of each feature is determined by averaging the SHAP values of all inputs. The SHAP values are arranged in a meaningful manner prior to charting. On the SHAP plot, one point represents each component’s SHAP value; the X-axis shows the SHAP values, and the Y-axis shows the feature importance. The characteristic’s importance is shown by a color gradient that goes from lighter to darker along the Y-axis. Larger dots indicate that the feature has a stronger impact on the output. By using a color scheme, SHAP plots graphically represent feature interaction, shedding light on how features interact with one another and how it affects the end result. This method yields more information than the more typical partial dependency graphs [69]. The weight ϕ j (f) is used to determine the influence summation of a component, and the model’s output f(x i ) is composed of likely feature patterns [70]. Eq. (4) can be used to determine ϕ j (f).
where; S is the ingredients subset, x j is the constituent j, and p is the model constituent number.
This method uses measuring and estimating mistakes to determine the importance of a feature by repeatedly changing its value. Assigning proportional importance and perplexity to various elements is done by considering their estimated error sensitivity. Also, SHAP shows how the ML model did once it was trained. SHAP constructs an interpretable model by adopting a novel approach to feature identification: the linear summation of inputs. Imagine a representation model h(x s ) with just one input variable x s , then picture a new model f(x) with input variables x i , where i is a positive integer between one and k, and k is the number of input variables. This will help show the new model. Simply applying the succeeding Eq. (5) to the existing model yields:
where p is the input number of features, and ∅ 0 is the constant
A plotting function that deliberates both x i and x s is signified as x = m x (x s ), The amplification of the approximation value, h(x s ), by _0, _1, and _3 terms and the lowering of h(x s ) by _4 terms were demonstrated in the work of Lundberg and Lee [71], which is depicted in Figure 10. Eq. (5) concerns a single-valued solution that combines high dependability, high local precision, and no missing values. Reliability checks that no less significant traits are degraded unfairly when modifications are made to more important characteristics. Missing features are already proven to be useless; thus, x_s i = 0 to guarantee that i = 0 in missing-ness. Studies have shown that feature attribution can be made more accurate at the local level by simplifying the input x_s and employing a model condition of similar output f(x).
![Figure 10
Distinctive features of SHAP [72].](/document/doi/10.1515/rams-2024-0038/asset/graphic/j_rams-2024-0038_fig_010.jpg)
Distinctive features of SHAP [72].
3 Model’s outcomes and analysis
3.1 CS-SVM model
To estimate the CS of AAMs, an SVM model was trained using 8 distinct input variables, and the findings are illustrated in Figure 11. Figure 11(a) presents a comparison between predicted and observed outcomes, demonstrating the SVM model’s high precision with minimal deviation between test and estimated values. The SVM approach appears well-suited for CS estimation of AAMs, as indicated by an R-squared value of 0.89, reflecting strong agreement between test and predicted results. Using the SVM approach, the experimental, predicted, and divergent values (errors) are shown by the standard distribution in Figure 11(b). There was an average inaccuracy of 6.80 MPa, with a range of 0.00–27.4 MPa. The distribution of the error values followed a usual pattern: 58 occurrences were below 5.0 MPa, 30 were between 5.0 and 10.0 MPa, and 28 were beyond 10.0 MPa. The SVM method successfully predicted the CS of AAMs, as seen by the distribution of divergent data (errors).

A CS-SVM model’s (a) test-predictive result correlation and (b) model outcome, actual-CS, and error-value scattering.
3.2 CS-BR model
The results of predicting the AAM’s CS using the BR approach are displayed in Figure 12. Figure 12(a) shows that actual and predicted CS are related. For this study, the BR method was preferred over the SVM model due to the fact that it resulted in less discrepancies between the predicted and actual results. With an R 2 of 0.93, the BR model appears to be the more accurate one. Figure 12(b) displays the dispersion of errors for test, estimated, and deviated values obtained through the BR approach. The findings revealed that the error levels ranged from 0.00 MPa (the lowest), 5.83 MPa (the median), and 22.80 MPa (the highest). Looking at the frequency of errors of different sizes, it was found that 64 of them happened at or below 5.0 MPa, 32 between 5.0 and 10.0 MPa, and 19 at or above 10.0 MPa. The error dispersion further shows that the BR model is more precise than the SVM model. The BR model outperforms the SVM model in determining the ideal output value by using 20 sub-models to optimize the bagging process.

A CS-BR model’s (a) test-predictive result correlation and (b) model outcome, actual-CS, and error-value scattering.
3.3 CS-RFR model
As shown in Figure 13, the results of AAM CS forecasts utilizing the RFR algorithm are presented. Figure 13(a) shows the correlation between the expected and measured CS. It was demonstrated that the RFR method exhibited superior accuracy when comparing expected and actual outcomes. The R-squared value of 0.96 achieved by the RFR model substantiates its enhanced precision. The distribution of actual, projected, and error values related to the RFR technique is shown in Figure 13(b). The maximum recorded variation was 13.75 MPa, with an average deviation of 4.08 MPa. Error distribution analysis revealed 76 values below 5.0 MPa, 28 values between 5.0 and 10.0 MPa, and 11 values surpassing 10.0 MPa. Comparatively, the RFR method outperformed the SVM and BR models based on error dispersion analysis. It can be inferred that for predicting AAM CS, the RFR method excels over the SVM and BR approaches. However, it is worth noting the remarkable accuracy of the SVM model. The R-squared values and cross-validation approaches of all the models showed great prediction accuracy, therefore it seems like any model may be used to evaluate the CS of AAMs. Because of its superior performance with high-dimensional data and nonlinear interactions, Random Forest Regressor is often considered the gold standard. Additionally, it mitigates overfitting by averaging multiple decision trees. SVM and BR models may struggle with complex data relationships and may not offer the same robustness against overfitting.

A CS-RFR model’s (a) test-predictive result correlation and (b) model-outcome, actual-CS, and error-value scattering.
3.4 Validation of models
The results of the error computations (RMSE, MAPE, and MAE) using the previously indicated Eqs. (1)–(3) are shown in Table 1. Using SVM, BR, and RFR to forecast CS, the MAE values were 6.80, 5.28, and 4.09 MPa, respectively. According to the calculations, MAPE for SVM was 16.40%, BR was 12.80%, and RFR was 11.20%. Moreover, RMSE values of 8.97, 7.54, and 5.44 MPa were determined for SVM, BR, and RFR, respectively. The findings indicate that the RFR technique outperforms the SVM and BR models owing to its lower error rate. Table 2 presents the calculated R-squared, RMSE, and MAE scores for validating the k-fold technique. The SVM approach formed a CS estimation with an MAE of 6.73 MPa, ranging from 3.35 to 9.65 MPa. The average MAE for the BR is approximately 5.79 MPa, ranging from 2.95 to 9.19 MPa. The MAE for RFR, on the other hand, was 4.98 MPa on average and varied between 2.07 and 8.28 MPa. Using SVM, the mean RMSE was 8.16 MPa; using BR, it was 7.26 MPa; and using RFR, it was 5.87 MPa. The highest R-squared values for BR and RFR are 0.96 and 0.93, respectively, whereas SVM’s value is comparatively lower at 0.89. A lower error rate and greater R 2 would indicate a superior RFR model for AAM CS prediction. More proof of the RFR model’s improved accuracy was found when these errors were examined alongside R 2 values obtained by the k-fold approach. Still, it is worth noting that the SVM model achieves respectable accuracy. This suggests that SVM, BR, and RFR models may provide better CS estimates for AAMs.
Statistics for error analysis
| ML method | MAE (MPa) | MAPE (%) | RMSE (MPa) |
|---|---|---|---|
| SVM | 6.80 | 16.40 | 8.97 |
| BR | 5.28 | 12.80 | 7.54 |
| RFR | 4.09 | 11.20 | 5.44 |
K-fold MAE, RMSE, R 2 results
| K-fold number | CS (MPa) | ||||||||
|---|---|---|---|---|---|---|---|---|---|
| SVM | BR | RFR | |||||||
| MAE | RMSE | R 2 | MAE | RMSE | R 2 | MAE | RMSE | R 2 | |
| 1 | 7.43 | 8.27 | 0.27 | 2.95 | 10.45 | 0.47 | 2.07 | 6.67 | 0.59 |
| 2 | 8.32 | 5.38 | 0.84 | 7.06 | 10.04 | 0.93 | 6.23 | 8.82 | 0.96 |
| 3 | 6.25 | 5.24 | 0.38 | 4.65 | 9.48 | 0.57 | 6.81 | 4.60 | 0.53 |
| 4 | 3.35 | 11.39 | 0.53 | 6.25 | 4.44 | 0.71 | 4.81 | 5.42 | 0.75 |
| 5 | 4.21 | 6.91 | 0.17 | 3.87 | 6.40 | 0.54 | 5.70 | 5.87 | 0.71 |
| 6 | 3.89 | 8.64 | 0.90 | 6.68 | 7.87 | 0.81 | 8.28 | 6.61 | 0.83 |
| 7 | 9.29 | 7.64 | 0.82 | 9.19 | 3.96 | 0.86 | 2.68 | 4.60 | 0.77 |
| 8 | 9.65 | 8.55 | 0.62 | 5.92 | 5.25 | 0.78 | 8.12 | 4.90 | 0.80 |
| 9 | 7.06 | 9.06 | 0.43 | 5.33 | 5.57 | 0.46 | 2.52 | 6.77 | 0.29 |
| 10 | 7.84 | 10.56 | 0.50 | 5.99 | 9.13 | 0.63 | 2.60 | 4.41 | 0.64 |
3.5 SHAP investigation results
This study explored how different raw materials affected the CS of AAMs. By applying the SHAP tree interpreter to the whole dataset, we can learn more about the local SHAP reasons and the effects of the features as a whole. Violin SHAP graphs show the impacts of each raw material on AAM CS in Figure 14. The relative contribution of each raw material is shown by the x-axis SHAP value, while the values of the variables are represented by the changing hues on the graph. According to the SHAP analysis, it was observed that Ag and RT exhibit a positive correlation with the CS of AAMs. This indicates that these variables positively and significantly influence strength, as evidenced by the abundance of high-intensity red spots on the positive axis and relatively fewer low-intensity blue dots on the negative axis. Thus, enhancing these variables is likely to enhance strength. Conversely, a higher concentration of SSA, silicate modulus (Ms), and sodium hydroxide concentration (SHC) lead to a negative effect on strength, as indicated by the prevalence of high-intensity red dots on the negative side. This suggests that strength decreases with an increase in the content of these variables in the mix beyond a certain threshold. It was found that the CS of AAMS was affected by a combination of direct and indirect impacts from the liquid-to-binder volumetric ratio (LBR), the admixture volumetric ratio (Adm), and the geopolymer paste volume to total concrete volume ratio (GPV).

SHAP plot indicating input factor importance and influence.
Figure 15 illustrates the relationships between raw materials and their effects on AAM strength. Figure 15(a) displays the interaction and effect of Ag. With an increase in Ag content up to 0.4, the graph shows that the CS of AAMs increased. But after this point, the strength dropped dramatically as the content increased. Figure 15(b) clearly shows that strength values were significantly high for SSA up to 500 m2/kg, indicating that SSA has a significant effect on strength. As the SSA concentration increased, though, the strength plateaued. In addition, Figure 15(c)–(e) shows that RT, Ms, and SHC had an effect on the CS) of AAMs and that the CS values constantly went up as the content of these factors went up. It appears that these variables have a direct association with the CS of AAMs. Figure 15(f) and (h) also shows how LBR and GPC affected the CS of AAMs, showing that CS values first rose to a limit. The CS values either decreased or became equal as the improvement progressed, though. The results may differ based on the data set size and the particular raw materials used in the study. Changing the characteristics of the input and the size of the sample could result in a variety of different outputs or outcomes.

Interaction of AAM CS input parameters: (a) Ag, (b) SSA, (c) RT, (d) Ms, (e) SHC, (f) LBR, (g) Adm, and (h) GPV.
4 Discussions
OPC is the sole binding ingredient, and it leaves a big imprint on the world in terms of natural resource reduction [73] and anthropogenic emissions [74]. This means the OPC industry has to find ways to reduce its carbon dioxide emissions by using less harmful alternatives. For the last decade, AAMs have been one of the most talked-about sustainable construction materials due to their low energy consumption and minimal environmental effect [75]. By employing ML and SHAP methodologies, this study aimed to enhance the understanding of the application of AAMs, contributing to advancements in human comprehension in this field. In order to determine the AAMs’ CS, this research employed SVM, BR, and RFR ML methods. We compared the accuracy of each method to find the most precise one. With an R 2 of 0.96, the RFR method outperformed the SVM and BR approaches in terms of accuracy. However, R 2 values of 0.89 and 0.93 were recorded by the SVM and BR methods, respectively. Disagreement between observed and expected outcomes (errors) provided more evidence of the RFR method’s superior accuracy. The RFR models demonstrated a considerable improvement in agreement between experimental and predicted outcomes compared to the SVM and BR models, as demonstrated by the error analysis. Prior studies have demonstrated comparable outcomes when comparing the RFR methodology’s accuracy to that of the different ML approaches for estimating the strength of construction materials [64,76].
Furthermore, arithmetical and k-fold methods were used to test the correctness of ML systems. The model is more accurate when the R 2 value is higher, and the amount of variance (RMSE, MAPE, and MAE) is smaller. Because algorithm performance is sensitive to data samples and inputs, finding the best machine-learning approach for attribute prediction across domains is challenging [64]. One common way that ensemble ML systems get better results than individual ML models is by training sub-models on the dataset using the weaker learner and then tuning them to increase accuracy. Taking everything into account, these results demonstrate that BR and RFR models outperform SVM models in terms of accuracy. Furthermore, in order to examine the impact of raw materials on the CS of AAMs, the SHAP analysis was carried out. There is a favorable correlation between the Ag and RT of the material’s input parameters and the CS of AAMs. As the content of the variables indicated earlier rises, the CS of AAMs grows. However, there is an indirect correlation between the CS of AAMs and the SSA, Ms, and SHC as per the SHAP analysis findings. It follows that building materials using AAMs instead of OPC-based products will be superior while still performing similarly in terms of strength. More importantly, it will aid in controlling the depleting raw materials utilized in OPC synthesis and reducing the environmental difficulties linked to OPC manufacture.
The majority of recent work on the application of ML to predict concrete properties has been on mechanical aspects. However, there hasn’t been nearly enough research done on crucial topics like the microstructure of concrete, its dynamic qualities like fatigue, and its durability. Further research is required to fully examine these durability-affecting factors using ML techniques in order to have a more sophisticated grasp of concrete performance.
5 Conclusions
Using ML techniques including SVMs, BRs, and RFRs, this study intends to examine and forecast the CS of AAMs. The study included 381 sets of concrete CS data obtained from laboratory studies for model training, testing, and validation. Here are the main results:
The RFR approach demonstrated superior accuracy for estimating the CS of AAMs (R 2 = 0.96), as compared to BR and SVM methods (R 2 = 0.93 and 0.89, respectively).
SVM, BR, and RFR methods had an average error of 6.80, 5.83, and 4.08 MPa between test and calculated CS (errors), respectively. The RFR method was more accurate in AAM strength prediction, although these error levels also confirmed that the SVM and BR models were acceptable.
Statistical and k-fold evaluations demonstrated the constructed models’ efficiency. The accuracy of ML models was demonstrated by lower errors and better R 2. The root mean square error (RMSE) for the CS prediction in the SVM model was 8.97 MPa; in the BR model, it was 7.54 MPa; in the RFR model, it was 5.44 MPa. The RFR model was more accurate in predicting the CS of AAMs, as seen by the RMSE values.
The findings of the SHAP study indicate that Ag and RT were the key raw materials/variables, with a superior positive relationship with the AAM’s strength. The strength of AAMs was more negatively impacted by SSA, Ms, and SHC, while LBR, Adm, and GPV had balanced effects.
The findings of this study offer fresh perspectives on designing AAMs, leveraging robust prediction frameworks developed here. It is possible that both academic institutions and businesses could benefit from this SHAP study in order to determine the optimal quantities of raw materials for AAMs. By leveraging ML models, the creation of chemical mixtures is streamlined, fostering environmentally responsible construction practices and mitigating environmental challenges inherent in traditional concrete industries.
Acknowledgments
The authors acknowledge their respective institutions for supporting this study.
-
Funding information: The authors state no funding involved.
-
Author contributions: X.L.: conceptualization, funding acquisition, data acquisition, software, supervision, and writing-original draft. Y.W.: project administration, resources, methodology, visualization, writing, reviewing, and editing. C.L.: investigation, formal analysis, software, validation, writing, reviewing, and editing. All authors have accepted responsibility for the entire content of this manuscript and approved its submission.
-
Conflict of interest: The authors state no conflict of interest.
-
Data availability statement: The datasets generated and/or analyzed during the current study are available from the corresponding author upon reasonable request.
References
[1] Boakye, K., D. Winters, O. Oguntola, K. Fenton, and S. Simske. A review of strategies to achieve net zero targets in the cement and concrete sectors. In: Reducing carbon footprint – Microscale to Macroscale, Technical, Industrial and Policy Regulations, IntechOpen, Rijeka, 2024.10.5772/intechopen.1005051Search in Google Scholar
[2] Castro-Alonso, M. J., L. E. Montañez-Hernandez, M. A. Sanchez-Muñoz, M. R. Macias Franco, R. Narayanasamy, and N. Balagurusamy. Microbially induced calcium carbonate precipitation (MICP) and its potential in bioconcrete: microbiological and molecular concepts. Frontiers in Materials, Vol. 6, 2019, id. 126.10.3389/fmats.2019.00126Search in Google Scholar
[3] Poudyal, L. and K. Adhikari. Environmental sustainability in cement industry: An integrated approach for green and economical cement production. Resources, Environment and Sustainability, Vol. 4, 2021, id. 100024.10.1016/j.resenv.2021.100024Search in Google Scholar
[4] Nazar, S., J. Yang, M. Ashraf, F. Aslam, M. F. Javed, S. M. Eldin, et al. Formulation and characterization of cleaner one-part novel fly ash/lime-based alkali-activated material. Journal of Materials Research and Technology, Vol. 23, 2023, pp. 3821–3839. 10.1016/j.jmrt.2023.02.022.Search in Google Scholar
[5] Gökçe, H. S., M. Tuyan, and M. L. Nehdi. Alkali-activated and geopolymer materials developed using innovative manufacturing techniques: A critical review. Construction and Building Materials, Vol. 303, 2021, id. 124483.10.1016/j.conbuildmat.2021.124483Search in Google Scholar
[6] Siddique, S. and J. G. Jang. Acid and sulfate resistance of seawater based alkali activated fly ash: A sustainable and durable approach. Construction and Building Materials, Vol. 281, 2021, id. 122601.10.1016/j.conbuildmat.2021.122601Search in Google Scholar
[7] Kim, T. Characteristics of alkali-activated slag cement-based ultra-lightweight concrete with high-volume cenosphere. Construction and Building Materials, Vol. 302, 2021, id. 124165.10.1016/j.conbuildmat.2021.124165Search in Google Scholar
[8] He, J., Y. Jie, J. Zhang, Y. Yu, and G. Zhang. Synthesis and characterization of red mud and rice husk ash-based geopolymer composites. Cement and Concrete Composites, Vol. 37, 2013, pp. 108–118.10.1016/j.cemconcomp.2012.11.010Search in Google Scholar
[9] Provis, J. L. and J. S. J. Van Deventer. Alkali activated materials: state-of-the-art report, RILEM TC 224-AAM, Vol. 13, Springer Science & Business Media, Berlin, Germany, 2013.10.1007/978-94-007-7672-2Search in Google Scholar
[10] Tian, X., F. Rao, R. Morales-Estrella, and S. Song. Effects of aluminum dosage on gel formation and heavy metal immobilization in alkali-activated municipal solid waste incineration fly ash. Energy & Fuels, Vol. 34, 2020, pp. 4727–4733.10.1021/acs.energyfuels.9b04493Search in Google Scholar
[11] Nodehi, M. and V. M. Taghvaee. Alkali-activated materials and geopolymer: A review of common precursors and activators addressing circular economy. Circular Economy and Sustainability, Vol. 2, 2022, pp. 165–196.10.1007/s43615-021-00029-wSearch in Google Scholar
[12] Kumarappa, D. B., S. Peethamparan, and M. Ngami. Autogenous shrinkage of alkali activated slag mortars: Basic mechanisms and mitigation methods. Cement and Concrete Research, Vol. 109, 2018, pp. 1–9.10.1016/j.cemconres.2018.04.004Search in Google Scholar
[13] Amin, M. N., S. A. Khan, A. A. Alawi Al-Naghi, E. R. Latifee, N. Alnawmasi, and A. F. Deifalla. Low-carbon embodied alkali-activated materials for sustainable construction: A comparative study of single and ensemble learners. Reviews on Advanced Materials Science, Vol. 63, 2024, id. 20230162.10.1515/rams-2023-0162Search in Google Scholar
[14] Yang, K. H., A. R. Cho, and J. K. Song. Effect of water–binder ratio on the mechanical properties of calcium hydroxide-based alkali-activated slag concrete. Construction and Building Materials, Vol. 29, 2012, pp. 504–511.10.1016/j.conbuildmat.2011.10.062Search in Google Scholar
[15] Xie, J., J. Wang, R. Rao, C. Wang, and C. Fang. Effects of combined usage of GGBS and fly ash on workability and mechanical properties of alkali activated geopolymer concrete with recycled aggregate. Composites Part B: Engineering, Vol. 164, 2019, pp. 179–190.10.1016/j.compositesb.2018.11.067Search in Google Scholar
[16] Puertas, F., S. Martı́nez-Ramı́rez, S. Alonso, and T. Vázquez. Alkali-activated fly ash/slag cements: Strength behaviour and hydration products. Cement and Concrete Research, Vol. 30, 2000, pp. 1625–1632.10.1016/S0008-8846(00)00298-2Search in Google Scholar
[17] Fang, G., W. K. Ho, W. Tu, and M. Zhang. Workability and mechanical properties of alkali-activated fly ash-slag concrete cured at ambient temperature. Construction and Building Materials, Vol. 172, 2018, pp. 476–487.10.1016/j.conbuildmat.2018.04.008Search in Google Scholar
[18] Nematollahi, B. and J. Sanjayan. Effect of different superplasticizers and activator combinations on workability and strength of fly ash based geopolymer. Materials & Design, Vol. 57, 2014, pp. 667–672.10.1016/j.matdes.2014.01.064Search in Google Scholar
[19] Aydın, S. and B. Baradan. Effect of activator type and content on properties of alkali-activated slag mortars. Composites Part B: Engineering, Vol. 57, 2014, pp. 166–172.10.1016/j.compositesb.2013.10.001Search in Google Scholar
[20] Rovnaník, P. Effect of curing temperature on the development of hard structure of metakaolin-based geopolymer. Construction and Building Materials, Vol. 24, 2010, pp. 1176–1183.10.1016/j.conbuildmat.2009.12.023Search in Google Scholar
[21] Marani, A., A. Jamali, and M. L. Nehdi. Predicting ultra-high-performance concrete compressive strength using tabular generative adversarial networks. Materials, Vol. 13, 2020, id. 4757.10.3390/ma13214757Search in Google Scholar PubMed PubMed Central
[22] Marani, A. and M. L. Nehdi. Machine learning prediction of compressive strength for phase change materials integrated cementitious composites. Construction and Building Materials, Vol. 265, 2020, id. 120286.10.1016/j.conbuildmat.2020.120286Search in Google Scholar
[23] Nunez, I., A. Marani, and M. L. Nehdi. Mixture optimization of recycled aggregate concrete using hybrid machine learning model. Materials, Vol. 13, 2020, id. 4331.10.3390/ma13194331Search in Google Scholar PubMed PubMed Central
[24] Zhang, J., Y. Huang, F. Aslani, G. Ma, and B. Nener. A hybrid intelligent system for designing optimal proportions of recycled aggregate concrete. Journal of Cleaner Production, Vol. 273, 2020, id. 122922.10.1016/j.jclepro.2020.122922Search in Google Scholar
[25] Zhang, J., D. Li, and Y. Wang. Toward intelligent construction: Prediction of mechanical properties of manufactured-sand concrete using tree-based models. Journal of Cleaner Production, Vol. 258, 2020, id. 120665.10.1016/j.jclepro.2020.120665Search in Google Scholar
[26] Naseri, H., H. Jahanbakhsh, P. Hosseini, and F. M. Nejad. Designing sustainable concrete mixture by developing a new machine learning technique. Journal of Cleaner Production, Vol. 258, 2020, id. 120578.10.1016/j.jclepro.2020.120578Search in Google Scholar
[27] Young, B. A., A. Hall, L. Pilon, P. Gupta, and G. Sant. Can the compressive strength of concrete be estimated from knowledge of the mixture proportions?: New insights from statistical analysis and machine learning methods. Cement and Concrete Research, Vol. 115, 2019, pp. 379–388.10.1016/j.cemconres.2018.09.006Search in Google Scholar
[28] Yang, K.-H., J.-K. Song, K.-S. Lee, and A. Ashour. Flow and compressive strength of alkali-activated mortars. ACI Materials Journal, Vol. 106, No. 1, 2009, pp. 50–58.10.14359/56316Search in Google Scholar
[29] Yang, K.-H. and J.-K. Song. Workability loss and compressive strength development of cementless mortars activated by combination of sodium silicate and sodium hydroxide. Journal of Materials in Civil Engineering, Vol. 21, 2009, pp. 119–127.10.1061/(ASCE)0899-1561(2009)21:3(119)Search in Google Scholar
[30] Pacheco-Torgal, F., D. Moura, Y. Ding, and S. Jalali. Composition, strength and workability of alkali-activated metakaolin based mortars. Construction and Building Materials, Vol. 25, 2011, pp. 3732–3745.10.1016/j.conbuildmat.2011.04.017Search in Google Scholar
[31] Jang, J. G., N. K. Lee, and H.-K. Lee. Fresh and hardened properties of alkali-activated fly ash/slag pastes with superplasticizers. Construction and Building Materials, Vol. 50, 2014, pp. 169–176.10.1016/j.conbuildmat.2013.09.048Search in Google Scholar
[32] Nath, P. and P. K. Sarker. Effect of GGBFS on setting, workability and early strength properties of fly ash geopolymer concrete cured in ambient condition. Construction and Building Materials, Vol. 66, 2014, pp. 163–171.10.1016/j.conbuildmat.2014.05.080Search in Google Scholar
[33] Gao, X., Q. L. Yu, and H. J. H. Brouwers. Properties of alkali activated slag–fly ash blends with limestone addition. Cement and Concrete Composites, Vol. 59, 2015, pp. 119–128.10.1016/j.cemconcomp.2015.01.007Search in Google Scholar
[34] Gao, X., Q. L. Yu, and H. J. H. Brouwers. Characterization of alkali activated slag–fly ash blends containing nano-silica. Construction and Building Materials, Vol. 98, 2015, pp. 397–406.10.1016/j.conbuildmat.2015.08.086Search in Google Scholar
[35] Nadoushan, M. J. and A. A. Ramezanianpour. The effect of type and concentration of activators on flowability and compressive strength of natural pozzolan and slag-based geopolymers. Construction and Building Materials, Vol. 111, 2016, pp. 337–347.10.1016/j.conbuildmat.2016.02.086Search in Google Scholar
[36] Gao, X., Q. L. Yu, and H. J. H. Brouwers. Assessing the porosity and shrinkage of alkali activated slag-fly ash composites designed applying a packing model. Construction and Building Materials, Vol. 119, 2016, pp. 175–184.10.1016/j.conbuildmat.2016.05.026Search in Google Scholar
[37] Nedeljković, M., Z. Li, and G. Ye. Setting, strength, and autogenous shrinkage of alkali-activated fly ash and slag pastes: Effect of slag content. Materials, Vol. 11, 2018, id. 2121.10.3390/ma11112121Search in Google Scholar PubMed PubMed Central
[38] Najimi, M., N. Ghafoori, and M. Sharbaf. Alkali-activated natural pozzolan/slag mortars: A parametric study. Construction and Building Materials, Vol. 164, 2018, pp. 625–643.10.1016/j.conbuildmat.2017.12.222Search in Google Scholar
[39] Ramezanianpour, A. A. and M. A. Moeini. Mechanical and durability properties of alkali activated slag coating mortars containing nanosilica and silica fume. Construction and Building Materials, Vol. 163, 2018, pp. 611–621.10.1016/j.conbuildmat.2017.12.062Search in Google Scholar
[40] Ibrahim, M., M. A. M. Johari, M. Maslehuddin, and M. K. Rahman. Influence of nano-SiO2 on the strength and microstructure of natural pozzolan based alkali activated concrete. Construction and Building Materials, Vol. 173, 2018, pp. 573–585.10.1016/j.conbuildmat.2018.04.051Search in Google Scholar
[41] Oderji, S. Y., B. Chen, M. R. Ahmad, and S. F. A. Shah. Fresh and hardened properties of one-part fly ash-based geopolymer binders cured at room temperature: Effect of slag and alkali activators. Journal of Cleaner Production, Vol. 225, 2019, pp. 1–10.10.1016/j.jclepro.2019.03.290Search in Google Scholar
[42] Alanazi, H., J. Hu, and Y.-R. Kim. Effect of slag, silica fume, and metakaolin on properties and performance of alkali-activated fly ash cured at ambient temperature. Construction and Building Materials, Vol. 197, 2019, pp. 747–756.10.1016/j.conbuildmat.2018.11.172Search in Google Scholar
[43] Alrefaei, Y., Y.-S. Wang, and J.-G. Dai. The effectiveness of different superplasticizers in ambient cured one-part alkali activated pastes. Cement and Concrete Composites, Vol. 97, 2019, pp. 166–174.10.1016/j.cemconcomp.2018.12.027Search in Google Scholar
[44] Song, W., Z. Zhu, S. Pu, Y. Wan, X. Xu, S. Song, et al. Multi-technical characterization and correlations between properties of standard cured alkali-activated high-calcium FA binders with GGBS as additive. Construction and Building Materials, Vol. 241, 2020, id. 117996.10.1016/j.conbuildmat.2020.117996Search in Google Scholar
[45] Shah, S. F. A., B. Chen, S. Y. Oderji, M. A. Haque, and M. R. Ahmad. Comparative study on the effect of fiber type and content on the performance of one-part alkali-activated mortar. Construction and Building Materials, Vol. 243, 2020, id. 118221.10.1016/j.conbuildmat.2020.118221Search in Google Scholar
[46] Shah, S. F. A., B. Chen, S. Y. Oderji, M. A. Haque, and M. R. Ahmad. Improvement of early strength of fly ash-slag based one-part alkali activated mortar. Construction and Building Materials, Vol. 246, 2020, id. 118533.10.1016/j.conbuildmat.2020.118533Search in Google Scholar
[47] Alrefaei, Y., Y.-S. Wang, and J.-G. Dai. Effect of mixing method on the performance of alkali-activated fly ash/slag pastes along with polycarboxylate admixture. Cement and Concrete Composites, Vol. 117, 2021, id. 103917.10.1016/j.cemconcomp.2020.103917Search in Google Scholar
[48] Paul, E. Influence of superplasticizer on workability and strength of ambient cured alkali activated mortar. Cleaner Materials, Vol. 6, 2022, id. 100152.10.1016/j.clema.2022.100152Search in Google Scholar
[49] Dheyaaldin, M. H., M. A. Mosaberpanah, and R. Alzeebaree. Performance of fiber-reinforced alkali-activated mortar with/without nano silica and nano alumina. Sustainability, Vol. 14, 2022, id. 2527.10.3390/su14052527Search in Google Scholar
[50] Kong, Y. K. and K. Kurumisawa. Application of machine learning in predicting workability for alkali-activated materials. Case Studies in Construction Materials, Vol. 18, 2023, id. e02173. 10.1016/j.cscm.2023.e02173.Search in Google Scholar
[51] Puth, M.-T., M. Neuhäuser, and G. D. Ruxton. Effective use of Pearson's product–moment correlation coefficient. Animal Behaviour, Vol. 93, 2014, pp. 183–189.10.1016/j.anbehav.2014.05.003Search in Google Scholar
[52] Pearson, K. X. On the criterion that a given system of deviations from the probable in the case of a correlated system of variables is such that it can be reasonably supposed to have arisen from random sampling. The London, Edinburgh, and Dublin Philosophical Magazine and Journal of Science, Vol. 50, 1900, pp. 157–175.10.1080/14786440009463897Search in Google Scholar
[53] Gravier, J., V. Vignal, S. Bissey-Breton, and J. Farre. The use of linear regression methods and Pearson’s correlation matrix to identify mechanical–physical–chemical parameters controlling the micro-electrochemical behaviour of machined copper. Corrosion Science, Vol. 50, 2008, pp. 2885–2894.10.1016/j.corsci.2008.07.022Search in Google Scholar
[54] Iqbal, M. F., M. F. Javed, M. Rauf, I. Azim, M. Ashraf, J. Yang, et al. Sustainable utilization of foundry waste: Forecasting mechanical properties of foundry sand based concrete using multi-expression programming. Science of The Total Environment, Vol. 780, 2021, id. 146524.10.1016/j.scitotenv.2021.146524Search in Google Scholar PubMed
[55] Jalal, F. E., Y. Xu, M. Iqbal, B. Jamhiri, and M. F. Javed. Predicting the compaction characteristics of expansive soils using two genetic programming-based algorithms. Transportation Geotechnics, Vol. 30, 2021, id. 100608.10.1016/j.trgeo.2021.100608Search in Google Scholar
[56] Lee, B. C. and D. M. Brooks. Accurate and efficient regression modeling for microarchitectural performance and power prediction. ACM SIGOPS Operating Systems Review, Vol. 40, 2006, pp. 185–194.10.1145/1168917.1168881Search in Google Scholar
[57] Ling, H., C. Qian, W. Kang, C. Liang, and H. Chen. Combination of Support Vector Machine and K-Fold cross validation to predict compressive strength of concrete in marine environment. Construction and Building Materials, Vol. 206, 2019, pp. 355–363. 10.1016/j.conbuildmat.2019.02.071.Search in Google Scholar
[58] Suthaharan, S. and S. Suthaharan. Support vector machine. In: Machine learning models and algorithms for big data classification: Thinking with examples for effective learning, Springer Us, Boston, 2016, pp. 207–235.10.1007/978-1-4899-7641-3_9Search in Google Scholar
[59] Huang, J., Y. Sun, and J. Zhang. Reduction of computational error by optimizing SVR kernel coefficients to simulate concrete compressive strength through the use of a human learning optimization algorithm. Engineering with Computers, Vol. 28, 2021, pp. 1–18.Search in Google Scholar
[60] Khan, K., W. Ahmad, M. N. Amin, A. Ahmad, S. Nazar, A. A. Alabdullah, et al. Exploring the use of waste marble powder in concrete and predicting its strength with different advanced algorithms. Materials, Vol. 15, 2022, id. 4108.10.3390/ma15124108Search in Google Scholar PubMed PubMed Central
[61] Han, Q., C. Gui, J. Xu, and G. Lacidogna. A generalized method to predict the compressive strength of high-performance concrete by improved random forest algorithm. Construction and Building Materials, Vol. 226, 2019, pp. 734–742.10.1016/j.conbuildmat.2019.07.315Search in Google Scholar
[62] Grömping, U. Variable importance assessment in regression: linear regression versus random forest. The American Statistician, Vol. 63, 2009, pp. 308–319.10.1198/tast.2009.08199Search in Google Scholar
[63] Guo, K., X. Wan, L. Liu, Z. Gao, and M. Yang. Fault diagnosis of intelligent production line based on digital twin and improved random forest. Applied Sciences, Vol. 11, 2021, id. 7733.10.3390/app11167733Search in Google Scholar
[64] Farooq, F., W. Ahmed, A. Akbar, F. Aslam, and R. Alyousef. Predictive modeling for sustainable high-performance concrete from industrial wastes: A comparison and optimization of models using ensemble learners. Journal of Cleaner Production, Vol. 292, 2021, id. 126032. 10.1016/j.jclepro.2021.126032.Search in Google Scholar
[65] Khan, S. A., M. A. Khan, M. N. Amin, M. Ali, F. Althoey, and F. Alsharari. Sustainable alternate binding material for concrete using waste materials: A testing and computational study for the strength evaluation. Journal of Building Engineering, Vol. 80, 2023, id. 107932.10.1016/j.jobe.2023.107932Search in Google Scholar
[66] Ahmad, A., K. Chaiyasarn, F. Farooq, W. Ahmad, S. Suparp, and F. Aslam. compressive strength prediction via gene expression programming (GEP) and artificial neural network (ANN) for concrete containing RCA. Buildings, Vol. 11, 2021, id. 324. 10.3390/buildings11080324.Search in Google Scholar
[67] Valavi, R., J. Elith, J. J. Lahoz-Monfort, and G. Guillera-Arroita. blockCV: An r package for generating spatially or environmentally separated folds for k-fold cross-validation of species distribution models. Biorxiv, 2018, id. 357798.10.1101/357798Search in Google Scholar
[68] Lundberg, S. and S. I. Lee. A game theoretic approach to explain the output of any machine learning model, Github, San Francisco, CA, USA, 2021.Search in Google Scholar
[69] Lundberg, S. M., G. Erion, H. Chen, A. DeGrave, J. M. Prutkin, B. Nair, et al. From local explanations to global understanding with explainable AI for trees. Nature Machine Intelligence, Vol. 2, 2020, pp. 56–67.10.1038/s42256-019-0138-9Search in Google Scholar PubMed PubMed Central
[70] Molnar, C. Interpretable machine learning, Lulu. com, Morrisville, North Carolina, United States, 2020.Search in Google Scholar
[71] Lundberg, S. M. and S.-I. Lee. A unified approach to interpreting model predictions. Advances in neural Information Processing Systems, 2017, id. 30.Search in Google Scholar
[72] Shen, Z., A. F. Deifalla, P. Kamiński, and A. Dyczko. Compressive strength evaluation of ultra-high-strength concrete by machine learning. Materials, Vol. 15, 2022, id. 3523.10.3390/ma15103523Search in Google Scholar PubMed PubMed Central
[73] Naqi, A. and J. G. Jang. Recent progress in green cement technology utilizing low-carbon emission fuels and raw materials: A review. Sustainability, Vol. 11, 2019, id. 537.10.3390/su11020537Search in Google Scholar
[74] Valente, M., M. Sambucci, M. Chougan, and S. H. Ghaffar. Reducing the emission of climate-altering substances in cementitious materials: A comparison between alkali-activated materials and Portland cement-based composites incorporating recycled tire rubber. Journal of Cleaner Production, Vol. 333, 2022, id. 130013. 10.1016/j.jclepro.2021.130013.Search in Google Scholar
[75] Luukkonen, T., Z. Abdollahnejad, J. Yliniemi, P. Kinnunen, and M. Illikainen. One-part alkali-activated materials: A review. Cement and Concrete Research, Vol. 103, 2018, pp. 21–34.10.1016/j.cemconres.2017.10.001Search in Google Scholar
[76] Khan, K., W. Ahmad, M. N. Amin, A. Ahmad, S. Nazar, and M. A. Al-Faiad. Assessment of artificial intelligence strategies to estimate the strength of geopolymer composites and influence of input parameters. Polymers, Vol. 14, 2022, id. 2509.10.3390/polym14122509Search in Google Scholar PubMed PubMed Central
© 2024 the author(s), published by De Gruyter
This work is licensed under the Creative Commons Attribution 4.0 International License.
Articles in the same Issue
- Review Articles
- Effect of superplasticizer in geopolymer and alkali-activated cement mortar/concrete: A review
- Experimenting the influence of corncob ash on the mechanical strength of slag-based geopolymer concrete
- Powder metallurgy processing of high entropy alloys: Bibliometric analysis and systematic review
- Exploring the potential of agricultural waste as an additive in ultra-high-performance concrete for sustainable construction: A comprehensive review
- A review on partial substitution of nanosilica in concrete
- Foam concrete for lightweight construction applications: A comprehensive review of the research development and material characteristics
- Modification of PEEK for implants: Strategies to improve mechanical, antibacterial, and osteogenic properties
- Interfacing the IoT in composite manufacturing: An overview
- Advances in processing and ablation properties of carbon fiber reinforced ultra-high temperature ceramic composites
- Advancing auxetic materials: Emerging development and innovative applications
- Revolutionizing energy harvesting: A comprehensive review of thermoelectric devices
- Exploring polyetheretherketone in dental implants and abutments: A focus on biomechanics and finite element methods
- Smart technologies and textiles and their potential use and application in the care and support of elderly individuals: A systematic review
- Reinforcement mechanisms and current research status of silicon carbide whisker-reinforced composites: A comprehensive review
- Innovative eco-friendly bio-composites: A comprehensive review of the fabrication, characterization, and applications
- Review on geopolymer concrete incorporating Alccofine-1203
- Advancements in surface treatments for aluminum alloys in sports equipment
- Ionic liquid-modified carbon-based fillers and their polymer composites – A Raman spectroscopy analysis
- Emerging boron nitride nanosheets: A review on synthesis, corrosion resistance coatings, and their impacts on the environment and health
- Mechanism, models, and influence of heterogeneous factors of the microarc oxidation process: A comprehensive review
- Synthesizing sustainable construction paradigms: A comprehensive review and bibliometric analysis of granite waste powder utilization and moisture correction in concrete
- 10.1515/rams-2025-0086
- Research Articles
- Coverage and reliability improvement of copper metallization layer in through hole at BGA area during load board manufacture
- Study on dynamic response of cushion layer-reinforced concrete slab under rockfall impact based on smoothed particle hydrodynamics and finite-element method coupling
- Study on the mechanical properties and microstructure of recycled brick aggregate concrete with waste fiber
- Multiscale characterization of the UV aging resistance and mechanism of light stabilizer-modified asphalt
- Characterization of sandwich materials – Nomex-Aramid carbon fiber performances under mechanical loadings: Nonlinear FE and convergence studies
- Effect of grain boundary segregation and oxygen vacancy annihilation on aging resistance of cobalt oxide-doped 3Y-TZP ceramics for biomedical applications
- Mechanical damage mechanism investigation on CFRP strengthened recycled red brick concrete
- Finite element analysis of deterioration of axial compression behavior of corroded steel-reinforced concrete middle-length columns
- Grinding force model for ultrasonic assisted grinding of γ-TiAl intermetallic compounds and experimental validation
- Enhancement of hardness and wear strength of pure Cu and Cu–TiO2 composites via a friction stir process while maintaining electrical resistivity
- Effect of sand–precursor ratio on mechanical properties and durability of geopolymer mortar with manufactured sand
- Research on the strength prediction for pervious concrete based on design porosity and water-to-cement ratio
- Development of a new damping ratio prediction model for recycled aggregate concrete: Incorporating modified admixtures and carbonation effects
- Exploring the viability of AI-aided genetic algorithms in estimating the crack repair rate of self-healing concrete
- Modification of methacrylate bone cement with eugenol – A new material with antibacterial properties
- Numerical investigations on constitutive model parameters of HRB400 and HTRB600 steel bars based on tensile and fatigue tests
- Research progress on Fe3+-activated near-infrared phosphor
- Discrete element simulation study on effects of grain preferred orientation on micro-cracking and macro-mechanical behavior of crystalline rocks
- Ultrasonic resonance evaluation method for deep interfacial debonding defects of multilayer adhesive bonded materials
- Effect of impurity components in titanium gypsum on the setting time and mechanical properties of gypsum-slag cementitious materials
- Bending energy absorption performance of composite fender piles with different winding angles
- Theoretical study of the effect of orientations and fibre volume on the thermal insulation capability of reinforced polymer composites
- Synthesis and characterization of a novel ternary magnetic composite for the enhanced adsorption capacity to remove organic dyes
- Couple effects of multi-impact damage and CAI capability on NCF composites
- Mechanical testing and engineering applicability analysis of SAP concrete used in buffer layer design for tunnels in active fault zones
- Investigating the rheological characteristics of alkali-activated concrete using contemporary artificial intelligence approaches
- Integrating micro- and nanowaste glass with waste foundry sand in ultra-high-performance concrete to enhance material performance and sustainability
- Effect of water immersion on shear strength of epoxy adhesive filled with graphene nanoplatelets
- Impact of carbon content on the phase structure and mechanical properties of TiBCN coatings via direct current magnetron sputtering
- Investigating the anti-aging properties of asphalt modified with polyphosphoric acid and tire pyrolysis oil
- Biomedical and therapeutic potential of marine-derived Pseudomonas sp. strain AHG22 exopolysaccharide: A novel bioactive microbial metabolite
- Effect of basalt fiber length on the behavior of natural hydraulic lime-based mortars
- Optimizing the performance of TPCB/SCA composite-modified asphalt using improved response surface methodology
- Compressive strength of waste-derived cementitious composites using machine learning
- Melting phenomenon of thermally stratified MHD Powell–Eyring nanofluid with variable porosity past a stretching Riga plate
- Development and characterization of a coaxial strain-sensing cable integrated steel strand for wide-range stress monitoring
- Compressive and tensile strength estimation of sustainable geopolymer concrete using contemporary boosting ensemble techniques
- Customized 3D printed porous titanium scaffolds with nanotubes loading antibacterial drugs for bone tissue engineering
- Facile design of PTFE-kaolin-based ternary nanocomposite as a hydrophobic and high corrosion-barrier coating
- Effects of C and heat treatment on microstructure, mechanical, and tribo-corrosion properties of VAlTiMoSi high-entropy alloy coating
- Study on the damage mechanism and evolution model of preloaded sandstone subjected to freezing–thawing action based on the NMR technology
- Promoting low carbon construction using alkali-activated materials: A modeling study for strength prediction and feature interaction
- Entropy generation analysis of MHD convection flow of hybrid nanofluid in a wavy enclosure with heat generation and thermal radiation
- Friction stir welding of dissimilar Al–Mg alloys for aerospace applications: Prospects and future potential
- Fe nanoparticle-functionalized ordered mesoporous carbon with tailored mesostructures and their applications in magnetic removal of Ag(i)
- Study on physical and mechanical properties of complex-phase conductive fiber cementitious materials
- Evaluating the strength loss and the effectiveness of glass and eggshell powder for cement mortar under acidic conditions
- Effect of fly ash on properties and hydration of calcium sulphoaluminate cement-based materials with high water content
- Analyzing the efficacy of waste marble and glass powder for the compressive strength of self-compacting concrete using machine learning strategies
- Experimental study on municipal solid waste incineration ash micro-powder as concrete admixture
- Parameter optimization for ultrasonic-assisted grinding of γ-TiAl intermetallics: A gray relational analysis approach with surface integrity evaluation
- Producing sustainable binding materials using marble waste blended with fly ash and rice husk ash for building materials
- Effect of steam curing system on compressive strength of recycled aggregate concrete
- A sawtooth constitutive model describing strain hardening and multiple cracking of ECC under uniaxial tension
- Predicting mechanical properties of sustainable green concrete using novel machine learning: Stacking and gene expression programming
- Toward sustainability: Integrating experimental study and data-driven modeling for eco-friendly paver blocks containing plastic waste
- A numerical analysis of the rotational flow of a hybrid nanofluid past a unidirectional extending surface with velocity and thermal slip conditions
- A magnetohydrodynamic flow of a water-based hybrid nanofluid past a convectively heated rotating disk surface: A passive control of nanoparticles
- Prediction of flexural strength of concrete with eggshell and glass powders: Advanced cutting-edge approach for sustainable materials
- Efficacy of sustainable cementitious materials on concrete porosity for enhancing the durability of building materials
- Phase and microstructural characterization of swat soapstone (Mg3Si4O10(OH)2)
- Effect of waste crab shell powder on matrix asphalt
- Improving effect and mechanism on service performance of asphalt binder modified by PW polymer
- Influence of pH on the synthesis of carbon spheres and the application of carbon sphere-based solid catalysts in esterification
- Experimenting the compressive performance of low-carbon alkali-activated materials using advanced modeling techniques
- Thermogravimetric (TG/DTG) characterization of cold-pressed oil blends and Saccharomyces cerevisiae-based microcapsules obtained with them
- Investigation of temperature effect on thermo-mechanical property of carbon fiber/PEEK composites
- Computational approaches for structural analysis of wood specimens
- Integrated structure–function design of 3D-printed porous polydimethylsiloxane for superhydrophobic engineering
- Exploring the impact of seashell powder and nano-silica on ultra-high-performance self-curing concrete: Insights into mechanical strength, durability, and high-temperature resilience
- Axial compression damage constitutive model and damage characteristics of fly ash/silica fume modified magnesium phosphate cement after being treated at different temperatures
- Integrating testing and modeling methods to examine the feasibility of blended waste materials for the compressive strength of rubberized mortar
- Special Issue on 3D and 4D Printing of Advanced Functional Materials - Part II
- Energy absorption of gradient triply periodic minimal surface structure manufactured by stereolithography
- Marine polymers in tissue bioprinting: Current achievements and challenges
- Quick insight into the dynamic dimensions of 4D printing in polymeric composite mechanics
- Recent advances in 4D printing of hydrogels
- Mechanically sustainable and primary recycled thermo-responsive ABS–PLA polymer composites for 4D printing applications: Fabrication and studies
- Special Issue on Materials and Technologies for Low-carbon Biomass Processing and Upgrading
- Low-carbon embodied alkali-activated materials for sustainable construction: A comparative study of single and ensemble learners
- Study on bending performance of prefabricated glulam-cross laminated timber composite floor
- Special Issue on Recent Advancement in Low-carbon Cement-based Materials - Part I
- Supplementary cementitious materials-based concrete porosity estimation using modeling approaches: A comparative study of GEP and MEP
- Modeling the strength parameters of agro waste-derived geopolymer concrete using advanced machine intelligence techniques
- Promoting the sustainable construction: A scientometric review on the utilization of waste glass in concrete
- Incorporating geranium plant waste into ultra-high performance concrete prepared with crumb rubber as fine aggregate in the presence of polypropylene fibers
- Investigation of nano-basic oxygen furnace slag and nano-banded iron formation on properties of high-performance geopolymer concrete
- Effect of incorporating ultrafine palm oil fuel ash on the resistance to corrosion of steel bars embedded in high-strength green concrete
- Influence of nanomaterials on properties and durability of ultra-high-performance geopolymer concrete
- Influence of palm oil ash and palm oil clinker on the properties of lightweight concrete