Discrete element simulation study on effects of grain preferred orientation on micro-cracking and macro-mechanical behavior of crystalline rocks
-
Yunpeng Hu
 ,
Zhenrong Xia
,
Zhenrong Xia

Abstract
Grain-preferred orientation significantly influences the brittle fracture mechanism and failure mode of crystalline rocks. However, current grain-based models (GBMs) based on particle flow code (PFC) software are mostly proposed on the basis of the Voronoi tessellation method for grain boundary generation, which is difficult to simulate the heterogeneity of microstructure such as shape and orientation of rock minerals. To study the effect of grain-preferred orientation on macroscopic mechanical properties and microscopic characteristics of crystalline rocks, a novel grain-based microstructure transformation method (MTM) is proposed. Based on the MTM, a GBM with a target aspect ratio and crystal orientation is obtained by transforming the Voronoi crystal geometry through a planar coordinate mapping. Specifically, embedded FISH language is used to control random mineral seed size and distribution pattern to generate Tyson polygons. A polygon geometry that satisfies the rock texture is obtained as a grain boundary by spatially transforming the vertex of the Tyson polygon. The transformed complex geometry is taken as the crystal structure of the GBM, and the Lac du Bonnet granite models with different aspect ratios and crystal orientations were developed in PFC2D. Finally, a series of unconfined compressive strength tests are performed in PFC2D to verify the proposed modeling methods for the geometric variation of the crystals and to study the effects of the preferred orientation of the grains on the macroscopic mechanical properties and microscopic fracture mechanisms of the crystalline rocks from different perspectives.
1 Introduction
Natural rocks are heterogeneous bodies that are composed of a variety of minerals. The properties of the rock are generally determined by the type of mineral, compositional content, mineral size, and arrangement within the rock [1,2]. Under external loading, this heterogeneity leads to large differences in mechanical properties including strength and deformation of homogeneous rocks with similar mineral content [3,4]. As studies delve deeper into smaller scales, it has become evident that local stress concentration at the scale of rock mineral crystals fundamentally causes macroscopic rock damage [5,6]. The presence of discontinuous surface defects significantly influences the mechanical properties and stability of the rock mass. Moreover, crystal orientation and intergrowth patterns are crucial in determining the anisotropic behavior of rocks, which influence their response to stress, shear, and deformation [7,8]. Therefore, the effect of microgeometry on rock strength and deformation needs to be studied at the grain scale to further investigate the intrinsic mechanisms of rock damage.
In the past few decades, scholars have conducted numerous experimental studies on non-homogeneous rocks, exploring the impact of microstructural heterogeneity on macroscopic mechanical properties [9,10]. Research findings indicated a complex nonlinear relationship between the macroscopic mechanical properties of rocks and various fine mineral parameters [11,12,13]. An increase in plagioclase feldspar mineral content corresponded to increased uniaxial compressive strength of the rock, while the rock’s cracking stress was significantly influenced by mineral composition, showing a positive correlation [14,15]. The average size of mineral crystals significantly influences the uniaxial compressive strength of rocks, particularly when the grain size is less than 1 mm [16]. Microscopic experiments highlighted that the grain arrangement significantly impacts rock properties, leading to stress concentration and the emergence of local cracks, ultimately affecting the damage pattern of the rock [17]. In summary, crystal properties and spatial geometric distribution of minerals significantly influence strength-related mechanical parameters of rocks, such as modulus of elasticity, uniaxial compressive strength, and splitting tensile strength [18,19]. Nonetheless, precise control of these factors in actual experiments posed challenges due to the wide dispersion of properties in naturally obtained specimens and the influence of the test operator’s subjectivity. Conducting systematic studies of inhomogeneous rocks at the fine mineral scale using experimental methods still posed significant challenges in understanding physical and mechanical properties.
The advancement in numerical simulation software has enabled a detailed exploration of the damage mechanisms within fractured rock masses [20,21]. In order to accurately simulate and observe the destruction process of rocks, the grain-based model (GBM) approach has received increasing attention from researchers [5,22,23]. It was an effective method that could simulate crystalline rocks and observe the rock destruction process from multiple scales [24,25]. GBM implementation in universal distinct element code (UDEC), 3 dimension distinct element code (3DEC), and particle flow code (PFC) has facilitated the investigation of microscopic fracture and micromechanical behavior of rock [26,27]. Intergranular deformation and fracture between blocks were simulated by assigning a Coulomb sliding model, representing particles as block cells. The simulation, while dividing the internal block into multiple zones to simulate intracrystalline deformation, is limited in explicitly simulating intracrystalline cracking due to restricted damage between particles [28,29]. The damage process of rocks with crystallographic orientation had been studied using 3DEC, but it was also limited to the effect of crystallographic orientation on macroscopic mechanical properties. The results of the study do not go deeper into the microscopic level involving the intracrystalline damage situation [30]. However, the influence of crystal properties on the characterization of crystalline rocks was still focused on by some schoolers, and they finally made some technical breakthroughs through in-depth research. Some scholars present a numerical approach that assesses the influence of mineral heterogeneity and rock mass defects (pore structures) on the fracturing performance of Soundless Cracking Demolition Agents at the grain size level by 3DEC. Moreover, intergranular and intracrystalline fracturing of the assembly was also simulated by utilizing a dual-layer discretization technique [31].
In PFC-GBMs, rocks were viewed as an aggregate of balls. These balls were divided into different groups according to the shape of the crystals in the crystalline rocks and assigned different material properties [32]. The intracrystalline and intergranular damage in crystalline rocks were characterized by the failure of the bonded particle model, including the parallel bonded model (PBM), smooth jointed model (SJM), and flat joint model (FJM). They enabled realistic simulation of intracrystalline and intergranular damage in crystalline rocks. However, PBM has some limitations in the simulation process due to its inability to resist bending moments in grain contacts. The direct tensile strength of the model would be too large when matched to the unconfined compressive strength of a typical dense rock. The FJM proposed by Potyondy [33,34,35,36] can solve this problem. The most significant advantage of the FJM is that it successfully modeled the sustained rotational resistance after bond breakage between rock particles. The contact model provides a finite size, linear elasticity, and macroscopic behavior of bonded or frictional interfaces that may withstand partial damage, allowing to simulate the microstructure of angularly interlocked particles. Additionally, SJM simulated the mechanical behavior between intergroup crystals. A novel particle model (nGBM) introduced in the two-dimensional PFC 5.0 aimed to simulate the microcracking process in crystalline brittle rock [37] explores the critical impact of rock cracking on geological applications, focusing on the influence of mechanical parameters at the rock grain scale on fluid-driven cracking behavior. Numerical simulations employing the GBM approach in the discrete element method (DEM) indicate increased simulated rock strength with larger grain size [38]. The research team investigated the influence of brittleness on the microcracking behavior of crystalline rock through GBM implemented in a two-dimensional PFC [39]. These findings emphasize the role of mineral strength and bonding in characterizing rock brittleness at a microscale.
Previous research results obtained through experiments and numerical simulation all demonstrated that the microstructure of crystalline rocks had a large influence on the macroscopic strength and microscopic fracture process of rocks, including the size and morphology of minerals, spatial distribution, and alignment direction [40,41,42]. The microscopic crack evolution of rocks that penetrate deeply into the crystal interior under loading can be observed by PFC-GBMs. However, conventional PFC-GBMs still have certain shortcomings. As shown in Figure 1, it was well known that recrystallized quartz minerals in granites had an obviously preferred orientation (
![Figure 1
Microstructure of quartz-oriented distribution in granite [47].](/document/doi/10.1515/rams-2024-0001/asset/graphic/j_rams-2024-0001_fig_001.jpg)
Microstructure of quartz-oriented distribution in granite [47].
However, it can be found by summarizing the results of previous studies that the existing GBMs in PFC-GBMs failed to control both the size distribution and the preferred orientation of mineral grains, leading to the inability to observe the evolution of microscopic cracks of rocks that penetrate deeply into the crystal interior under loading condition. To realize the simulation of grain-preferred orientation in PFC2D, it is necessary to first develop modeling techniques that can build rock grains with certain aspect ratios. In this research, we proposed a novel GBM that can generate a certain aspect ratio and preferred orientation of grain by the microstructure transformation method (MTM) to study the effect of the angle (/°) between the direction of the principal stress of a crystalline rock under load and the grain orientation on rock fracture process. A standardized calibration process for the PFC-GBMs model parameters was also provided. Based on the new model proposed in this article, the relationship among grain preferred orientation, macroscopic strength, microscopic fracture evolution, and damage mode of rock was studied. The rest of this article is organized as follows: Section 2 presents the algorithm for generating specimens with a certain aspect ratio and crystallization angle in PFC-GBMs. The idea of numerical experiments and the whole process for microparameters calibration involved in the proposed PFC-GBM is introduced in Section 3. In Section 4, the influence of the preferred orientation of the grain on the mechanical properties of the rock by conducting a series of numerical experiments was investigated. Finally, a conclusion of the study is provided in Section 5. The novelty of the research results in this article is mainly in two aspects. One is that a novel generation procedure of GBMs that can generate a specified aspect ratio and crystallographic orientation was proposed in PFC2D, and the other is the effects of grain-preferred orientation on macroscopic mechanical properties and microscopic rupture mechanisms of crystalline rock materials were investigated from multiple scales.
2 Numerical approach
2.1 FJM and SJM in PFC
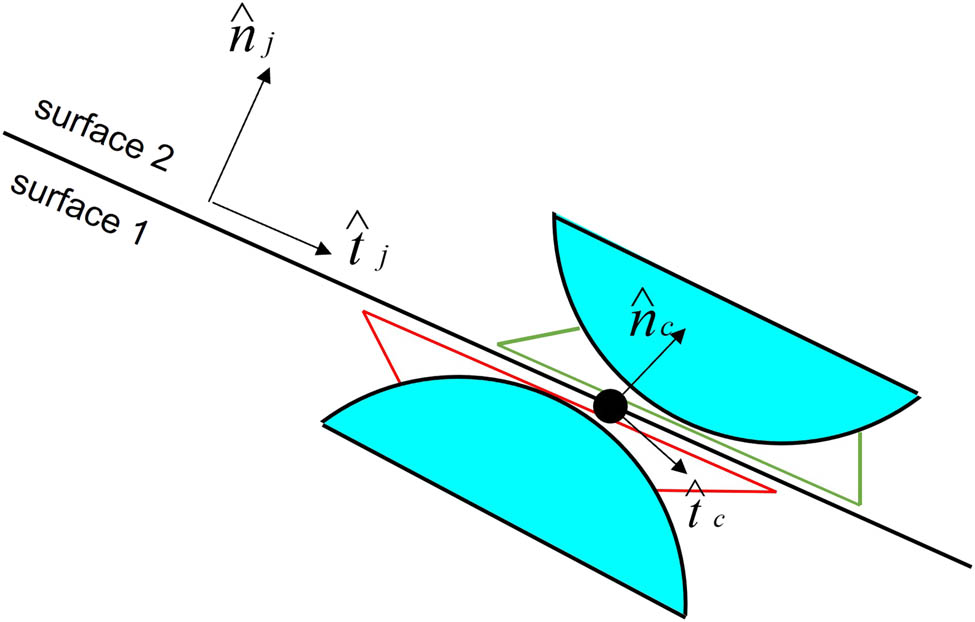
According to the documentation of PFC, PFC2D software simulates a realistic deformed body through many rigid non-deformable discs and the contact behavior between discs and discs [33]. Generally, PBM and FJM can be used to simulate cemented materials like rocks. The FJM has a better characterization of the mechanical behavior of the rock, although the computational complexity is higher. The FJM model discretizes the contact surface between particles into several cells (see Figure 2 from the PFC manual), each of which can undergo damage. The force (F (e)) and bending moment (M (e)) are applied at the center of each cell, and the mechanical update of the contact surface is calculated as the sum of the cells on the contact surface
where

Schematic diagram of the FJM model in PFC2D: (a) flat-jointed material and (b) flat-joint contact.
The SJM is used to simulate the mechanical behavior between two planes (Figure 3). The parallel bonding of adjacent particles through which the joint passes is replaced by the SJM. The SJM is typically used to avoid the unwanted mechanical dilation and additional frictional resistance that can be observed during particle interlocking/sliding over neighboring particles. The SJM in PFC provides two types of nodal interfaces: bonded interface and unbonded interface. The mechanical behavior of the bonded interface is linear-elastic. The bond fracture occurs when the contact force exceeds the ultimate strength. The unbonded interface comes with an expansive frictional slip between them. It adjusts the shear force at the joint surface by the Coulomb limit, and the joint surface does not rotate.
Smooth-joint contact in PFC2D.
2.2 GBMs
The development of the GBM aimed to overcome the limitations associated with inadequate inclusion when simulating rock-like materials in PFC. The GBM elevates the compression–tension ratio of rock materials to a realistic level, offering a more precise depiction of the mechanical behavior of crystalline rocks. In PFC-GBMs, the linear parallel bond model (LPBM) primarily simulates the mechanical behavior of individual minerals, whereas the SJM interfaces between grains. Based on research findings highlighting limitations in characterizing the tensile strength ratio and strength envelope of rocks, the FJM was introduced to simulate mineral mechanical behavior. Despite being more computationally intensive than the LPBM, the FJM provides superior accuracy in representing the mechanical behavior of intact rock-like materials [48].
In general, the shape of grains is simulated by Tyson polygons. It is found that Tyson polygons can simulate the actual mineral shape well, and the GBM generated by this grain structure can accurately reflect the mechanical properties of hard rock (i.e., granite). A Tyson polygon is a set of continuous polygons consisting of perpendicular bisectors connecting line segments of two neighboring points. Each vertex of it is the center of the outer circle of each triangle. Many instances in nature have the shape of Tyson polygons, for example, leaf veins, dragonfly wings, giraffe body texture, land cracks, including the crystalline shape of rocks. The process of generating Tyson polygons can be done in the following steps (Figure 4):
Scattering seeds uniformly in space. Tyson polygons with a certain distribution of sizes can be generated by controlling the distance between seeds.
Constructing a Delaunay triangle mesh from the discrete point data and recording the triangle numbers and the corresponding vertex information.
Connecting the outer circle of the Delaunay triangle network. This is done by drawing the perpendiculars of each triangle edge. These mid-pipelines form the sides of the Tyson polygon, and the intersection of the mid-pipelines is the vertex of the corresponding Tyson polygon.
Connecting the corresponding vertices to form a Tyson polygon according to spatial relationship.

The generation process of normal Tyson polygons.
The mineral boundaries are generated by the above Tyson polygon program (named Voronoi tessellation method [VTM], in PFC) and imported into the PFC, and the GBM is generated by giving the particles different groupings and set contacts between balls. In general, the contacts in the GBM can be categorized into intragranular and intergranular contacts. Different microscopic parameters are used for different groups of contacts, which increases the heterogeneity of the rock mass and allows a better simulation of various mechanical properties of the rock. In early GBM studies [23,49], for GBMs with n minerals, the parameters of the n minerals are usually calibrated independently, and the contact between different minerals is assigned the same mechanical parameters. In all, there are a total of (n + 1) contact types in the final PFC model. However, many studies [37] have shown that this simulation method does not represent well the inhomogeneity of the rock. Subsequent studies focused on the inhomogeneity of the intergranular contacts of various types of minerals. Different contact parameters were used for the contacts between different crystals. Consequently, a total of (n + (n + 1) × n/2) contact types were obtained in the final model. This type of numerical model is more responsive to the mechanical properties of the rock [45].
2.3 Directional GBM generation procedure in PFC2D
The conventional Tyson polygon generation process in PFC (i.e., VTM) is mainly to assign different groups to the PFC particles according to their geometrical properties after generation and then assign the corresponding contact model and contact parameters.
In this article, the morphology and growth direction of crystals are further considered. After the generation of VTM, the standard Tyson polygons are secondary generated into Tyson-like polygons with a certain aspect ratio and a certain growth direction. Consequently, the intact specific generation process is as follows (Figure 5):
First, N groups (N is a count of mineral type) of ball particles are generated in PFC using the FISH language. The average size of each group of ball particles is equal to the average size of that mineral type (to increase heterogeneity, the ball size can be set to a positive-terrestrial distribution). The proportion of particle volume of each mineral to the volume of all ball particles is the same as that of the real rock minerals. After the model is statically balanced, the circle centers of these ball particles are used as seeds for generating traditional Tyson polygons. These seeds are used to generate standard Tyson polygons according to the procedure in Section 2.2 (Figure 5a). The generated Voronoi shapes are representative of the mineral composition of the original rock. The generated Tyson polygon topology is stored in an external.txt file.
The Voronoi topology information in step 1 is scaled according to the target aspect ratio, as shown in Figure 5(b). It is worth noting that it should be ensured that the number of PFC particles contained in a single Voronoi remains the same before and after scaling, and the area of Voronoi should remain the same before and after scaling. If we take the y-axis as the long-axis direction, the x-axis as the short-axis direction, and the target aspect ratio as R, then multiply all the vertex x-coordinate values in the file by
The vertex information in step 2 is rotated in plane space according to the following equation and rotated to the target loading angle, as shown in Figure 5(c). Then, the vertex information of the secondary processing is saved.
where v (x, y) is the Tyson polygon vertex position after the aspect ratio scaling in step 2; v′(x′, y′) is the new vertex position after the spatial rotation; and φ is the target loading angle.
The model particles are generated in PFC2D according to the appropriate porosity as well as size. Afterward, the particles are grouped according to the geometric information in step 3 to form the GBM geometry model, and the excess particles are removed to form the target-size specimen. The entire particle generation process is shown in Figure 6.

Preferred orientation distributions of Voronoi tessellations generated by the MTM.

Generation procedure of GBM.
3 Numerical setup
3.1 GBM calibration
This study focuses on simulating Lac Du Bonnet (LDB) granite, a type of crystalline rock. The rock comprises the following mineral percentages: alkali feldspar (48%), plagioclase (17%), quartz (29%), and mica (primarily biotite, constituting 6%). Mineral grain seed diameters are as follows: alkali feldspar (3–4 mm), plagioclase (2–6 mm), quartz (2–3 mm), and biotite (2 mm). As described in Section 2.1, the simulation utilized the FJM and SJM models for intra- and intergranular contact simulation (Figure 7). PFC’s minimum particle radius is 0.15 mm, with a maximum-to-minimum particle radius ratio of R max/R min = 1.66 [45]. The calibration process involves both intracrystalline and intergranular parameter adjustments. Initially, individual minerals underwent calibration (intracrystalline parameter calibration), followed by adjusting the intergranular contact parameters for the entire specimen.

Generation process for fabrication of LDB granite and contact model of GBM.
The calibration of microscale parameters in PFC significantly differs from deriving common macroscale mechanical parameters like Young’s modulus (E), Poisson ratio (ν), unconfined compressive strength (UCS) (σ c), and tensile strength (σ t) directly from physical tests. This discrepancy underscores the critical nature of calibrating microscale parameters for accurate simulations. Calibration in PFC is a meticulous process that often involves iterative trials informed by physical test results. Fortunately, established principles and empirical procedures aid this calibration process, serving as a guide for determining these microscale parameters. In this study, specific fine view parameters were employed and are detailed in Table 1.
Main macroscopic and microscopic mechanical parameters of model
| fj_emod – effective modulus of FJM | α_fa – attenuation friction angle |
| fj_kratio – normal-to-shear stiffness ratio of FJM | φ b – friction angle |
| fj_ten – tensile strength of FJM | u – friction coefficient |
| fj_coh – cohesion of FJM | N r – number of elements in radial direction |
| fj_fa – friction angle of FJM | c b – cohesion |
| α_E – attenuation effective modulus | K n/K s – normal-to-shear stiffness ratio |
| α_k – attenuation normal-to-shear stiffness ratio | D – particle size |
| α_coh – attenuation cohesion | ρ – particle density |
| α_ten – attenuation tensile strength | E c – effective modulus |
The contact parameters are mainly divided into deformation parameters (Young’s model, Poisson ratio) and strength parameters (cohesion, friction angle, tension). Before the calibration of individual mineral parameters, the deformation parameters are first calibrated. The target elastic modulus and Poisson ratio are matched by adjusting the parameters of fj_emod and fj_kratio. After the calibration of deformation parameters, the contact strength parameters are then adjusted. In general, the tensile strength of the specimen is more influenced by the parameter of fj_ten, and higher tensile strength is obtained by increasing the value of fj_ten. The final compressive strength is generally influenced by the parameters of fj_coh and fj_fa, but fj_fa mainly affects the triaxial test results and has little effect on uniaxial test results. In the process of calibrating strength parameters, the deformation parameters also need to be fine-tuned.
The intergranular parameters are selected as the average of the mineral parameters on both sides and multiplied by an attenuation factor. The intergranular parameters are influenced by five attenuation coefficients, namely, α_E, α_k, α_ten, α_coh, and α_fa, which characterize the deformation and strength changes of the specimens. α_E and α_k affect the modulus of elasticity and Poisson’s ratio of the specimen, respectively. While α_ten, α_coh, and α_fa affect the tensile strength and compressive strength of the specimen. The calibration process is shown in Figure 8. After the calibration process according to the previous method, the final calibration results and the actual LDB granite test parameters are shown in Table 2. The microscopic contact parameters are shown in Table 3.

Calibration process based on SJM and FJM.
Macro-mechanical properties of LdB granite [5]
| Macro-mechanical properties | Experiment | Simulation |
|---|---|---|
| Young’s modulus, E (GPa) | 69 ± 5.8 | 69.84 |
| Poisson ratio, v | 0.26 ± 0.04 | 0.25 |
| Uniaxial compressive strength, σ c (MPa) | 200 ± 22 | 199.08 |
| Tensile strength, σ t (MPa) | 7.4 ± 1.04 | 7.43 |
Microscopic properties of four minerals and their grain boundaries
| Microscale parameters | Alkali feldspar | Plagioclase | Quartz | Biotite |
|---|---|---|---|---|
| Microscale parameters of intracrystalline group | ||||
| D min | 0.15 | 0.15 | 0.15 | 0.15 |
| D max/D min | 1.66 | 1.66 | 1.66 | 1.66 |
| ρ (kg·m−3) | 2,650 | 2,650 | 2,650 | 2,650 |
| E c (GPa) | 53 | 70 | 73 | 100 |
| K n /K s | 1.5 | 1.5 | 1.5 | 1.5 |
| u | 0.5 | 0.5 | 0.5 | 0.5 |
| N r | 4 | 4 | 4 | 4 |
| c b | 235 | 290 | 475 | 220 |
| φ b | 10 | 13 | 2 | 10 |
| Microscale parameters of intergranular group | ||||
| α_ E | 0.65 | — | — | — |
| α_ k | 2.5 | — | — | — |
| α_coh | 0.35 | — | — | — |
| α_ten | 0.32 | — | — | — |
| α_ fa | 1.0 | — | — | — |
3.2 Numerical simulations
The present study focuses on the comparison of UCS test results and does not involve triaxial loading (Figure 9). The peak stress, Young’s module, Poisson ratio, and tensile strength of the specimens were calibrated by uniaxial compressive tests and Brazilian tests during the numerical simulation. The uniaxial compressive test is performed by applying pressure at a fixed rate in opposite directions through the wall at the top and bottom ends. The axial strain is the ratio of the change in distance between the walls at both ends to the initial distance during the simulation. The tensile strength of the rock was calibrated using the Brazilian test. The upper and lower walls apply only relative vertical velocities to squeeze the specimen, and all contact forces applied on the wall are monitored and summed during the calculation. The tensile strength was calculated by the following equation:
where P is the average value of the reaction force on the wall at the upper and lower ends of the disc, D is the diameter of the disc specimen, and t is the thickness of the disc (t = 1 in two-dimensional analysis). The rock simulation models with different aspect ratios and preferred orientations were established according to the MTM proposed in Chapter 2 (Figure 10). The macroscopic mechanical strength and microscopic fracture evolution of the specimens were investigated for different aspect ratios (1.25, 1.50, 1.75, 2.00) and crystal orientations (0°, 30°, 45°, 60°, 90°).

Physical geometric parameters and loading conditions of the numerical model.


Numerical models of rocks with different aspect ratios and preferred orientations. (a) Schematic of preferred orientation angle, (b) aspect ratio = 1.25, (c) aspect ratio = 1.50, (d) aspect ratio = 1.75, and (e) aspect ratio = 2.00.
4 Numerical results
In this section, numerical simulation experiments of the corresponding model were carried out based on the new modeling approach. The effects of the aspect ratio of rock grain and distribution of rock grain preferred orientations (
4.1 Stress–strain response
The stress–strain curves obtained from the uniaxial compression test for specimens, illustrated in Figure 11 (taking an aspect ratio of 2.0 as an example), reveal a consistent pattern. These curves display an initial rapid ascent to the peak, followed by a subsequent decline in stress as the axial strain increases. Notably, variations in rock grain orientation influence the strain at which the specimens reach their peak strength. In Figure 12a, the trends in UCS with respect to the angle θ showcase a distinctive pattern of decrease and subsequent increase with the increment in θ. Notably, larger aspect ratios correspond to lower minimum UCS values. Furthermore, when the rock grain’s aspect ratio is small (e.g., R = 1.25 and 1.50), the curve demonstrates a gradual incline, contrasting sharply with a steeper slope observed at larger aspect ratios (e.g., R = 1.75 and 2.00), culminating in a peak at a 90° orientation. At this juncture, the UCS experiences an increase ranging from 11 to 70% compared to the scenario where R = 1.25. Figure 12b illustrates the UCS variation concerning the aspect ratio for different orientation models. Observations indicate that when θ is below 30°, the UCS tends to exhibit a slow decline with increasing aspect ratio. Conversely, when θ surpasses 60°, the UCS tends to rise in conjunction with the aspect ratio.

Stress–strain curve of the specimen under uniaxial compression.

Relationship between UCS and rock grain with different aspect ratios and orientations: (a) different orientations and (b) different aspect ratios.
In general, the UCS of the specimens with different aspect ratios had similar trends with the change of preferred orientation (Figure 13). However, the inflection point of the UCS curve seemed to occur at around 30°. Since only two characteristic angles of grain orientation in the range of 0 to 30° were selected to study, several additional numerical simulations were carried out for orientations of 5°, 10°, 15°, 20°, and 25°. In order to exclude the influence of the aspect ratio on the experimental results, three additional conditions with aspect ratios of 1.25, 1.50, and 1.75 were also considered in the analytical discussion of the model. The final numerical experimental results are shown in Figure 14. It can be seen that there is an inflection point in the curve occurred when the grain preferred orientation is around 30°. Moreover, when

Stress–strain curve of rock samples with different grain preferred orientations.

Variation of specimens’ UCS (especially when
4.2 Features of fractures
4.2.1 Composition of fractures
The loading was stopped when the average stress of the wall (at the post-peak section of curve) reached 70% of the peak stress. It can be obtained that the change of crack evolution and macroscopic mechanical strength of the rock was similar under compression conditions. As

Effect of the preferred orientation of the grain on macroscopic cracks of rock specimens.
Furthermore, in crystalline rocks, the minerals exhibit substantial mechanical strength, while the interfaces between these minerals display comparatively lower quality. The damage in such rocks initiates from the breakdown of intergranular weak surfaces, progressively advancing toward the crystal’s interior. The rock’s load-bearing capacity is compromised directly upon the formation of a penetration surface within the crystals. Alternatively, stress diffusion into the crystals induces intracrystalline damage that ultimately leads to the creation of a continuous surface. The escalation in intracrystalline cracking corresponds to a heightened proportional contribution of minerals (the primary bearers of the rock’s load-bearing capacity) to the rock’s resilience against damage. Thus, the presence of intracrystalline cracks can, to some extent, signify alterations in macroscopic strength. As shown in Figure 16, during compression, intracrystalline cracks account for a larger proportion compared to intergranular cracks and are the main crack type in the rock specimen. With the increase of

Effect of the preferred orientation on intracrystalline and intergranular cracks.
4.2.2 Direction of fractures
Under uniaxial compression conditions, the orientation of both intergranular and intragranular cracks was roughly parallel to the loading direction (i.e., concentrated around 90°), which was more consistent with the existing research results. However, as

Microcrack orientation in the numerical models with different grain preferred orientations: (a) loading angle = 0°, (b) loading angle = 10°, (c) loading angle = 45°, (d) loading angle = 60°, and (e) loading angle = 90°.
4.3 Failure mode
The typical failure patterns of the samples with different preferred orientations are shown in Figure 18. It can be seen that the macroscopic failure mode of rock was presented as an axial splitting tensile failure. There were fewer macroscopic cracks when

Effect of the preferred orientation on the macro failure characteristics.
From the distribution of microcracks, it can be obtained from Figure 19 that fewer cracks developed in the specimen when

Effect of the preferred orientation on the microcrack distribution.

Micro-failure modes and damage features of crystalline rock under uniaxial compression.
5 Discussion
The article concentrated on the macro-mechanical response and micro-evolutionary mechanisms of crystalline rocks exhibiting varied grain orientations under axial loading. Utilizing the MTM, the embedded FISH language controls random mineral seed size and distribution patterns to create Tyson polygons. A polygonal geometry that matches the rock texture is obtained as a grain boundary by spatially transforming the vertices of the Tyson polygon. In comparison to similar research, this article presented two primary focal points: (1) Introducing a novel approach to establishing a GBM with specific aspect ratios and preferred orientations based on the conventional GBM utilizing Tyson polygons in PFC. (2) Analyzing, for the first time, the impact and mechanism of load direction and grain preferred orientation on the macroscopic mechanical properties, microscopic crack evolution, and damage mode of crystalline rocks across multiple scales.
The research results indicated that the GBM studied in this article can be divided into an intra-granular contact model (FJM) and an intergranular contact model (SJM). Usually, the intergranular contact surface is a “weak field surface” with relatively low strength. Therefore, intergranular cracks tend to appear earlier in the stress transfer process [37]. In addition, the FJM model is based on the x- and y-coordinates of the global coordinate system, while the SJM model differs from the FJM model in that the mechanical calculations are updated based on the vertical and tangential directions of the joint (the edge corresponding to the Tyson polygon in GBM), which makes the ball–ball contact between two crystals more “smooth” [47]. Under external loading, shear stresses spread rapidly and are transmitted in the direction of cleavage damage. When the local shear force is greater than the shear strength of the SJM or FJM model, microcracks are formed. When the preferred orientation of grain is parallel to the dominant direction of the maximum shear stress in the model, the weak contact surfaces between the crystals are more likely to break under the misaligned shear of the crystals with greater stiffness on both sides, as in Figure 21(a). And when the preferred orientation of grain deviates from the direction of the maximum shear stress, the transfer of stress needs to overcome both the intergranular interface resistance and the intracrystalline material resistance. At this time, the normal extrusion force also aggravates the fracture of the contact, as shown in Figure 21(b). When the crack develops from intergranular to intracrystalline, more energy is needed to break the FJM contact that possesses greater roughness, which adds difficulties to the formation and penetration of macroscopic cracks in the model.

Mechanisms of grain destruction with different preferred orientations and loading directions: (a)
From the macroscopic mechanical properties of the rock, the initiation of cracking is due to the development and expansion of internal tension cracks, but its final damage is due to the through shear zone formed on the specimen. Elastic calculations based on the Moore–Coulomb theory can obtain the angle between the final shear damage zone of the rock and the main stress loading direction under uniaxial compression conditions as (45−φ/2), as shown in Figure 22. The internal friction angle of crystalline rock is generally 40–50°, so the angle between the rupture surface and the main stress direction is roughly 20–25°. The compressive strength of the specimen reaches its lowest when the stress direction of the crystalline rock is closer to the crystal meritocratic orientation (the direction of the final rupture surface). Conversely, the mechanical strength of the rock is higher.

Schematic diagram of the fracture surface of the macroscopic rock mass.
Although the critical angle obtained in the numerical tests is close to theoretical calculated values, there is still a deviation of within 5° (Figure 23). This is due to the fact that the numerical simulation of uniaxial compression was carried out mainly for rock samples with different preferred orientations of grain in this article, and the influence of the aspect ratio of grain on the microscopic frictional properties of crystalline rock grains was not considered much this time. In fact, the variation of mechanical strength of crystalline rock with loading angle for different grain aspect ratios can be found that as the aspect ratio varies between 1.25 and 2.0, the critical angle also varies in the range from 20° to 27°. The two factors are related by a quadratic function. The larger the aspect ratio is, the smaller the critical angle is, and the variation of the critical angle tends to flatten out at the aspect ratio of 2.0. Thus, based on the new modeling method proposed in this article, the grain aspect ratio parameter is set as a constant value of 2.0. Moreover, as shown in Figure 24, the grain aspect ratio is linearly related to the UCS of the rock specimen. The difference is that UCSmax is positively correlated with the aspect ratio, while UCSmin is negatively correlated with the aspect ratio. Therefore, for geotechnical engineering in actual crystalline rock formations, the relationship between the loading angle and preferred orientation, aspect ratio of grain has a large influence on the macroscopic mechanical properties of the rock [51]. This is also one of the key concerns when conducting simulation analysis and stability evaluation of rock properties in such formations. We will give more consideration to the effect of the aspect ratio in our subsequent study and how to extend the research methods and results to more complex 3D models with stress transfer and spatial structure.
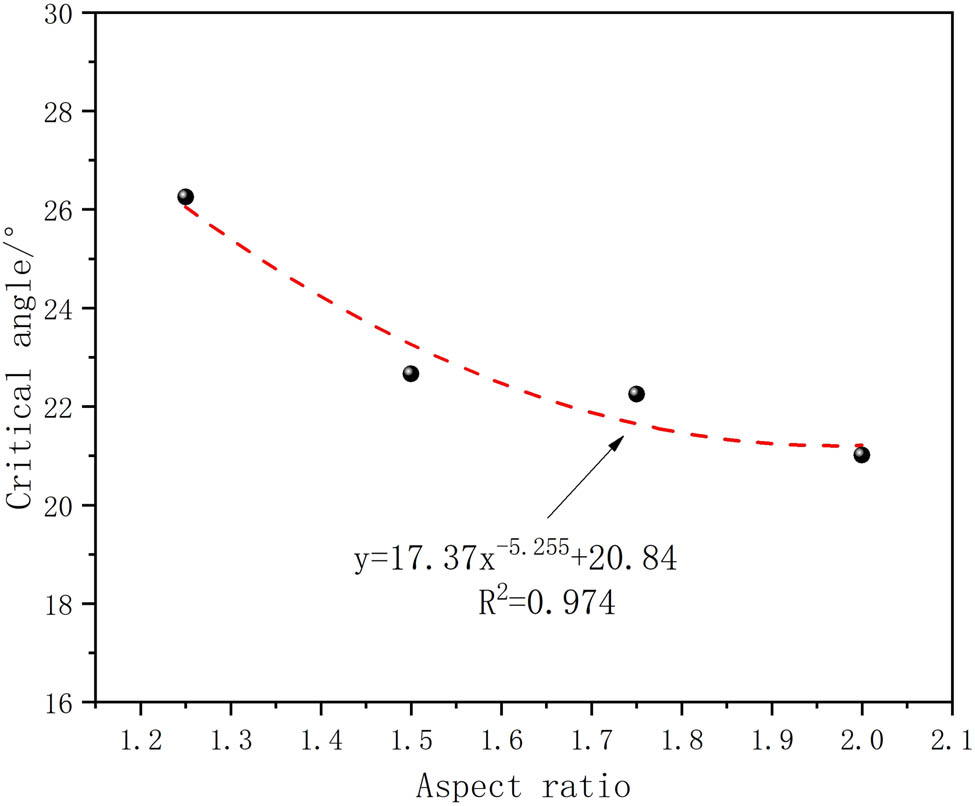
Effect of grain aspect ratio on the critical angle.

Effect of grain aspect ratio on UCS of rock.
6 Conclusion
This article introduces a novel GBM implemented by MTM in PFC2D, capable of generating specified aspect ratios and crystallographic orientations. A standardized calibration process for the model parameters was outlined. Subsequently, utilizing the new model, the study investigated the impact of the angle between the primary stress direction of the crystalline rock and the model’s grain-preferred orientation on the fracture process and failure mode. This encompassed an analysis of the macroscopic mechanical properties, microscopic crack evolution, and the typical damage mode of the rock. Finally, the study delved into the destruction process and microscopic mechanisms of this particular type of crystalline rock under various loading angles, resulting in the following conclusions:
The novel GBM outlined in this article considers both the aspect ratio and crystal orientation. A program code was developed to extend and rotate the conventional Tyson polygon, assigning geometric orientation properties to the crystals. The numerical test results demonstrated the model’s capability to investigate the mechanical response and microscopic characteristics of crystalline rocks exhibiting various grain-preferred orientations under diverse external loading directions.
The angle between the loading direction and crystal orientation significantly influenced the macroscopic mechanical properties of preferentially oriented crystalline rocks. Proximity to the critical angle resulted in diminished macro-mechanical strength of the rock. Conversely, a greater deviation from the critical angle led to increased macro-mechanical strength during the uniaxial compression process.
An inversion point occurred in the curve depicting tensile and shear cracks as the angle between the loading direction and preferred orientation approached the critical angle, resulting in a reduced load-carrying capacity of the specimen. The maximum number of cracks coincided with the loading angle being perpendicular to the preferred grain orientation, aligning with the material’s peak macroscopic mechanical strength.
There were two coexisting damage modes of crystalline rocks under uniaxial compression: intergranular failure and intragranular failure. The damage pattern varied based on the preferred orientation of grains and the direction of external loading. A larger proportion of intergranular cracks occurred when the angle between the preferred orientation and loading direction was below the critical angle. At a 90° angle, crystal penetration failure became the primary form of rock damage, accompanied by a certain level of intergranular damage, fully utilizing the material’s load-bearing capacity.
-
Funding information: This paper was supported by opening research project (KF2021-09), S&T Program of Hebei (225676162GH), China Postdoctoral Science Foundation (2023M744103) and Sichuan Science and Technology Program (grant number 2022NSFSC1176).
-
Author contributions: YP Hu: writing – original draft; ZR Zhang: writing – review and editing; ZW Yan: numerical simulation; YC Dong: writing – supervision and funding acquisition; YQ Zhu: conceptualization; ZR Xia: article framing; ZW Yan: editing; TD Guo: resources; WX Long: supervision. All authors have accepted responsibility for the entire content of this manuscript and approved its submission.
-
Conflict of interest: The authors state no conflict of interest.
References
[1] Blair, S. C. and N. Cook. Analysis of compressive fracture in rock using statistical techniques: Part II. Effect of microscale heterogeneity on macroscopic deformation. International Journal of Rock Mechanics and Mining Sciences, Vol. 35, No. 7, 1998, pp. 849–861.10.1016/S0148-9062(98)00009-6Search in Google Scholar
[2] Zhou, L. J., S. L. Xu, J. F. Shan, Y. Liu, and P. Wang. Heterogeneity in deformation of granite under dynamic combined compression/shear loading. Mechanics of Materials, Vol. 123, 2018, pp. 1–18.10.1016/j.mechmat.2018.04.013Search in Google Scholar
[3] Pan, C., X. Li, L. He, and J. Li. Study on the effect of micro-geometric heterogeneity on mechanical properties of brittle rock using a grain-based discrete element method coupling with the cohesive zone model. International Journal of Rock Mechanics and Mining Sciences, 2021, id. 140.10.1016/j.ijrmms.2021.104680Search in Google Scholar
[4] Xiao, H. G., L. He, X. Li, Q. Zhang, and W. Li. Texture synthesis: A novel method for generating digital models with heterogeneous diversity of rock materials and its CGM verification. Computers and Geotechnics, Vol. 130, 2021, id. 103895.10.1016/j.compgeo.2020.103895Search in Google Scholar
[5] Liu, G., M. Cai, and M. Huang. Mechanical properties of brittle rock governed by micro-geometric heterogeneity. Computers and Geotechnics, Vol. 104, 2018, pp. 358–372.10.1016/j.compgeo.2017.11.013Search in Google Scholar
[6] Hemmati, A., M. Ghafoori, H. Moomivand, and G. R. Lashkaripour. The effect of mineralogy and textural characteristics on the strength of crystalline igneous rocks using image-based textural quantification. Engineering Geology, Vol. 266, 2020, id. 105467.10.1016/j.enggeo.2019.105467Search in Google Scholar
[7] Zhang, S., S. Qiu, P. Kou, S. Li, P. Li, and S. Yan. Investigation of damage evolution in heterogeneous rock based on the grain-based finite-discrete element model. Materials, Vol. 14, No. 14, 2021, pp. 39–69.10.3390/ma14143969Search in Google Scholar PubMed PubMed Central
[8] Zhang, S., S. Qiu, P. Li, Y. Kou, Z. Xie, and L. Jia. Mode I fracture behavior of heterogeneous granite: Insights from grain-based FDEM modelling. Engineering Fracture Mechanics, 2023, id. 284.10.1016/j.engfracmech.2023.109267Search in Google Scholar
[9] Tang, C. A., L. G., Tham, P. Lee, Y. Tsui, and L. Tham. Numerical studies of the influence of microstructure on rock failure in uniaxial compression - Part II: Constraint, slenderness and size effect. International Journal of Rock Mechanics and Mining Sciences, Vol. 37, No. 4, 2000, pp. 571–583.10.1016/S1365-1609(99)00122-7Search in Google Scholar
[10] Gallagher Jr, J. J., M. Friedman, J. Handin, and G. M. Sowers. Experimental studies relating to microfracture in sandstone. Tectonophysics, Vol. 21, No. 3, 1974.10.1016/0040-1951(74)90053-5Search in Google Scholar
[11] Irfan, T. Y. Mineralogy, fabric properties and classification of weathered granites in Hong Kong. Quarterly Journal of Engineering Geology and Hydrogeology, Vol. 29, 1996, pp. 5–35.10.1144/GSL.QJEGH.1996.029.P1.02Search in Google Scholar
[12] Eberhardt, E., B. Stimpson, and D. Stead. Effects of grain size on the initiation and propagation thresholds of stress-induced brittle fractures. Rock Mechanics and Rock Engineering, Vol. 32, No. 2, 1999, pp. 81–99.10.1007/s006030050026Search in Google Scholar
[13] Fujii, Y., T. Takemura, M. Takahashi, and W. Lin. Surface features of uniaxial tensile fractures and their relation to rock anisotropy in Inada granite. International Journal of Rock Mechanics and Mining Sciences, Vol. 44, No. 1, 2007, pp. 98–107.10.1016/j.ijrmms.2006.05.001Search in Google Scholar
[14] Undul, O. Assessment of mineralogical and petrographic factors affecting petro-physical properties, strength and cracking processes of volcanic rocks. Engineering Geology, Vol. 210, 2016, pp. 10–22.10.1016/j.enggeo.2016.06.001Search in Google Scholar
[15] Undul, O., F. Amann, N. Aysal, and M. L. Plötze. Micro-textural effects on crack initiation and crack propagation of andesitic rocks. Engineering Geology, Vol. 193, 2015, pp. 267–275.10.1016/j.enggeo.2015.04.024Search in Google Scholar
[16] Tugrul, A. and I. H. Zarif. Correlation of mineralogical and textural characteristics with engineering properties of selected granitic rocks from Turkey. Engineering Geology, Vol. 51, No. 4, 1999, pp. 303–317.10.1016/S0013-7952(98)00071-4Search in Google Scholar
[17] Hallbauer, D. K., H. Wagner, and N. G. W. Cook. Some observations concerning the microscopic and mechanical behaviour of quartzite specimens in stiff, triaxial compression tests. International Journal of Rock Mechanics and Mining Sciences & Geomechanics Abstracts, Vol. 10, No. 6, 1973, pp. 713–726.10.1016/0148-9062(73)90015-6Search in Google Scholar
[18] Prikryl, R. Some microstructural aspects of strength variation in rocks. International Journal of Rock Mechanics and Mining Sciences, Vol. 38, No. 5, 2001, pp. 671–682.10.1016/S1365-1609(01)00031-4Search in Google Scholar
[19] Atapour, H. and A. Mortazavi. The influence of mean grain size on unconfined compressive strength of weakly consolidated reservoir sandstones. Journal of Petroleum Science and Engineering, Vol. 171, 2018, pp. 63–70.10.1016/j.petrol.2018.07.029Search in Google Scholar
[20] Zheng, W. B. and D. D. Tannant. Grain breakage criteria for discrete element models of sand crushing under one-dimensional compression. Computers and Geotechnics, Vol. 95, 2018, pp. 231–239.10.1016/j.compgeo.2017.10.004Search in Google Scholar
[21] Feng, Q., S. Hou, W. Liu, S. Zhang, W. Li, and M. Tian. Study on the simulation method and mesoscopic characteristics of rock freeze-thaw damage. Computers and Geotechnics, Vol. 153, 2023, id. 105038.10.1016/j.compgeo.2022.105038Search in Google Scholar
[22] Cundall, P. A. A computer model for simulating progressive large scale movements in blocky rock systems[C]. In Proceedings of the Symposium of the International Society of Rock Mechanics (Nancy, France, 1971), Vol. 1, 1971, Paper No. II-8.10.1016/0148-9062(71)90008-8Search in Google Scholar
[23] Bahrani, N. and P. K. Kaiser. Numerical investigation of the influence of specimen size on the unconfined strength of defected rocks. Computers and Geotechnics, Vol. 77, 2016, pp. 56–67.10.1016/j.compgeo.2016.04.004Search in Google Scholar
[24] Huang, Y. H., S. Q. Yang, P. G. Ranjith, and J. Zhao. Strength failure behavior and crack evolution mechanism of granite containing pre-existing non-coplanar holes: Experimental study and particle flow modeling. Computers and Geotechnics, Vol. 88, 2017, pp. 182–198.10.1016/j.compgeo.2017.03.015Search in Google Scholar
[25] Yin, T. B., D. D. Zhuang, M. J. Li, and X. B. Li. Numerical simulation study on the thermal stress evolution and thermal cracking law of granite under heat conduction. Computers and Geotechnics, Vol. 148, 2022, id. 104813.10.1016/j.compgeo.2022.104813Search in Google Scholar
[26] Wong, L., J. Peng, and C. I. Teh. Numerical investigation of mineralogical composition effect on strength and micro-cracking behavior of crystalline rocks. Journal of Natural Gas Science and Engineering, Vol. 53, 2018, pp. 191–203.10.1016/j.jngse.2018.03.004Search in Google Scholar
[27] Gao, F. Q. and H. P. Kang. Grain-based discrete-element modeling study on the effects of cementation on the mechanical behavior of low-porosity brittle rocks. International Journal of Geomechanics, Vol. 17, No. 9, 201710.1061/(ASCE)GM.1943-5622.0000957Search in Google Scholar
[28] Sinha, S. and G. Walton. A study on Bonded Block Model (BBM) complexity for simulation of laboratory-scale stress-strain behavior in granitic rocks. Computers and Geotechnics, Vol. 118, 2020, id. 103363.10.1016/j.compgeo.2019.103363Search in Google Scholar
[29] Li, X. F., Q. B. Zhang, H. B. Li, and J. Zhao. Grain-based discrete element method (GB-DEM) modelling of multi-scale fracturing in rocks under dynamic loading. Rock Mechanics and Rock Engineering, Vol. 51, No. 12, 2018, pp. 3785–3817.10.1007/s00603-018-1566-2Search in Google Scholar
[30] Ghazvinian, E., M. S, Diederichs, and R. Quey. 3D random Voronoi grain-based models for simulation of brittle rock damage and fabric-guided micro-fracturing. Journal of Rock Mechanics and Geotechnical Engineering, Vol. 6, No. 6, 2014, pp. 506–521.10.1016/j.jrmge.2014.09.001Search in Google Scholar
[31] De Silva, V. R. S., H. Konietzky, H. Märten, P. G. Ranjith, Z. Lei, and T. Xu. Grain-scale numerical simulation of crystalline rock fracturing using soundless cracking demolition agents for in-situ preconditioning. Computers and Geotechnics, Vol. 155, 2023, id. 105187.10.1016/j.compgeo.2022.105187Search in Google Scholar
[32] Potyondy, D. O. A grain-based model for rock: Approaching The True Microstructure. In Proceedings of rock mechanics in the Nordic Countries, 2010, pp. 9–12.Search in Google Scholar
[33] Potyondy, D. O. A flat-jointed bonded-particle model for rock. Paper presented at the 52nd U.SRock Mechanics/Geomechanics Symposium, Seattle, Washington, June 2018.Search in Google Scholar
[34] Potyondy, D. O. A flat-jointed bonded-particle material for hard rock. Paper presented at the 46th U.SRock Mechanics/Geomechanics Symposium, Chicago, Illinois, June 2012.Search in Google Scholar
[35] Potyondy, D. “PFC3D Flat-Joint Contact Model (version 1),” Itasca Consulting Group, Inc., Minneapolis, MN, Technical Memorandum ICG7234-L, June 25, 2013.Search in Google Scholar
[36] Potyondy, D. “PFC2D Flat-Joint Contact Model,” Itasca Consulting Group, Inc., Minneapolis, MN, Technical Memorandum ICG7138-L, July 26, 2012.Search in Google Scholar
[37] Zhou, J., H. Lan, L. Zhang, D. Yang, J. Song, and S. Wang. Novel grain-based model for simulation of brittle failure of Alxa porphyritic granite. Engineering Geology, Vol. 251, 2019, pp. 100–114.10.1016/j.enggeo.2019.02.005Search in Google Scholar
[38] Peng, J., L. N. Wong, C. I. Teh, and Z. Li. Modeling micro-cracking behavior of bukit timah granite using grain-based model. Rock Mechanics and Rock Engineering, Vol. 51, No. 1, 2018, pp. 135–154.10.1007/s00603-017-1316-xSearch in Google Scholar
[39] Peng, K., Y. Zhang, X. Xu, J. Han, and Y. Luo. Numerical investigation of brittleness effect on strength and microcracking behavior of crystalline rock. International Journal of Geomechanics, Vol. 22, No. 10, 2022, id. 04022178.10.1061/(ASCE)GM.1943-5622.0002529Search in Google Scholar
[40] Eberhardt, E., D. Stead, B. Stimpson, and R. S. Read. Identifying crack initiation and propagation thresholds in brittle rock. Canadian Geotechnical Journal, Vol. 35, No. 2, 1998, pp. 222–233.10.1139/t97-091Search in Google Scholar
[41] Diederichs, M. S., P. K. Kaiser, and E. Eberhardt. Damage initiation and propagation in hard rock during tunnelling and the influence of near-face stress rotation. International Journal of Rock Mechanics and Mining Sciences, Vol. 41, No. 5, 2004, pp. 785–812.10.1016/j.ijrmms.2004.02.003Search in Google Scholar
[42] Wong, L., and H. H. Einstein. Crack coalescence in molded gypsum and carrara marble: Part 1. macroscopic observations and interpretation. Rock Mechanics and Rock Engineering, Vol. 42, No. 3, 2009, pp. 475–511.10.1007/s00603-008-0002-4Search in Google Scholar
[43] Bahrani, N., P. K. Kaiser, and B. Valley. Distinct element method simulation of an analogue for a highly interlocked, non-persistently jointed rockmass. International Journal of Rock Mechanics and Mining Sciences, Vol. 71, 2014, pp. 117–130.10.1016/j.ijrmms.2014.07.005Search in Google Scholar
[44] Wong, L., and Y. H. Zhang. An extended grain-based model for characterizing crystalline materials: An example of Marble. Advanced Theory and Simulations, Vol. 1, No. 8, 2018, id. 1800039.10.1002/adts.201800039Search in Google Scholar
[45] Zhao, X., D. Elsworth, Y. He, W. Hu, and T. Wang. A grain texture model to investigate effects of grain shape and orientation on macro-mechanical behavior of crystalline rock. International Journal of Rock Mechanics and Mining Sciences, Vol. 148, 2021, id. 104971.10.1016/j.ijrmms.2021.104971Search in Google Scholar
[46] Zhang, T., L. Yu, Y. Peng, H. Jing, H. Su, and J. Wei. Effect of the mineral spatial distribution heterogeneity on the tensile strength of granite: Insights from PFC3D-GBM numerical analysis. Journal of Rock Mechanics and Geotechnical Engineering, Vol.15, 2022, pp. 1144–1160.10.1016/j.jrmge.2022.07.012Search in Google Scholar
[47] Mehranpour, M. H. and P. H. Kulatilake. Improvements for the smooth joint contact model of the particle flow code and its applications. Computers and Geotechnics, Vol. 87, 2017, pp. 163–177.10.1016/j.compgeo.2017.02.012Search in Google Scholar
[48] Wu, S. and X. Xu. A study of three intrinsic problems of the classic discrete element method using flat-joint model. Rock Mechanics and Rock Engineering, Vol. 49, 2016, pp. 1813–1830.10.1007/s00603-015-0890-zSearch in Google Scholar
[49] Hofmann, H., T. Babadagli, J. S. Yoon, A. Zang, and G. Zimmermann. A grain based modeling study of mineralogical factors affecting strength, elastic behavior and micro fracture development during compression tests in granites. Engineering Fracture Mechanics, Vol. 147, 2015, pp. 261–275.10.1016/j.engfracmech.2015.09.008Search in Google Scholar
[50] Nicksiar, M. and D. C. Martin. Factors affecting crack initiation in low porosity crystalline rocks. Rock Mechanics and Rock Engineering, Vol. 47, No. 4, 2014, pp. 1165–1181.10.1007/s00603-013-0451-2Search in Google Scholar
[51] Menegon, L., G. Pennacchioni, R. Heilbronner, and L. Pittarello. Evolution of quartz microstructure and c-axis crystallographic preferred orientation within ductilely deformed granitoids (Arolla unit, Western Alps). Journal of Structural Geology, Vol. 30, No. 11, 2008, pp. 1332–1347.10.1016/j.jsg.2008.07.007Search in Google Scholar
© 2024 the author(s), published by De Gruyter
This work is licensed under the Creative Commons Attribution 4.0 International License.
Articles in the same Issue
- Review Articles
- Effect of superplasticizer in geopolymer and alkali-activated cement mortar/concrete: A review
- Experimenting the influence of corncob ash on the mechanical strength of slag-based geopolymer concrete
- Powder metallurgy processing of high entropy alloys: Bibliometric analysis and systematic review
- Exploring the potential of agricultural waste as an additive in ultra-high-performance concrete for sustainable construction: A comprehensive review
- A review on partial substitution of nanosilica in concrete
- Foam concrete for lightweight construction applications: A comprehensive review of the research development and material characteristics
- Modification of PEEK for implants: Strategies to improve mechanical, antibacterial, and osteogenic properties
- Interfacing the IoT in composite manufacturing: An overview
- Advances in processing and ablation properties of carbon fiber reinforced ultra-high temperature ceramic composites
- Advancing auxetic materials: Emerging development and innovative applications
- Revolutionizing energy harvesting: A comprehensive review of thermoelectric devices
- Exploring polyetheretherketone in dental implants and abutments: A focus on biomechanics and finite element methods
- Smart technologies and textiles and their potential use and application in the care and support of elderly individuals: A systematic review
- Reinforcement mechanisms and current research status of silicon carbide whisker-reinforced composites: A comprehensive review
- Innovative eco-friendly bio-composites: A comprehensive review of the fabrication, characterization, and applications
- Review on geopolymer concrete incorporating Alccofine-1203
- Advancements in surface treatments for aluminum alloys in sports equipment
- Ionic liquid-modified carbon-based fillers and their polymer composites – A Raman spectroscopy analysis
- Emerging boron nitride nanosheets: A review on synthesis, corrosion resistance coatings, and their impacts on the environment and health
- Mechanism, models, and influence of heterogeneous factors of the microarc oxidation process: A comprehensive review
- Synthesizing sustainable construction paradigms: A comprehensive review and bibliometric analysis of granite waste powder utilization and moisture correction in concrete
- 10.1515/rams-2025-0086
- Research Articles
- Coverage and reliability improvement of copper metallization layer in through hole at BGA area during load board manufacture
- Study on dynamic response of cushion layer-reinforced concrete slab under rockfall impact based on smoothed particle hydrodynamics and finite-element method coupling
- Study on the mechanical properties and microstructure of recycled brick aggregate concrete with waste fiber
- Multiscale characterization of the UV aging resistance and mechanism of light stabilizer-modified asphalt
- Characterization of sandwich materials – Nomex-Aramid carbon fiber performances under mechanical loadings: Nonlinear FE and convergence studies
- Effect of grain boundary segregation and oxygen vacancy annihilation on aging resistance of cobalt oxide-doped 3Y-TZP ceramics for biomedical applications
- Mechanical damage mechanism investigation on CFRP strengthened recycled red brick concrete
- Finite element analysis of deterioration of axial compression behavior of corroded steel-reinforced concrete middle-length columns
- Grinding force model for ultrasonic assisted grinding of γ-TiAl intermetallic compounds and experimental validation
- Enhancement of hardness and wear strength of pure Cu and Cu–TiO2 composites via a friction stir process while maintaining electrical resistivity
- Effect of sand–precursor ratio on mechanical properties and durability of geopolymer mortar with manufactured sand
- Research on the strength prediction for pervious concrete based on design porosity and water-to-cement ratio
- Development of a new damping ratio prediction model for recycled aggregate concrete: Incorporating modified admixtures and carbonation effects
- Exploring the viability of AI-aided genetic algorithms in estimating the crack repair rate of self-healing concrete
- Modification of methacrylate bone cement with eugenol – A new material with antibacterial properties
- Numerical investigations on constitutive model parameters of HRB400 and HTRB600 steel bars based on tensile and fatigue tests
- Research progress on Fe3+-activated near-infrared phosphor
- Discrete element simulation study on effects of grain preferred orientation on micro-cracking and macro-mechanical behavior of crystalline rocks
- Ultrasonic resonance evaluation method for deep interfacial debonding defects of multilayer adhesive bonded materials
- Effect of impurity components in titanium gypsum on the setting time and mechanical properties of gypsum-slag cementitious materials
- Bending energy absorption performance of composite fender piles with different winding angles
- Theoretical study of the effect of orientations and fibre volume on the thermal insulation capability of reinforced polymer composites
- Synthesis and characterization of a novel ternary magnetic composite for the enhanced adsorption capacity to remove organic dyes
- Couple effects of multi-impact damage and CAI capability on NCF composites
- Mechanical testing and engineering applicability analysis of SAP concrete used in buffer layer design for tunnels in active fault zones
- Investigating the rheological characteristics of alkali-activated concrete using contemporary artificial intelligence approaches
- Integrating micro- and nanowaste glass with waste foundry sand in ultra-high-performance concrete to enhance material performance and sustainability
- Effect of water immersion on shear strength of epoxy adhesive filled with graphene nanoplatelets
- Impact of carbon content on the phase structure and mechanical properties of TiBCN coatings via direct current magnetron sputtering
- Investigating the anti-aging properties of asphalt modified with polyphosphoric acid and tire pyrolysis oil
- Biomedical and therapeutic potential of marine-derived Pseudomonas sp. strain AHG22 exopolysaccharide: A novel bioactive microbial metabolite
- Effect of basalt fiber length on the behavior of natural hydraulic lime-based mortars
- Optimizing the performance of TPCB/SCA composite-modified asphalt using improved response surface methodology
- Compressive strength of waste-derived cementitious composites using machine learning
- Melting phenomenon of thermally stratified MHD Powell–Eyring nanofluid with variable porosity past a stretching Riga plate
- Development and characterization of a coaxial strain-sensing cable integrated steel strand for wide-range stress monitoring
- Compressive and tensile strength estimation of sustainable geopolymer concrete using contemporary boosting ensemble techniques
- Customized 3D printed porous titanium scaffolds with nanotubes loading antibacterial drugs for bone tissue engineering
- Facile design of PTFE-kaolin-based ternary nanocomposite as a hydrophobic and high corrosion-barrier coating
- Effects of C and heat treatment on microstructure, mechanical, and tribo-corrosion properties of VAlTiMoSi high-entropy alloy coating
- Study on the damage mechanism and evolution model of preloaded sandstone subjected to freezing–thawing action based on the NMR technology
- Promoting low carbon construction using alkali-activated materials: A modeling study for strength prediction and feature interaction
- Entropy generation analysis of MHD convection flow of hybrid nanofluid in a wavy enclosure with heat generation and thermal radiation
- Friction stir welding of dissimilar Al–Mg alloys for aerospace applications: Prospects and future potential
- Fe nanoparticle-functionalized ordered mesoporous carbon with tailored mesostructures and their applications in magnetic removal of Ag(i)
- Study on physical and mechanical properties of complex-phase conductive fiber cementitious materials
- Evaluating the strength loss and the effectiveness of glass and eggshell powder for cement mortar under acidic conditions
- Effect of fly ash on properties and hydration of calcium sulphoaluminate cement-based materials with high water content
- Analyzing the efficacy of waste marble and glass powder for the compressive strength of self-compacting concrete using machine learning strategies
- Experimental study on municipal solid waste incineration ash micro-powder as concrete admixture
- Parameter optimization for ultrasonic-assisted grinding of γ-TiAl intermetallics: A gray relational analysis approach with surface integrity evaluation
- Producing sustainable binding materials using marble waste blended with fly ash and rice husk ash for building materials
- Effect of steam curing system on compressive strength of recycled aggregate concrete
- A sawtooth constitutive model describing strain hardening and multiple cracking of ECC under uniaxial tension
- Predicting mechanical properties of sustainable green concrete using novel machine learning: Stacking and gene expression programming
- Toward sustainability: Integrating experimental study and data-driven modeling for eco-friendly paver blocks containing plastic waste
- A numerical analysis of the rotational flow of a hybrid nanofluid past a unidirectional extending surface with velocity and thermal slip conditions
- A magnetohydrodynamic flow of a water-based hybrid nanofluid past a convectively heated rotating disk surface: A passive control of nanoparticles
- Prediction of flexural strength of concrete with eggshell and glass powders: Advanced cutting-edge approach for sustainable materials
- Efficacy of sustainable cementitious materials on concrete porosity for enhancing the durability of building materials
- Phase and microstructural characterization of swat soapstone (Mg3Si4O10(OH)2)
- Effect of waste crab shell powder on matrix asphalt
- Improving effect and mechanism on service performance of asphalt binder modified by PW polymer
- Influence of pH on the synthesis of carbon spheres and the application of carbon sphere-based solid catalysts in esterification
- Experimenting the compressive performance of low-carbon alkali-activated materials using advanced modeling techniques
- Thermogravimetric (TG/DTG) characterization of cold-pressed oil blends and Saccharomyces cerevisiae-based microcapsules obtained with them
- Investigation of temperature effect on thermo-mechanical property of carbon fiber/PEEK composites
- Computational approaches for structural analysis of wood specimens
- Integrated structure–function design of 3D-printed porous polydimethylsiloxane for superhydrophobic engineering
- Exploring the impact of seashell powder and nano-silica on ultra-high-performance self-curing concrete: Insights into mechanical strength, durability, and high-temperature resilience
- Axial compression damage constitutive model and damage characteristics of fly ash/silica fume modified magnesium phosphate cement after being treated at different temperatures
- Integrating testing and modeling methods to examine the feasibility of blended waste materials for the compressive strength of rubberized mortar
- Special Issue on 3D and 4D Printing of Advanced Functional Materials - Part II
- Energy absorption of gradient triply periodic minimal surface structure manufactured by stereolithography
- Marine polymers in tissue bioprinting: Current achievements and challenges
- Quick insight into the dynamic dimensions of 4D printing in polymeric composite mechanics
- Recent advances in 4D printing of hydrogels
- Mechanically sustainable and primary recycled thermo-responsive ABS–PLA polymer composites for 4D printing applications: Fabrication and studies
- Special Issue on Materials and Technologies for Low-carbon Biomass Processing and Upgrading
- Low-carbon embodied alkali-activated materials for sustainable construction: A comparative study of single and ensemble learners
- Study on bending performance of prefabricated glulam-cross laminated timber composite floor
- Special Issue on Recent Advancement in Low-carbon Cement-based Materials - Part I
- Supplementary cementitious materials-based concrete porosity estimation using modeling approaches: A comparative study of GEP and MEP
- Modeling the strength parameters of agro waste-derived geopolymer concrete using advanced machine intelligence techniques
- Promoting the sustainable construction: A scientometric review on the utilization of waste glass in concrete
- Incorporating geranium plant waste into ultra-high performance concrete prepared with crumb rubber as fine aggregate in the presence of polypropylene fibers
- Investigation of nano-basic oxygen furnace slag and nano-banded iron formation on properties of high-performance geopolymer concrete
- Effect of incorporating ultrafine palm oil fuel ash on the resistance to corrosion of steel bars embedded in high-strength green concrete
- Influence of nanomaterials on properties and durability of ultra-high-performance geopolymer concrete
- Influence of palm oil ash and palm oil clinker on the properties of lightweight concrete