Study on the damage mechanism and evolution model of preloaded sandstone subjected to freezing–thawing action based on the NMR technology
-
Shuailong Lian
 ,
Wenqing Peng
,
Wenqing Peng

Abstract
Investigating the damage degradation of rock during the freezing and thawing process is more consistent with the actual engineering environment, considering its internal initial damage. In this study, the effects of initial damage from preloading and subzero-temperature freezing–thawing on microscopic and macroscopic mechanical properties of sandstone were studied based on the nuclear magnetic resonance (NMR) technique. The results show that the P-wave velocity of the sample decreased, while the porosity increased as the initial damage level increased. The distribution of T2 signal intensity exposed to the low-temperature freezing–thawing–saturation treatment was rather larger than that under normal temperature conditions for samples with different levels of initial damage from preloading, indicating that the low-temperature freezing–thawing condition would promote the porosity and have an obvious increase in damage. A continuum damage model considering subzero-temperature freezing–thawing damage from different pore sizes was finally introduced to describe the damage evolution mechanism of sandstone. The research results can be used to quantitatively evaluate the damage evolution mechanism of sandstone treated by subzero-temperature freezing–thawing without mechanical tests. Furthermore, the analysis and research results show that the damage variables of sandstone obtained by the NMR theory were lower than those of classical rock mechanics theory.
1 Introduction
Rock materials in the development of mineral resources and construction of civil engineering are easily affected by seasonal and diurnal temperature cycles in cold areas. Investigating the freezing–thawing mechanical properties of rock is of great significance for geotechnical engineering in cold regions [1,2,3,4,5]. Deterioration of mechanical properties depends on the internal damage of rock. The internal damage of rock is closely related to the change of the microscopic pore structure. A majority of researchers coming from various scientific fields have made significant contributions to the current knowledge about this question [6,7,8,9,10]. The internal damage of rock lies in the manner by which subzero temperatures changed the microscopic pore structure, but it has not been obviously confirmed. In addition, microscopic pore structures affect the unfrozen water contents and other properties. Therefore, studying and understanding the freezing–thawing damage mechanism and evolution model of sandstone is the basis for revealing the mechanism of freezing–thawing damage in geotechnical engineering [11,12,13,14,15].
Moreover, most previous studies pay a great attention to quantifying the frost-heave strain and the corresponding frost damage evolution mechanism of intact rock during freezing. Lithology, porosity, water saturation, number of freezing–thawing cycles, freezing–thawing cycle temperature and rate, hydration environment, unfrozen water content and stress state, and freezing times have been regarded as major factors influencing the mechanical properties of rocks [16,17,18,19,20,21,22,23,24,25,26,27,28,29,30]. However, the change of phase composition of pore water in porous rock is a direct index of the freezing–thawing process of rock. It is usually estimated by measuring the water content against temperature under different freezing–thawing conditions, obtaining the pore distribution, and analyzing the freezing–thawing damage [31,32,33].
A majority of detection methods and technology were also adopted to reveal the change of phase composition of pore water, and the internal cracking process of the sample is from the microscopic to macroscopic during the progress of freezing–thawing [34,35,36,37,38,39,40]. The nuclear magnetic resonance (NMR) method is a better choice for studying the freezing mode of pore water in complex pore structures at low temperatures. The composition of pore water can be deduced according to the T2 spectrum of pore water in different pore structures, and the changes in each component during freezing can provide a more detailed pore water freezing mode. This method has a good prospect to evaluate the pore distribution of geotechnical materials, to measure the content of water, and to estimate rock freezing–thawing damage in cold regions [41,42,43,44,45,46].
Currently, scholars have provided many meritorious research achievements illuminating freezing–thawing damage characteristics of rocks caused by a complicated freezing–thawing environment, but most research works place a particular emphasis on intact rock, and there are few studies on the damage characteristics during the freezing–thawing process of rock with different initial damage conditions [47,48,49,50,51,52,53,54,55]. In practical applications, initial damage is an important problem to be considered in the freezing–thawing test. In the construction process, the basic mechanical rock breaking method is usually adopted for slope, tunnel, culvert, and other rock engineering, which would inevitably cause different damage levels to the engineering project in cold regions [56,57,58,59,60]. The change of the macroscopic mechanical properties of rock mainly depends on the degree of freezing–thawing action on the internal structure of rock. The ineluctable initial damage exacerbates the effects of freezing–thawing. The initial damage corresponds to the weak structural surface in the rock. Rock disintegration occurs along the weak structural plane under loading conditions, and different initial damage levels change the rock failure mode [61,62,63,64,65].
In fact, it is more suitable for the actual engineering environment and engineering conditions to investigate the deterioration characteristics of freezing–thawing damage, considering the internal damage of rock mass, and the results have more practical value for the evaluation of geotechnical engineering safety in cold regions. In this study, the NMR technique was used to study the freezing–thawing process of pore water in sandstone samples with various levels of initial damage from preloading (0, 0.3, 0.5, 0.7, and 0.9 of the ultimate uniaxial compressive strength [UCS]) under different temperature conditions (25, 0, −5, −10, −15, and −20℃). Various levels of initial damage were fabricated by previous preloading (loading and unloading) to various preset stresses, and the pore structures of saturation sandstone samples with various levels of initial damage were measured using the NMR technique under five subzero-temperature freezing–thawing process. The T2 spectrum distribution, T2 spectral area, and the evolution of pore structure were obtained for the sample with various levels of initial damage during the freezing–thawing process. A continuum damage model considering subzero-temperature freezing–thawing damage from different pore sizes is finally introduced to describe the damage evolution of sandstone with various levels of initial damage under the five subzero-temperature freezing–thawing process. Finally, the UCS test was carried out on samples after low-temperature freezing–thawing.
2 Experimental scheme
2.1 Sample preparation
The red sandstone samples were collected from the Linyi County, Yunnan Province, China. X-ray analysis showed that the main components of samples were quartz (59%), feldspar (18%), calcite (13%), and kaolinite (10%) (Figure 1). Three standard cylindrical sandstone samples with the dimensions of 50 mm in diameter and 100 mm in length were prepared to evaluate the UCS. For the purpose of obtaining reliable test results, the UCS of the samples was determined by the average value of the UCS of the three samples. The T2 spectrum was obtained from ten saturated samples, of which five samples were selected to produce the levels of initial damage (0, 0.3 (30%), 0.5 (50%), 0.7 (70%), and 0.9 (90%) of the ultimate UCS) by previous preloading (loading and unloading). Therefore, a total of 13 samples were adopted in this study (Table 1).

X-ray diffraction pattern.
Physical and mechanical parameters of sandstone
| Type | ρ (kg·m−3) | V p (km·s−1) | n (%) | ω 0 (%) | E s (GPa) | μs | UCS (MPa) |
|---|---|---|---|---|---|---|---|
| Red sandstone | 2,483 | 2.472 | 4.32 | 2.58 | 16.37 | 0.32 | 78 |
Note: ρ – mass density; V p – P-wave velocity; n – porosity; ω 0 – moisture content; E s – elastic modulus; μ s – Poisson’s ratio; UCS – unconfined compressive strength.
2.2 Test facilities
The NMR equipment from the Suzhou Niumag Analytical Instrument Corporation (MacroMR12-150H-I) was used in this experiment, as shown in Figure 2. The T2 distribution and NMR images of test samples during the freezing process can be obtained by using the Core Analysis software. The NMR device has a magnetic field strength of 0.3 T, which can measure the T2 distribution. The Carr–Purcell–Meiboom–Gill sequence was used to measure the T2 distribution. The pulse duration was set as 11 μs, the echo time as 0.2 ms, and the delay between scans as 2,000 ms. For the purpose of ensuring the best operation of the test system and the accuracy of the test results, the room temperature required for the test is 20–25°C. The diagram of the experimental system and procedure is shown in Figure 2.
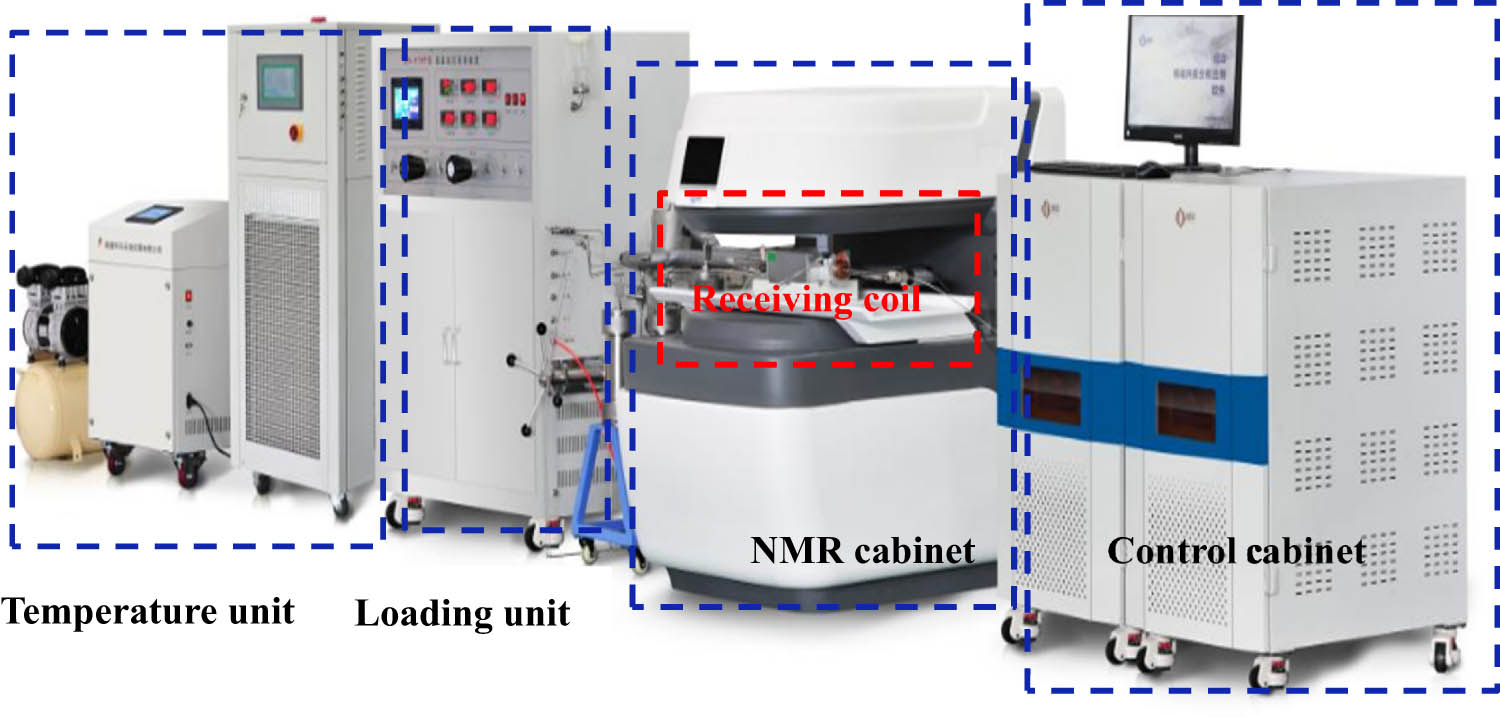
NMR test system (model, MacroMR12-150H-I).
2.3 Setup of experiments
The test process includes the freezing–thawing test, the NMR test, and the UCS test. The test procedure is illustrated in Figure 3. The specific steps are as follows.
Samples were dried at 105°C for 24 h in the drying box, weighing its mass. Three samples were loaded until failure, and their average UCS was 78 MPa. The UCS was a reference stress used to determine the unloading point. Accordingly, five groups of samples were prepared and preloaded to various preset stress levels followed by unloading to zero. Figure 4 presents the loading and unloading paths, where the preloading levels were predefined to be 0, 0.3, 0.5, 0.7, and 0.9 UCS at 0.5 MPa·min−1 for five groups of samples. Table 2 lists the preloading stresses and the corresponding loading ratios (loading levels over the UCS) [59]. The initial damage (k) is described as the ratio of preloading stress to UCS [62]. In addition, the P-wave velocity and porosity before and after the initial damage were measured to prove that the sample did indeed generate initial damage by previous uniaxial loading and unloading tests.
Samples with different initial damage were vacuumed at 0.1 MPa pressure for 6 h in a vacuum-saturated facility. Then, the internal pores were completely saturated with water at a pressure of 20 MPa for 24 h.
Completely saturated samples with different levels of initial damage were put into a programmable test chamber at −20 to 25°C and the saturated samples were frozen from room temperature to various temperature levels (25, 0, −5, −10, −15, and −20°C). The ambient temperature deviation of the chamber was controlled within ±0.2°C. A total of six temperature levels were set during the freezing process, as shown in Figure 5. The samples were maintained for 6 h to achieve thermal equilibrium at each temperature level. The NMR detection was conducted at each temperature level under freezing–thawing conditions. The results of NMR tests included the porosity, T2 spectrum distribution, and T2 spectral area at various temperature levels.
Steps 2 and 3 were conducted on the samples after the completion of the 0, −5, −10, −15, and −20°C freezing–thawing. The UCS tests were performed on the samples at a 0.5 MPa·min−1 rate that had been exposed to different freezing–thawing temperatures.

Test flow chart: (a) DSZ-1000 loading system, (b) NMR test system, (c) freezing–thawing cycle apparatus, (d) saturation water device, and (e) DSZ-1000 loading system.

Loading/unloading paths for compression tests.
Preload stress (MPa)
| Samples | S-1-0 | S-2-30% | S-3-50% | S-4-70% | S-5-90% | |
|---|---|---|---|---|---|---|
| Initial damage (k) | 0 | 0.3 (30%) | 0.5 (50%) | 0.7 (70%) | 0.9 (90%) | UCS |
| Stress | 0 | 26 | 39 | 55 | 70 | 78 |

NMR tests at various temperature levels during the freezing process.
2.4 Validation of NMR tests
Yang et al. verified the precision of the NMR porosity measurements using traditional weighting methods [44]. In this article, the traditional weighting method was used to prove its accuracy. The porosity acquired from the traditional weighting method was determined by the following equation:
where
To validate the effectiveness of the NMR test, it is significant to make a comparison to the porosity values acquired from conventional measurements and the NMR test. For this reason, the porosities obtained by using the NMR experiments and the weighting methods are shown in Table 3, respectively. The results demonstrate that the porosity measured by NMR was fairly smaller than that measured by the weighting method. This deviation is due to the restriction of the NMR technique. NMR is generally unable to monitor pores smaller than 3 nm due to the extremely fast volatilization of hydrogen in small pores [45]. Nevertheless, the discrepancy between the NMR porosity and the conventional porosity is relatively small (no more than 3%), which would not significantly affect the results of the subsequent NMR test.
Comparison of the NMR porosity with the conventional porosity
| Samples (%) | Initial damage | NMR porosity (%) | Conventional porosity (%) | Error (%) |
|---|---|---|---|---|
| S-1-0 | 0 | 4.32 | 4.36 | 0.9 |
| S-2-30 | 0.3UCS | 4.46 | 4.51 | 1.1 |
| S-3-50 | 0.5UCS | 4.62 | 4.70 | 1.7 |
| S-4-70 | 0.7UCS | 4.98 | 5.08 | 2.0 |
| S-5-90 | 0.9UCS | 5.18 | 5.32 | 2.6 |
3 Experimental results
3.1 Changes in the porosity and P-wave velocity before and after preloading
The changes in the P-wave velocity and porosity before and after initial damage are presented in Figure 6. With the increase of the initial damage level, the P-wave velocity of the sample decreases, while the porosity increases, which prove that initial damage is indeed generated by uniaxial loading and unloading of the sample. In addition, the P-wave velocity and porosity change rate show an obvious inflection point when the initial damage is 50%, and the rate of change on the left side is much smaller than that on the right side. This change is mainly due to the initiation of crack coalescence at this stress level, which is about 0.5–0.7 times the peak strength [66]. Therefore, under the loading of 0.5UCS or higher, the crack merging or joining in the sample is the cause of the sudden increase of porosity and the sudden decrease of P-wave velocity. The changes in P-wave velocity and porosity were in good agreement, both of which indicate the accumulation of damage and material deterioration with the increase of the initial damage level.

Changes in the P-wave velocity and porosity against the initial damage level.
3.2 Changes in the T2 distributions before and after preloading
T2 is a time constant for the exponential decay of the magnitude of a spin echo for a single pore body [67]. For a multiple pore body system such as a porous network, the exponential decay is a summation of individual decays. Using an inversion-processing technique, the raw decay curve can be fitted to a T2 spectrum. Most of the NMR interpretations and estimated physical parameters are based on this T2 spectrum [68]. The T2 distribution of the samples can be mainly divided into three peaks, as shown in Figure 7, corresponding to the transverse relaxation time T2 spectrum of micro-pores (0.01–1 ms), meso-pores (1–100 ms), and macro-pores (100–1,000 ms) from left to right [23,69].

T2 spectrum distribution curves of the five samples: (a) pre-loading initial damage and (b) post-loading initial damage.
Figure 7(a) and (b) shows the T2 spectrum distribution of samples before and after different levels of initial damage by preloading, respectively. Before the initial damage, the peak areas of the micro-pores and the macro-pores of the five tested samples were basically the same, while there were only a few differences in the peak areas of the meso-pores. After the initial damage by post-loading, the peak area of the micro-pores and the meso-pores increased as the initial damage increased, especially for the peak areas of the meso-pores, and the changes were particularly dramatic. The peak area of the macro-pores did not change obviously before the degree of damage reached 90%, but the area increased suddenly when the initial damage was 90%.
3.3 T2 distributions with freezing progression
Figure 8 displays the T2 distribution of the samples under low-temperature conditions of 25, 0, −5, −10, −15, and −20°C with different levels of initial damage by preloading. There were three obvious peaks, which were obviously different from the maximum signal intensity of the three peaks of all test samples, indicating different energy states of pore water and the corresponding pore water quantity. In the case of same levels of initial damage, the water in the pores froze, and the peak value dropped rapidly as the temperature decreased. When the freezing temperature reached −15°C, the peak value dropped gently. When the freezing temperature reached −20°C, the signal intensity of the meso-pores gradually approached 0.

T2 spectrum distribution of samples with different subzero temperature levels under various levels of initial damage: (a) 0 UCS, (b) 0.3 UCS, (c) 0.5 UCS, (d) 0.7 UCS, and (e) 0.9 UCS.
Figure 9 shows that the T2 distribution of samples with different levels of initial damage from preloading is obvious at 25, 0, −5, −10, −15, and −20°C. There were also three obvious peak values, which were significantly different from the maximum signal intensity of the three peaks of all test samples, indicating different energy states of pore water and corresponding pore water quantities. At the same temperature (25 and 0°C), the peak signal intensity of the micro-pores, meso-pores, and macro-pores increased as the levels of initial damage increased. However, below 0°C, especially after −5°C, when the water in the pores froze, the peak signal intensity of the micro-pores, meso-pores, and macro-pores decreased continuously, and the decline of the micro-pores and the meso-pores was the most obvious.

T2 spectrum distribution of samples with different levels of initial damage under various temperature levels. (a) 25°C, (b) 0°C, (c) −5°C, (d) −10°C, (e) −15°C, and (f) −20°C.
3.4 T2 distributions with thawing progression
For samples with different levels of initial damage, which were put into water to allow natural melting and return to normal temperature after a gradient of low-temperature treatment of 0, −5, −10, −15, and −20℃ at each temperature gradient drop. Then, the samples were subjected to vacuum-pressure treatment and saturated with water for 24 h. After that, T2 was detected by NMR technology. The T2 distribution after freezing–thawing–saturation was obtained according to the above process. For all samples at each temperature gradient drop, freezing–thawing–saturation-T2 was measured. The T2 distribution curve of the saturated samples before freezing and after thawing basically does not change at temperatures of 0 and −5°C. Therefore, the T2 distribution curves of freezing–thawing–saturation are not listed at the temperatures of 0 and −5°C. Figure 10 illustrates that the peak of T2 is bigger than without treated with low-temperature or room-temperature conditions when the initial damage was 0–70%; the freezing–thawing–saturation-measured T2 distribution peak area increased gradually as the freezing temperature declined, but the macro-pores did not change. For samples with an initial damage level of 90%, the changes in the micro-pores and the meso-pores were not obvious, but the macro-pores have an obvious change. For samples with different levels of initial damage from preloading, the distribution of T2 signal intensity after low-temperature freezing–thawing–saturation treatment was rather larger than that under normal-temperature conditions, showing that the porosity of the samples increased at low-temperature freezing–thawing conditions, which promoted further damage for the sample containing different levels of initial damage. Because the pores of the samples increased after freezing–thawing damage, the peak value of T2 increased after saturation at low-temperature conditions.

T2 spectrum distribution of samples with various temperatures under different levels of initial damage: (a) 0 UCS, (b) 0.3 UCS, (c) 0.5 UCS, (d) 0.7 UCS, and (e) 0.9 UCS. R stands for thawing and −10℃-R represents the sample after −10℃ freezing–thawing–saturation.
Figure 11 shows the T2 distribution of different levels of initial damage after freezing–thawing–saturation at −10, −15, and −20°C. The larger the levels of initial damage, the larger the T2 peak value obtained after freezing–thawing–saturation treatment at a low temperature. The change of micro-pores was not obvious, the peak value showing an increasing trend, and the change of the meso-pores was particularly obvious, and it was mainly divided into two obvious growth stages, the levels of initial damage were from 0 to 70% and the levels of initial damage were from 70 to 90%, and the peak value of the meso-pores increased rapidly.

T2 spectrum distribution of the sandstone with different levels of initial damage under various temperature levels: (a) −10°C-R, (b) −15°C-R, and (c) −20°C-R.
3.5 T2 spectral area with freezing progression
The T2 distribution peak area changes of the micro-pores, meso-pores, and macro-pores after various low temperatures obtained by NMR testing are indicated in Figure 12 for samples with various levels of initial damage from preloading. The results suggested that the pore areas of the micro-pores, meso-pores, and macro-pores increased as the temperature decreased. This is because that the low temperature freezing caused the number of micro-pores for the tested samples, and the micro-pores were expanded and connected to form the meso-pores and macro-pores, indicating that the low temperature would cause damage and destroy the samples. Figure 12 shows that the growth rate of pore area of has three stages: the first stage was 25 to −5°C, the second stage was −5 to −15°C, and the third stage was −15 to −20°C. The low temperature also would cause the free water to frost-heaving and freezing–thawing repeatedly for the sample with different levels of initial damage. The micro-pores developed rapidly, which was demonstrated as an obvious change rate at the temperature of −10°C. This is the reason that low-temperature freezing causes the pore size to expand and extend, making a lot of new micro-pores. But after −15°C, the growth rate of pore area of the micro-pores slowed down, showing a rapid decline, and this is the reason that micro-pores continue to extend and develop into meso-pores dramatically. Conversely, the meso-pores decreased rapidly at temperature levels from −5 to −15°C, and this is the reason free water freezes due to low temperature, causing the area of the meso-pores to be filled with ice. The meso-pores increased sharply at temperature levels from −15 to −20°C, and this is the reason that low temperature causes new micro-pores continue to extend and develop into meso-pores dramatically.

Relationship between the area of the spectral peak and the temperature during the process of freezing: (a) first spectral peak, (b) second spectral peak, and (c) third spectral peak.
For samples exposed to the low temperature levels of 25, 0, −5, −10, −15, and −20°C, T2 distribution peak areas of three pore changes at various initial damage levels obtained by NMR testing are shown in Figure 13. At a temperature of 25°C, the T2 distribution peak area of the micro-pores gradually increased and the meso-pores gradually decreased before the initial damage levels of 50%. Conversely, the T2 distribution peak area of the micro-pores gradually decreased and the meso-pores gradually increased after the initial damage levels of 50%. The T2 distribution peak area of the macro-pores shows no obvious change before the initial damage levels of 70%. At a temperature of 0°C, the T2 distribution peak area of the micro-pores gradually increased and the meso-pores gradually decreased before the initial damage level of 30%. Conversely, the T2 distribution peak area of the micro-pores gradually decreased and that of the meso-pores gradually increased after the initial damage levels of 70%. At the initial damage levels from 30 to 70%, the T2 distribution peak areas of micro-pores and meso-pores show no distinct difference. The T2 distribution peak area of the macro-pores shows no obvious change in the initial damage levels from 0 to 90%. At a temperature of −5°C, the T2 distribution peak area of the micro-pores gradually increased and that of the meso-pores gradually decreased before the initial damage level of 70%. Conversely, the T2 distribution peak area of the micro-pores gradually decreased and that of the meso-pores gradually increased after the initial damage level of 70%. The T2 distribution peak area of the macro-pores first decreased at the initial damage level of 30% and then gradually increased at the initial damage level from 30 to 90%. At a temperature of −10°C, the T2 distribution peak area of the micro-pores gradually increased and that of the meso-pores gradually decreased at the initial damage levels from 0 to 90%, and the T2 distribution peak area of the macro-pores showed no obvious change before the initial damage level of 70%. At a temperature of −15°C, the T2 distribution peak areas of the micro-pores and the macro-pores gradually decreased and that of the meso-pores gradually increased before the initial damage level of 50%. Conversely, the T2 distribution peak area of the micro-pores and the macro-pores gradually decreased and that of the meso-pores gradually increased after the initial damage level of 50%. At a temperature of −20°C, the T2 distribution peak area of the micro-pores and the meso-pores shows no distinct change at the initial damage levels from 0 to 90%. The T2 distribution peak area of the macro-pores gradually decreased before the initial damage level of 70% and it increased after the initial damage level of 70%.

Relationship between the area of the spectral peak and the levels of initial damage under different freezing temperatures: (a) 25°C, (b) 0°C, (c) −5°C, (d) −10°C, (e) −15°C, and (f) −20°C.
3.6 T2 spectral area with thawing progression
For the samples exposed to different levels of initial damage (0, 30, 50, 70, and 90%) from preloading, the T2 distribution peak areas of three pore changes after various low-temperature freezing–thawing–saturation obtained by the NMR testing are shown in Figure 14. It can be found from Figure 14 that the quality of the micro-pores, meso-pores, and macro-pores shows no obvious difference for 0, 30, and 90% initial damage levels. But the quality of the micro-pores, meso-pores, and macro-pores shows a marked change for 50 and 70% initial damage levels.

Relationship between the area of spectral peak and the temperature during the process of thawing. (a) 0 UCS (b) 0.3 UCS, (c) 0.5 UCS (d) 0.7 UCS, and (e) 0.9 UCS.
For samples with initial damage of 0%, the total pore area of the three pore sizes increased with the decrease in temperature after freezing and thawing at different low temperatures. The areas of the micro-pores and the meso-pores show an obvious upward trend, while the area of the macro-pores did not alter significantly.
For samples with an initial damage of 30%, the total pore area of the three pore sizes decreased first and then increased with the decrease in temperature for samples with different freezing–thawing–saturation conditions, and the area of micro-pores increased monotonically. The area of meso-pores to reduce (25 to −10°C) after adding (−10 to −15°C) to minimize (−15 to −20°C), the area of macro-pores, first increase (25 to −10°C) after decreased (−10 to −15°C) and add (−15 to −20°C).
For samples with an initial damage of 50%, with the decrease of temperature, the total pore area of the three kinds of pores first decreased and then increased; the area of micro-pores first decreased (25 to −10°C), and then increased ( −10 to −20°C); the area of meso-pores increased monotonically, and the area of macro-pores first decreased (25 to −15°C) and then increased (−15 to −20°C).
For samples with 70% initial damage, the total pore area of the three kinds of pores first decreased and then increased with the decrease of temperature for the sample with different low-temperature freezing–thawing–saturation conditions, and the area of micro-pores increased monotonically. The area of the meso-pores reduced (25 to −10°C) after an increase (−10 to −20°C), and the area of macro-pores first increased (25 to −10°C), followed by a decrease (−10 to −15°C) and then increase (−15 to −20°C).
For samples with 90% initial damage, the total pore area of the three kinds of pores first decreased and then increased with the decrease in temperature for the sample with different low-temperature freezing–thawing–saturation conditions, and the area of micro-pores increased monotonically. The area of meso-pores reduced (25 to −10°C) after an increase (−10 to −20℃), and the area of macro-pores first decreased (25 to −10°C) and then increased (−10°C to −15°C and −15 to −20°C).
4 Establishment and validation of microscopic damage model
4.1 Damage model based on pore size distribution
The theory on the origin of damage mechanics was first proposed by Kachanov [70], who proposed the expression for the damage factor that considers the effective load-bearing area:
where
Currently, numerous scholars have established numerous significant damage models for quasi-brittle materials such as rocks based on basic physical and mechanical parameters. There are porosity, static elastic modulus, dynamic-elastic modulus, volume, P-wave, fractal dimension, energy, and so on [72,73]. The pore size distribution has significant effects on rock damage [74]. Therefore, the damage variables were established considering the different pore sizes of the rock after a subzero freezing–thawing treatment in this study. Different spectral areas represent the pore content of the corresponding size from the T2 spectrum, then:
where P micro, P meso, and P macro, respectively, represent the spectral areas of micro-pores, meso-pores, and macro-pores in the T2 spectrum of the sandstone that is not exposed to freezing–thawing after NMR testing; P′ micro, P′ meso, and P′ macro, respectively, represent the micro-pores, meso-pores, and macro-pores in the T2 spectrum after freezing–thawing. The damage variable and the expression of the peak area before and after freezing–thawing are presented as follows:
where, d, e, and f are, respectively, the weights of micro-pores, meso-pores, and macro-pores on the damage of the rock.
The coefficient of variation is also known as the dispersion coefficient or standard margin, which is another statistic that measures the variability of observations in data. When comparing two or more degrees of variation, the standard deviation can be used directly if the unit of measure is the same as the mean. If the unit and/or mean are different, the standard deviation should not be used to compare the degree of variation, but the ratio of standard deviation to mean (relative value) should be used for comparison. The ratio of the standard deviation to the mean is called the coefficient of variation and denoted coefficient of variation (CV). The coefficient of variation can eliminate the effect of different units or means on the self-comparison of the degree of variation between two or more data. The standard coefficient of variation is the ratio of the variation index of a group of data to its average index, which is a relative variation index. The coefficient of variation includes full distance coefficient, mean difference coefficient, and standard deviation coefficient. The standard deviation coefficient is commonly used, which is expressed as CV.
The coefficient of variation of the spectral peak area corresponding to the pores of each size inside the sandstone after different freezing–thawing conditions is obtained by the following formula:
where
The coefficient of variation’s function is to reflect the degree of dispersion in the unit mean. It is often used to compare the degree of dispersion of two unequal population means. If the mean values of the two populations are equal, the coefficient of the comparative standard deviation is equivalent to the comparative standard deviation. The coefficients of variation of the peak areas of the micro-pores, meso-pores, and macro-pores are shown in Table 4. The indicators with a larger coefficient of variation can better reflect the difference in the assessment unit. The corresponding weight is calculated by the following formula:
Coefficients of variation of the peak areas of micro-pores, meso-pores, and macro-pores
| Initial damage level | 0UCS | 0.3UCS | 0.5UCS | 0.7UCS | 0.9UCS | ||
|---|---|---|---|---|---|---|---|
| Temperature | Coefficient of variation | ||||||
| −10°C | 0.032368255 | 0.239921927 | 2.046902189 | ||||
| −15°C | 0.010701435 | 0.246777108 | 2.141699962 | ||||
| −20°C | 0.013285804 | 0.236166311 | 2.087928327 | ||||
The weights d, e, and f of the micro-pores, meso-pores, and macro-pores are presented in Table 5.
Weights d, e, and f of the micro-pores, meso-pores, and macro-pores
| Initial damage level | 0UCS | 0.3UCS | 0.5UCS | 0.7UCS | 0.9UCS |
|---|---|---|---|---|---|
| Temperature | Weights | ||||
| −10℃ | d = 0.517 | d = 0.247 | d = 0.302 | d = 0.32 | d = 0.142 |
| −15℃ | e = 0.102 | e = 0.286 | e = 0.365 | e = 0.3 | e = 0.108 |
| −20℃ | f = 0.381 | f = 0.467 | f = 0.333 | f = 0.38 | f = 0.75 |
If and only if the pore content of the three sizes does not transform before and after the freezing–thawing, the damage variable D n = 0; it is considered that the freezing–thawing does not cause damage. This model is more applicable than considering only the damage variable of porosity.
It is found from Figure 15 that the curve is concave up by analyzing the relationship between damage variables and freezing–thawing temperature for samples with 90% initial damage. The damage variable D T gradually increased, and the increasing rate dramatically increased as the temperature of freezing–thawing decreased, which was consistent with the variation tendency of porosity. It is discovered by fitting the fact that DT and the freezing–thawing temperature meet the following relationship:
where k is the initial damage level and T is the freezing–thawing temperature.

Relationship between damage variables and temperature.
4.2 Damage model verification
In order to explain the damage caused by freezing–thawing, the change of voidage was used for quantitative analysis. It is assumed that the total porosity of the samples changes under the action of freezing–thawing, and the damage of pores of different sizes in the samples is consistent with the variation tendency of the total porosity, indicating that Eq. (5) is applicable. The denominator is constant from the expression of damage factor, and we just need to determine the relationship between the numerator and the total porosity.
Assuming that the total spectral area of the T2 distribution is S, the following relation is established:
Samples are subject to n F-T cycles, and the total area of T2 spectrum is S′ (S′ ≥ S).
However, in the case that the total porosity of the sample does not alter, the internal pores of the samples changed, and the sample will also be damaged. Therefore, even if the total porosity of the sample does not transform, it cannot be said that the sample has not been damaged. It is assumed that the total area of T2 spectra damaged after freezing–thawing is given by S′, dP micro + eP meso + fP macro = S. The relationship between the damage variable and the three size apertures is presented:
The partial derivative of the expression is calculated as:
which shows that with the increase of the content of the macro-pores, the increase of D n is greater when the total pores remain unaltered. Therefore, the damage model considering the pore content of different sizes is proved to be reasonable again.
4.3 Damage evolution of sandstone after initial damage action
The samples with different initial damage levels have different responses to freezing–thawing treatment under the same loading. In order to study the freezing–thawing damage effect of samples with different levels of initial damage, the relationship between damage factors and the levels of initial damage from preloading is plotted in Figure 16 under different various temperature conditions. The damage factors increased with the increase of the initial damage levels of the samples. The main reason for the degradation of mechanical properties of saturated sandstone samples after freezing–thawing is the water–ice phase transformation in the pores [75–77]. It is remarkable pointing out that the fitting effect of damage factors is consistent with the change of the initial damage level. It is found through fitting that D k and the initial damage level satisfy the following relationship:

Relationship between damage variables and the levels of initial damage.
All of them accord with the polynomial function relation and have a good fitting effect. The results can be used to quantitatively evaluate the damage of the samples treated by low-temperature freezing–thawing and different levels of initial damage from preloading.
5 Discussion
5.1 Damage parameter based on the NMR porosity
Porosity is an effective parameter to evaluate the degree of damage to rock. Therefore, the damage variable D p was introduced into the porosity of different initial damage levels, as follows:
where
The damage variables obtained by the changes of porosity after different initial damage levels can reflect the overall degradation characteristics of the sample at a certain loading level. Figure 17 shows the fitting curve of porosity change with initial damage from preloading. It can be found from Figure 17 that the fitting curve has a good correlation with the sample porosity in the range of 0–90% UCS. When the preloading damage level reached 100%, that is, when the loading ratio reached 1, it can be predicted that the porosity of the sample is 5.23079% according to the above fitting curve of porosity and the loading ratio. By substituting Eq. (12) into the linear fitting equation, the relationship between damage parameters and loading stress ratio can be written as follows:

Variations of the porosity against the initial damage.
The porosity and degradation evolution at different specific loading stages can also be deduced in the same way. In addition, the results of this study were highly consistent with those of previous studies [78–82].
5.2 Mechanism analysis of rock freezing–thawing failure process
Water, ice, rock, and other multi-phase media in rock mass have different thermo-physical properties, and the change of their thermo-physical properties is the essence of rock freezing–thawing damage. As the temperature decreased, different mineral grain sizes shrunk inside the rocks, while pore water containing mineral grains froze into ice and expanded. Due to the different expansion rates and thermo-elastic properties of the crystal orientation of various mineral particles, there is uncoordinated shrinkage and expansion at the boundary of the particles, generating local tensile and compressive stresses (frost-heaving stress) between the mineral particles and micro-pores to limit the expansion. This internal stress is destructive to some rock particles with weak cementation strength, causing local damage inside the rock. When the temperature was increased, pore water in mineral grains gradually thawed and migrated, and frost-heaving stress was released, causing mineral particles to fall off and compaction degree decrease, thereby resulting in micro-pores gradually penetrating meso-pores and macro-pores (Figure 18).
![Figure 18
Schematic diagram of micro-pores penetrating meso-pores and macro-pores [59].](/document/doi/10.1515/rams-2024-0034/asset/graphic/j_rams-2024-0034_fig_018.jpg)
Schematic diagram of micro-pores penetrating meso-pores and macro-pores [59].
Perforated channels form between micro-pores, meso-pores, and macro-pores, leading to a loss of mineral particles that fell off after thawing (Figure 19). Further destruction and accumulation of pores led to the development of original pores and the generation of new fractures, while the concentration of frost-heave at the end of pores led to the concentration of stress at the crack tip, leading to the further development of fractures. As the temperature was increased again, pore ice transformed into liquid water again, and the original pores and new cracks became new channels for pore water to transport, making frost-heaving occur again in the next freezing process. The lithology became more and more softer, and the degree of damage deterioration gradually increased with the increase of saturation, leading to a series of physical and mechanical alternation changes, such as shrinkage, expansion, damage, and cracking. The decrease of the strength and elastic modulus of rock samples reflected the deterioration of the internal structure under the conditions of freezing–thawing and loading.
![Figure 19
Pore structure of sandstone observed via scanning electron microscopy [60]: (a) 25 times, (b) 1,000 times, and (c) pore structure model.](/document/doi/10.1515/rams-2024-0034/asset/graphic/j_rams-2024-0034_fig_019.jpg)
Pore structure of sandstone observed via scanning electron microscopy [60]: (a) 25 times, (b) 1,000 times, and (c) pore structure model.
5.3 Damage evolution equation of rock under freezing–thawing and loading
UCS tests at a 0.5 MPa·min−1 loading rate were performed on the samples with the level of initial damage that had been exposed to different subzero temperature freezing and thawing (0, −5, −10, −15, and −20°C). Figure 20 shows the stress–strain curves of samples with different initial damage levels of 0, 30, 50, 70, and 90%. For the stress–strain curve of the samples without initial damage after subzero treatment, it can be roughly divided into five stages: the crack closure stage (AB), elastic stage (BC), stable cracking stage (CD), unstable cracking stage (DE), and post-peak stage (EF) [59].

Stress–strain curves of sandstone samples after low-temperature freezing–thawing at initial damage levels of 0, 30, 50, 70, and 90%.
According to the theory of damage mechanics, the macroscopic physical properties of rock can represent the degree of deterioration inside the rock material. Because the elastic modulus of rock material after freezing–thawing is easy to analyze and measure, the elastic modulus can be used as a significant parameter to evaluate rock damage [83]. The rock damage variable after a subzero freezing–thawing treatment can be defined as
where E T is elastic modulus after a subzero freezing–thawing treatment. The relationship between damage variables calculated by the elastic modulus and initial damage is shown in Figure 21.

Relationship between damage variables and initial damage.
The analysis and research results from microscopic and macroscopic points of view show that there are certain differences in the internal damage behavior of rocks. There are obvious differences between the damage variables of rock obtained by NMR theory and classical mechanics theory, indicating that the damage degree measured by the NMR method was lower than that by classical rock mechanics theory. The reason for the difference is that the interaction between the micro-pores, meso-pores, and macro-pores is ignored in the damage model only considering the micro-pores, meso-pores, and macro-pores by NMR theory.
In fact, the internal stress acts on the skeleton of rock mass in a cyclic and alternating manner with the external temperature, which leads to an irreversible deterioration of physical and mechanical properties of rock mass with the decrease in freezing–thawing temperature gradient. The action of external loading caused further slippage and dislocation of mineral particles inside the rock, a large number of micro-cracks initiating, expanding, and nucleating, the local damage domain gradually connecting, finally coalescing and forming macro-cracks, which aggravate the damage and fracture process of rock (Figure 22). Therefore, the freezing–thawing damage process of the rock mass is a fatigue damage process. The freezing–thawing damage makes the internal structure of the rock and the basic mechanical properties present different degrees of attenuation trend, which is bound to cause the decline of rock-bearing capacity. However, when the damage degree is the same, the strain increases with the increase of the number of freezing–thawing cycles, and the plastic deformation of the rock is particularly obvious, presenting the characteristics of ductile failure at the late stage of deformation.
![Figure 22
Schematic diagram of freeze–thaw damage [84].](/document/doi/10.1515/rams-2024-0034/asset/graphic/j_rams-2024-0034_fig_022.jpg)
Schematic diagram of freeze–thaw damage [84].
In this study, samples with different initial degrees of damage were subjected to alternating freezing–thawing–saturation action under different temperature gradients, resulting in numerous new micro-cracks formation, the gradual expansion and coalescence of the existing cracks, and finally the formation of macroscopic cracks in the rock mass. Thus, microscopic and macroscopic damage occurred in the samples. However, the NMR can only measure the area of the micro-pores, meso-pores, and macro-pores by measuring the content of water in the pores, and the macroscopic crack area cannot be measured as water flows out of the macroscopic crack. Therefore, the degree of damage measured only by the NMR method is lower than that by classical rock mechanics theory. Thus, only by considering the micro-pores, the meso-pores, and the macro-pores from the microscopic perspective, the established damage model cannot more precisely and effectively evaluate the real damage state inside the rock, which requires further investigation in the future.
6 Conclusions
In this article, various levels of initial damage were fabricated by previous loading and unloading tests, and the pore structures of sandstone samples with various levels of initial damage were measured using the NMR technique under five subzero-temperature freezing–thawing processes. The main conclusions can be summarized as follows:
As the initial damage level increased, the P-wave velocity of the sample decreased, while the porosity increased, which proved that initial damage is indeed generated by uniaxial loading and unloading of the sample. In addition, the changes of P-wave velocity and porosity were in good agreement, both of which indicating the accumulation of damage and material deterioration as the initial damage level was increased.
The peak signal intensity of the micro-pores, meso-pores, and macro-pores decreased as the temperature declined. The peak signal intensity of the micro-pores, the meso-pores were significant obvious declining as the initial damage degree increasing at subzero temperature conditions.
The distribution of T2 signal intensity exposed to the low-temperature freezing–thawing–saturation treatment was rather larger than that under normal temperature conditions for samples with different initial damage levels, indicating that the low-temperature freezing–thawing condition would promote the porosity and degree of damage increase for samples with different initial damage levels.
The larger the levels of initial damage, the larger the T2 peak value obtained after freezing–thawing–saturation treatment at a low temperature. The change of meso-pores was mainly divided into two obvious growth stages, the levels of initial damage were from 0 to 70% and from 70 to 90%, and the peak value of meso-pores increased rapidly.
The low temperature would also cause the free water to freeze–thaw repeatedly for the sample with different levels of initial damage, causing the pore size to expand and extend; new micro-pores would continue to develop, and the micro-pores connected to form macro-pores, showing that the total pores increased gradually.
A continuum damage model considering freezing–thawing damage from different pore sizes was finally introduced to describe the damage evolution of the samples with different levels of initial damage under super-zero temperature freezing–thawing–saturation conditions. The results can be used to quantitatively evaluate the damage of sandstone samples with different initial damage degrees under the low-temperature freezing–thawing treatment.
Furthermore, the analysis and research results from microscopic and macroscopic points of view show that there were obvious difference between the damage variables of rock obtained by NMR theory and classical mechanics theory, and the degree of damage measured by the NMR method was lower than that by classical rock mechanics theory.
-
Funding information: This research was supported by National Natural Science Foundation of China (Grant Nos 52274118 and 52274194), the Key project of Hunan Provincial Education Department (22A0337), and Hunan Provincial Natural Science Found of China (2023JJ50232).
-
Author contributions: Shuailong Lian: writing – original draft and visualization. Wen Wan: investigation, conceptualization, and methodology. Yanlin Zhao: writing – review and editing. Wenqing Peng: validation. Can Du: formal analysis. Hao Hu: software and data curation. All authors reviewed the manuscript. All authors have accepted responsibility for the entire content of this manuscript and approved its submission.
-
Conflict of interest: The authors state no conflict of interest.
References
[1] Yang, Z. D., X. D. Ma, L. W. Xu, S. J. Hou, D. Z. Ren, and Q. Feng. A new analytical solution on the frost heaving force of circular tunnel in cold regions. Rock Mechanics and Rock Engineering, Vol. 57, 2024, pp. 3483–3508.10.1007/s00603-023-03744-ySearch in Google Scholar
[2] Zhao, Y. L., Y. X. Wang, W. J. Wang, L. M. Tang, and Q. Liu. Modeling of rheological fracture behavior of rock cracks subjected to hydraulic pressure and far field stresses. Theoretical and Applied Fracture Mechanics, Vol. 101, 2019, pp. 59–66.10.1016/j.tafmec.2019.01.026Search in Google Scholar
[3] Zhao, Y. L., L. Y. Zhang, W. J. Wang, W. Wan, and W. H. Ma. Separation of elastoviscoplastic strains of rock and a nonlinear creep model. International Journal of Geomechanics, Vol. 18, 2018, id. 04017129.10.1061/(ASCE)GM.1943-5622.0001033Search in Google Scholar
[4] Zhou, Z. Q., J. Bi, Y. Zhao, C. L. Wang, and Y. F. Zhang. Thermal-mechanical coupling smooth particle hydrodynamics-phase field method modelling of cracking in rocks. Computers and Geotechnics, Vol. 173, 2024, id. 106476.10.1016/j.compgeo.2024.106476Search in Google Scholar
[5] Liu, Q. S., Z. C. Qian, and Z. J. Wu. Micro/macro physical and mechanical variation of red sandstone subjected to cyclic heating and cooling: an experimental study. Bulletin of Engineering Geology and the Environment, Vol. 78, No. 3, 2017, pp. 1485–1499.10.1007/s10064-017-1196-zSearch in Google Scholar
[6] Niu, Y., X. P. Zhou, J. Z. Zhang, and Q. H. Qian. Experimental study on crack coalescence behavior of double unparallel fissure-contained sandstone specimens subjected to freeze-thaw cycles under uniaxial compression. Cold Regions Science and Technology, Vol. 158, 2019, pp. 166–181.10.1016/j.coldregions.2018.11.015Search in Google Scholar
[7] Zhao, Y. L., Y. X. Wang, W. J. Wang, W. Wan, and J. Z. Tang. Modeling of non-linear rheological behavior of hard rock using triaxial rheological experiment. International Journal of Rock Mechanics and Mining Sciences, Vol. 93, 2017, pp. 66–75.10.1016/j.ijrmms.2017.01.004Search in Google Scholar
[8] Wang, M., W. Wan, and Y. L. Zhao. Experimental study on crack propagation and coalescence of rock-like materials with two pre-existing fissures under biaxial compression. Bulletin of Engineering Geology and the Environment, Vol. 79, No. 6, 2020, pp. 3121–3144.10.1007/s10064-020-01759-1Search in Google Scholar
[9] Zhao, Y., P. F. He, Y. F. Zhang, and C. L. Wang. A new criterion for a toughness-dominated hydraulic fracture crossing a natural frictional interface. Rock Mechanics and Rock Engineering, Vol. 52, 2019, pp. 2617–2629.10.1007/s00603-018-1683-ySearch in Google Scholar
[10] Wang, M., Z. X. Lu, Y. L. Zhao, and W. Wan. Experimental and numerical study on peak strength, coalescence and failure of rock-like materials with two folded preexisting fissures. Theoretical and Applied Fracture Mechanics, Vol. 125, 2023, id. 103830.10.1016/j.tafmec.2023.103830Search in Google Scholar
[11] Qi, J. J., Y. N. Ye, Z. Huang, W. R. Lv, W. B. Zhou, F. C. Liu, et al. Experimental study and theoretical analysis of steel-concrete composite box girder bending moment-curvature restoring force. Sustainability, Vol. 15, No. 8, 2023, id. 6585.10.3390/su15086585Search in Google Scholar
[12] Wang, M., Z. X. Lu, Y. L. Zhao, and W. Wan. Peak strength, coalescence and failure processes of rock-like materials containing preexisting joints and circular holes under uniaxial compression: Experimental and numerical study. Theoretical and Applied Fracture Mechanics, Vol. 125, 2023, id. 103898.10.1016/j.tafmec.2023.103898Search in Google Scholar
[13] Huang, S. B., Q. S. Liu, Y. Z. Liu, Y. S. Kang, A. P. Cheng, and Z. Y. Ye. Frost heaving and frost cracking of elliptical cavities (fractures) in low-permeability rock. Engineering Geology, Vol. 234, 2018, pp. 1–10.10.1016/j.enggeo.2017.12.024Search in Google Scholar
[14] Li, J., K. Zhou, W. Liu, and Y. Zhang. Analysis of the effect of freeze–thaw cycles on the degradation of mechanical parameters and slope stability. Bulletin of Engineering Geology and the Environment, Vol. 77, No. 2, 2018b, pp. 57–580.10.1007/s10064-017-1013-8Search in Google Scholar
[15] Huang, S. B., Y. B. He, G. F. Liu, Z. X. Lu, and Z. K. Xin. Effect of water content on the mechanical properties and deformation characteristics of the clay-bearing red sandstone. Bulletin of Engineering Geology and the Environment, Vol, 80, 2020, pp. 1767–1790.10.1007/s10064-020-01994-6Search in Google Scholar
[16] Zhao, Y. L., S. L. Luo, Y. X. Wang, W. J. Wang, L. Y. Zhang, and W. Wan. Numerical analysis of karst water inrush and a criterion for establishing the width of water-resistant rock pillars. Mine Water and the Environment, Vol. 36, No. 4, 2017, pp. 508–519.10.1007/s10230-017-0438-4Search in Google Scholar
[17] Wu, Q. H., Y. Yang, K. X. Zhang, Q. Y. Li, W. Chen, and Z. F. Liu. Study on the mechanical properties and deterioration mechanism of sandstones under different humidity conditions. Journal of Central South University, Vol. 30, No. 12, 2023, pp. 4252–4267.10.1007/s11771-023-5521-3Search in Google Scholar
[18] Chen, W., W. Wan, Y. L. Zhao, and W. Q. Peng. Experimental study of the crack predominance of rock-like material containing parallel double fissures under uniaxial compression. Sustainability, Vol. 12, No. 12, 2020, id. 5188.10.3390/su12125188Search in Google Scholar
[19] Li, T. Y., Y. Zhao, and J. Liao. Experimental study on the seepage characteristics of dolomite fracture specimens before and after grouting. Archive of Applied Mechanics, Vol. 94, 2024, pp. 1723–1738.10.1007/s00419-024-02606-5Search in Google Scholar
[20] Zhang, J. F., S. L. Shi, Y. Lu, B. You, F. H. Wu, L. Z. Zhang, et al. Coal mine gas abnormal emission inducing factors, manifestation emission mechanism. Fresenius Environmental Bulletin, Vol. 31, 2022, pp. 6569–6575.Search in Google Scholar
[21] Zheng, K., C. L. Wang, Y. Zhao, J. Bi, and H. F. Liu. A modified three-dimensional mean strain energy density criterion for predicting shale mixed-mode I/III fracture toughness. Journal of Rock Mechanics and Geotechnical Engineering, Vol. 16, 2024, pp. 1–18.10.1016/j.jrmge.2023.09.016Search in Google Scholar
[22] Lu, Y., H. Li, J. X. Lu, S. L. Shi, G. Wang, Q. Ye, et al. Clean up water blocking damage in coalbed methane reservoirs by microwave heating: laboratory studies. Process Safety and Environmental Protection, Vol. 138, 2020, pp. 292–299.10.1016/j.psep.2020.04.007Search in Google Scholar
[23] Weng, L., Z. Wu, Q. Liu, Z. Chu, and S. Zhang. Evolutions of the unfrozen water content of saturated sandstones during freezing process and the freeze-induced damage characteristics. International Journal of Rock Mechanics and Mining Sciences, Vol. 142, 2021, id. 104757.10.1016/j.ijrmms.2021.104757Search in Google Scholar
[24] Huang, S. B., Y. H. Ye, X. Z. Cui, A. P. Cheng, and G. F. Liu. Theoretical and experimental study of the frost heaving characteristics of the saturated sandstone under low temperature. Cold Regions Science and Technology, Vol. 174, 2020, id. 103036.10.1016/j.coldregions.2020.103036Search in Google Scholar
[25] Yu, W. J., K. Li, Z. Liu, B. F. An, P. Wang, and H. Wu. Mechanical characteristics and deformation control of surrounding rock in weakly cemented siltstone. Environmental Earth Science, Vol. 80, No. 9, 2021, id. 337.10.1007/s12665-021-09626-2Search in Google Scholar
[26] Wu, Q. H., C. L. Xie, Y. S. Xie, Y. L. Zhao, X. F. Li, J. Liu, et al. Extending application of asymmetric semi-circular bend specimen to investigate mixed mode I/II fracture behavior of granite. Journal of Central South University, Vol. 29, No. 4, 2022, pp. 1289–1304.10.1007/s11771-022-4989-6Search in Google Scholar
[27] Pang, J. W., X. J. Yang, S. Q. Yang, Y. L. He, J. L. Xie, and Q. Y. Han. A method for dividing rockburst risk zones – A case study of the hegang mining area in China. Sustainability, Vol. 15, 2023, id. 9568.10.3390/su152014808Search in Google Scholar
[28] Huang, S. B., Y. Z. Liu, Y. L. Guo, Z. Zhang, and Y. Cai. Strength and failure characteristics of rock-like material containing single crack under freeze-thaw and uniaxial compression. Cold Regions Science and Technology, Vol. 162, 2019, pp. 1–10.10.1016/j.coldregions.2019.03.013Search in Google Scholar
[29] Yuan, Z. G., J. T. Zhao, S. Q. Li, Z. H. Jiang, F. Huang, A unified solution for surrounding rock of roadway considering seepage, dilatancy, strain-softening and intermediate principal stress. Sustainability, Vol. 14, No. 13, 2022, id. 8099.10.3390/su14138099Search in Google Scholar
[30] Zhai, C., L. Qin, S. Liu, J. Xu, Z. Tang, and S. Wu. Pore structure in coal: pore evolution after cryogenic freezing with cyclic liquid nitrogen injection and its implication on coalbed methane extraction. Energ and Fuel, Vol. 30, No. 7, 2016, pp. 6009–6020.10.1021/acs.energyfuels.6b00920Search in Google Scholar
[31] Huang, S. B., Z. X. Lu, Z. Y. Ye, and Z. K. Xin. An elastoplastic model of frost deformation for the porous rock under freeze-thaw. Engineering Geology, Vol. 278, 2020, id. 105820.10.1016/j.enggeo.2020.105820Search in Google Scholar
[32] You, B., X. Y. Liang, and K. Q. Liang. Study on non-coal mine wastewater treatment based on response surface methodology (Rsm). Fresenius Environmental Bulletin, Vol. 28, 2019, id. 6264.Search in Google Scholar
[33] Jia, Z. Z., F. Tao, and Q. Ye. Experimental research on coal-gas outburst prevention by injection liquid freezing during uncovering coal seam in rock crosscut. Sustainability, Vol. 15, No. 3, 2023, id. 1788.10.3390/su15031788Search in Google Scholar
[34] Ye, Z. Y., L. L. Zhang, Z. H. Zhou, K. Pan, X. B. Liu, W. H. Liu, et al. Mechanical properties of the combination of surrounding rock and primary support under impacting load. Sustainability, Vol. 15, No. 5, 2023, id. 6585.10.3390/su15054410Search in Google Scholar
[35] Zhao, Y. L., Q. Liu, H. Lin, Y. X. Wang, W. Y. Tang, J. Liao, et al. A review of hydromechanical coupling tests, theoretical and numerical analyses in rock materials. Water, Vol. 15, No. 13, 2023, id. 0239.10.3390/w15132309Search in Google Scholar
[36] Huang, S. B., Z. K. Xin, Y. H. Ye, and F. Liu. Study on the freeze–thaw deformation behavior of the brittle porous materials in the elastoplastic regime based on Mohr-Coulomb yield criterion. Construction and Building Materials, Vol. 268, 2021, id. 121799.10.1016/j.conbuildmat.2020.121799Search in Google Scholar
[37] He, Y. C. and Q. N. Chen. Construction and application of LSTM-based Prediction model for tunnel surrounding rock deformation. Sustainability, Vol. 15, No. 8, 2023, id. 6877.10.3390/su15086877Search in Google Scholar
[38] Yan, T., C. Q. Zhu, Q. F. Li, and Q. Xu. Investigating disaster mechanisms triggered by abrupt overburden fracture alterations in close-seam mining beneath an exceptionally thick sandstone aquifer. Sustainability, Vol. 15, No. 18, 2023, id. 13845.10.3390/su151813845Search in Google Scholar
[39] Du, C., J. Bi, Y. Zhao, C. Wang, W. Tang, and S. Lian. Investigation of pore structure evolution and damage characteristics of high temperature rocks subjected to liquid nitrogen cooling shock. International Journal of Damage Mechanics, 2024, pp. 1–35.10.1177/10567895241247324Search in Google Scholar
[40] Yu, W. J., H. X. Guo, K. Li, and B. Pan. Experimental Study on uniaxial compression mechanics and failure characteristics of non-through fractured rock. Sustainability, Vol. 15, No. 6, 2023, id. 4968.10.3390/su15064968Search in Google Scholar
[41] Huang, S. B., Q. S. Liu, A. P. Cheng, and Y. Z. Liu. A statistical damage constitutive model under freeze-thaw and loading for rock and its engineering application. Cold Regions Science and Technology, Vol. 145, 2018, pp. 142–150.10.1016/j.coldregions.2017.10.015Search in Google Scholar
[42] Qin, L., C. Zhai, S. Liu, J. Xu, S. Wu, and R. Dong. Fractal dimensions of low rank coal subjected to liquid nitrogen freeze-thaw based on nuclear magnetic resonance applied for coalbed methane recovery. Powder Technology, Vol. 325, 2018, pp. 11–20.10.1016/j.powtec.2017.11.027Search in Google Scholar
[43] Li, Y. H., X. Zeng, Z. Lin, J. Su, T. Gao, R. J. Deng, et al. Experimental study on phosphate rock modified soil-bentonite as a cut-off wall material. Water Supply, Vol. 22, No. 2, 2022, pp. 1676–1690.10.2166/ws.2021.320Search in Google Scholar
[44] Yang, X., L. Weng, and Z. Hu. Damage evolution of rocks under triaxial compressions: an NMR investigation. KSCE Journal of Civil Engineering, Vol. 22, No. 8, 2018, pp. 2856–2863.10.1007/s12205-017-0766-8Search in Google Scholar
[45] Wang, C. L., L. H. Pan, Y. Zhao, Y. F. Zhang, and W. K. Shen. Analysis of the pressure-pulse propagation in rock: a new approach to simultaneously determine permeability, porosity, and adsorption capacity. Rock Mechanics and Rock Engineering, Vol. 52, 2019, pp. 4301–4317.10.1007/s00603-019-01874-wSearch in Google Scholar
[46] You, B., J. X. Xu, S. L. Shi, H. Q. Liu, Y. Lu, and X. Y. Liang. Treatment of Coal Mine Sewage by Catalytic Supercritical Water Oxidation. Fresenius Environmental Bulletin, Vol. 29, 2020, pp. 497–502.Search in Google Scholar
[47] Wang, P. F., X. H. Tan, L. Y. Zhang, Y. J. Li, and R. Liu. Influence of particle diameter on the wettability of coal dust and the dust suppression efficiency via spraying. Process Safety Environmental Protection, Vol. 132, 2019, pp. 189–199.10.1016/j.psep.2019.09.031Search in Google Scholar
[48] Li, J., R. B. Kaunda, and K. Zhou. Experimental investigations on the effects of ambient freeze-thaw cycling on dynamic properties and rock pore structure deterioration of sandstone. Cold Regions Science and Technology, Vol. 154, 2018, pp. 133–141.10.1016/j.coldregions.2018.06.015Search in Google Scholar
[49] Wu, H., Q. Jia, W. J. Wang, N. Zhang, and Y. M. Zhao. Experimental test on nonuniform deformation in the tilted strata of a deep coal mine. Sustainability, Vol. 23, 2021, id. 13280.10.3390/su132313280Search in Google Scholar
[50] Li, M., H. Lv, Y. Lu, D. M. Wang, S. L. Shi, and R. Q. Li. Instantaneous Discharge Characteristics and Its Methane Ignition Mechanism of Coal Mine Rock Damage. Environmental Science and Pollution Research International, Vol. 29, No. 41, 2022, pp. 62495–62506.10.1007/s11356-022-20104-5Search in Google Scholar PubMed
[51] Tian, Z. J., Z. Z. Zhang, M. Deng, S. Yan, and J. B. Bai. Gob-side entry retained with soft roof, floor, and seam in thin coal seams: A case study. Environmental Science Pollution Reports, Vol. 29, 2021, pp. 16113–16122.Search in Google Scholar
[52] Sun, Q., Z. Dong, and H. Jia. Decay of sandstone subjected to a combined action of repeated freezing–thawing and salt crystallization. Bulletin of Engineering Geology and the Environment, Vol. 78, No. 8, 2019, pp. 5951–5964.10.1007/s10064-019-01490-6Search in Google Scholar
[53] Dai, S. X., Y. F. Gong, F. Wang, and P. Hu. Diagenesis Evolution of tight sandstones in chang 8 member of upper triassic in the Xiasiwan Area, Ordos Basin, China. Fresenius Environmental Bulletin, Vol. 28, No. 8, 2019, pp. 6275–6281.Search in Google Scholar
[54] Lu, Y., Y. L. Liu, S. L. Shi, G. X. Wang, H. Li, and T. Wang. Micro -particles stabilized aqueous foam for coal spontaneous combustion control and its flow characteristics. Process Safety Environmental Protection, Vol. 139, 2020, pp. 262–272.10.1016/j.psep.2020.04.017Search in Google Scholar
[55] Zhao, Y., Y. F. Zhang, C. L. Wang, and Q. Liu. Hydraulic fracturing characteristics and evaluation of fracturing effectiveness under different anisotropic angles and injection rates: An experimental investigation in absence of confining pressure. Journal of Natural Gas Science and Engineering, Vol. 97, 2022, id. 104343.10.1016/j.jngse.2021.104343Search in Google Scholar
[56] Qin, B. T., L. Li, D. Ma, Y. Lu, X. X. Zhong, and Y. W. Jia. Control technology for the avoidance of the simultaneous occurrence of a methane explosion and spontaneous coal combustion in a coal mine: A case study. Process Safety Environmental Protection, Vol. 103, 2016, pp. 203–211.10.1016/j.psep.2016.07.005Search in Google Scholar
[57] Zhao, Y. L., J. H. Liu, C. S. Zhang, H. Q. Zhang, J. Liao, S. T. Zhu, et al. Mechanical behavior of sandstone during post-peak cyclic loading and unloading under hydromechanical coupling. International Journal of Mining Science and Technology, Vol. 33, No. 8, 2023, pp. 927–947.10.1016/j.ijmst.2023.05.004Search in Google Scholar
[58] Wang, X., B. Z. Ren, Y. Y. Zhou, and X. Y. Shi. Study on the mechanism and kinetics of manganese release from waste manganese ore waste rock under rainfall leaching. Environmental Science and Pollution Research, Vol. 29, No. 4, 2022, pp. 5541–5551.10.1007/s11356-021-16081-wSearch in Google Scholar PubMed
[59] Liu, T., C. Zhang, J. Li, K. Zhou, and C. Ping. Detecting freeze-thaw damage degradation of sandstone with initial damage using NMR technology. Bulletin of Engineering Geology and the Environment, Vol. 80, 2021, pp. 4529–4545.10.1007/s10064-021-02242-1Search in Google Scholar
[60] Wang, T., Q. Sun, H. Jia, J. Ren, and T. Luo. Linking the mechanical properties of frozen sandstone to phase composition of pore water measured by LF-NMR at subzero temperatures. Bulletin of Engineering Geology and the Environment, Vol. 80, 2021, pp. 4501–4513.10.1007/s10064-021-02224-3Search in Google Scholar
[61] Zhang, Y., B. Z. Ren, A. Hursthouse, R. J. Deng, and B. L. Hou. Leaching and releasing characteristics and regularities of sb and as from antimony mining waste rocks. Polish Journal of Environmental Studies, Vol. 28, 2019, pp. 4017–4025.10.15244/pjoes/95037Search in Google Scholar
[62] Weng, L., Z. Wu, and Q. Liu. Evaluating damage and microcracking behavior of granite using NMR testing under different levels of unconfined compression. International Journal of Geomechanics, Vol. 19, No. 1, 2019, id. 04018186.10.1061/(ASCE)GM.1943-5622.0001335Search in Google Scholar
[63] Huang, Z. H., L. H. Zhang, Z. J. Yang, J. Zhang, Y. K. Gao, and Y. H. Zhang. Preparation and properties of a rock dust suppressant for a copper mine. Atmospheric Pollution Research, Vol. 10, 2019, pp. 2010–2017.10.1016/j.apr.2019.09.008Search in Google Scholar
[64] Huang, S. B., Q. S. Liu, Y. Z. Liu, Z. Y. Ye, and A. P. Cheng. Freezing strain model for estimating the unfrozen water content of saturated rock under low temperature. International Journal of Geomechanics, Vol. 18, 2018, id. 04017137.10.1061/(ASCE)GM.1943-5622.0001057Search in Google Scholar
[65] Pang, J. W., J. L. Xie, Y. L. He, Q. Y. Han, and Y. J. Hao. Study on the distribution trend of rockburst and ground stress in the hegang mining area. Sustainability, Vol. 15, No. 12, 2023, id. 9445.10.3390/su15129445Search in Google Scholar
[66] Martin, C. D. and N. A. Chandler. The progressive fracture of Lac Du Bonnet granite. International Journal of Rock Mechanics and Mining Sciences and Geomechanics Abstracts, Vol. 31, No. 6, 1994, pp. 643–659.10.1016/0148-9062(94)90005-1Search in Google Scholar
[67] Cowan, B. P. Nuclear Magnetic Resonance and Relaxation, Cambridge University Press, Cambridge, 1997, pp. 21–22.10.1017/CBO9780511524226Search in Google Scholar
[68] Dastidar, R. Nuclear Magnetic Resonance (NMR) Study of Freezing and Thawing of Saturated Porous Media and Application to Shale and Pore Volume Compressibility Estimation, University of Oklahoma, Norman, 2007. (Doctoral dissertation).Search in Google Scholar
[69] Jia, H. L., S. Ding, F. Zi, Y. H. Deng, and Y. J. Shen. Evolution in sandstone pore structures with freeze-thaw cycling and interpretation of damage mechanisms in saturated porous rocks. Catena, Vol. 195, 2020, id. 104915. ISSN 0341-8162.10.1016/j.catena.2020.104915Search in Google Scholar
[70] Kachanov, L. M. On the creep fracture time. tekhnicheskich nauk, Vol. 8, 1958, pp. 26–31.Search in Google Scholar
[71] Rabotnov, Y. N. On the equations of state for creep, in progress in applied mechanics. Prager Anniversary Volume, In: W. T. Koiter, (ed), McMillan, New York, 1963, pp. 307–315.Search in Google Scholar
[72] Zhao, Y., C. L. Wang, and J. Bi. Analysis of fractured rock permeability evolution under unloading conditions by the model of elastoplastic contact between rough surfaces. Rock Mechanics and Rock Engineering, Vol. 53, 2020, pp. 5795–5808.10.1007/s00603-020-02224-xSearch in Google Scholar
[73] Wang, B., F. Wang, and Q. Wang. Damage constitutive models of concrete under the coupling action of freeze–thaw cycles and load based on Lemaitre assumption. Construction and Building Materials, Vol. 173, 2018, pp. 332–341.10.1016/j.conbuildmat.2018.04.054Search in Google Scholar
[74] Meng, F. D., Y. Zhai, Y. B. Li, R. F. Zhao, Y. Li, and H. Gao. Research on the effect of pore characteristics on the compressive properties of sandstone after freezing and thawing. Engineering Geology, Vol. 286, 2021, id. 106088.10.1016/j.enggeo.2021.106088Search in Google Scholar
[75] Cases, J. M., I. Berend, G. Besson, M. Francois, J. P. Uriot, F. Thomas, et al. Mechanism of adsorption and desorption of water vapor by homoionicmontmorillonite. 1. The sodium-exchanged form. Langmuir, Vol. 8, 1992, pp. 2730–2739.10.1021/la00047a025Search in Google Scholar
[76] Cheng, K. and Z. Heidari. Combined interpretation of NMR and TGA measurements to quantify the impact of relative humidity on hydration of clay minerals. Applied Clay Science, Vol. 143, 2017, pp. 362–371.10.1016/j.clay.2017.04.006Search in Google Scholar
[77] Weng, L., Z. Wu, Q. Liu, and Z. Wang. Energy dissipation and dynamic fragmentation of dry and water-saturated siltstones under sub-zero temperatures. Engineering Fracture Mechanics, Vol. 220, 2019, id. 106659.10.1016/j.engfracmech.2019.106659Search in Google Scholar
[78] Zhang, J. F., F. F. Yang, R. G. Zhang, J. Y. He, Y. D. Xie, Z. Q. Miao, et al. Experimental research on coal seam structure and gas occurrence influencing factors in Weijiadi Mine China. Fresenius Environmental Bulletin, Vol. 31, 2022, pp. 74–80.Search in Google Scholar
[79] Lian, S. L., W. Wan, Y. L. Zhao, Q. H. Wu, and C. Du. Investigation of the mechanical behavior of rock-like material with two flaws subjected to biaxial compression. Scientific Reports, Vol. 14, 2024, id. 14136.10.1038/s41598-024-64709-xSearch in Google Scholar PubMed PubMed Central
[80] Jia, X. L., J. K. Wu, C. J. Lian, J. J. Wang, J. L. Rao, R. J. Feng, et al. Investigating the effect of coal particle size on spontaneous combustion and oxidation characteristics of coal. Sustainability, Vol. 29, 2020, pp. 161113–161122.10.1007/s11356-021-16929-1Search in Google Scholar PubMed
[81] Zhao, Y., C. L. Wang, Y. F. Zhang, and Q. Liu. Experimental study of adsorption effects on shale permeability. Natural Resources Research, Vol. 28, 2019, pp. 1575–1586.10.1007/s11053-019-09476-7Search in Google Scholar
[82] Zhao, Y., J. Bi, C. L. Wang, and P. F. Liu. Effect of unloading rate on the mechanical behavior and fracture characteristics of sandstones under complex triaxial stress conditions. Rock Mechanics and Rock Engineering, Vol. 54, 2021, pp. 4851–4866.10.1007/s00603-021-02515-xSearch in Google Scholar
[83] Zhao, Y. and H. H. Liu An elastic stress–strain relationship for porous rock under anisotropic stress conditions. Rock Mechanics and Rock Engineering, Vol. 45, 2012, pp. 389–399.10.1007/s00603-011-0193-ySearch in Google Scholar
[84] Cui, L., N. Qin, S. Wang, and X. Z. Feng. Experimental study on the mechanical properties of sandstone under the action of chemical erosion and freeze-thaw cycles. Advances in Civil Engineering, Vol. 2021, 2021, id. 8884079.10.1155/2021/8884079Search in Google Scholar
© 2024 the author(s), published by De Gruyter
This work is licensed under the Creative Commons Attribution 4.0 International License.
Articles in the same Issue
- Review Articles
- Effect of superplasticizer in geopolymer and alkali-activated cement mortar/concrete: A review
- Experimenting the influence of corncob ash on the mechanical strength of slag-based geopolymer concrete
- Powder metallurgy processing of high entropy alloys: Bibliometric analysis and systematic review
- Exploring the potential of agricultural waste as an additive in ultra-high-performance concrete for sustainable construction: A comprehensive review
- A review on partial substitution of nanosilica in concrete
- Foam concrete for lightweight construction applications: A comprehensive review of the research development and material characteristics
- Modification of PEEK for implants: Strategies to improve mechanical, antibacterial, and osteogenic properties
- Interfacing the IoT in composite manufacturing: An overview
- Advances in processing and ablation properties of carbon fiber reinforced ultra-high temperature ceramic composites
- Advancing auxetic materials: Emerging development and innovative applications
- Revolutionizing energy harvesting: A comprehensive review of thermoelectric devices
- Exploring polyetheretherketone in dental implants and abutments: A focus on biomechanics and finite element methods
- Smart technologies and textiles and their potential use and application in the care and support of elderly individuals: A systematic review
- Reinforcement mechanisms and current research status of silicon carbide whisker-reinforced composites: A comprehensive review
- Innovative eco-friendly bio-composites: A comprehensive review of the fabrication, characterization, and applications
- Review on geopolymer concrete incorporating Alccofine-1203
- Advancements in surface treatments for aluminum alloys in sports equipment
- Ionic liquid-modified carbon-based fillers and their polymer composites – A Raman spectroscopy analysis
- Emerging boron nitride nanosheets: A review on synthesis, corrosion resistance coatings, and their impacts on the environment and health
- Mechanism, models, and influence of heterogeneous factors of the microarc oxidation process: A comprehensive review
- Synthesizing sustainable construction paradigms: A comprehensive review and bibliometric analysis of granite waste powder utilization and moisture correction in concrete
- 10.1515/rams-2025-0086
- Research Articles
- Coverage and reliability improvement of copper metallization layer in through hole at BGA area during load board manufacture
- Study on dynamic response of cushion layer-reinforced concrete slab under rockfall impact based on smoothed particle hydrodynamics and finite-element method coupling
- Study on the mechanical properties and microstructure of recycled brick aggregate concrete with waste fiber
- Multiscale characterization of the UV aging resistance and mechanism of light stabilizer-modified asphalt
- Characterization of sandwich materials – Nomex-Aramid carbon fiber performances under mechanical loadings: Nonlinear FE and convergence studies
- Effect of grain boundary segregation and oxygen vacancy annihilation on aging resistance of cobalt oxide-doped 3Y-TZP ceramics for biomedical applications
- Mechanical damage mechanism investigation on CFRP strengthened recycled red brick concrete
- Finite element analysis of deterioration of axial compression behavior of corroded steel-reinforced concrete middle-length columns
- Grinding force model for ultrasonic assisted grinding of γ-TiAl intermetallic compounds and experimental validation
- Enhancement of hardness and wear strength of pure Cu and Cu–TiO2 composites via a friction stir process while maintaining electrical resistivity
- Effect of sand–precursor ratio on mechanical properties and durability of geopolymer mortar with manufactured sand
- Research on the strength prediction for pervious concrete based on design porosity and water-to-cement ratio
- Development of a new damping ratio prediction model for recycled aggregate concrete: Incorporating modified admixtures and carbonation effects
- Exploring the viability of AI-aided genetic algorithms in estimating the crack repair rate of self-healing concrete
- Modification of methacrylate bone cement with eugenol – A new material with antibacterial properties
- Numerical investigations on constitutive model parameters of HRB400 and HTRB600 steel bars based on tensile and fatigue tests
- Research progress on Fe3+-activated near-infrared phosphor
- Discrete element simulation study on effects of grain preferred orientation on micro-cracking and macro-mechanical behavior of crystalline rocks
- Ultrasonic resonance evaluation method for deep interfacial debonding defects of multilayer adhesive bonded materials
- Effect of impurity components in titanium gypsum on the setting time and mechanical properties of gypsum-slag cementitious materials
- Bending energy absorption performance of composite fender piles with different winding angles
- Theoretical study of the effect of orientations and fibre volume on the thermal insulation capability of reinforced polymer composites
- Synthesis and characterization of a novel ternary magnetic composite for the enhanced adsorption capacity to remove organic dyes
- Couple effects of multi-impact damage and CAI capability on NCF composites
- Mechanical testing and engineering applicability analysis of SAP concrete used in buffer layer design for tunnels in active fault zones
- Investigating the rheological characteristics of alkali-activated concrete using contemporary artificial intelligence approaches
- Integrating micro- and nanowaste glass with waste foundry sand in ultra-high-performance concrete to enhance material performance and sustainability
- Effect of water immersion on shear strength of epoxy adhesive filled with graphene nanoplatelets
- Impact of carbon content on the phase structure and mechanical properties of TiBCN coatings via direct current magnetron sputtering
- Investigating the anti-aging properties of asphalt modified with polyphosphoric acid and tire pyrolysis oil
- Biomedical and therapeutic potential of marine-derived Pseudomonas sp. strain AHG22 exopolysaccharide: A novel bioactive microbial metabolite
- Effect of basalt fiber length on the behavior of natural hydraulic lime-based mortars
- Optimizing the performance of TPCB/SCA composite-modified asphalt using improved response surface methodology
- Compressive strength of waste-derived cementitious composites using machine learning
- Melting phenomenon of thermally stratified MHD Powell–Eyring nanofluid with variable porosity past a stretching Riga plate
- Development and characterization of a coaxial strain-sensing cable integrated steel strand for wide-range stress monitoring
- Compressive and tensile strength estimation of sustainable geopolymer concrete using contemporary boosting ensemble techniques
- Customized 3D printed porous titanium scaffolds with nanotubes loading antibacterial drugs for bone tissue engineering
- Facile design of PTFE-kaolin-based ternary nanocomposite as a hydrophobic and high corrosion-barrier coating
- Effects of C and heat treatment on microstructure, mechanical, and tribo-corrosion properties of VAlTiMoSi high-entropy alloy coating
- Study on the damage mechanism and evolution model of preloaded sandstone subjected to freezing–thawing action based on the NMR technology
- Promoting low carbon construction using alkali-activated materials: A modeling study for strength prediction and feature interaction
- Entropy generation analysis of MHD convection flow of hybrid nanofluid in a wavy enclosure with heat generation and thermal radiation
- Friction stir welding of dissimilar Al–Mg alloys for aerospace applications: Prospects and future potential
- Fe nanoparticle-functionalized ordered mesoporous carbon with tailored mesostructures and their applications in magnetic removal of Ag(i)
- Study on physical and mechanical properties of complex-phase conductive fiber cementitious materials
- Evaluating the strength loss and the effectiveness of glass and eggshell powder for cement mortar under acidic conditions
- Effect of fly ash on properties and hydration of calcium sulphoaluminate cement-based materials with high water content
- Analyzing the efficacy of waste marble and glass powder for the compressive strength of self-compacting concrete using machine learning strategies
- Experimental study on municipal solid waste incineration ash micro-powder as concrete admixture
- Parameter optimization for ultrasonic-assisted grinding of γ-TiAl intermetallics: A gray relational analysis approach with surface integrity evaluation
- Producing sustainable binding materials using marble waste blended with fly ash and rice husk ash for building materials
- Effect of steam curing system on compressive strength of recycled aggregate concrete
- A sawtooth constitutive model describing strain hardening and multiple cracking of ECC under uniaxial tension
- Predicting mechanical properties of sustainable green concrete using novel machine learning: Stacking and gene expression programming
- Toward sustainability: Integrating experimental study and data-driven modeling for eco-friendly paver blocks containing plastic waste
- A numerical analysis of the rotational flow of a hybrid nanofluid past a unidirectional extending surface with velocity and thermal slip conditions
- A magnetohydrodynamic flow of a water-based hybrid nanofluid past a convectively heated rotating disk surface: A passive control of nanoparticles
- Prediction of flexural strength of concrete with eggshell and glass powders: Advanced cutting-edge approach for sustainable materials
- Efficacy of sustainable cementitious materials on concrete porosity for enhancing the durability of building materials
- Phase and microstructural characterization of swat soapstone (Mg3Si4O10(OH)2)
- Effect of waste crab shell powder on matrix asphalt
- Improving effect and mechanism on service performance of asphalt binder modified by PW polymer
- Influence of pH on the synthesis of carbon spheres and the application of carbon sphere-based solid catalysts in esterification
- Experimenting the compressive performance of low-carbon alkali-activated materials using advanced modeling techniques
- Thermogravimetric (TG/DTG) characterization of cold-pressed oil blends and Saccharomyces cerevisiae-based microcapsules obtained with them
- Investigation of temperature effect on thermo-mechanical property of carbon fiber/PEEK composites
- Computational approaches for structural analysis of wood specimens
- Integrated structure–function design of 3D-printed porous polydimethylsiloxane for superhydrophobic engineering
- Exploring the impact of seashell powder and nano-silica on ultra-high-performance self-curing concrete: Insights into mechanical strength, durability, and high-temperature resilience
- Axial compression damage constitutive model and damage characteristics of fly ash/silica fume modified magnesium phosphate cement after being treated at different temperatures
- Integrating testing and modeling methods to examine the feasibility of blended waste materials for the compressive strength of rubberized mortar
- Special Issue on 3D and 4D Printing of Advanced Functional Materials - Part II
- Energy absorption of gradient triply periodic minimal surface structure manufactured by stereolithography
- Marine polymers in tissue bioprinting: Current achievements and challenges
- Quick insight into the dynamic dimensions of 4D printing in polymeric composite mechanics
- Recent advances in 4D printing of hydrogels
- Mechanically sustainable and primary recycled thermo-responsive ABS–PLA polymer composites for 4D printing applications: Fabrication and studies
- Special Issue on Materials and Technologies for Low-carbon Biomass Processing and Upgrading
- Low-carbon embodied alkali-activated materials for sustainable construction: A comparative study of single and ensemble learners
- Study on bending performance of prefabricated glulam-cross laminated timber composite floor
- Special Issue on Recent Advancement in Low-carbon Cement-based Materials - Part I
- Supplementary cementitious materials-based concrete porosity estimation using modeling approaches: A comparative study of GEP and MEP
- Modeling the strength parameters of agro waste-derived geopolymer concrete using advanced machine intelligence techniques
- Promoting the sustainable construction: A scientometric review on the utilization of waste glass in concrete
- Incorporating geranium plant waste into ultra-high performance concrete prepared with crumb rubber as fine aggregate in the presence of polypropylene fibers
- Investigation of nano-basic oxygen furnace slag and nano-banded iron formation on properties of high-performance geopolymer concrete
- Effect of incorporating ultrafine palm oil fuel ash on the resistance to corrosion of steel bars embedded in high-strength green concrete
- Influence of nanomaterials on properties and durability of ultra-high-performance geopolymer concrete
- Influence of palm oil ash and palm oil clinker on the properties of lightweight concrete