Analyzing the efficacy of waste marble and glass powder for the compressive strength of self-compacting concrete using machine learning strategies
-
Qing Tao Guan
 ,
Muhammad Nasir Amin
,
Bawar Iftikhar
,
Muhammad Nasir Amin
,
Bawar Iftikhar

Abstract
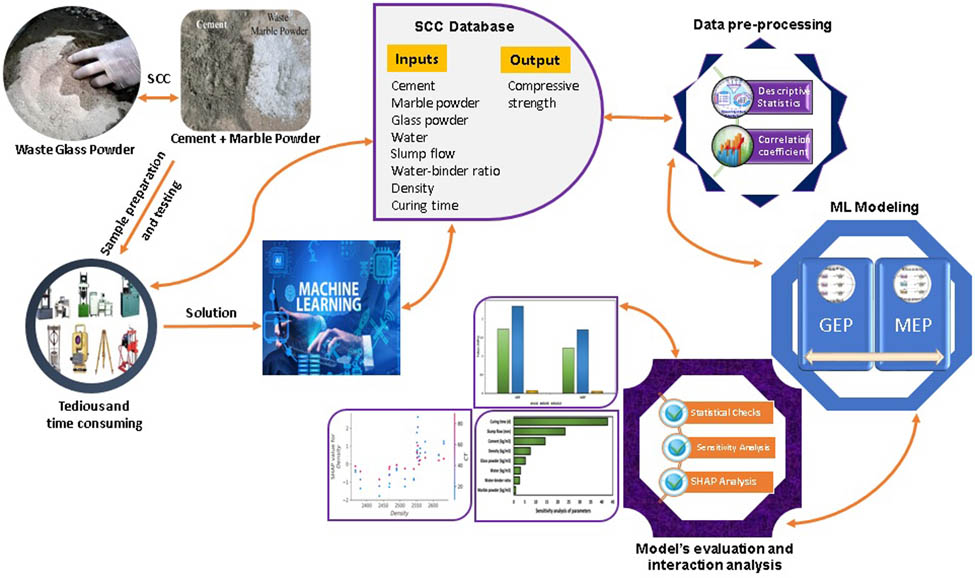
Self-compacting concrete (SCC) is well-known for its capacity to flow under its own weight, which eliminates the need for mechanical vibration and provides benefits such as less labor and faster construction time. Nevertheless, the increased cement content of SCC results in an increase in both costs and carbon emissions. These challenges are resolved in this research by utilizing waste marble and glass powder as cement substitutes. The main objective of this study is to create machine learning models that can predict the compressive strength (CS) of SCC using gene expression programming (GEP) and multi-expression programming (MEP) that produce mathematical equations to capture the correlations between variables. The models’ performance is assessed using statistical metrics, and hyperparameter optimization is conducted on an experimental dataset consisting of eight independent variables. The results indicate that the MEP model outperforms the GEP model, with an R 2 value of 0.94 compared to 0.90. Moreover, the sensitivity and SHapley Additive exPlanations analysis revealed that the most significant factor influencing CS is curing time, followed by slump flow and cement quantity. A sustainable approach to SCC design is presented in this study, which improves efficacy and minimizes the need for testing.
Graphical abstract
1 Introduction
Self-compacting concrete (SCC) was introduced in Japan two decades ago as a contemporary advancement in the concrete industry [1]. SCC finds practical implementation in the reinforcement of in situ concrete and the reinforcement of heavily fortified regions [2]. The advantages of SCC are shown in Figure 1. However, the production of SCC incurs a cost increase of 20–50% in comparison to conventional concrete [3]. The increased expense associated with SCC is due to the considerable quantity of Portland cement and chemical admixtures needed to attain the intended fluidity [4]. Extensive and noteworthy research has been undertaken in recent years concerning SCC [5]. By virtue of the infill material present in the SCC composite, SCC is distinguished from conventional concrete. The influence of infill materials on the properties of SCC has consequently been the focus of numerous studies. The incorporation of infill materials into SCC leads to improved workability and reduced cement percentages [6]. It is also possible to achieve reduced shrinkage fractures and low hydration temperatures by incorporating infill materials, such as pozzolanic materials. In contrast to heat hydration, the long-term performance of SCC can be enhanced with fine materials exhibiting a range of particle sizes and morphologies. This is achieved through an increase in compactness and a reduction in the risk of cracks [7]. In addition, as cement is the most costly constituent of cementitious composites, reducing the cement concentration could be considered an economical strategy. Furthermore, by filling the spaces between the particles, impermeable cementitious composites might be produced. As a result, the resilience of concrete is further enhanced [8]. In fact, improved workability and cohesiveness are the outcomes of incorporating pozzolanic materials, which improve particle grading and bonding [1].
![Figure 1
Advantages of waste-derived SCC [9].](/document/doi/10.1515/rams-2024-0043/asset/graphic/j_rams-2024-0043_fig_001.jpg)
Advantages of waste-derived SCC [9].
Several scholars are currently dedicating more time to the examination of the intersection between the utilization of renewable resources and global environmental preservation [10,11]. Sustainable development seeks to simultaneously improve living conditions and meet the requirements of future generations. The organization’s goals consist of addressing fundamental necessities, enhancing quality of life, and advocating for the conservation and governance of ecosystems [12]. There is a significant surge in the worldwide reuse of various types of industrial waste as a response to rising public concerns regarding ecological degradation, depletion of fossil fuel, and sustainable development [13]. In general, the production of cement, which is an essential component of concrete, generates significant quantities of hazardous gas emissions, including carbon dioxide [14]. Recent studies have centered on the reduction of construction expenses and the partial substitution of cement with industrial byproducts [15]. The reduction of waste and proper waste management are widely recognized as the most pressing concerns in most emerging countries [16]. Waste marble and glass exhibits promise as an alternative for cement in concrete [17,18,19,20]. The incorporation of marble and glass powder into concrete results in enhanced durability, improved flowability, and increased strength, in addition to cost-effectiveness and sustainable building practices [21,22]. Research has been conducted to incorporate waste glass and marble in SCC [1,23]. However, those are mostly experimental studies. Therefore, to gain a more thorough understanding of the performance of waste marble and glass-based SCC, it has become imperative to employ modern tools that can forecast their various properties.
Compressive strength (CS) is a critical mechanical property of a building material that influences the service life of a structure. Cementitious composites can be characterized as heterogeneous mixtures comprising numerous elements in which nonlinear interactions among each constituent impact the composites’ strength [24]. The prevailing method employed to assess the strength of cementitious composites is mechanical testing. Nonetheless, it is important to acknowledge that this methodology has labor-intensive and financial requirements [25]. The CS of cementitious composites has been predicted by a number of researchers through the administration of linear regression models [26,27]. Making accurate predictions is challenging because of the nonlinear relationship that exists between cementitious composite elements and mechanical strength [28,29]. Researchers have originated the application of artificial intelligence (AI) methodologies in order to address the aforementioned problems [30,31,32]. Utilizing a data-driven strategy to establish a nonlinear correlation between the ingredients of cementitious composites and their mechanical strength is an emerging trend [33,34]. The strength of cementitious composites has been predicted by utilizing supervised machine learning (ML) techniques [35,36,37]. In recent times, the majority of scholars have used ML techniques to forecast the parameters of conventional cementitious composites [38,39]. A limited number of researchers have utilized ML methods to analyze SCC strength [40,41]. However, no mathematical expression has been developed using gene-expression programming (GEP) and multi-expression programming (MEP) for the validation and future prediction of waste glass and marble-based SCC. Developing ML-based models with mathematical expressions could facilitate such predictions in the future and conserve resources and time.
This study aims to develop prediction models for the CS of waste glass and marble-based SCC using ML methods. Traditional experimental procedures to determine SCC properties require significant financial investment, time commitment, and physical effort due to the complex procedural requirements. These requirements include acquiring the necessary ingredients, casting the samples, curing the samples to achieve their strength, and conducting the subsequent testing phase. By applying sophisticated modeling techniques, such as ML, the construction industry may be able to alleviate these obstacles and gain substantial benefits. Therefore, GEP and MEP are utilized because of their advantage in yielding mathematical expressions to accomplish the research objective. The evaluation of each model’s approximation accuracy is performed by executing statistical tests and comparing the predicted outcomes to the true test results. Additionally, sensitivity analysis and SHapley Additive exPlanations (SHAP) analysis are conducted to examine the impact and interaction of input parameters on the model predictions. The database necessary for ML techniques can be acquired through laboratory experiments or scholarly literature. Consequently, the dataset may be applied to the execution of ML algorithms, prediction of material characteristics, and relative effects analyses. An experimental dataset is utilized in this research to evaluate the efficiency of GEP and MEP ML methods in forecasting the SC of SCC. The outcomes of this research may aid researchers and relevant industries in optimizing the mix design of SCC and eliminate repeated experimental processes.
2 Data description
By amplification of an initial database of 51 points to 510, this study estimated the CS of SCC with the aid of eight input parameters (water-binder ratio, cement, glass powder, marble powder, density, water, slump flow, and curing time) [42]. The water-binder ratio was selected as an input variable due to its critical role in determining the properties of concrete, specifically its CS, despite the fact that the majority of input parameters are expressed in kg·m−3. It is imperative to optimize the mix design, as [43]. It is also essential to recognize that the proportions and interactions of a variety of mixed components, such as waste glass, marble, cement, and water, are significantly influenced by the water-binder ratio. The allocation of data for model development is as follows: 30% is designated for the training phase, and 70% is allocated for the testing phase. The executed Python code adhered to a specific protocol in order to augment points of the database. It begins by displaying a Tkinter-based file dialog window from which the user can select a database file. The file is subsequently imported into a Pandas DataFrame after its selection, and the script verifies the existing point count. A novel file is produced, which comprises the dataset resulting from the integration of the synthetic data and the initial DataFrame. During the process of supplementing the data, the script presents insightful statements. The declarations encompass various pieces of information, such as the exact location of the saved file, the quantity of synthetic data points added, and the overall count of data points added. In addition, the script accounts for scenarios in which resampling is required, or no file is selected. The collection and organization of the data were facilitated by data preparation. Utilizing data preparation as a buffer to overcome a significant obstacle in the well-known process of extracting new insights from old data is a common approach [44].
When demonstrating ML techniques, it is also critical to implement diverse configurations of identical assets. In descriptive statistics, for instance, a compilation of illustrative coefficients can be utilized to derive conclusions regarding the entire dataset or a subset thereof. Descriptive statistics employed the following measures: standard deviation, mode, mean, and median. Descriptive research results comprise a heterogeneous assortment of information derived from the raw data gathered during the research process. The outcomes of the statistical investigation of the data are displayed in Table 1. Specifically, the distributions of cumulative and standard scores are presented. Descriptive statistics offer a comprehensive overview of the entire dataset by succinctly summarizing the most notable characteristics of the investigated variables. The range and standard deviation quantify the dispersion relative to the mean, while the mean itself quantifies the central tendency. The determination of the distribution’s shape can be achieved through the computation of skewness and kurtosis, metrics that quantify whether the data are asymmetrical or possess hefty tails. Furthermore, the count signifies the dataset’s sample size, thereby ensuring the results’ dependability.
An analysis of the variables using statistical methods
| Parameter | Water-binder ratio | Cement (kg·m−3) | Marble powder (kg·m−3) | Glass powder (kg·m−3) | Water (kg·m−3) | Slump flow (mm) | Density (kg·m−3) | Curing time (day) | CS (MPa) |
|---|---|---|---|---|---|---|---|---|---|
| Mean | 0.452 | 320.706 | 38.353 | 40.941 | 180.784 | 753.445 | 2509.643 | 41.590 | 31.462 |
| Standard error | 0.002 | 2.030 | 1.374 | 1.345 | 0.679 | 2.231 | 3.256 | 1.545 | 0.371 |
| Median | 0.45 | 320 | 40 | 40 | 180 | 750 | 2542 | 28 | 32.32 |
| Mode | 0.45 | 320 | 40 | 40 | 180 | 725 | 2490 | 28 | 34.54 |
| Standard deviation | 0.038 | 45.852 | 31.021 | 30.385 | 15.334 | 50.379 | 73.540 | 34.891 | 8.378 |
| Sample variance | 0.001 | 2102.448 | 962.311 | 923.277 | 235.140 | 2538.090 | 5408.179 | 1217.362 | 70.192 |
| Kurtosis | −1.294 | −0.328 | −1.333 | −1.263 | −1.294 | −1.061 | −0.578 | −1.466 | 0.488 |
| Skewness | −0.067 | −0.011 | 0.071 | −0.039 | −0.067 | 0.039 | −0.496 | 0.546 | 0.466 |
| Range | 0.1 | 160 | 80 | 80 | 40 | 170 | 266 | 83 | 40.44 |
| Minimum | 0.4 | 240 | 0 | 0 | 160 | 660 | 2366 | 7 | 16.12 |
| Maximum | 0.5 | 400 | 80 | 80 | 200 | 830 | 2632 | 90 | 56.56 |
| Sum | 230.5 | 163,560 | 19,560 | 20,880 | 92,200 | 384,257 | 12,79,918 | 21,211 | 16045.54 |
| Count | 510 | 510 | 510 | 510 | 510 | 510 | 510 | 510 | 510 |
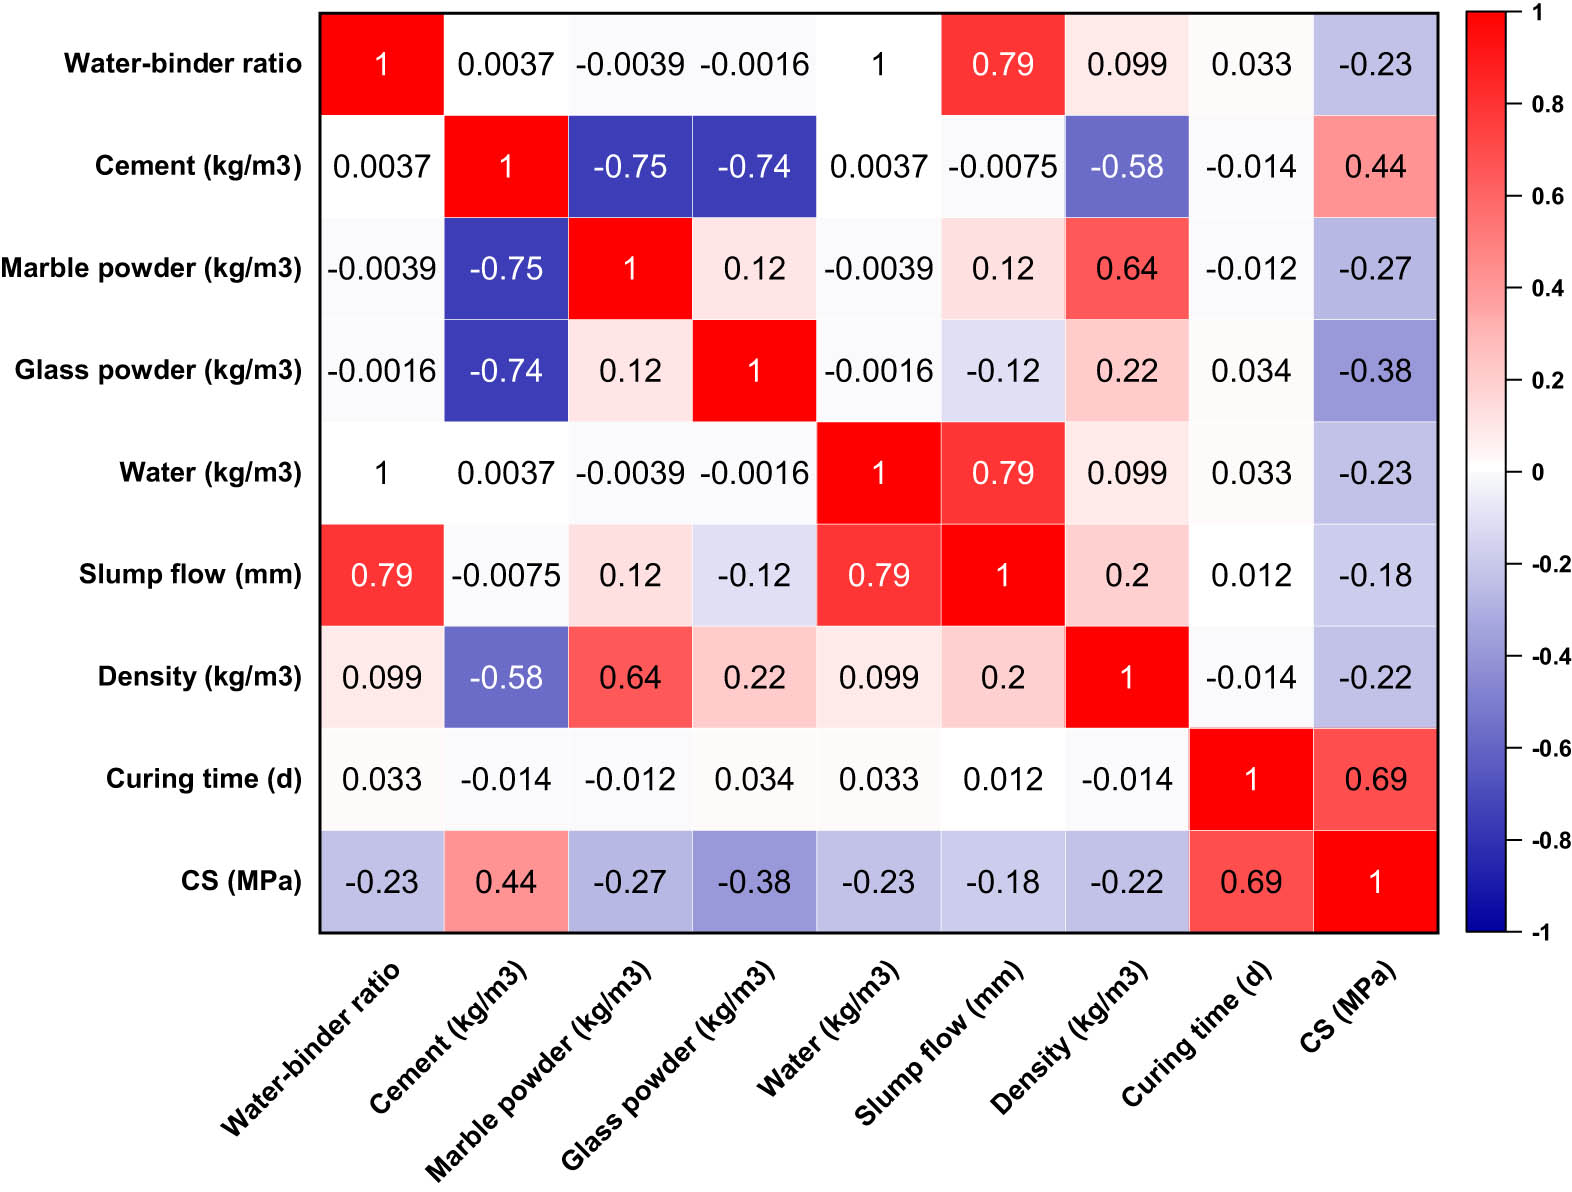
In order to prevent the performance of ML models from being disproportionately influenced by features with larger values, data autoscaling and standardization are essential. The model’s accuracy and stability are improved by ensuring that each variable contributes equally through data normalization. Especially in complex datasets, this procedure is crucial for obtaining interpretable and dependable results. Prior to the ML algorithms commencing their analysis, it was imperative to normalize the original data. The computational stability is enhanced by the normalizing procedure, which also eliminates the undesirable feature scaling effects [45]. Each parameter was standardized to fall within the range of 0–0.9 using Eq. (1). As a collective, these numerical values establish the foundation for subsequent examination and deliberation by offering an understanding of the attributes of the dataset. Determining the magnitude and direction of the linear association between the two variables is possible through the utilization of correlation coefficients, as depicted in Figure 2. The magnitude of coefficients is quantified on a range ranging from −1 to +1. Values approaching +1 indicate a robust positive correlation, while values approaching −1 indicate a robust negative correlation. A coefficient in the vicinity of zero indicates that the variables have little to no linear relationship. Coefficients play a crucial role in statistical analysis as they offer valuable insights into the strength of the relationship between distinct data elements
where
The coefficient of correlation for the parameter.
3 Research methods
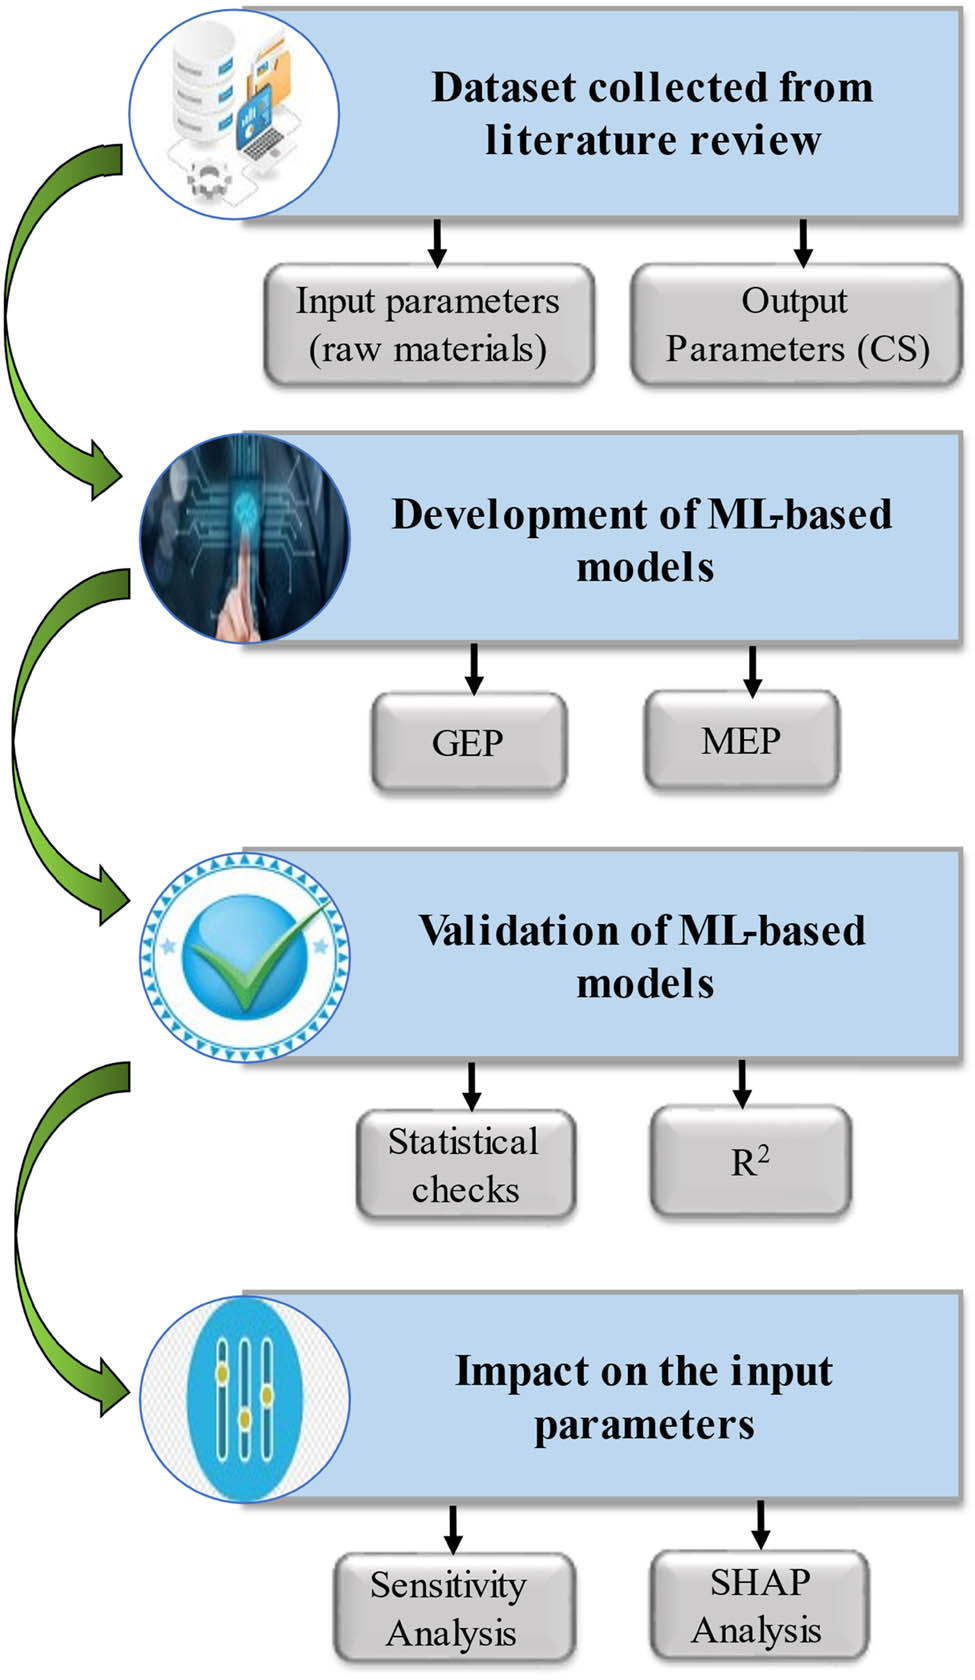
The application of ML techniques in a variety of fields allows for the prediction and comprehension of the behavior of materials. For the purpose of this investigation, the CS of SCC is predicted by employing ML-based methods, which include the GEP and MEP. This selection was made due to the fact that these methods are frequently employed, have consistently anticipated findings in the research that are linked to them, and are considered to be the most exceptional data mining algorithms. The flow chart for this investigation is presented in Figure 3.
Research process flowchart.
3.1 GEP
GEP is an evolutionary algorithm that integrates genetic algorithms (GAs) and genetic programming (GP) to develop models and resolve intricate issues. It represents solutions as linear chromosomes, which are subsequently expressed as nonlinear entities or parse trees. This approach enables GEP to investigate a broad spectrum of potential solutions and produce explicit mathematical equations that characterize the relationships between the input variables and the output. GEP is particularly effective for symbolic regression, which involves the identification of a mathematical expression that most closely matches a specific set of data. In the genetic algorithm, sequences of a fixed size are utilized. Koza expanded upon GA and proposed GP as an alternative solution [46]. Figure 4 is a representation of the process of designing a computer program to solve a problem by employing the GP methodology. By integrating a spatial parser architecture, GP can function as an effective ML technique. Nevertheless, despite the identification of three genetic operators in GP, their practical implementation is limited to tree crossover, resulting in an immense population of parse trees [46,47]. An additional limitation of the GP algorithm is its disregard for neutral genomes. The GP algorithm’s phenotype and genotype both necessitate a nonlinear configuration, which renders the formulation of a widely used and straightforward empirical equation unattainable [48]. Ferreira introduced the GEP approach as an alternative variant of the GP approach with the intention of mitigating its inconsistencies [48]. A fundamental aspect of GEP is the integration of parse trees and simple fixed-length linear chromosomes. An essential alteration in GEP consists of solely passing on the genome to the next generation; this obviates the necessity of replicating the complete structure, as all modifications transpire within a linear function. An additional noteworthy aspect pertains to the development of a model comprising a solitary chromosome comprised of distinct genes, subsequently classified as tail and head [49,50,51]. Each gene in the GEP model is represented by mathematical operators, a terminating function, and a constant parametric length. Additionally, the genetic code operator maintains a secure link between the chromosomes and the junctions. The essential information for constructing the GEP model is encoded in chromosomes, and a novel language, karva, has been developed to deduce this information. Figure 5 depicts the procedure utilized in the GEP method. It begins with the determined generation of span chromosomes at random for each individual. The resulting values are subsequently converted to expression trees (ETs), and the fitness potential of each individual is assessed. Before the optimal result is attained, the repetition with novel individuals continues for many generations.
![Figure 4
A flowchart that the GP algorithm employs [52].](/document/doi/10.1515/rams-2024-0043/asset/graphic/j_rams-2024-0043_fig_004.jpg)
A flowchart that the GP algorithm employs [52].
![Figure 5
A flowchart that the GEP algorithm employs [52].](/document/doi/10.1515/rams-2024-0043/asset/graphic/j_rams-2024-0043_fig_005.jpg)
A flowchart that the GEP algorithm employs [52].
3.2 MEP
MEP is a sophisticated form of genetic programming that incorporates numerous potential solutions within a single chromosome. The algorithm is capable of evaluating and selecting the most effective expressions simultaneously, as each chromosome in MEP can represent multiple expressions. This method frequently results in more precise and resilient models by simultaneously investigating a more extensive solution space. MEP is particularly advantageous for issues that necessitate high precision and dependability, such as the prediction of the CS of materials such as SCC. Oltean [53] introduced MEP, an evolutionary optimization method that can be implemented to address optimization challenges. The algorithm operates by generating a program that can be utilized to solve the problem through the evolution of a series of mathematical expressions [54]. Programs are represented in MEP as collections of mathematical expressions, whereas in GEP, they are represented by a series of symbols, which can be interpreted as expressions in the field of mathematical analysis. Furthermore, it has been observed that MEP produces a greater variety of expressions compared to GEP, potentially enhancing its efficacy in navigating the search space and locating optimal solutions [55]. The functional principle of MEP-based models is illustrated in Figure 6. The algorithm initializes a population of candidate programs as its initial step. Every program is mathematically depicted as a collection of expressions. Once the programs have been initialized, their suitability for the population is evaluated by employing a fitness function that quantifies the degree to which the programs accomplish the optimization problem. The optimal programs are then selected from the population using the selection procedure. The greater the suitability of the program, the greater its probability of being chosen. Through variation, the chosen programs are utilized to generate new programs. In the process of variation, genetic operators like crossover and mutation may be utilized. The newly implemented programs are subsequently employed to substitute certain programs within the population. The replacement procedure may be deterministic, in which the least desirable programs are substituted, or stochastic, in which a selection of programs is replaced at random. Iterations of the algorithm persist until a termination condition is satisfied. A specific fitness level or a limited number of iterations may constitute the termination stage. In conclusion, the algorithm returns the optimal program as the resolution to the efficiency challenge. MEP has been highly implemented in the construction sector over the last several decades.
![Figure 6
A flowchart that the MEP algorithm employs [56].](/document/doi/10.1515/rams-2024-0043/asset/graphic/j_rams-2024-0043_fig_006.jpg)
A flowchart that the MEP algorithm employs [56].
4 Performance evaluation and model development criteria
Developing a suitable prediction model through the implementation of AI commences by carefully choosing the most significant input parameters. To achieve this objective, a thorough examination of every input parameter listed in the database was undertaken, and the effects of several preliminary trials were assessed to determine which parameters exert the most substantial influence on the CS of SCC. Through the use of Eq. (2), the forecasting model for the CS of SCC was developed.
For the construction of a dependable and scalable GEP and MEP model, it is crucial to define several hyperparameters. These hyperparameters play a key role in the model’s performance and need to be carefully calibrated. The process of finding the most optimal values for these hyperparameters involves a combination of trial and error and referencing previous research studies. This meticulous approach ensures the precision and accuracy of the model [57]. By population size, program quantity development is determined. The degree of sophistication and accuracy of the model increases in tandem with the population size. Nevertheless, the process of generating the most appropriate model may necessitate a more extended period of time. This comprehension guarantees resilient performance and reduces the likelihood of overfitting or skewed outcomes. This procedure assists in determining the optimal hyperparameter values that improve the accuracy and generalizability of the model. In order to make a prediction about the model, the genexpro tool was utilized for the GEP method, and the mepx software version 2023.4.3.0 was applied for the MEP. The range of hyperparameter values that were determined to be optimal for predicting the CS of SCC is shown in Table 2.
Configuration of hyperparameter optimization for the ML models
| Hyperparameter | GEP | MEP | Optimized value |
|---|---|---|---|
| Code length | — | 20–50 | 30 |
| Number of runs | — | 10–30 | 20 |
| Operators/variables | — | 0.3–0.6 | 0.4 |
| Cross over probability | — | 0.3–0.8 | 0.8 |
| Number of sub-populations | — | 20–100 | 50 |
| Number of generations | 50–500 | 200–600 | 450 |
| Genes | 1–5 | 1 | 3 |
| Chromosomes | 50–300 | — | 250 |
| Head length | 5–50 | — | 20 |
| Tail length | 5–50 | — | 10 |
| Crossover rate | 0.5–1.0 | — | 0.8 |
| Mutation rate | 0.01–0.1 | — | 0.05 |
| Population size | 50–500 | — | 200 |
4.1 Development of the GEP model
The duration of a program’s execution is determined by the population size (chromosomes). In consideration of the model’s complexity and difficulty, 250 chromosomes are allocated. The architectural design of the GEP model is established based on two factors: the quantity of genes and the magnitude of the head. Through the process of adding up all the sub-ETs of the model, the head has the ability to ascertain the level of difficulty associated with each expression. As a result, the population size, number of genes, and head size are assumed to be 250, 3, and 7, respectively. The configured configurations of the GEP parameters utilized in the generation of a precise GEP model are presented in Table 3. In addition, in conjunction with other arithmetic operations, the linkage function is utilized in GEP modeling.
Configuration of GEP parameters
| Parameters | Settings |
|---|---|
| General | CS |
| Chromosomes | 250 |
| Head size | 7 |
| Constant per gene | 10 |
| Genes | 3 |
| Function set | +, −, ×, ÷, √ |
| Data type | Floating number |
| Linking function | Addition |
| Inversion rate | 0.00546 |
| Gene recombination rate | 0.00277 |
| Lower bound | −10 |
| Upper bound | 10 |
| Mutation rate | 0.00138 |
| Stumbling mutation | 0.00141 |
| RIS transposition rate | 0.00546 |
| Gene transposition rate | 0.00277 |
| Random chromosomes | 0.0026 |
4.2 Development of the MEP model
The MEP modeling process commenced with a subpopulation size of 10. To generate a straightforward and simple final equation, the fundamental arithmetic operations, square root, multiplication, division, subtraction, and addition, were considered. The threshold for the model’s accuracy prior to termination is established by the number of generations. A program that is executed with a greater number of generations in consideration would produce outcomes with reduced error. The likelihood that progeny will endure genetic functions is similarly determined by the rate of mutation and crossover. The crossover probability varies from 50 to 95% [54]. Numerous combinations were tested, and the most effective one is shown in Table 4. It is important to highlight that the accuracy of the anticipated model is influenced by the duration of generation evaluation. The model’s evolution persists indefinitely due to the incorporation of additional variables into the system. This study, conversely, establishes 2000 generations as the halting criterion for model evolution, or the point at which the fitness function changes by less than 0.1%.
Configuration of MEP parameters
| MEP | |
|---|---|
| Parameters | Settings |
| Code length | 30 |
| Number of sub-populations | 50 |
| Cross over probability | 0.7 |
| Sub-population size | 100 |
| Number of generations | 450 |
| Number of runs | 20 |
| Function set | +, −, ×, ÷, √ |
| Mutation probability | 0.01 |
| Operators/variables | 0.4 |
| Terminal set | Problem input |
| Replication number | 15 |
| Error | MSE, MAE |
| Problem type | Regression |
| Number of treads | 2 |
4.3 Criteria for model evaluations
To evaluate the performance of a model on a training or testing set, statistical errors, including mean absolute error (MAE), R-square value (R 2), root mean square error (RMSE), root mean squared logarithmic error (RMSLE), are employed. R 2, which is alternatively known as the determination coefficient, measures the probability that predictions generated by a model will be accurate [58,59]. As a result of progress made in AI modeling techniques, more precise estimates of the mechanical attributes of composites are now feasible. By calculating the error criterion, both the MEP and GEP models are statistically evaluated in this study. A multitude of metrics may contribute to the understanding of the model’s imprecision. In addition, the efficacy of the model can be evaluated by utilizing the standard deviation and variance. The accuracy and validity of the model can be verified by examining the R 2. Models exhibiting R 2 values exceeding 0.50 demonstrate unfavorable results, whereas models featuring R 2 values ranging from 0.65 to 0.75 demonstrate encouraging outcomes. The R 2 value can be determined by employing Eq. (3). The output and units employed in MAE are identical. On occasion, a model with an MAE value within a specified range may contain substantial errors. Eq. (4) is utilized in the calculation of MAE. The average of squared errors between observations and predictions is denoted by the RMSE. When calculating error squared, the squared errors are summed together. This method places greater emphasis on anomalies and significant exceptions than its predecessors, resulting in significant squared differences in certain circumstances and lesser squared differences in others. By providing an input, the RMSE can be utilized to estimate the average computation error of the model. RMSEs of variation are reduced in models that have been enhanced. As RMSE values decrease, the precision of the algorithm’s forecasting of data also diminishes. Eq. (5) is utilized to determine the RMSE. RMSLE took into account the degree of inaccuracy between anticipated and actual outcomes. It represents the variation between the predicted and observed values expressed as a logarithm. Eq. (6) is utilized in the computation of RMSLE. A comprehensive overview of the diverse statistical parameters is presented in Table 5
where
The ranges of error are associated with different statistical metrics
| Evaluation criteria | Range | Model accuracy |
|---|---|---|
| MAE | (0, ∞) | More accurate if less |
| R 2 value | (0, 1) | More accurate if high |
| RMSE | (0, ∞) | More accurate if less |
| RMSLE | (0, ∞) | More accurate if less |
5 Results
5.1 GEP model performance
As shown in Figure 7(a)–(c), the ETs represent the output of the optimal GEP model generated by GeneXproTools. ETs are decoded so that a mathematical equation can be derived to forecast the CS of SCC. Eq. (7) represents the most basic predictive equation, employing only the five fundamental arithmetic operators, namely +, −, /, √, and ×. Furthermore, it is comprised of three discrete variables, namely A, B, and C, which were obtained from Sub-ET 1, 2, and 3, in that order. Equations embody the decoded equations derived from each Sub-ET
where d0 represents the water-binder ratio, d1 represents the cement (kg·m−3), d2 represents the marble powder (kg·m−3), d3 represents the glass powder (kg·m−3), d4 represents the water (kg·m−3), d5 represents the slump flow (mm), d6 represents the density (kg·m−3), and d7 represents the curing time (days).
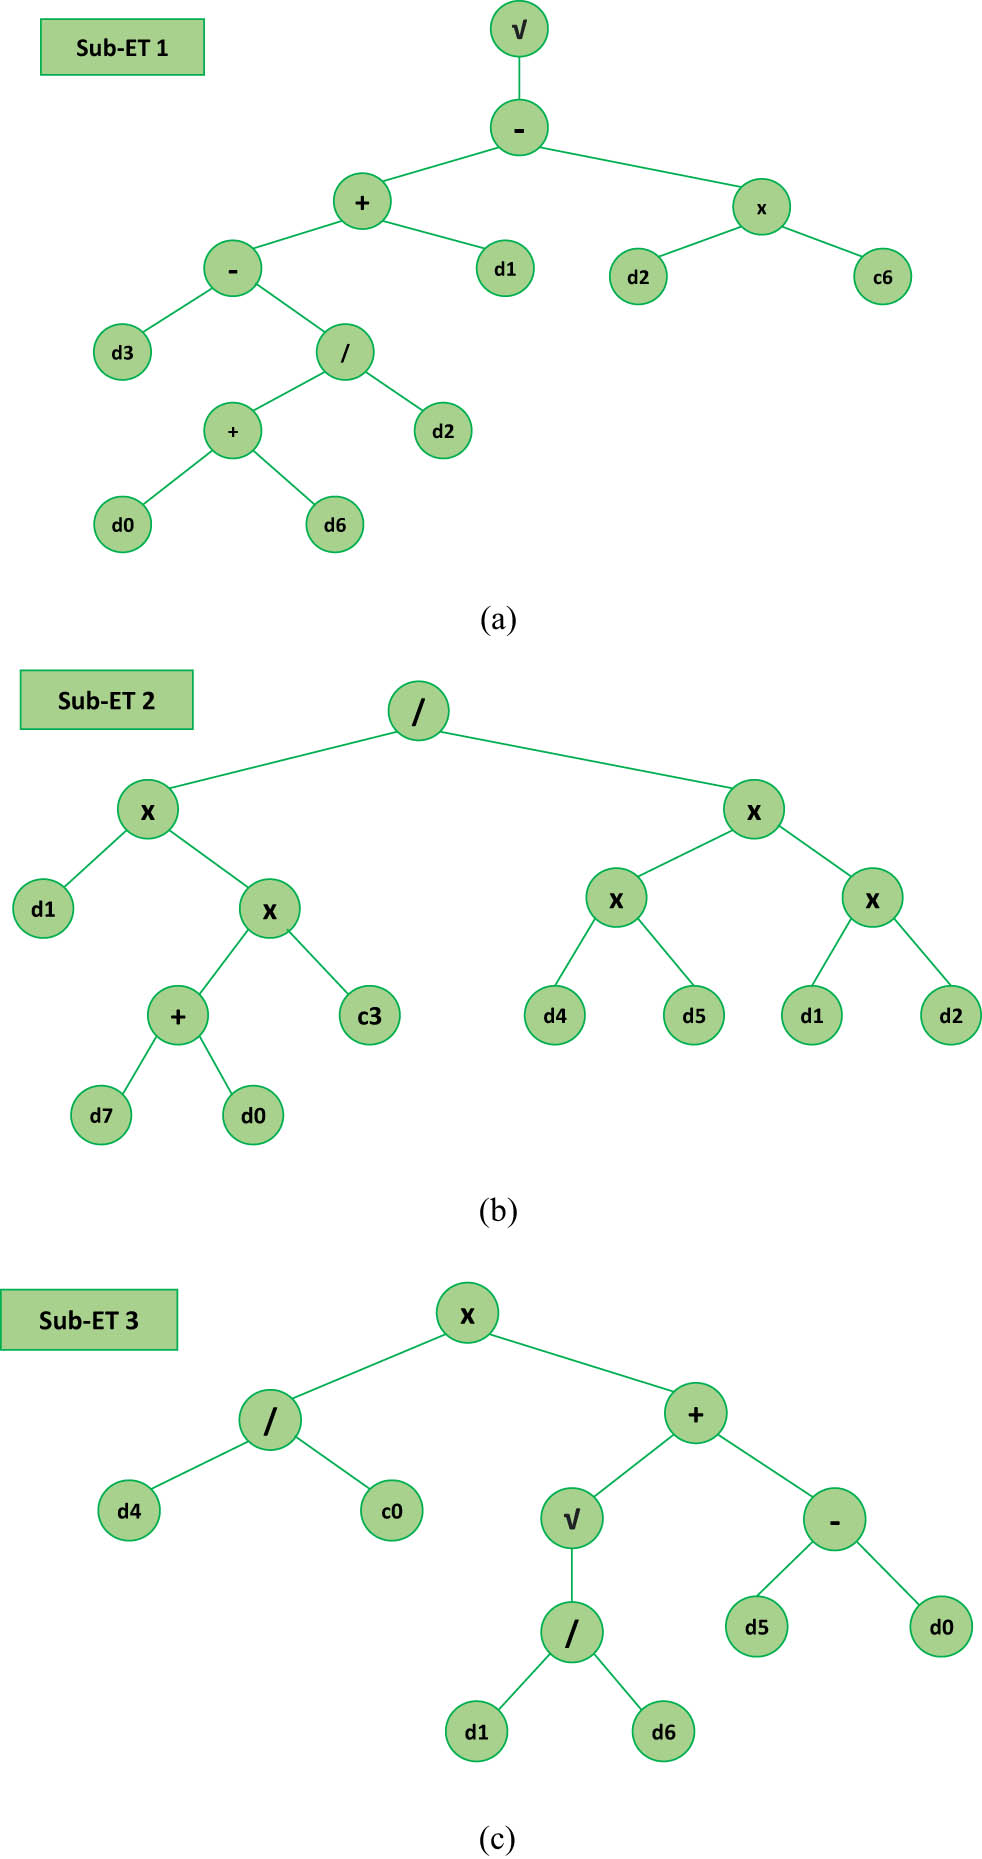
Expression trees were obtained via the GEP model: (a) Sub-ET 1, (b) Sub-ET 2, and (c) Sub-ET 3.
5.2 GEP outcomes from the model
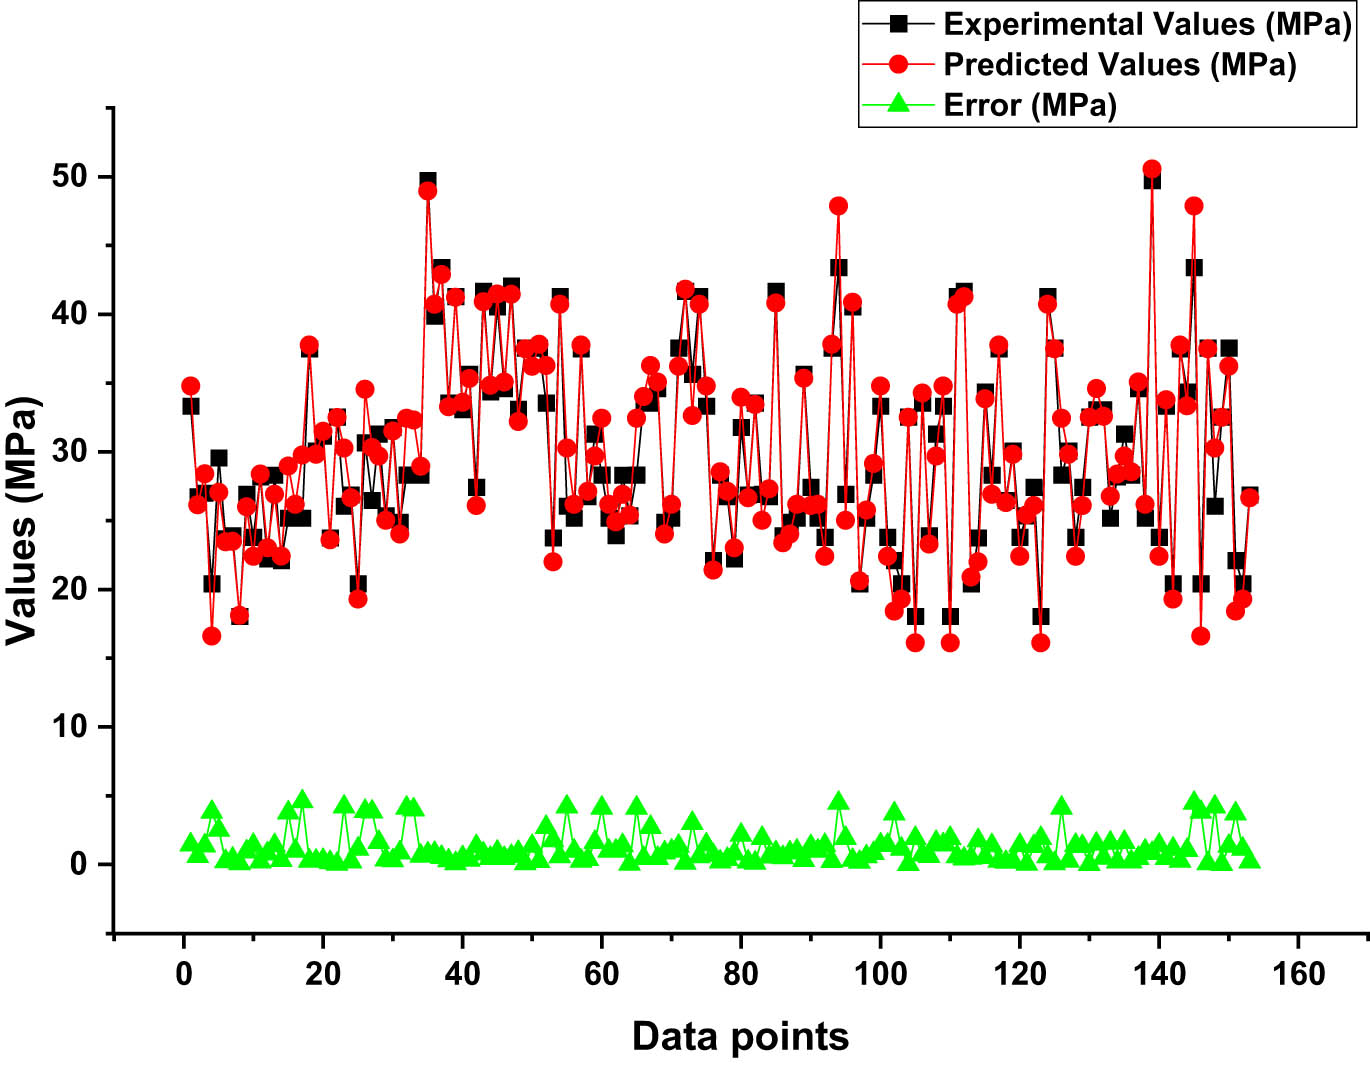
As illustrated in Figure 8, the GEP model in this particular situation has exhibited a noteworthy performance, as demonstrated by its R 2 value of 0.90, which signifies a robust correlation between the anticipated and actual CS values. The error distribution between predicted and actual values is illustrated in Figure 9. It indicates that 48.4% of the predicted CS values have an error of no more than 1 MPa. This demonstrates the model’s ability to make precise CS predictions with a minimal margin of error. Furthermore, it is noteworthy that 28.8% of the predictions lie within the interval of 1–3 MPa, suggesting a marginally wider extent of error that is still deemed acceptable. Nevertheless, 22.8% of the forecasts demonstrate inaccuracies surpassing 3 MPa, indicating that there are difficulties in precisely forecasting higher CS values. The model exhibits its shortcomings in effectively managing extreme cases, as evidenced by the highest error value of 5.61 MPa, whereas its capability to generate precise predictions in specific situations is demonstrated by the lowest error value of 0.11 MPa. The mean error value for the predicted CS values is 1.72 MPa, suggesting that the overall performance is reasonably precise.
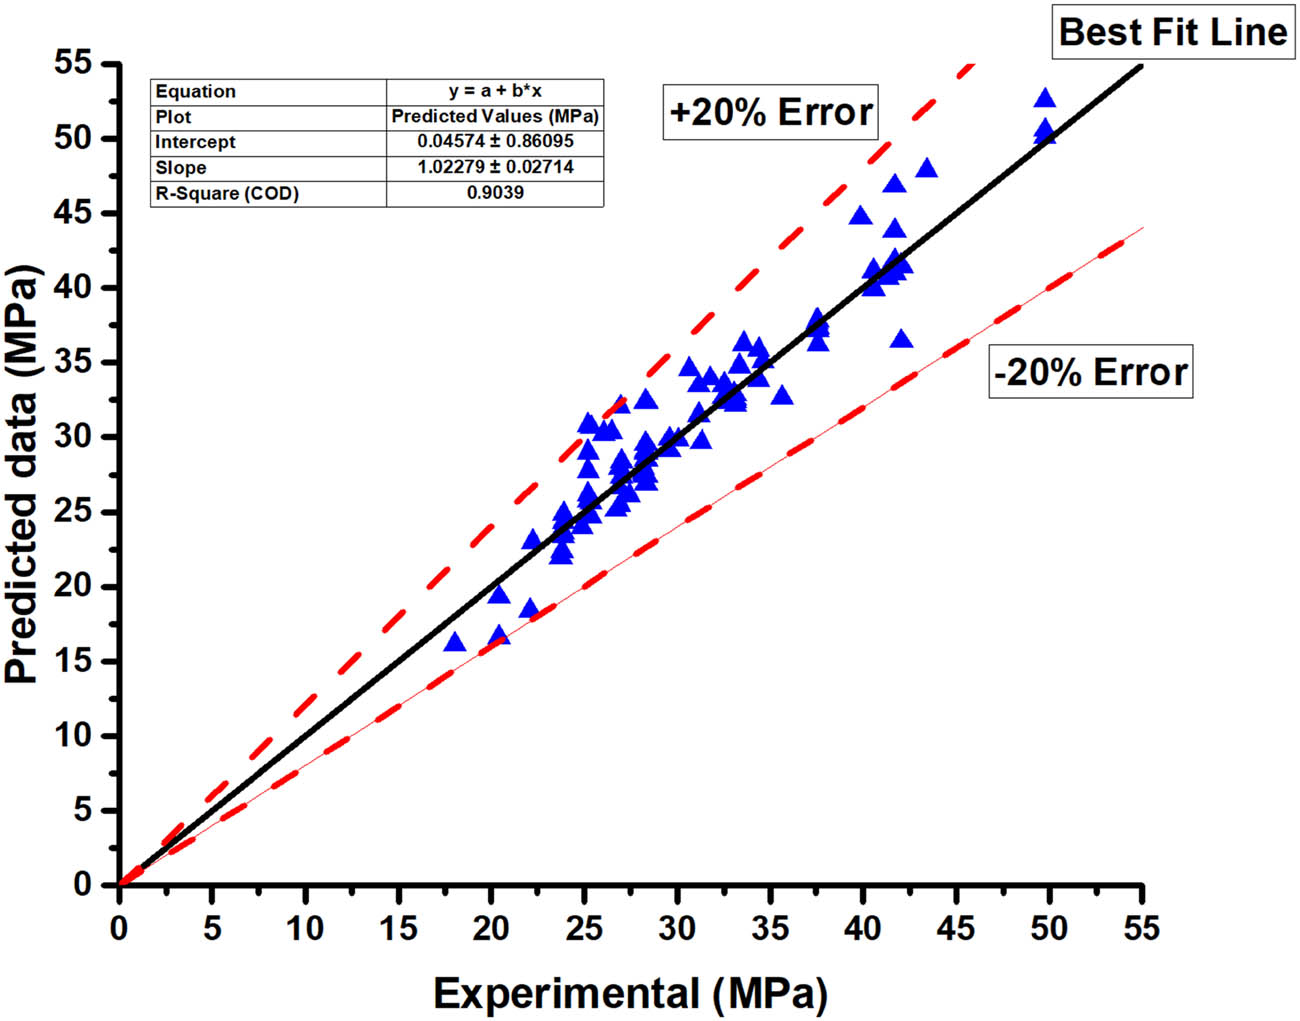
Correlation between actual and predicted findings for the GEP model.

Error distribution for the GEP model.
5.3 MEP model performance
When attempting to predict the CS of SCC, multi-nominal expression models are constructed in this section. In addition, empirical equations derived from ETs for the SCC are represented by Eq. (8); these equations can be employed to denote the resultant CS. Five arithmetic operators comprise the ETs: +, −, /, ×, and √.
where d0 represents the water-binder ratio, d1 represents the cement (kg·m−3), d2 represents the marble powder (kg·m−3), d3 represents the glass powder (kg·m−3), d4 represents the water (kg·m−3), d5 represents the slump flow (mm), d6 represents the density (kg·m−3), and d7 represents the curing time (days).
5.4 MEP outcomes from the model
The MEP model exhibits a remarkable level of performance, as denoted by its R 2 value of 0.94. As illustrated in Figure 10, this result indicates a strong correlation between the predicted and observed CS values. The model’s effectiveness is demonstrated through the error analysis depicted in Figure 11. The results indicated that specifically, 59.5% of the predicted CS values contained errors of less than 1 MPa, demonstrating the model’s capability to predict CS within a limited range precisely. In addition, it is worth noting that 28.1% of the predictions are situated between 1 and 3 MPa, indicating a marginally wider but still satisfactory margin of error. Nevertheless, the fact that a mere 12.4% of predictions exhibit errors surpassing 3 MPa suggests that it is difficult to predict with precision higher CS values. The model exhibits limitations in managing extreme cases, as evidenced by the highest error value of 4.57 MPa, whereas its capability to generate precise predictions in specific scenarios is highlighted by the smallest error value of 0.02 MPa. The mean error value for the predicted CS values is 1.21 MPa, indicating that the overall performance is consistently precise.

Correlation between actual and predicted findings for the MEP model.
Error distribution for the MEP model.
5.5 Evaluation of statistical checks for the GEP and MEP models
Statistical analyses that compare the efficacy of the MEP and GEP models reveal significant differences, as illustrated in Figure 12. The MAE for GEP is 1.723, while MEP has a comparatively lesser MAE of 1.217. This discrepancy suggests that MEP provides a more accurate prediction of the target variable. In a similar vein, the mean absolute percentage error (MAPE) for MEP is 4.40%, which is lower than that of GEP’s 6.00%, further emphasizing MEP’s improved precision. Furthermore, the RMSE of GEP is 2.34, while MEP attains a diminished RMSE of 1.71, demonstrating the enhanced efficacy of MEP in mitigating prediction errors. Moreover, in relation to the RMSLE, GEP demonstrates a greater value of 0.076 in contrast to MEP’s lower value of 0.057; this discrepancy underscores the superior predictive accuracy of MEP, even when the logarithmic scale is taken into account. In general, MEP exhibits superior performance to GEP across a range of statistical metrics, thereby showcasing its effectiveness and capacity to generate more precise forecasts in diverse applications.
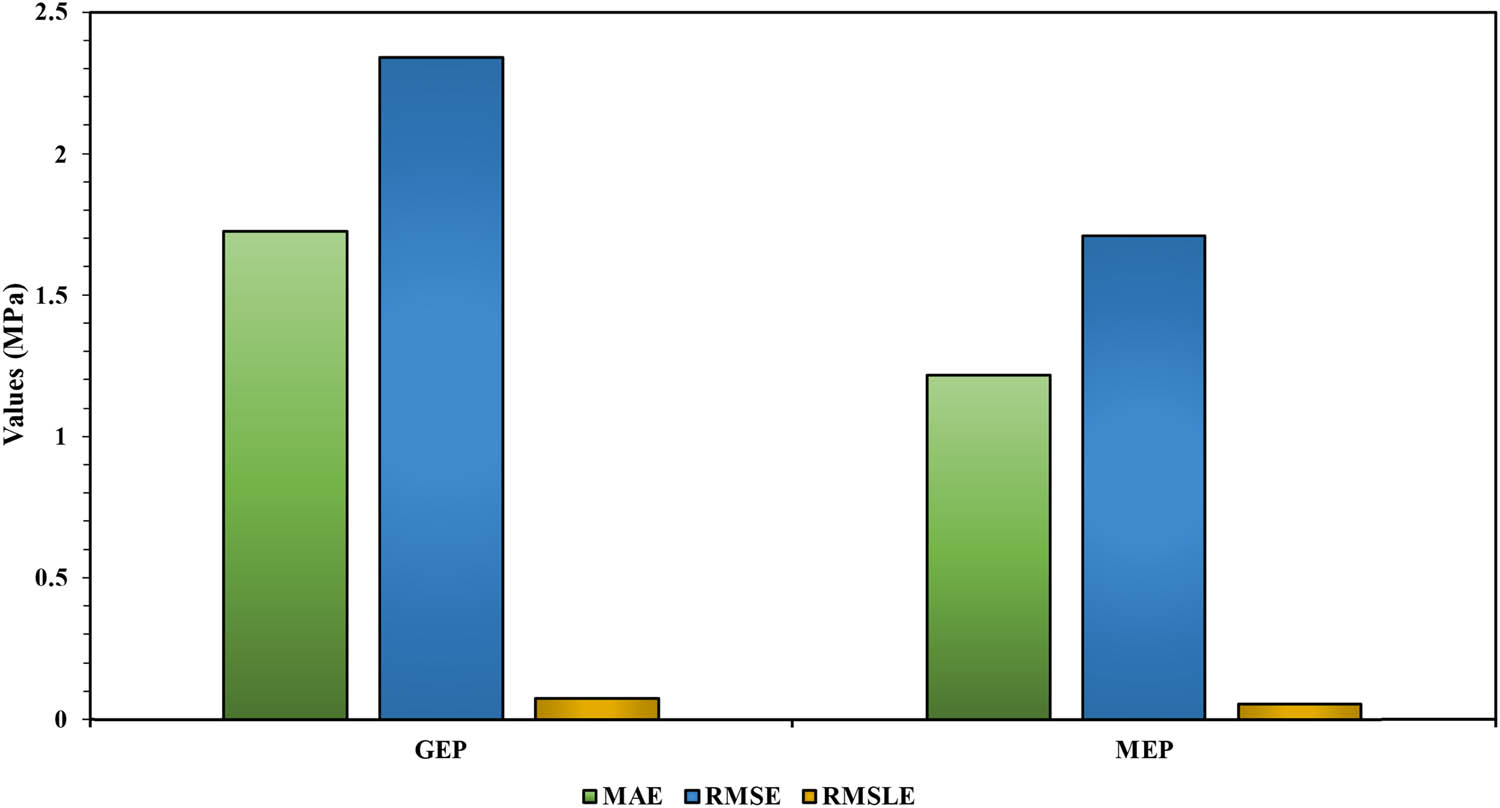
Statistical checks for the GEP and MEP models.
5.6 Sensitivity analysis
The current study investigates the influence of various input components on the precision of CS prediction for SCC. The degree of accuracy of the predicted results is notably influenced by the parameters provided as input [60]. According to the findings of the sensitivity analysis, the most significant factor in the development of SCC strength is the curing time, which has the maximum impact at 42.7%. This is because the curing time directly impacts hydration and the subsequent production of properties. Cement, which comprises 14.3% of the mixture, serves as the principal binder and is critical for imparting the structure with cohesion and strength. At 2.7%, the water-binder ratio is crucial for achieving a balance between workability and strength. In contrast, the water contents of marble powder, glass powder, and glass were 3.1, 0.9, and 5.3%, respectively. The slump flow influenced the CS of SCC by 23.4%, whereas density influenced it by 7.6%. Figure 13 shows how the CS prediction is related to each input parameter. The quantity of data points utilized in the model’s construction and the number of input variables have an impact on the results of the sensitivity analyses. Nevertheless, the employed ML technique is capable of ascertaining the individual contribution of each parameter. The results obtained from these evaluations lack coherence due to the inclusion of additional input variables. By applying Eqs. (9) and (10), the impact of each variable on the output is computed
where
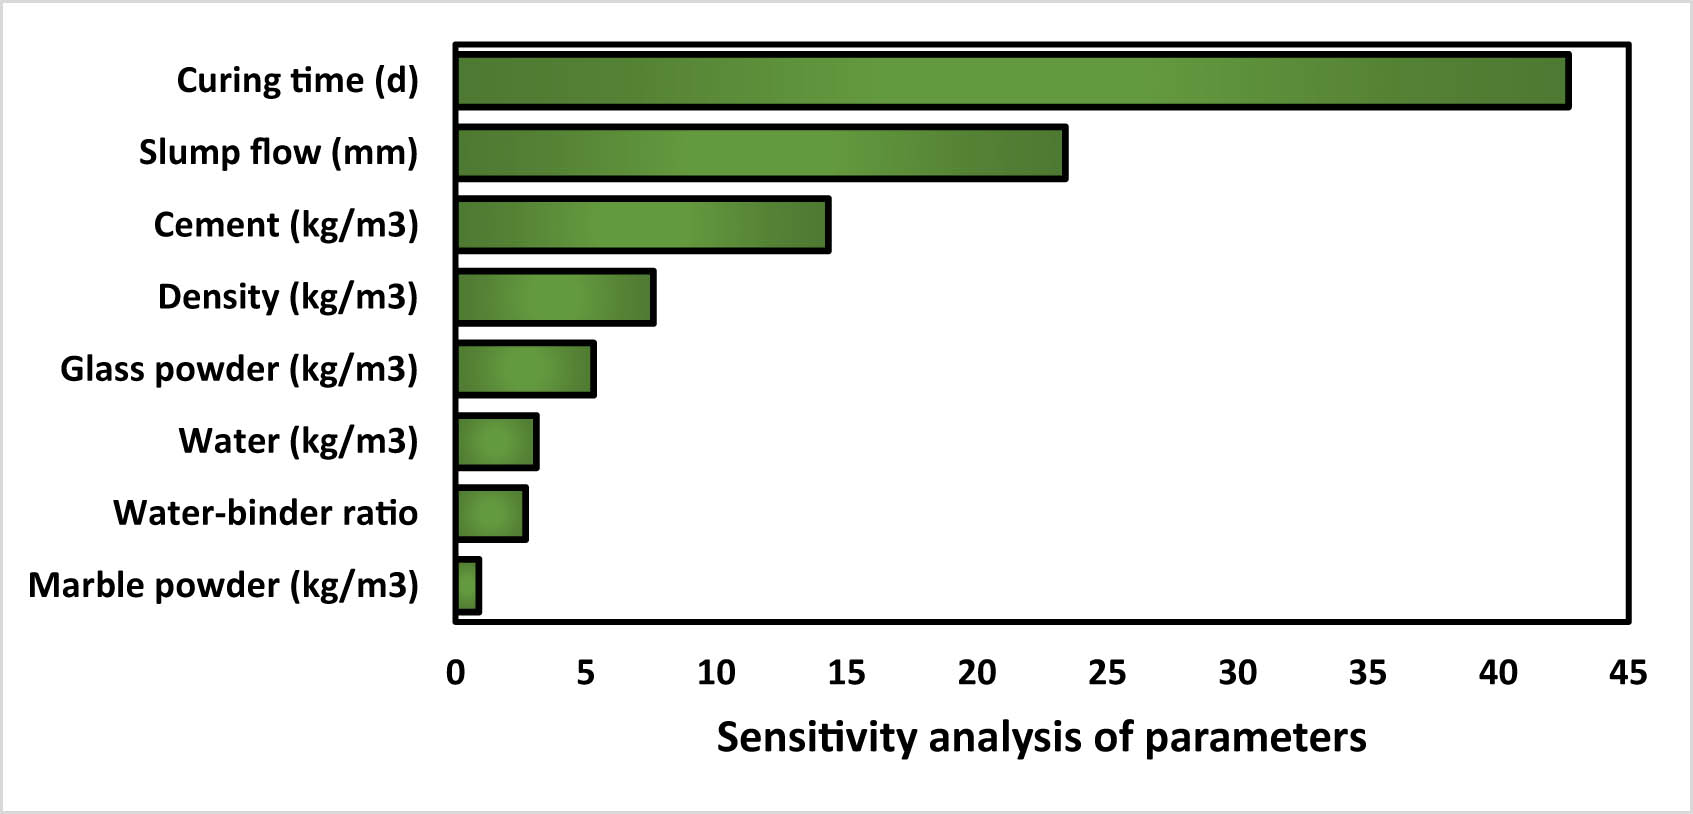
Sensitivity analysis of SCC in forecasting the CS.
5.7 Interaction study using SHAP analysis
The interaction study using SHAP analysis, as illustrated in Figure 14, provides a comprehensive insight into the relationships between various variables and their SHAP values. Each dot in the figure is color-coded, with red indicating high values of the most dependent variable and blue indicating low values. This visual representation highlights the correlation between the variables and their SHAP values. For instance, an increase in CT shows a positive effect, further amplified when the density of SCC also increases, resulting in high SHAP values (Figure 14(a)). Conversely, the amount of cement initially increases density but then decreases it when excessive, with an optimum value identified at 325 kg·m−3 (Figure 14(b)). A negative correlation exists between SF and CT, where increasing SF decreases CT (Figure 14(c)). An increase in GP combined with lower CT yields lower SHAP values, with an optimal GP value at 40 kg·m−3 (Figure 14(d)). Lower water-binder ratios coupled with higher cement levels lead to high SHAP values (Figure 14(e)). Density was found to be more detrimental, with moderate density and higher CT producing higher SHAP values (Figure 14(f)). Higher levels of MP and SF result in lower SHAP values, with the optimal MP value at 40 kg·m−³ (Figure 14(g)). The impact of the water ratio remains unclear due to limited variation in the dataset (Figure 14(h)). This analysis underscores the intricate interplay between these variables and their effects on SHAP values, guiding the identification of optimal levels for various components.
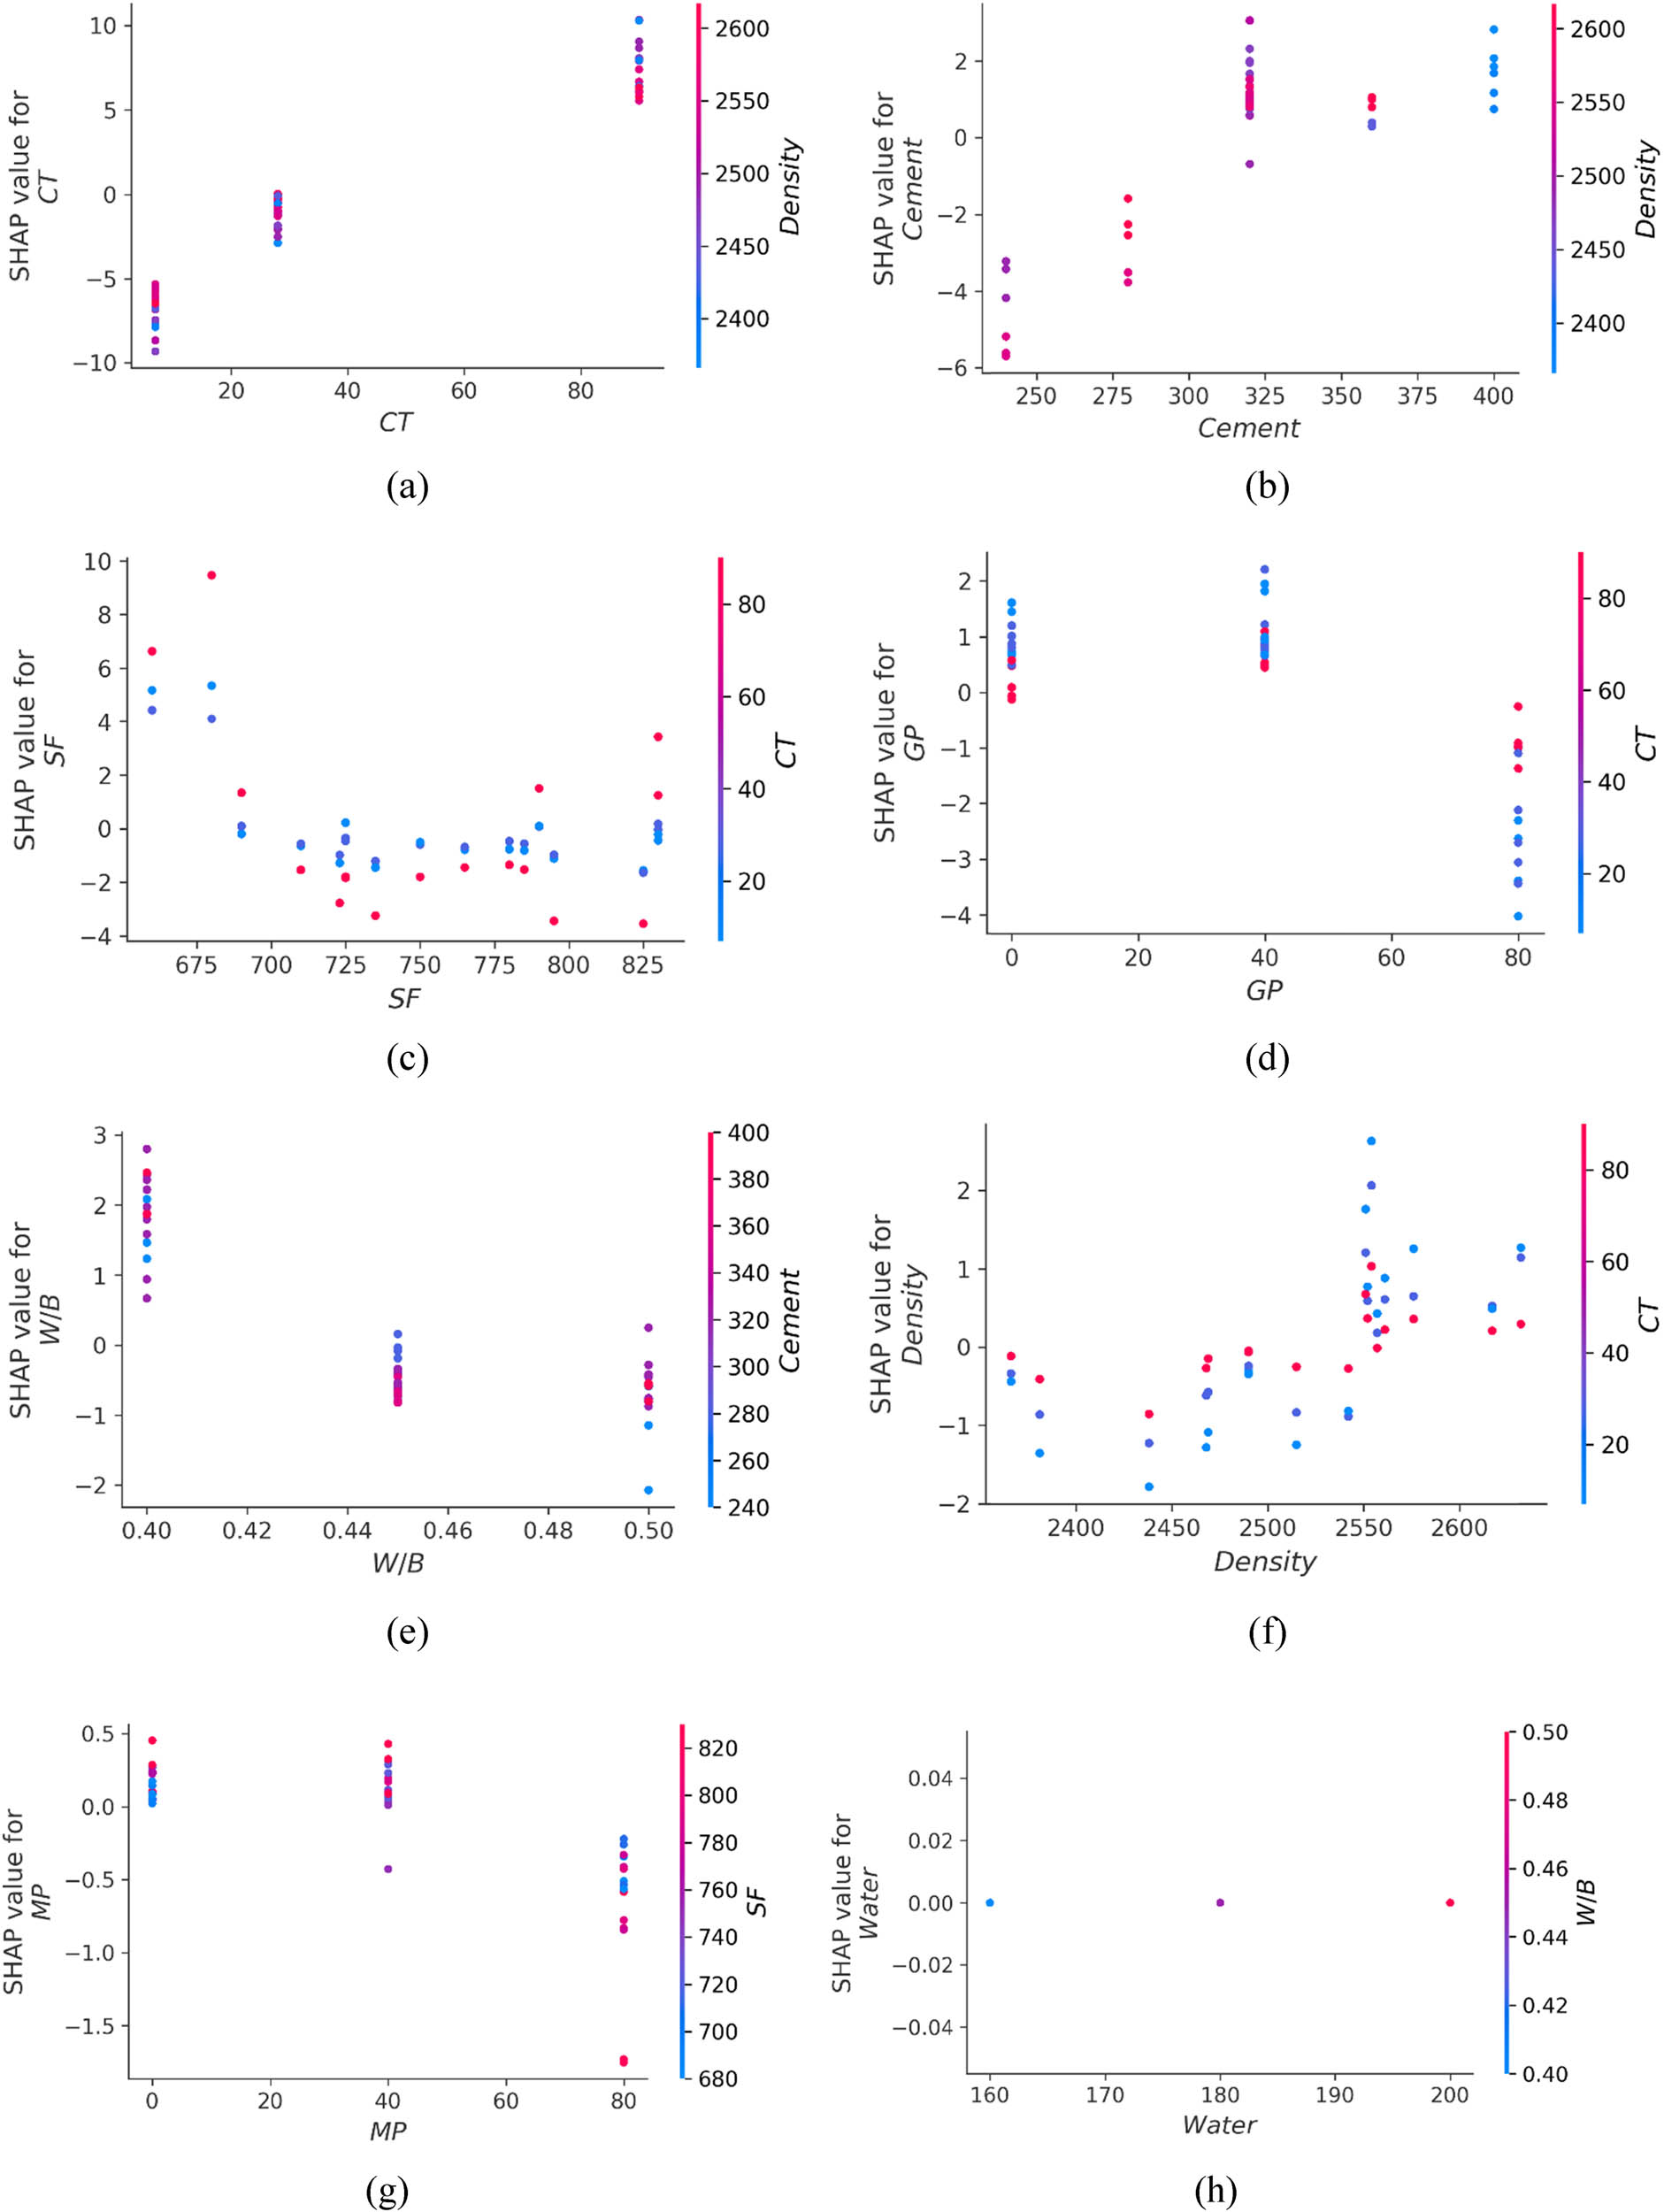
Interdependencies plot: (a) CT, (b) cement, (c) SF, (d) GP, (e) W/B, (f) density, (g) MP, and (h) water.
6 Discussions
The research utilized two genetic ML techniques, MEP and GEP, to evaluate the CS of waste marble and glass-based SCC. The most accurate predictor was determined through a comparison of the precision of two genetic-based ML approaches. As indicated by statistical measures, specifically the R 2 value, the MEP model demonstrated improved reliability in comparison to the GEP model, as well as the variations between observed and model-predicted results. However, the outcomes derived from the GEP model also exhibited an acceptable degree of concordance with the empirical data. Previous research has reported that the MEP approach demonstrates superior accuracy when predicting various attributes compared to GEP [61,62,63,64]. Table 6 provides a comparison of the current study with the previous researchers that have employed ML algorithms. The efficiency of an ML technique is significantly impacted by the number of input variables and the database utilized to implement the methods [65]. This presents difficulties in identifying and suggesting the most appropriate ML approach for forecasting results across various research areas. The implementation of ML studies applications in the construction sector has the capacity to improve the efficacy of devising economical methods that facilitate expeditious assessment of material properties [66].
ML assessment of the current study’s results in the context of relevant prior research
| Ref. | Material examined | Investigated mechanical properties | ML techniques applied | The model with the best result |
|---|---|---|---|---|
| Present study | Self-compacting concrete | CS | GEP and MEP | MEP |
| [64] | Metakaolin-based concrete | CS | GEP and MEP | MEP |
| [61] | Rice husk ash concrete | CS | GEP and MEP | MEP |
| [67] | Chalky and clayey soft limestone | CS and tensile strength (TS) | Linear genetic programming (LGP), GEP, and MEP | LGP and MEP |
| [68] | Fly ash-based mortar | CS | ANN, NLR, MEP, and M5P-tree | MEP |
| [62] | Plastic sand paver blocks | CS | GEP and MEP | MEP |
| [69] | Marble cement | CS | GEP and MEP | MEP |
The MEP and GEP models developed in this study provide advantages due to their ability to operate within a predefined set of eight independent variables (water-binder ratio, cement, marble powder, glass powder, water, slump flow, density, and curing time). This attribute ensures that the forecasts produced are customized for the use of waste marble and glass as a replacement for cement in SCC. The dependability of the CS predictions produced by the models is established through their utilization of identical unit measurements and adherence to a standardized testing procedure. The ML models’ prescribed arithmetic equations are of paramount importance in comprehending the proportions of the mix design and the influence of individual independent variables. However, if more variables are added to the model equations further than the mentioned eight variables, it may impair the applicability of the ML prediction models [70]. The created models were specifically developed to handle a specific set of input variables and may not function well when confronted with new input variables. The prediction models may also produce inaccurate findings if changes or discrepancies in the input variable units are made. To ensure the models are considered effective, it is crucial that the input parameter models’ units be the same as in this study.
ML prediction models offer a wide range of practical uses in the construction sector [71]. For example, predicting material characteristics, optimizing energy efficiency, assessing risks, and performing foretelling maintenance. Nevertheless, it is crucial to recognize that ML models possess specific constraints that must be considered [72]. These constraints encompass obstacles concerning the availability of data, the degree of accuracy demonstrated by the models, the required exertion, and the necessity for human involvement. The development of standardized rules for database collection and distribution in the field, the incorporation of sustainability considerations, the Internet of Things, and the execution of comprehensible AI techniques may be the subject of future research. The aforementioned constraints are being addressed in an effort to improve the performance of ML-based solutions. These advancements are capable of producing more precise and current information, optimizing operational efficiency, improving interpretability, promoting transparency, and facilitating informed decision-making. As a result, they possess the capacity to mitigate project delays and improve safety, thus making a significant contribution to the overall sustainability of the construction industry.
7 Conclusions
The experimental dataset, which consisted of eight independent variables, was utilized to analyze the CS of SCC containing waste marble and glass powder using GEP and MEP in the present study. In order to obtain the most accurate predictions, hyperparameter optimization of GEP and MEP was implemented. Statistical checks were implemented to evaluate the constructed models, and the disparity between the predicted findings of the target and the model was assessed. The primary findings of the investigation are as follows:
Both GEP and MEP models were effective in estimating the CS of SCC, with MEP performing at a higher accuracy. The R 2 of 0.94 was noted for MEP and 0.90 for GEP, demonstrating their predictability performance.
It was observed from the analysis of the difference between the actual and model predicted results that the average error for the MEP was 1.21 MPa, while the same for the GEP was 1.72 MPa in estimating the CS of SCC. These error values further confirmed the predictability of both models, with MEP yielding the least deviation from the targets.
The other statistical checks, like MAE, RMSE, and RMSLE, also validated the model’s predictability performance. GEP exhibited an MAE of 1.723 MPa, while MEP achieved a lower MAE of 1.217 MPa, indicating enhanced precision in MEP’s predictions.
Sensitivity analysis revealed curing time as the most influential factor, followed by slump flow, cement, density, glass powder, water, water-binder ratio, and marble powder, affecting the models’ predictions.
A SHAP analysis revealed that curing time, cement quantity, and density positively influenced the CS of SCC. Whereas glass and marble powder may yield the optimum CS at 40 kg·m−3 in the SCC mixture.
The current study advances concrete technology toward sustainability and efficiency by optimizing mix designs using GEP and MEP algorithms to forecast the CS of SCC with waste marble and glass powder. These findings offer environmentally friendly and cost-effective alternatives for the construction sector. The mathematical equations from the MEP and GEP models are crucial for understanding mix design proportions and the impact of each variable. However, this study was limited to eight input parameters, and other factors like curing regime, manufacturing procedure, and environment may influence strength characteristics. Future research should incorporate these variables into a comprehensive database for more accurate strength analysis models. Additionally, employing advanced ML techniques for SCC can revolutionize concrete design, promoting resilient and sustainable infrastructure.
Acknowledgments
The authors acknowledge the Deanship of Scientific Research, Vice Presidency for Graduate Studies and Scientific Research, King Faisal University, Saudi Arabia (Grant No. KFU241310). The authors extend their appreciation for the financial support that made this study possible.
-
Funding information: This work was supported by the Deanship of Scientific Research, Vice Presidency for Graduate Studies and Scientific Research, King Faisal University, Saudi Arabia (Grant No. KFU241310).
-
Author contributions: Q.T.G.: conceptualization, methodology, formal analysis, visualization, writing-original draft. Z.L.T.: data acquisition, supervision, validation, resources, writing, reviewing, and editing. M.N.A.: funding acquisition, investigation, supervision, project administration, writing, reviewing, and editing. B.I.: software, validation, methodology, writing-original draft, reviewing, and editing. M.T.Q.: investigation, resources, writing, reviewing, and editing. K.K.: formal analysis, methodology, writing, reviewing, and editing. All authors have accepted responsibility for the entire content of this manuscript and approved its submission.
-
Conflict of interest: The authors state no conflict of interest.
-
Data availability statement: The datasets generated and/or analyzed during the current study are available as supplementary data to this article.
References
[1] Ahmad, J., Z. Zhou, and A. F. Deifalla. Self-compacting concrete with partially substitution of waste marble: A review. International Journal of Concrete Structures and Materials, Vol. 17, 2023, id. 25.Suche in Google Scholar
[2] Ashish, D. K. and S. K. Verma. Determination of optimum mixture design method for self-compacting concrete: Validation of method with experimental results. Construction and Building Materials, Vol. 217, 2019, pp. 664–678.Suche in Google Scholar
[3] Nehdi, M., M. Pardhan, and S. Koshowski. Durability of self-consolidating concrete incorporating high-volume replacement composite cements. Cement and concrete research, Vol. 34, 2004, pp. 2103–2112.Suche in Google Scholar
[4] Ashish, D. K. and S. K. Verma. An overview on mixture design of self‐compacting concrete. Structural Concrete, Vol. 20, 2019, pp. 371–395.Suche in Google Scholar
[5] Zrar, Y. J., P. I. Abdulrahman, A. F. H. Sherwani, K. H. Younis, and A. S. Mohammed. Sustainable innovation in self-compacted concrete: Integrating by-products and waste rubber for green construction practices. Structures, Vol. 62, 2024, id. 106234.Suche in Google Scholar
[6] Topçu, İ. B., T. Bilir, and T. Uygunoğlu. Effect of waste marble dust content as filler on properties of self-compacting concrete. Construction and Building Materials, Vol. 23, 2009, pp. 1947–1953.Suche in Google Scholar
[7] Boukendakdji, O., E.-H. Kadri, and S. Kenai. Effects of granulated blast furnace slag and superplasticizer type on the fresh properties and compressive strength of self-compacting concrete. Cement and Concrete Composites, Vol. 34, 2012, pp. 583–590.Suche in Google Scholar
[8] Assié, S., G. Escadeillas, and V. Waller. Estimates of self-compacting concrete ‘potential’ durability. Construction and Building Materials, Vol. 21, 2007, pp. 1909–1917.Suche in Google Scholar
[9] Inqiad, W. B., M. S. Siddique, S. S. Alarifi, M. J. Butt, T. Najeh, and Y. Gamil. Comparative analysis of various machine learning algorithms to predict 28-day compressive strength of Self-compacting concrete. Heliyon, Vol. 9, 2023, id. e22036.Suche in Google Scholar
[10] Ahmad, J., R. Martínez-García, J. de-Prado-Gil, K. Irshad, M. A. El-Shorbagy, R. Fediuk, et al. Concrete with partial substitution of waste glass and recycled concrete aggregate. Materials, Vol. 15, 2022, id. 430.Suche in Google Scholar
[11] Khan, K., W. Ahmad, M. N. Amin, A. Ahmad, S. Nazar, A. A. Alabdullah, et al. Exploring the Use of Waste Marble Powder in Concrete and Predicting Its Strength with Different Advanced Algorithms. Materials, Vol. 15, 2022, id. 4108.Suche in Google Scholar
[12] Smith, R. A., J. R. Kersey, and P. J. Griffiths. The Construction Industry Mass Balance: resource use, wastes and emissions. Viridis Report VR4, 2002.Suche in Google Scholar
[13] Zhang, T., Y.-L. Yang, and S.-Y. Liu. Application of biomass by-product lignin stabilized soils as sustainable Geomaterials: A review. Science of The Total Environment, Vol. 728, 2020, id. 138830.Suche in Google Scholar
[14] Amin, S. K., M. E. Allam, G. L. Garas, and H. Ezz. A study of the chemical effect of marble and granite slurry on green mortar compressive strength. Bulletin of the National Research Centre, Vol. 44, 2020, pp. 1–5.Suche in Google Scholar
[15] Ahmad, W., A. Ahmad, K. A. Ostrowski, F. Aslam, and P. Joyklad. A scientometric review of waste material utilization in concrete for sustainable construction. Case Studies in Construction Materials, Vol. 15, 2021, id. e00683.Suche in Google Scholar
[16] Aruntaş, H. Y., M. Gürü, M. Dayı, and İ. Tekin. Utilization of waste marble dust as an additive in cement production. Materials & Design, Vol. 31, 2010, pp. 4039–4042.Suche in Google Scholar
[17] Ashish, D. K. Feasibility of waste marble powder in concrete as partial substitution of cement and sand amalgam for sustainable growth. Journal of Building Engineering, Vol. 15, 2018, pp. 236–242.Suche in Google Scholar
[18] Ashish, D. K. Concrete made with waste marble powder and supplementary cementitious material for sustainable development. Journal of Cleaner Production, Vol. 211, 2019, pp. 716–729.Suche in Google Scholar
[19] Jiang, X., R. Xiao, Y. Bai, B. Huang, and Y. Ma. Influence of waste glass powder as a supplementary cementitious material (SCM) on physical and mechanical properties of cement paste under high temperatures. Journal of Cleaner Production, Vol. 340, 2022, id. 130778.Suche in Google Scholar
[20] Özkılıç, Y. O., Ö. Zeybek, A. Bahrami, A. İ. Çelik, M. A. Othuman Mydin, M. Karalar, et al. Optimum usage of waste marble powder to reduce use of cement toward eco-friendly concrete. Journal of Materials Research and Technology, Vol. 25, 2023, pp. 4799–4819.Suche in Google Scholar
[21] Qin, D., Y. Hu, and X. Li. Waste glass utilization in cement-based materials for sustainable construction: A review. Crystals, Vol. 11, 2021, id. 710.Suche in Google Scholar
[22] Prakash, B., T. J. Saravanan, K. I. S. A. Kabeer, and K. Bisht. Exploring the potential of waste marble powder as a sustainable substitute to cement in cement-based composites: A review. Construction and Building Materials, Vol. 401, 2023, id. 132887.Suche in Google Scholar
[23] Ahmad, J. and Z. Zhou. Strength and durability properties of waste glass based self compacting concrete: A review. Silicon, Vol. 15, 2023, pp. 5013–5036.Suche in Google Scholar
[24] Wang, D., M. N. Amin, K. Khan, S. Nazar, Y. Gamil, and T. Najeh. Comparing the efficacy of GEP and MEP algorithms in predicting concrete strength incorporating waste eggshell and waste glass powder. Developments in the Built Environment, Vol. 17, 2024, id. 100361.Suche in Google Scholar
[25] de Sensale, G. R. Strength development of concrete with rice-husk ash. Cement and Concrete Composites, Vol. 28, 2006, pp. 158–160.Suche in Google Scholar
[26] Kakasor Ismael Jaf, D., P. Ismael Abdulrahman, A. Salih Mohammed, R. Kurda, S. M. A. Qaidi, and P. G. Asteris. Machine learning techniques and multi-scale models to evaluate the impact of silicon dioxide (SiO2) and calcium oxide (CaO) in fly ash on the compressive strength of green concrete. Construction and Building Materials, Vol. 400, 2023, id. 132604.Suche in Google Scholar
[27] Omer, B., D. K. I. Jaf, S. K. Malla, P. I. Abdulrahman, A. S. Mohammed, R. Kurda, et al. Exploring the potential of soft computing for predicting compressive strength and slump flow diameter in fly ash-modified self-compacting concrete. Archives of Civil and Mechanical Engineering, Vol. 24, 2024, pp. 1–22.Suche in Google Scholar
[28] Hariharan, A. R., A. S. Santhi, and G. Mohan Ganesh. Statistical model to predict the mechanical properties of binary and ternary blended concrete using regression analysis. International Journal of Civil Engineering, Vol. 13, 2015, pp. 331–340.Suche in Google Scholar
[29] Khademi, F., M. Akbari, and S. M. Jamal. Prediction of compressive strength of concrete by data-driven models. I-Manager’s J Civ Eng, Vol. 5, 2015, pp. 16–23.Suche in Google Scholar
[30] Jalal, F. E., Y. Xu, M. Iqbal, M. F. Javed, and B. Jamhiri. Predictive modeling of swell-strength of expansive soils using artificial intelligence approaches: ANN, ANFIS and GEP. Journal of Environmental Management, Vol. 289, 2021, id. 112420.Suche in Google Scholar
[31] de-Prado-Gil, J., R. Martínez-García, P. Jagadesh, A. Juan-Valdés, M.-I. Gónzalez-Alonso, and C. Palencia. To determine the compressive strength of self-compacting recycled aggregate concrete using artificial neural network (ANN). Ain Shams Engineering Journal, Vol. 15, 2024, id. 102548.Suche in Google Scholar
[32] Wang, J., A. S. Mohammed, E. Macioszek, M. Ali, D. V. Ulrikh, and Q. Fang. A Novel Combination of PCA and Machine Learning Techniques to Select the Most Important Factors for Predicting Tunnel Construction Performance. Buildings, Vol. 12, 2022, id. 919.Suche in Google Scholar
[33] Liu, B., J. Shi, F. Zhou, S. Shen, Y. Ding, and J. Qin. Effects of steam curing regimes on the capillary water absorption of concrete: Prediction using multivariable regression models. Construction and Building Materials, Vol. 256, 2020, id. 119426.Suche in Google Scholar
[34] Nazar, S., J. Yang, W. Ahmad, M. F. Javed, H. Alabduljabbar, and A. F. Deifalla. Development of the new prediction models for the compressive strength of nanomodified concrete using novel machine learning techniques. Buildings, Vol. 12, 2022, id. 2160.Suche in Google Scholar
[35] Alkadhim, H. A., M. N. Amin, W. Ahmad, K. Khan, S. Nazar, M. I. Faraz, et al. Evaluating the Strength and Impact of Raw Ingredients of Cement Mortar Incorporating Waste Glass Powder Using Machine Learning and SHapley Additive ExPlanations (SHAP) Methods. Materials, Vol. 15, 2022, id. 7344.Suche in Google Scholar
[36] Khan, K., A. Ahmad, M. N. Amin, W. Ahmad, S. Nazar, and A. M. A. Arab. Comparative study of experimental and modeling of fly ash-based concrete. Materials, Vol. 15, 2022, pp. 3762–3762.Suche in Google Scholar
[37] Abdalla, A. and A. Salih. Implementation of multi-expression programming (MEP), artificial neural network (ANN), and M5P-tree to forecast the compression strength cement-based mortar modified by calcium hydroxide at different mix proportions and curing ages. Innovative Infrastructure Solutions, Vol. 7, 2022, id. 153.Suche in Google Scholar
[38] Young, B. A., A. Hall, L. Pilon, P. Gupta, and G. Sant. Can the compressive strength of concrete be estimated from knowledge of the mixture proportions?: New insights from statistical analysis and machine learning methods. Cement and concrete research, Vol. 115, 2019, pp. 379–388.Suche in Google Scholar
[39] Behnood, A., V. Behnood, M. M. Gharehveran, and K. E. Alyamac. Prediction of the compressive strength of normal and high-performance concretes using M5P model tree algorithm. Construction and Building Materials, Vol. 142, 2017, pp. 199–207.Suche in Google Scholar
[40] Amin, M. N., M. N. Al-Hashem, A. Ahmad, K. Khan, W. Ahmad, M. G. Qadir, et al. Application of soft-computing methods to evaluate the compressive strength of self-compacting concrete. Materials, Vol. 15, 2022, id. 7800.Suche in Google Scholar
[41] Jagadesh, P., J. de Prado-Gil, N. Silva-Monteiro, and R. Martínez-García. Assessing the compressive strength of self-compacting concrete with recycled aggregates from mix ratio using machine learning approach. Journal of Materials Research and Technology, Vol. 24, 2023, pp. 1483–1498.Suche in Google Scholar
[42] Aidjouli, Y., C. Belebchouche, A. Hammoudi, E.-H. Kadri, S. Zaouai, and S. Czarnecki. Modeling the properties of sustainable self-compacting concrete containing marble and glass powder wastes using response surface methodology. Sustainability, Vol. 16, 2024, id. 1972.Suche in Google Scholar
[43] Yu, J., G. Li, and C. K. Y. Leung. Hydration and physical characteristics of ultrahigh-volume fly ash-cement systems with low water/binder ratio. Construction and Building Materials, Vol. 161, 2018, pp. 509–518.Suche in Google Scholar
[44] Chen, Z. Application of machine learning boosting and bagging methods to predict compressive and flexural strength of marble cement mortar. Materials Today Communications, Vol. 39, 2024, id. 108600.Suche in Google Scholar
[45] Kumar, A., H. C. Arora, M. A. Mohammed, K. Kumar, and J. Nedoma. An optimized neuro-bee algorithm approach to predict the FRP-concrete bond strength of RC beams. IEEE Access, Vol. 10, 2021, pp. 3790–3806.Suche in Google Scholar
[46] Koza, J. R. Genetic programming as a means for programming computers by natural selection. Statistics and Computing, Vol. 4, 1994, pp. 87–112.Suche in Google Scholar
[47] Khan, M. A., A. Zafar, A. Akbar, M. F. Javed, and A. Mosavi. Application of Gene Expression Programming (GEP) for the prediction of compressive strength of geopolymer concrete. Materials, Vol. 14, 2021, id. 1106.Suche in Google Scholar
[48] Ferreira, C. Gene expression programming: mathematical modeling by an artificial intelligence, Vol. 21, Springer, Berlin, Germany, 2006.Suche in Google Scholar
[49] Sarıdemir, M. Genetic programming approach for prediction of compressive strength of concretes containing rice husk ash. Construction and Building Materials, Vol. 24, 2010, pp. 1911–1919.Suche in Google Scholar
[50] Shah, M. I., M. F. Javed, and T. Abunama. Proposed formulation of surface water quality and modelling using gene expression, machine learning, and regression techniques. Environmental Science and Pollution Research, Vol. 28, 2021, pp. 13202–13220.Suche in Google Scholar
[51] Khan, M. A., S. A. Memon, F. Farooq, M. F. Javed, F. Aslam, and R. Alyousef. Compressive strength of fly-ash-based geopolymer concrete by gene expression programming and random forest. Advances in Civil Engineering, Vol. 2021, 2021, pp. 1–17.Suche in Google Scholar
[52] Chu, H.-H., M. A. Khan, M. Javed, A. Zafar, M. I. Khan, H. Alabduljabbar, et al. Sustainable use of fly-ash: Use of gene-expression programming (GEP) and multi-expression programming (MEP) for forecasting the compressive strength geopolymer concrete. Ain Shams Engineering Journal, Vol. 12, 2021, pp. 3603–3617.Suche in Google Scholar
[53] Oltean, M. Multi Expression Programming for solving classification problems. arXiv preprint arXiv:2203.13202, 2022.Suche in Google Scholar
[54] Gandomi, A. H., A. Faramarzifar, P. G. Rezaee, A. Asghari, and S. Talatahari. New design equations for elastic modulus of concrete using multi expression programming. Journal of Civil Engineering and Management, Vol. 21, 2015, pp. 761–774.Suche in Google Scholar
[55] Oltean, M. and C. Grosan. A comparison of several linear genetic programming techniques. Complex Systems, Vol. 14, 2003, pp. 285–314.Suche in Google Scholar
[56] Alaskar, A., G. Alfalah, F. Althoey, M. A. Abuhussain, M. F. Javed, A. F. Deifalla, et al. Comparative study of genetic programming-based algorithms for predicting the compressive strength of concrete at elevated temperature. Case Studies in Construction Materials, Vol. 18, 2023, id. e02199.Suche in Google Scholar
[57] Mousavi, S. M., A. H. Alavi, A. H. Gandomi, M. Arab Esmaeili, and M. Gandomi. A data mining approach to compressive strength of CFRP-confined concrete cylinders. Structural Engineering & Mechanics, Vol. 36, 2010, id. 759.Suche in Google Scholar
[58] Mosavi, A. and M. Edalatifar. A hybrid neuro-fuzzy algorithm for prediction of reference evapotranspiration, In Recent Advances in Technology Research and Education: Proceedings of the 17th International Conference on Global Research and Education Inter-Academia, Springer International Publishing, 2019, pp. 235–243.Suche in Google Scholar
[59] Bemani, A., A. Baghban, and A. Mosavi. Estimating CO2-Brine diffusivity using hybrid models of ANFIS and evolutionary algorithms. Engineering Applications of Computational Fluid Mechanics, Vol. 14, 2020, pp. 818–834.Suche in Google Scholar
[60] Ahmad, A., K. A. Ostrowski, M. Maślak, F. Farooq, I. Mehmood, and A. Nafees. Comparative study of supervised machine learning algorithms for predicting the compressive strength of concrete at high temperature. Materials, Vol. 14, 2021, id. 4222.Suche in Google Scholar
[61] Amin, M. N., W. Ahmad, K. Khan, and A. F. Deifalla. Optimizing compressive strength prediction models for rice husk ash concrete with evolutionary machine intelligence techniques. Case Studies in Construction Materials, Vol. 18, 2023, id. e02102.Suche in Google Scholar
[62] Iftikhar, B., S. C. Alih, M. Vafaei, M. F. Javed, M. F. Rehman, S. S. Abdullaev, et al. Predicting compressive strength of eco-friendly plastic sand paver blocks using gene expression and artificial intelligence programming. Scientific Reports, Vol. 13, 2023, id. 12149.Suche in Google Scholar
[63] Zheng, X., Y. Xie, X. Yang, M. N. Amin, S. Nazar, S. A. Khan, et al. A data-driven approach to predict the compressive strength of alkali-activated materials and correlation of influencing parameters using SHapley Additive exPlanations (SHAP) analysis. Journal of Materials Research and Technology, Vol. 25, 2023, pp. 4074–4093.Suche in Google Scholar
[64] Iftikhar Faraz, M., S. Ul Arifeen, M. Nasir Amin, A. Nafees, F. Althoey, and A. Niaz. A comprehensive GEP and MEP analysis of a cement-based concrete containing metakaolin. Structures, Vol. 53, 2023, pp. 937–948.Suche in Google Scholar
[65] de-Prado-Gil, J., C. Palencia, P. Jagadesh, and R. Martínez-García. A study on the prediction of compressive strength of self-compacting recycled aggregate concrete utilizing novel computational approaches. Materials, Vol. 15, 2022, id. 5232.Suche in Google Scholar
[66] de-Prado-Gil, J., C. Palencia, P. Jagadesh, and R. Martínez-García. A comparison of machine learning tools that model the splitting tensile strength of self-compacting recycled aggregate concrete. Materials, Vol. 15, 2022, id. 4164.Suche in Google Scholar
[67] Baykasoğlu, A., H. Güllü, H. Çanakçı, and L. Özbakır. Prediction of compressive and tensile strength of limestone via genetic programming. Expert Systems with Applications, Vol. 35, 2008, pp. 111–123.Suche in Google Scholar
[68] Abdalla, A. and A. Salih Mohammed. Surrogate models to predict the long-term compressive strength of cement-based mortar modified with fly ash. Archives of Computational Methods in Engineering, Vol. 29, 2022, pp. 4187–4212.Suche in Google Scholar
[69] Tian, Q., Y. Lu, J. Zhou, S. Song, L. Yang, T. Cheng, et al. Compressive strength of waste-derived cementitious composites using machine learning. Reviews on Advanced Materials Science, Vol. 63, 2024, id. 20240008.Suche in Google Scholar
[70] Chen, Z., B. Iftikhar, A. Ahmad, Y. Dodo, M. A. Abuhussain, F. Althoey, et al. Strength evaluation of eco-friendly waste-derived self-compacting concrete via interpretable genetic-based machine learning models. Materials Today Communications, Vol. 37, 2023, id. 107356.Suche in Google Scholar
[71] Iftikhar, B., S. C. Alih, M. Vafaei, L. Alkhattabi, F. Althoey, M. Ali, et al. Sustainable use of plastic waste in plastic sand paver blocks: An experimental and modelling-based study. Structures, Vol. 62, 2024, id. 106285.Suche in Google Scholar
[72] Ibrahim, A. K., H. Y. Dhahir, A. S. Mohammed, H. A. Omar, and A. H. Sedo. The effectiveness of surrogate models in predicting the long-term behavior of varying compressive strength ranges of recycled concrete aggregate for a variety of shapes and sizes of specimens. Archives of Civil and Mechanical Engineering, Vol. 23, 2023, id. 61.Suche in Google Scholar
© 2024 the author(s), published by De Gruyter
This work is licensed under the Creative Commons Attribution 4.0 International License.
Artikel in diesem Heft
- Review Articles
- Effect of superplasticizer in geopolymer and alkali-activated cement mortar/concrete: A review
- Experimenting the influence of corncob ash on the mechanical strength of slag-based geopolymer concrete
- Powder metallurgy processing of high entropy alloys: Bibliometric analysis and systematic review
- Exploring the potential of agricultural waste as an additive in ultra-high-performance concrete for sustainable construction: A comprehensive review
- A review on partial substitution of nanosilica in concrete
- Foam concrete for lightweight construction applications: A comprehensive review of the research development and material characteristics
- Modification of PEEK for implants: Strategies to improve mechanical, antibacterial, and osteogenic properties
- Interfacing the IoT in composite manufacturing: An overview
- Advances in processing and ablation properties of carbon fiber reinforced ultra-high temperature ceramic composites
- Advancing auxetic materials: Emerging development and innovative applications
- Revolutionizing energy harvesting: A comprehensive review of thermoelectric devices
- Exploring polyetheretherketone in dental implants and abutments: A focus on biomechanics and finite element methods
- Smart technologies and textiles and their potential use and application in the care and support of elderly individuals: A systematic review
- Reinforcement mechanisms and current research status of silicon carbide whisker-reinforced composites: A comprehensive review
- Innovative eco-friendly bio-composites: A comprehensive review of the fabrication, characterization, and applications
- Review on geopolymer concrete incorporating Alccofine-1203
- Advancements in surface treatments for aluminum alloys in sports equipment
- Ionic liquid-modified carbon-based fillers and their polymer composites – A Raman spectroscopy analysis
- Emerging boron nitride nanosheets: A review on synthesis, corrosion resistance coatings, and their impacts on the environment and health
- Mechanism, models, and influence of heterogeneous factors of the microarc oxidation process: A comprehensive review
- Synthesizing sustainable construction paradigms: A comprehensive review and bibliometric analysis of granite waste powder utilization and moisture correction in concrete
- 10.1515/rams-2025-0086
- Research Articles
- Coverage and reliability improvement of copper metallization layer in through hole at BGA area during load board manufacture
- Study on dynamic response of cushion layer-reinforced concrete slab under rockfall impact based on smoothed particle hydrodynamics and finite-element method coupling
- Study on the mechanical properties and microstructure of recycled brick aggregate concrete with waste fiber
- Multiscale characterization of the UV aging resistance and mechanism of light stabilizer-modified asphalt
- Characterization of sandwich materials – Nomex-Aramid carbon fiber performances under mechanical loadings: Nonlinear FE and convergence studies
- Effect of grain boundary segregation and oxygen vacancy annihilation on aging resistance of cobalt oxide-doped 3Y-TZP ceramics for biomedical applications
- Mechanical damage mechanism investigation on CFRP strengthened recycled red brick concrete
- Finite element analysis of deterioration of axial compression behavior of corroded steel-reinforced concrete middle-length columns
- Grinding force model for ultrasonic assisted grinding of γ-TiAl intermetallic compounds and experimental validation
- Enhancement of hardness and wear strength of pure Cu and Cu–TiO2 composites via a friction stir process while maintaining electrical resistivity
- Effect of sand–precursor ratio on mechanical properties and durability of geopolymer mortar with manufactured sand
- Research on the strength prediction for pervious concrete based on design porosity and water-to-cement ratio
- Development of a new damping ratio prediction model for recycled aggregate concrete: Incorporating modified admixtures and carbonation effects
- Exploring the viability of AI-aided genetic algorithms in estimating the crack repair rate of self-healing concrete
- Modification of methacrylate bone cement with eugenol – A new material with antibacterial properties
- Numerical investigations on constitutive model parameters of HRB400 and HTRB600 steel bars based on tensile and fatigue tests
- Research progress on Fe3+-activated near-infrared phosphor
- Discrete element simulation study on effects of grain preferred orientation on micro-cracking and macro-mechanical behavior of crystalline rocks
- Ultrasonic resonance evaluation method for deep interfacial debonding defects of multilayer adhesive bonded materials
- Effect of impurity components in titanium gypsum on the setting time and mechanical properties of gypsum-slag cementitious materials
- Bending energy absorption performance of composite fender piles with different winding angles
- Theoretical study of the effect of orientations and fibre volume on the thermal insulation capability of reinforced polymer composites
- Synthesis and characterization of a novel ternary magnetic composite for the enhanced adsorption capacity to remove organic dyes
- Couple effects of multi-impact damage and CAI capability on NCF composites
- Mechanical testing and engineering applicability analysis of SAP concrete used in buffer layer design for tunnels in active fault zones
- Investigating the rheological characteristics of alkali-activated concrete using contemporary artificial intelligence approaches
- Integrating micro- and nanowaste glass with waste foundry sand in ultra-high-performance concrete to enhance material performance and sustainability
- Effect of water immersion on shear strength of epoxy adhesive filled with graphene nanoplatelets
- Impact of carbon content on the phase structure and mechanical properties of TiBCN coatings via direct current magnetron sputtering
- Investigating the anti-aging properties of asphalt modified with polyphosphoric acid and tire pyrolysis oil
- Biomedical and therapeutic potential of marine-derived Pseudomonas sp. strain AHG22 exopolysaccharide: A novel bioactive microbial metabolite
- Effect of basalt fiber length on the behavior of natural hydraulic lime-based mortars
- Optimizing the performance of TPCB/SCA composite-modified asphalt using improved response surface methodology
- Compressive strength of waste-derived cementitious composites using machine learning
- Melting phenomenon of thermally stratified MHD Powell–Eyring nanofluid with variable porosity past a stretching Riga plate
- Development and characterization of a coaxial strain-sensing cable integrated steel strand for wide-range stress monitoring
- Compressive and tensile strength estimation of sustainable geopolymer concrete using contemporary boosting ensemble techniques
- Customized 3D printed porous titanium scaffolds with nanotubes loading antibacterial drugs for bone tissue engineering
- Facile design of PTFE-kaolin-based ternary nanocomposite as a hydrophobic and high corrosion-barrier coating
- Effects of C and heat treatment on microstructure, mechanical, and tribo-corrosion properties of VAlTiMoSi high-entropy alloy coating
- Study on the damage mechanism and evolution model of preloaded sandstone subjected to freezing–thawing action based on the NMR technology
- Promoting low carbon construction using alkali-activated materials: A modeling study for strength prediction and feature interaction
- Entropy generation analysis of MHD convection flow of hybrid nanofluid in a wavy enclosure with heat generation and thermal radiation
- Friction stir welding of dissimilar Al–Mg alloys for aerospace applications: Prospects and future potential
- Fe nanoparticle-functionalized ordered mesoporous carbon with tailored mesostructures and their applications in magnetic removal of Ag(i)
- Study on physical and mechanical properties of complex-phase conductive fiber cementitious materials
- Evaluating the strength loss and the effectiveness of glass and eggshell powder for cement mortar under acidic conditions
- Effect of fly ash on properties and hydration of calcium sulphoaluminate cement-based materials with high water content
- Analyzing the efficacy of waste marble and glass powder for the compressive strength of self-compacting concrete using machine learning strategies
- Experimental study on municipal solid waste incineration ash micro-powder as concrete admixture
- Parameter optimization for ultrasonic-assisted grinding of γ-TiAl intermetallics: A gray relational analysis approach with surface integrity evaluation
- Producing sustainable binding materials using marble waste blended with fly ash and rice husk ash for building materials
- Effect of steam curing system on compressive strength of recycled aggregate concrete
- A sawtooth constitutive model describing strain hardening and multiple cracking of ECC under uniaxial tension
- Predicting mechanical properties of sustainable green concrete using novel machine learning: Stacking and gene expression programming
- Toward sustainability: Integrating experimental study and data-driven modeling for eco-friendly paver blocks containing plastic waste
- A numerical analysis of the rotational flow of a hybrid nanofluid past a unidirectional extending surface with velocity and thermal slip conditions
- A magnetohydrodynamic flow of a water-based hybrid nanofluid past a convectively heated rotating disk surface: A passive control of nanoparticles
- Prediction of flexural strength of concrete with eggshell and glass powders: Advanced cutting-edge approach for sustainable materials
- Efficacy of sustainable cementitious materials on concrete porosity for enhancing the durability of building materials
- Phase and microstructural characterization of swat soapstone (Mg3Si4O10(OH)2)
- Effect of waste crab shell powder on matrix asphalt
- Improving effect and mechanism on service performance of asphalt binder modified by PW polymer
- Influence of pH on the synthesis of carbon spheres and the application of carbon sphere-based solid catalysts in esterification
- Experimenting the compressive performance of low-carbon alkali-activated materials using advanced modeling techniques
- Thermogravimetric (TG/DTG) characterization of cold-pressed oil blends and Saccharomyces cerevisiae-based microcapsules obtained with them
- Investigation of temperature effect on thermo-mechanical property of carbon fiber/PEEK composites
- Computational approaches for structural analysis of wood specimens
- Integrated structure–function design of 3D-printed porous polydimethylsiloxane for superhydrophobic engineering
- Exploring the impact of seashell powder and nano-silica on ultra-high-performance self-curing concrete: Insights into mechanical strength, durability, and high-temperature resilience
- Axial compression damage constitutive model and damage characteristics of fly ash/silica fume modified magnesium phosphate cement after being treated at different temperatures
- Integrating testing and modeling methods to examine the feasibility of blended waste materials for the compressive strength of rubberized mortar
- Special Issue on 3D and 4D Printing of Advanced Functional Materials - Part II
- Energy absorption of gradient triply periodic minimal surface structure manufactured by stereolithography
- Marine polymers in tissue bioprinting: Current achievements and challenges
- Quick insight into the dynamic dimensions of 4D printing in polymeric composite mechanics
- Recent advances in 4D printing of hydrogels
- Mechanically sustainable and primary recycled thermo-responsive ABS–PLA polymer composites for 4D printing applications: Fabrication and studies
- Special Issue on Materials and Technologies for Low-carbon Biomass Processing and Upgrading
- Low-carbon embodied alkali-activated materials for sustainable construction: A comparative study of single and ensemble learners
- Study on bending performance of prefabricated glulam-cross laminated timber composite floor
- Special Issue on Recent Advancement in Low-carbon Cement-based Materials - Part I
- Supplementary cementitious materials-based concrete porosity estimation using modeling approaches: A comparative study of GEP and MEP
- Modeling the strength parameters of agro waste-derived geopolymer concrete using advanced machine intelligence techniques
- Promoting the sustainable construction: A scientometric review on the utilization of waste glass in concrete
- Incorporating geranium plant waste into ultra-high performance concrete prepared with crumb rubber as fine aggregate in the presence of polypropylene fibers
- Investigation of nano-basic oxygen furnace slag and nano-banded iron formation on properties of high-performance geopolymer concrete
- Effect of incorporating ultrafine palm oil fuel ash on the resistance to corrosion of steel bars embedded in high-strength green concrete
- Influence of nanomaterials on properties and durability of ultra-high-performance geopolymer concrete
- Influence of palm oil ash and palm oil clinker on the properties of lightweight concrete