Bayesian estimation of equipment reliability with normal-type life distribution based on multiple batch tests
-
Haobang Liu
 ,
Minggui Li
,
Minggui Li

Abstract
The test of new equipment is usually carried out in multiple batches according to the task schedule and test results. Constrained by the test environment, cost, and other factors, the amount of reliability test data in each batch is relatively limited, which brings difficulties to the accurate equipment reliability estimation work. For the reliability simulation tests conducted before each batch tests, it is particularly important to make full use of each batch tests information and simulation tests information to estimate the reliability of the equipment for small sample tests. This study takes the common normal-type life distribution equipment as the research object, and selects the normal-inverse gamma distribution as the equipment life parameters prior distribution based on the Bayesian method. Combined with the system contribution, the fusion weights of each batch tests information are determined and all the batch tests information is fused. Finally, the estimation of equipment reliability based on multiple batch tests is completed. The research results show that this method can integrate the information of each batch test and simulation test, overcome the problem of insufficient information of single batch tests, and provide an effective analytical tool for equipment reliability estimation.
1 Introduction
New equipment may have reliability design defects in the initial stage of development and design, and most of these defects can be exposed through strict reliability test programs. The equipment in the initial batch tests is difficult to meet the established reliability target, so it needs to undergo reliability improvement in multiple batch tests, so as to ultimately bring reliability improvement to the equipment. The multiple batches reliability test programs are a set of carefully designed programs and procedures for exposing the reliability problems and failures through testing, combined with corrective actions and design improvements to improve equipment reliability throughout the design and test phases. The existing estimation of equipment reliability is mainly studied from the perspective of single batch tests, only the reliability test data of the latest batch is utilized, with less use of previous batch test information [1,2,3]. Multiple batch tests consist of several different batch tests, which are combinations of single batch tests. The same batch tests contain several equipment with the same reliability, and the equipment reliability of different batch tests is different. Therefore, it is neither possible to divide single batch tests into multiple batches nor to aggregate multiple batch tests into single batch. Fusion of batch tests data is essential to address the problem of insufficient information for reliability estimation of single batch tests. For the small sample tests of equipment reliability, the reliability estimation results obtained by using only single batch tests information are more risky. Therefore, there is an urgent need to find an equipment reliability estimation method that can integrate multiple batch tests information.
According to engineering practice, it is known that different equipment will have different life distribution forms due to different failure mechanisms. The normal distribution is a relatively common distribution of equipment life, e.g., most mechanical equipment subjected to cyclic loading, such as fatigue testing, will exhibit a normal distribution of service life. In addition, the normal distribution has better theoretical properties and computational convenience, and its probability density function and cumulative distribution function have relatively simple expressions. Compared with Weibull distribution and other distributions, normal distribution is more convenient for theoretical analysis and calculation. Partial lognormal distribution and Weibull distribution models can also be analyzed by approximating them with the normal distribution [4,5]. Considering the mathematical superiority of normal distribution model and its convenience in reliability analytical modeling, the study focuses on the reliability of equipment with normal-type life distribution.
Existing research on equipment reliability estimation has emerged with many advanced methods, including neural networks, big data analysis, Bayesian networks, Bayesian statistical inference, and other intelligent algorithms. Guo et al. [6] proposed a deep feature learning method that combines convolutional neural network-convolutional block attention module and transformer network as a parallel channel method to predict the remaining useful life of drilling pumps, which overcame the problem of insufficient measured data and effectively improved the prediction accuracy. Chen et al. [7] proposed an equipment reliability estimation method based on deep learning, which uses time series data for equipment reliability analysis. In view of the characteristics of small sample and high reliability test of aerospace valves, Wang et al. [8] integrated multiple sources information for reliability estimation. Guo et al. [9] integrated dynamic Bayesian network and XGBoost in an evaluation framework to assess the equipment operational reliability. Wang [10] proposed a reliability evaluation method for accelerated degradation test of electromechanical products. Jia et al. [11] evaluated the reliability of DC power distribution system in intelligent buildings based on big data analysis. Dai et al. [12] proposed a new reliability evaluation model based on wavelet kernel net, bi-directional gated recurrent unit, and wiener process model, which effectively solves the problem caused by the lack of measured data. Alex et al. [13] estimated the reliability of degraded all-terminal network equipment based on deep neural networks and Bayesian methods. Zahra et al. [14] estimated the reliability of Weibull distributed products based on intuitionistic fuzzy life data. Most of the existing studies only study the estimation of equipment reliability based on single batch tests, fail to consider the characteristics of multiple batch tests, and are unable to make full use of the information of each batch tests and simulation tests.
Fusion of each batch tests information is the key to equipment reliability estimation of multiple batch tests. Bayesian methods are capable of fusing multiple sources information in product research, and the results of the batch tests before each batch tests can be considered as prior information for Bayesian fusion, so as to achieve equipment reliability estimation of multiple batch tests. Noting that the information closer to the latest batch tests is more dominant in the fusion process, so the fusion weights of information from different batch tests need to be derived. The fusion weights reflect the contribution degree of different batch tests information to equipment reliability estimation. The system contribution is commonly used to measure the contribution degree of weapon equipment to combat capability in the combat system, and this theory is introduced to calculate the information fusion weights of different batch tests [15,16].
Combining the above analysis, this study takes the normal-type life distribution equipment as the research object, and studies the Bayesian estimation of equipment reliability based on multiple batch tests in the equipment design stage. First, the probability distribution function, unreliability function, reliability function, failure rate function, and sample estimates of reliability parameters for reliability tests of equipment with normal-type life distribution are given. Second, the process of Bayesian estimation of equipment reliability with normal-type life distribution is given, including three parts: prior information consistency test, Bayesian estimation of equipment reliability based on single batch tests, and Bayesian estimation of equipment reliability based on multiple batch tests. This part of the content selects the normal-inverse gamma distribution as the prior distribution of equipment life parameters, determines the prior distribution of parameters, and adopts the Bayesian method combined with the contribution degree of the system to integrate the information of each batch tests, and solves the problem. Finally, the results of Bayesian estimation of equipment reliability with normal-type life distribution based on multiple batch tests are derived through example analysis, and compared with the existing single batch test methods to highlight the superiority of the methodology of this study.
2 Reliability test of equipment with normal-type life distribution
The equipment life distribution mainly includes normal distribution, exponential distribution, Weibull distribution, lognormal distribution, etc. [17,18,19,20]. The normal distribution is more common and the model is simple, and partial lognormal distribution and Weibull distribution models can also be approximated by normal distribution. This research focuses on the reliability of equipment with normal life distribution, and the probability distribution of equipment life
where
The equipment in the process of use will experience wear and degradation, when the use of time exceeds its service life, the equipment will fail and loose its function. The process of equipment degradation is shown in Figure 1.

The process of equipment degradation.
The cumulative distribution function of equipment life distribution function is the equipment unreliability function, which can be expressed as follows:
The equipment reliability function can be expressed as follows:
The equipment failure rate function can be expressed as:
The key to reliability test research of equipment with normal life distribution is to determine the parameters
The error degree of parameter estimates
It can be seen that when the samples’ data volume
3 Bayesian estimation of equipment reliability with normal-type life distribution
3.1 Prior information consistency test
In order to use Bayesian method for information fusion, consistency test should first be carried out to ensure that all prior information and field data belong to the same whole [21,22,23]. The rank sum test, Mood test, and hypothesis test can all be tested by using sample data directly, but there are higher requirements for the amount of equipment reliability data [24,25,26]. Therefore, considering the limited amount of test sample data, Bayesian confidence interval method is adopted for testing, and the confidence interval of parameters is obtained by combining single information source with field data [27]. If the parameter points estimated value of the field data falls within the confidence interval under the conditional of prior information, the information source is considered compatible with the field data, i.e., it passes the consistency test.
The prior distribution
In the formula,
According to the field data
3.2 Bayesian estimation of equipment reliability based on single batch tests
3.2.1 Selection of prior distribution of equipment reliability parameters
Bayesian methods are commonly used in small sample tests evaluation research, which can be used for small sample data equipment reliability tests with high value and complex test environment [28,29,30]. The life parameters
where
By referring to the Bayesian conjugate prior distribution family, it is known that the conjugate prior distribution under the condition that the characteristic parameters
where
After obtaining the equipment reliability field test samples data
where
where
where
3.2.2 Determination of priori distribution hyperparameters of equipment reliability parameters
Determining the hyperparameters of the prior distribution is the key to calculating the posterior distribution. Let
Establish the likelihood function of inverse gamma distribution:
(13)Obtain the first-order partial derivative of the likelihood function:
(14)Let the first-order partial derivatives be 0 to establish the likelihood equations, and obtain the maximum likelihood estimates of the parameters.
Take the mean value of parameter samples
According to formula (8),
The value of parameter
3.2.3 Solution of posterior distribution of equipment reliability parameters based on single batch tests
The posterior distribution of parameters can be obtained through Bayesian formula calculation after obtaining the estimated value of the prior distribution hyperparameters. According to the principle of maximizing the probability of actual sampling occurrence, the maximum posterior estimation of parameters
Establish the kernel density function of the posterior distribution.
(20)Calculate the first-order partial derivatives of the kernel density function, and let the first-order partial derivatives be 0.
The maximum posterior estimates of parameters
Combining formulas (11) and (21)
The equipment reliability of the fused prior information can be estimated by bringing the Bayesian maximum posterior estimates
3.3 Bayesian estimation of equipment reliability based on multiple batch tests
3.3.1 Calculation of fusion weights based on system contribution
Different from single batch and overall equipment reliability test research, multiple batch tests need to consider the test information of each batch, so it needs to be analyzed gradually from the initial batch tests. The multiple batch tests information fusion process is as follows (Figure 2):

Multiple batch equipment reliability test information fusion process.
System contribution is commonly used to measure the contribution degree of weapon and equipment to the comprehensive combat capability of the combat system, and can also be used to calculate the contribution degree of evaluation elements to the system [33,34,35]. System contribution is introduced to measure the influence degree of multiple sources prior information on the equipment reliability estimation system, and the influence is mainly determined by its reliability. The reliability of equipment reliability data sources is evaluated by analyzing the information from different sources, and the system contribution is taken as the Bayesian fusion weight. The higher the reliability, the greater the system contribution assigned, i.e., the greater the fusion weight. The analysis process of system contribution fusion weights is as follows:
The equipment reliability information sources of the
In the formula,
In the process of determining the membership degree of equipment reliability parameters information by using intuitionistic fuzzy membership function method, it is noted that experts will hesitate when they consider whether the source of equipment reliability information is reliable. The intuitionistic index is introduced to represent the degree of expert hesitation, and the expression is as follows:
In determining the weight of prior information, half of the hesitation degree is used for correction, and the membership expression of information
The fusion weight of information
Based on the fusion weight
where
3.3.2 Estimation of equipment reliability parameters based on multiple batch tests
Equipment reliability estimation of the initial batch tests
The initial batch tests only contain the initial batch field tests reliability information
(29)The Bayesian maximum estimates
Equipment reliability estimation of the second batch tests.
After the initial batch tests, the physical properties of the equipment were improved and the second batch tests were conducted. The second batch tests need to take the initial batch tests information into account when estimating equipment reliability. Therefore, the second batch tests contain the information of the second batch field tests’ reliability information
(30)where
(31)Equipment reliability estimation of the
The
The prior distribution
Constraint relationship can be constructed as follows:
The constraint relationship indicates that the equipment reliability of the
4 Experimental analysis
In the test activity of the normal life distribution equipment, three batch tests were carried out successively, with five pieces of equipment tested in each batch tests. The field equipment reliability tests information and simulation tests information of these three batches were obtained. The field tests information
Equipment reliability tests information
| Field reliability tests information | Simulation tests information | |
|---|---|---|
|
|
|
|
| The initial batch tests |
|
|
| The second batch tests |
|
|
| The third batch tests |
|
|
According to the scoring rules of system contribution, five experts in the same field were invited to score the membership degree of the equipment reliability information
Prior information experts membership score
| Expert serial number | The
|
The
|
||
|---|---|---|---|---|
| Reliable membership degree
|
Unreliable membership degree
|
Reliable membership degree
|
Unreliable membership degree
|
|
| 1 | 0.7 | 0.3 | 0.6 | 0.2 |
| 2 | 0.7 | 0.3 | 0.9 | 0.1 |
| 3 | 0.8 | 0.2 | 0.7 | 0.3 |
| 4 | 0.6 | 0.4 | 0.8 | 0.17 |
| 5 | 0.7 | 0.3 | 0.7 | 0.1 |
According to the expert membership scoring data, the fusion weights are calculated to obtain
The tested prior data are within the confidence interval, and through the consistency test, there is no significant difference between the prior information and the field data.
In order to highlight the superiority of the method proposed in this study, the Bayesian estimation method of equipment reliability based on multiple batch tests (method 1) in this study is compared with the Bayesian estimation method of equipment reliability based on single batch tests (method 2). Field test information and prior information are used to calculate the distribution of equipment reliability parameters, and the calculation results of the two methods are obtained, as shown in Table 3.
Bayesian estimation results of equipment reliability based on methods 1 and 2
|
|
|
|
|
|
|
|
|
||
|---|---|---|---|---|---|---|---|---|---|
| The Bayesian estimation method of equipment reliability based on multiple batch tests (method 1) in this study | The initial batch tests | 30.4 | 16.6 | 29.9 | 7.5 | 9.6 | 119 | 29.9 | 10.52 |
| The second batch tests | 34 | 11.6 | 32.7 | 9.32 | 12.4 | 125 | 32.7 | 8.6 | |
| The third batch tests | 39 | 8 | 38 | 10.17 | 13.32 | 108 | 38 | 7.14 | |
| The Bayesian estimation method of equipment reliability based on single batch tests (method 2) | The third batch tests | 39 | 8 | 39.3 | 7.8 | 9.3 | 116 | 39.3 | 10.82 |
The distribution diagrams of equipment reliability parameters

Distribution of equipment reliability parameters
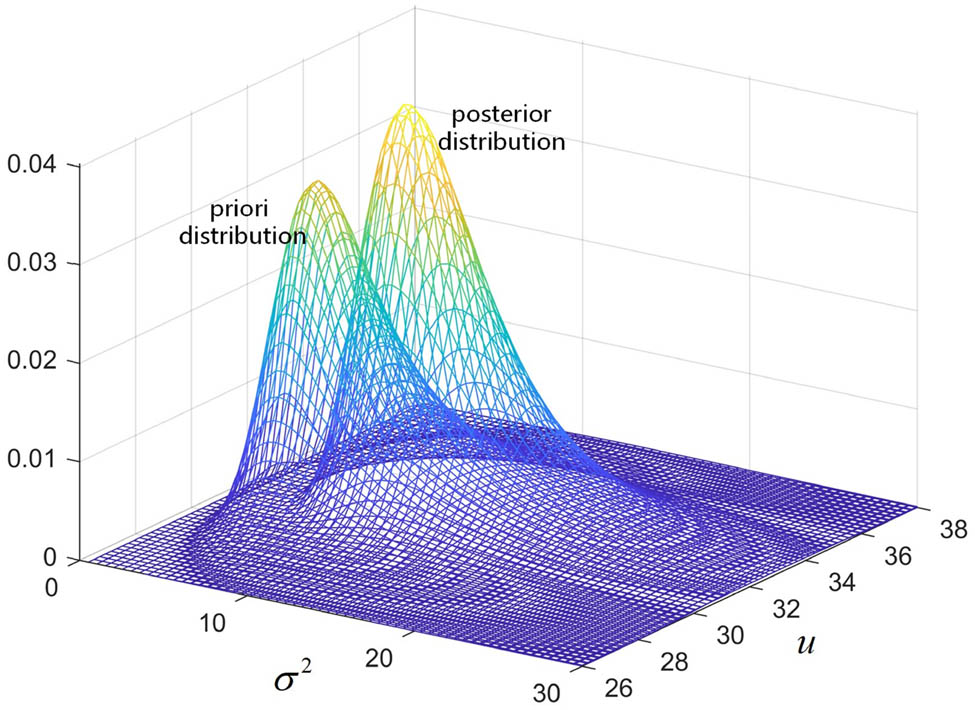
Distribution of equipment reliability parameters

Distribution of equipment reliability parameters
Figures 3–5 intuitively present the joint distribution of equipment reliability parameters
In order to more intuitively reflect the changes in reliability parameters

Equipment reliability parameter

Equipment reliability parameter
It can be seen from Figures 6 and 7 that the equipment reliability parameter
The maximum estimates

Equipment life distributions of each batch tests.
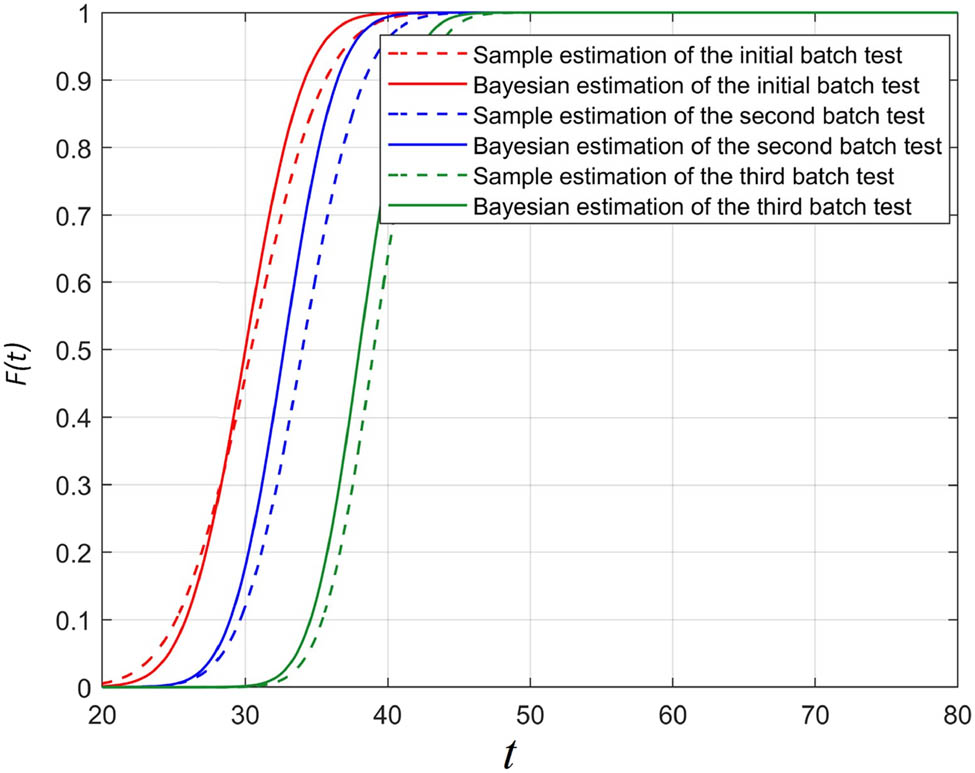
Equipment unreliability functions of each batch tests.

Equipment reliability functions of each batch tests.

Equipment failure rate functions of each batch tests.
The variation in equipment reliability functions obtained from field test samples information are also shown in Figures 8–11. Comparing the results in Figures 3–7, it can be found that compared with the gap between the Bayesian estimation results and the prior distribution, the Bayesian estimation results are closer to the field test samples information results, indicating that the field test samples information are more important, which is consistent with the actual situation.
These equipment tests give the change in the prior information, sample information, and Bayesian estimation results of each batch tests. The Bayesian results of the third batch tests contain the initial batch tests results, the second batch tests results, the third batch simulation tests information, and the field samples tests information. The Bayesian estimation results of the third batch tests contain more comprehensive information, so the Bayesian estimation results of the third batch tests are selected to estimate the reliability of equipment with normal life distribution.
Continue to increase the reliability test of the equipment to determine the standard values of the reliability parameters of the equipment:

Distribution of equipment life corresponding to estimated and standard values.
From Figure 12, it can be found that the result value estimated by the Bayesian estimation method of equipment reliability based on multiple batch tests in this study is closer to the standard value, which indicates that this research method has better applicability at this time.
According to formula (6), the mean square error of the equipment reliability parameters estimation can be obtained, and the mean square error function image of parameter

The mean square error function of parameter
It can be seen that the mean square error of the equipment reliability Bayesian estimation method based on multi-batch tests in this study is small, while the mean square error of the equipment reliability Bayesian estimation method based on single batch tests is larger, indicating that the results obtained by this method are closer to the real value. The reason is that this research method uses the test information of three batches and more sample information, while the Bayesian estimation method based on single batch test only uses the test data of one batch, so there is a large risk of error in parameter estimation.
Bayesian estimation method of equipment reliability with normal-type life distribution based on multiple batch tests proposed in this study is applicable to the reliability research in the initial stage of equipment development and design, which consists of multiple batches reliability tests programs. When the number of reliability samples of each batch tests is small, it is more applicable to use the method of this study. Conversely, when the number of reliability samples of the final batch tests is large, it is sufficient to directly use the reliability sample data for estimation.
5 Conclusion
The Bayesian estimation method of equipment reliability with normal life distribution based on multiple batch tests are proposed in this research, and takes the common equipment with normal-type life distribution as the research object, and uses Bayesian method and system contribution theory to make full use of the equipment reliability field tests information and simulation tests information of each batch. Compared with the existing reliability evaluation research, this research method uses more sufficient information, which can reduce the problem of large error of equipment reliability estimation caused by insufficient size of field tests samples.
In addition to the above advantages, there are some limitations in this study, for example, this study requires high reliability of the prior information of each batch tests. If the prior information is unreliable, it will affect the estimation accuracy of equipment reliability. Moreover, this study only investigates the reliability of equipment with normal-type life distribution and the reliability of equipment with Weibull distribution, lognormal distribution, and other distributions based on multiple batch tests will be further investigated in future research. The results of this study can provide reference for estimation of equipment reliability based on multiple batch tests.
-
Funding information: This research was funded by the National Natural Science Foundation of China (71501183).
-
Author contributions: conceptualization: H.L., T.H., and T.C.; methodology: H.L. and T.H.; software: H.L.; validation: H.L.; formal analysis: H.L.; investigation: T.H.; resources: T.H. and M.L.; data curation: K.D.; writing – original draft preparation: T.C.; writing – review and editing: T.C. and M.L.; visualization: H.L. and T.H.; supervision: M.L. and K.D.; project administration: M.L.; and funding acquisition: K.D. All authors have accepted responsibility for the entire content of this manuscript and approved its submission.
-
Conflict of interest: The authors state no conflict of interest.
References
[1] Compare M, Baraldi P, Bani I, Zio E, McDonnell D. Industrial equipment reliability estimation: A Bayesian Weibull regression model with covariate selection. Reliab Eng Syst Safe. 2020;200(2):65–80.10.1016/j.ress.2020.106891Search in Google Scholar
[2] Zhao Q, Jia X, Cheng ZJ, Guo B. Bayesian estimation of residual life for weibull-distributed components of on-orbit satellites based on multi-source information fusion. Appl Sci-Basel. 2019;9(15):111–25.10.3390/app9153017Search in Google Scholar
[3] Jia XP, Jia BZ. Normalized projection-based group decision making method and application to marine equipment reliability assessment. Ocean Eng. 2022;251(6):155–71.10.1016/j.oceaneng.2022.111043Search in Google Scholar
[4] Jia X, Guo B. Product reliability evaluation based on expert experience and life test data. Contr Deci. 2022;37(10):2600–8.Search in Google Scholar
[5] Nwezza EE, Ugwuowo FI. An extended normal distribution for reliability data analysis. J Stat Manag Syst. 2022;25(2):369–92.10.1080/09720510.2021.1878632Search in Google Scholar
[6] Guo JY, Wan JL, Yang Y, Dai L, Tang AM, Huang BK, et al. A deep feature learning method for remaining useful life prediction of drilling pumps. Energy. 2023;282(8):107–22.10.1016/j.energy.2023.128442Search in Google Scholar
[7] Chen BT, Liu Y, Zhang CH, Wang ZR. Time series data for equipment reliability analysis with deep learning. IEEE Access. 2020;8(5):484–93.10.1109/ACCESS.2020.3000006Search in Google Scholar
[8] Wang B, Jiang P, Guo B. Reliability evaluation of aerospace valve based on multi-source information fusion. Act Arma. 2022;43(1):199–206.Search in Google Scholar
[9] Guo YJ, Wang HD, Guo Y, Zhong MJ, Li Q, Gao C. System operational reliability evaluation based on dynamic Bayesian network and XGBoost. Reliab Eng Syst Safe. 2022;225(6):178–93.10.1016/j.ress.2022.108622Search in Google Scholar
[10] Wang Y. Research on accelerated degradation test and reliability evaluation method of electromechanical products. Pro 33rd China Contr Deci Mak Conf. Vol. 13, Issue 2; 2021. p. 260–5.10.1109/CCDC52312.2021.9601695Search in Google Scholar
[11] Jia CX, Ding HY, Zhang X. Reliability evaluation of direct current distribution system for intelligent buildings based on big data analysis. Teh Vjesn. 2021;28(5):121–35.10.17559/TV-20210507090202Search in Google Scholar
[12] Dai L, Guo JY, Wan JL, Wang J, Zan XP. A reliability evaluation model of rolling bearings based on WKN-BiGRU and Wiener process. Reliab Eng Syst Safe. 2022;225(9):55–68.10.1016/j.ress.2022.108646Search in Google Scholar
[13] Alex DF, Nita Y, Trung L, Prakash YO. A deep neural network and Bayesian method based framework for all-terminal network reliability estimation considering degradation. Reliab Eng Syst Safe. 2023;229(5):102–15.10.1016/j.ress.2022.108881Search in Google Scholar
[14] Zahra R, Ezzatallah JB, Einolah D. Parameters and reliability estimation for the Weibull distribution based on intuitionistic fuzzy lifetime data. Complex Intell Syst. 2022;8(6):481–96.10.1007/s40747-022-00720-xSearch in Google Scholar
[15] Zhang XY, Yang LH, Han XF, Zhang Q, Shi CP, Li Z. A review of the mathematical evaluation model of contribution rate of weapon equipment system. Acad J Comput Inf Sci. 2022;5(6):97–111.10.25236/AJCIS.2022.050607Search in Google Scholar
[16] Hou J, Wang RH, Wang JJ, Yang Z. Research on evaluation index system of information system equipment system contribution rate. Matec Web Conferences. 2021;336(11):28–43.10.1051/matecconf/202133605028Search in Google Scholar
[17] Salman B, Mohammad S, Gholamhossein G. Statistical inference of reliability parameter for the skew-normal distribution under progressive type-II censored samples. J Math-Uk. 2022;22(13):77–89.Search in Google Scholar
[18] Singh S, Tripathi MY. Reliability sampling plans for a lognormal distribution under progressive first-failure censoring with cost constraint. Stat Pap. 2015;56(3):773–817.10.1007/s00362-014-0608-4Search in Google Scholar
[19] Djeddi ZA, Hafaifa A, Kouzou A, Abudura S. Exploration of reliability algorithms using modified Weibull distribution: application on gas turbine. Int J Syst Assur Eng. 2017;8(2s):1885–94.10.1007/s13198-016-0480-9Search in Google Scholar
[20] Loganathan A, Gunasekaran M. Construction of reliability single sampling plans based on exponentiated exponential distribution. J Test Eval. 2018;47(2):594–607.10.1520/JTE20160594Search in Google Scholar
[21] Liu HB, Shi XM. Damage effectiveness calculation of hitting targets with ammunition based on Bayesian multinomial distribution. Symmetry. 2022;14(5):71–84.10.3390/sym14050892Search in Google Scholar
[22] Zhao RD, Shi XM, Wang Q, Su XB, Song X. Bayesian inference for ammunition demand based on Gompertz distribution. J Syst Eng Electron. 2020;31(3):567–77.10.23919/JSEE.2020.000035Search in Google Scholar
[23] Wu LL, Pan G. Expert information fusion method for reliability test evaluation of small sample complex products. Mach Electron. 2014;13(11):3–6.Search in Google Scholar
[24] Dao PB. On Wilcoxon rank sum test for condition monitoring and fault detection of wind turbines. Appl Energ. 2022;318(2):77–92.10.1016/j.apenergy.2022.119209Search in Google Scholar
[25] Murakami H, Ha H. The modified Mood test for the scale alternative and its numerical comparisons. J Korean Stat Soc. 2015;44(4):592–605.10.1016/j.jkss.2015.03.005Search in Google Scholar
[26] Kalpande SD, Toke LK. Reliability analysis and hypothesis testing of critical success factors of total productive maintenance. Int J Qual Reliab Ma. 2023;40(1):238–66.10.1108/IJQRM-03-2021-0068Search in Google Scholar
[27] Abhishek B, Malay G. Bias corrected empirical Bayes confidence intervals for the selected mean. Commun Stat-Theory Methods. 2019;48(3):583–95.10.1080/03610926.2017.1417427Search in Google Scholar
[28] Rastogi KM, Oguntunde EP. Classical and Bayes estimation of reliability characteristics of the Kumaraswamy-Inverse Exponential distribution. Int J Syst Assur Eng. 2019;10(2):190–200.10.1007/s13198-018-0744-7Search in Google Scholar
[29] Tanzer JR, Harlow LL. Bayesian modeling of Test reliability. Multivar Behav Res. 2020;56(1):159–9.10.1080/00273171.2020.1854082Search in Google Scholar PubMed
[30] Madhumitha J, Vijayalakshmi G. Bayesian estimation of linear/circular consecutive k-out-of-n: F system reliability. Inter J Perform Eng. 2020;16(10):1509–16.10.23940/ijpe.20.10.p2.15091516Search in Google Scholar
[31] Wu Y, Liu DS, Sun SG, Qin ZX, Wu TQ. Maximum posterior estimation of normal-inverse gamma distribution of rock and soil strength parameters. China J Rock Mech Eng. 2019;38(6):1188–96.Search in Google Scholar
[32] Li K, Shi XM, Li GN, Liu HB. Estimation method of anti-cruise missile hit probability based on normal-inverse gamma distribution. Syst Eng Electron. 2022;44(8):2621–7.Search in Google Scholar
[33] Wang Z, Liu SF, Fang ZG. Research on SoS-GERT Network Model for Equipment System of Systems Contribution Evaluation Based on Joint Operation. IEEE Syst J. 2020;14(4):4188–96.10.1109/JSYST.2019.2956549Search in Google Scholar
[34] Song JH, Li L, Guo QS, Liu ZL. System contribution rate assessment methods. Advan Sci and Indus Research Center. Proc of 2017 2nd Inter Confer on Comp, Mechatron and Electron Eng (CMEE 2017). Depart Equip Com and Admin, Aca Army. Vol. 6, Issue. 2; 2017. p. 86–91.Search in Google Scholar
[35] Wu BY, Lu HC. Research progress and prospect of contribution evaluation of weapon equipment system. J Harbin Eng Univ. 2022;43(8):1221–8.Search in Google Scholar
[36] Na RS, Kong E, Gao H. Intuitionistic fuzzy set membership determination method based on deep learning. Opera Res Manage. 2022;31(2):92–8.Search in Google Scholar
[37] Zhao RD, Shi XM, Su XB, Wang Q, Jiang GS. New munitions consumption prediction method based on Bayesian system fusion. J Ord Equ Eng. 2020;41(2):75–80.Search in Google Scholar
© 2024 the author(s), published by De Gruyter
This work is licensed under the Creative Commons Attribution 4.0 International License.
Articles in the same Issue
- Regular Articles
- Numerical study of flow and heat transfer in the channel of panel-type radiator with semi-detached inclined trapezoidal wing vortex generators
- Homogeneous–heterogeneous reactions in the colloidal investigation of Casson fluid
- High-speed mid-infrared Mach–Zehnder electro-optical modulators in lithium niobate thin film on sapphire
- Numerical analysis of dengue transmission model using Caputo–Fabrizio fractional derivative
- Mononuclear nanofluids undergoing convective heating across a stretching sheet and undergoing MHD flow in three dimensions: Potential industrial applications
- Heat transfer characteristics of cobalt ferrite nanoparticles scattered in sodium alginate-based non-Newtonian nanofluid over a stretching/shrinking horizontal plane surface
- The electrically conducting water-based nanofluid flow containing titanium and aluminum alloys over a rotating disk surface with nonlinear thermal radiation: A numerical analysis
- Growth, characterization, and anti-bacterial activity of l-methionine supplemented with sulphamic acid single crystals
- A numerical analysis of the blood-based Casson hybrid nanofluid flow past a convectively heated surface embedded in a porous medium
- Optoelectronic–thermomagnetic effect of a microelongated non-local rotating semiconductor heated by pulsed laser with varying thermal conductivity
- Thermal proficiency of magnetized and radiative cross-ternary hybrid nanofluid flow induced by a vertical cylinder
- Enhanced heat transfer and fluid motion in 3D nanofluid with anisotropic slip and magnetic field
- Numerical analysis of thermophoretic particle deposition on 3D Casson nanofluid: Artificial neural networks-based Levenberg–Marquardt algorithm
- Analyzing fuzzy fractional Degasperis–Procesi and Camassa–Holm equations with the Atangana–Baleanu operator
- Bayesian estimation of equipment reliability with normal-type life distribution based on multiple batch tests
- Chaotic control problem of BEC system based on Hartree–Fock mean field theory
- Optimized framework numerical solution for swirling hybrid nanofluid flow with silver/gold nanoparticles on a stretching cylinder with heat source/sink and reactive agents
- Stability analysis and numerical results for some schemes discretising 2D nonconstant coefficient advection–diffusion equations
- Convective flow of a magnetohydrodynamic second-grade fluid past a stretching surface with Cattaneo–Christov heat and mass flux model
- Analysis of the heat transfer enhancement in water-based micropolar hybrid nanofluid flow over a vertical flat surface
- Microscopic seepage simulation of gas and water in shale pores and slits based on VOF
- Model of conversion of flow from confined to unconfined aquifers with stochastic approach
- Study of fractional variable-order lymphatic filariasis infection model
- Soliton, quasi-soliton, and their interaction solutions of a nonlinear (2 + 1)-dimensional ZK–mZK–BBM equation for gravity waves
- Application of conserved quantities using the formal Lagrangian of a nonlinear integro partial differential equation through optimal system of one-dimensional subalgebras in physics and engineering
- Nonlinear fractional-order differential equations: New closed-form traveling-wave solutions
- Sixth-kind Chebyshev polynomials technique to numerically treat the dissipative viscoelastic fluid flow in the rheology of Cattaneo–Christov model
- Some transforms, Riemann–Liouville fractional operators, and applications of newly extended M–L (p, s, k) function
- Magnetohydrodynamic water-based hybrid nanofluid flow comprising diamond and copper nanoparticles on a stretching sheet with slips constraints
- Super-resolution reconstruction method of the optical synthetic aperture image using generative adversarial network
- A two-stage framework for predicting the remaining useful life of bearings
- Influence of variable fluid properties on mixed convective Darcy–Forchheimer flow relation over a surface with Soret and Dufour spectacle
- Inclined surface mixed convection flow of viscous fluid with porous medium and Soret effects
- Exact solutions to vorticity of the fractional nonuniform Poiseuille flows
- In silico modified UV spectrophotometric approaches to resolve overlapped spectra for quality control of rosuvastatin and teneligliptin formulation
- Numerical simulations for fractional Hirota–Satsuma coupled Korteweg–de Vries systems
- Substituent effect on the electronic and optical properties of newly designed pyrrole derivatives using density functional theory
- A comparative analysis of shielding effectiveness in glass and concrete containers
- Numerical analysis of the MHD Williamson nanofluid flow over a nonlinear stretching sheet through a Darcy porous medium: Modeling and simulation
- Analytical and numerical investigation for viscoelastic fluid with heat transfer analysis during rollover-web coating phenomena
- Influence of variable viscosity on existing sheet thickness in the calendering of non-isothermal viscoelastic materials
- Analysis of nonlinear fractional-order Fisher equation using two reliable techniques
- Comparison of plan quality and robustness using VMAT and IMRT for breast cancer
- Radiative nanofluid flow over a slender stretching Riga plate under the impact of exponential heat source/sink
- Numerical investigation of acoustic streaming vortices in cylindrical tube arrays
- Numerical study of blood-based MHD tangent hyperbolic hybrid nanofluid flow over a permeable stretching sheet with variable thermal conductivity and cross-diffusion
- Fractional view analytical analysis of generalized regularized long wave equation
- Dynamic simulation of non-Newtonian boundary layer flow: An enhanced exponential time integrator approach with spatially and temporally variable heat sources
- Inclined magnetized infinite shear rate viscosity of non-Newtonian tetra hybrid nanofluid in stenosed artery with non-uniform heat sink/source
- Estimation of monotone α-quantile of past lifetime function with application
- Numerical simulation for the slip impacts on the radiative nanofluid flow over a stretched surface with nonuniform heat generation and viscous dissipation
- Study of fractional telegraph equation via Shehu homotopy perturbation method
- An investigation into the impact of thermal radiation and chemical reactions on the flow through porous media of a Casson hybrid nanofluid including unstable mixed convection with stretched sheet in the presence of thermophoresis and Brownian motion
- Establishing breather and N-soliton solutions for conformable Klein–Gordon equation
- An electro-optic half subtractor from a silicon-based hybrid surface plasmon polariton waveguide
- CFD analysis of particle shape and Reynolds number on heat transfer characteristics of nanofluid in heated tube
- Abundant exact traveling wave solutions and modulation instability analysis to the generalized Hirota–Satsuma–Ito equation
- A short report on a probability-based interpretation of quantum mechanics
- Study on cavitation and pulsation characteristics of a novel rotor-radial groove hydrodynamic cavitation reactor
- Optimizing heat transport in a permeable cavity with an isothermal solid block: Influence of nanoparticles volume fraction and wall velocity ratio
- Linear instability of the vertical throughflow in a porous layer saturated by a power-law fluid with variable gravity effect
- Thermal analysis of generalized Cattaneo–Christov theories in Burgers nanofluid in the presence of thermo-diffusion effects and variable thermal conductivity
- A new benchmark for camouflaged object detection: RGB-D camouflaged object detection dataset
- Effect of electron temperature and concentration on production of hydroxyl radical and nitric oxide in atmospheric pressure low-temperature helium plasma jet: Swarm analysis and global model investigation
- Double diffusion convection of Maxwell–Cattaneo fluids in a vertical slot
- Thermal analysis of extended surfaces using deep neural networks
- Steady-state thermodynamic process in multilayered heterogeneous cylinder
- Multiresponse optimisation and process capability analysis of chemical vapour jet machining for the acrylonitrile butadiene styrene polymer: Unveiling the morphology
- Modeling monkeypox virus transmission: Stability analysis and comparison of analytical techniques
- Fourier spectral method for the fractional-in-space coupled Whitham–Broer–Kaup equations on unbounded domain
- The chaotic behavior and traveling wave solutions of the conformable extended Korteweg–de-Vries model
- Research on optimization of combustor liner structure based on arc-shaped slot hole
- Construction of M-shaped solitons for a modified regularized long-wave equation via Hirota's bilinear method
- Effectiveness of microwave ablation using two simultaneous antennas for liver malignancy treatment
- Discussion on optical solitons, sensitivity and qualitative analysis to a fractional model of ion sound and Langmuir waves with Atangana Baleanu derivatives
- Reliability of two-dimensional steady magnetized Jeffery fluid over shrinking sheet with chemical effect
- Generalized model of thermoelasticity associated with fractional time-derivative operators and its applications to non-simple elastic materials
- Migration of two rigid spheres translating within an infinite couple stress fluid under the impact of magnetic field
- A comparative investigation of neutron and gamma radiation interaction properties of zircaloy-2 and zircaloy-4 with consideration of mechanical properties
- New optical stochastic solutions for the Schrödinger equation with multiplicative Wiener process/random variable coefficients using two different methods
- Physical aspects of quantile residual lifetime sequence
- Synthesis, structure, I–V characteristics, and optical properties of chromium oxide thin films for optoelectronic applications
- Smart mathematically filtered UV spectroscopic methods for quality assurance of rosuvastatin and valsartan from formulation
- A novel investigation into time-fractional multi-dimensional Navier–Stokes equations within Aboodh transform
- Homotopic dynamic solution of hydrodynamic nonlinear natural convection containing superhydrophobicity and isothermally heated parallel plate with hybrid nanoparticles
- A novel tetra hybrid bio-nanofluid model with stenosed artery
- Propagation of traveling wave solution of the strain wave equation in microcrystalline materials
- Innovative analysis to the time-fractional q-deformed tanh-Gordon equation via modified double Laplace transform method
- A new investigation of the extended Sakovich equation for abundant soliton solution in industrial engineering via two efficient techniques
- New soliton solutions of the conformable time fractional Drinfel'd–Sokolov–Wilson equation based on the complete discriminant system method
- Irradiation of hydrophilic acrylic intraocular lenses by a 365 nm UV lamp
- Inflation and the principle of equivalence
- The use of a supercontinuum light source for the characterization of passive fiber optic components
- Optical solitons to the fractional Kundu–Mukherjee–Naskar equation with time-dependent coefficients
- A promising photocathode for green hydrogen generation from sanitation water without external sacrificing agent: silver-silver oxide/poly(1H-pyrrole) dendritic nanocomposite seeded on poly-1H pyrrole film
- Photon balance in the fiber laser model
- Propagation of optical spatial solitons in nematic liquid crystals with quadruple power law of nonlinearity appears in fluid mechanics
- Theoretical investigation and sensitivity analysis of non-Newtonian fluid during roll coating process by response surface methodology
- Utilizing slip conditions on transport phenomena of heat energy with dust and tiny nanoparticles over a wedge
- Bismuthyl chloride/poly(m-toluidine) nanocomposite seeded on poly-1H pyrrole: Photocathode for green hydrogen generation
- Infrared thermography based fault diagnosis of diesel engines using convolutional neural network and image enhancement
- On some solitary wave solutions of the Estevez--Mansfield--Clarkson equation with conformable fractional derivatives in time
- Impact of permeability and fluid parameters in couple stress media on rotating eccentric spheres
- Review Article
- Transformer-based intelligent fault diagnosis methods of mechanical equipment: A survey
- Special Issue on Predicting pattern alterations in nature - Part II
- A comparative study of Bagley–Torvik equation under nonsingular kernel derivatives using Weeks method
- On the existence and numerical simulation of Cholera epidemic model
- Numerical solutions of generalized Atangana–Baleanu time-fractional FitzHugh–Nagumo equation using cubic B-spline functions
- Dynamic properties of the multimalware attacks in wireless sensor networks: Fractional derivative analysis of wireless sensor networks
- Prediction of COVID-19 spread with models in different patterns: A case study of Russia
- Study of chronic myeloid leukemia with T-cell under fractal-fractional order model
- Accumulation process in the environment for a generalized mass transport system
- Analysis of a generalized proportional fractional stochastic differential equation incorporating Carathéodory's approximation and applications
- Special Issue on Nanomaterial utilization and structural optimization - Part II
- Numerical study on flow and heat transfer performance of a spiral-wound heat exchanger for natural gas
- Study of ultrasonic influence on heat transfer and resistance performance of round tube with twisted belt
- Numerical study on bionic airfoil fins used in printed circuit plate heat exchanger
- Improving heat transfer efficiency via optimization and sensitivity assessment in hybrid nanofluid flow with variable magnetism using the Yamada–Ota model
- Special Issue on Nanofluids: Synthesis, Characterization, and Applications
- Exact solutions of a class of generalized nanofluidic models
- Stability enhancement of Al2O3, ZnO, and TiO2 binary nanofluids for heat transfer applications
- Thermal transport energy performance on tangent hyperbolic hybrid nanofluids and their implementation in concentrated solar aircraft wings
- Studying nonlinear vibration analysis of nanoelectro-mechanical resonators via analytical computational method
- Numerical analysis of non-linear radiative Casson fluids containing CNTs having length and radius over permeable moving plate
- Two-phase numerical simulation of thermal and solutal transport exploration of a non-Newtonian nanomaterial flow past a stretching surface with chemical reaction
- Natural convection and flow patterns of Cu–water nanofluids in hexagonal cavity: A novel thermal case study
- Solitonic solutions and study of nonlinear wave dynamics in a Murnaghan hyperelastic circular pipe
- Comparative study of couple stress fluid flow using OHAM and NIM
- Utilization of OHAM to investigate entropy generation with a temperature-dependent thermal conductivity model in hybrid nanofluid using the radiation phenomenon
- Slip effects on magnetized radiatively hybridized ferrofluid flow with acute magnetic force over shrinking/stretching surface
- Significance of 3D rectangular closed domain filled with charged particles and nanoparticles engaging finite element methodology
- Robustness and dynamical features of fractional difference spacecraft model with Mittag–Leffler stability
- Characterizing magnetohydrodynamic effects on developed nanofluid flow in an obstructed vertical duct under constant pressure gradient
- Study on dynamic and static tensile and puncture-resistant mechanical properties of impregnated STF multi-dimensional structure Kevlar fiber reinforced composites
- Thermosolutal Marangoni convective flow of MHD tangent hyperbolic hybrid nanofluids with elastic deformation and heat source
- Investigation of convective heat transport in a Carreau hybrid nanofluid between two stretchable rotatory disks
- Single-channel cooling system design by using perforated porous insert and modeling with POD for double conductive panel
- Special Issue on Fundamental Physics from Atoms to Cosmos - Part I
- Pulsed excitation of a quantum oscillator: A model accounting for damping
- Review of recent analytical advances in the spectroscopy of hydrogenic lines in plasmas
- Heavy mesons mass spectroscopy under a spin-dependent Cornell potential within the framework of the spinless Salpeter equation
- Coherent manipulation of bright and dark solitons of reflection and transmission pulses through sodium atomic medium
- Effect of the gravitational field strength on the rate of chemical reactions
- The kinetic relativity theory – hiding in plain sight
- Special Issue on Advanced Energy Materials - Part III
- Eco-friendly graphitic carbon nitride–poly(1H pyrrole) nanocomposite: A photocathode for green hydrogen production, paving the way for commercial applications