Fractal-based techniques for physiological time series: An updated approach
-
José Luis Roca


Abstract
Along this paper, we shall update the state-of-the-art concerning the application of fractal-based techniques to test for fractal patterns in physiological time series. As such, the first half of the present work deals with some selected approaches to deal with the calculation of the self-similarity exponent of time series. They include broadly-used procedures as well as recent advances improving their accuracy and performance for a wide range of self-similar processes. The second part of this paper consists of a detailed review of high-quality studies carried out in the context of electroencephalogram signals. Both medical and non-medical applications have been deeply reviewed. This work is especially recommended to all those researchers especially interested in fractal pattern recognition for physiological time series.
1 Introduction
The word fractal derives from the Latin term “frangere”, that means “to break”. These mathematical objects are usually characterized by means of some key features we enumerate next:
Self-similarity. The subsets of a fractal set are exactly (approximate or statistically) equal to the whole set.
Iterative nature. Indeed, fractal patterns may be artificially generated via algorithms. Also, a wide range of fractals can be endowed with a fractal structure naturally.
Level of irregularity. The roughness that such objects show can be identified at a whole range of scales.
Fractal dimension. The topological dimension of an object considered to exhibit fractal patterns is strictly lower than its Hausdorff dimension.
From the properties above, it holds that the fractal dimension is a single value containing useful information regarding fractal patterns on sets or processes. In fact, the study based on the calculation of the fractal dimension of a set becomes crucial nowadays to detect self-similar structures and patterns for a wide range of contexts and situations including health sciences, economy, and mathematical modelling. Another indicator of fractality, especially useful to be calculated or estimated in empirical applications involving time series, is the so-called Hurst exponent. It is worth pointing out that both quantities are theoretically connected throughout some formulae. For instance, H = 1 + d − dimB, where d is the Euclidean (embedding) dimension of the space and dimB denotes the standard box dimension. However, if we change the dimension function, then strong connections between such quantities still hold. For instance, it holds that dim
Today, biosignals such as electrocardiogram, electromyogram, or EEG are acquired by many devices in real time [3]. That information can be analyzed throuhgout many techniques (both linear and nonlinear) that properly show the current state of the subject and even her/his evolution. This work is focused on EEG, which provides a representation of the electrical activity of the brain along the time [4]. Usually, that activity is collected using electrodes at several locations on the scalp via one electrode as a reference (placed in a different part) to measure the potential. The term channel is used to defined the specific location of each electrode and the number of channels used changes depending on the pursued objective, being 2 to 128 the most usual numbers. The signal is sampled with frequencies ranging from 250 to 500 Hz and the amplitude usually varies about ±100 uV so it needs to be amplified. In general, researchers divide the EEG in different bands called delta (0.5 − 3 Hz), theta (4 − 7 Hz), alpha (8 − 13 Hz), beta (13 − 30 Hz), and gamma (> 30 Hz) [4]. Figure 1 depicts a 5−second EEG signal from a healthy subject, sampled at 250 Hz by 19 channels labeled according to the international 10/20 system.
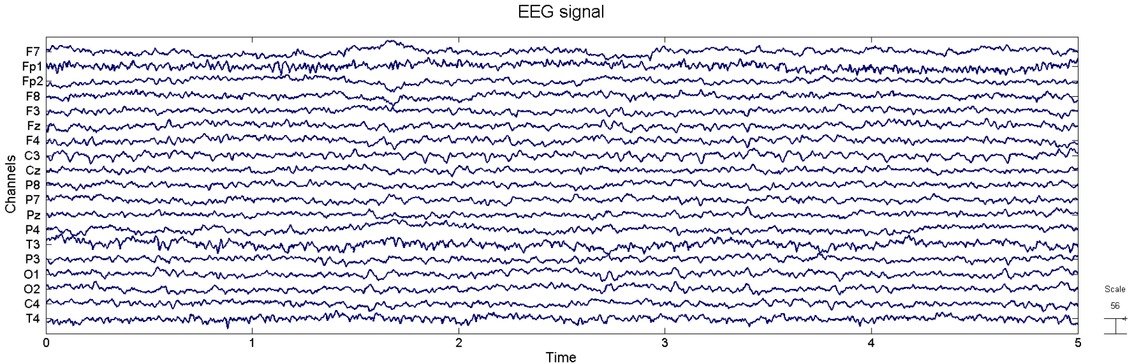
The picture above displays a 5 second EEG signal from a healthy subject sampled at 250 Hz by 19 channels
Although the first motivation to acquire and study biosignals was mainly medical, the EEG signal analysis has increased widely along the last years due to the addition of non-medical and new applications including emotion recognition, neuromarketing, gaming, or Brain Computer Interfaces. It is worth mentioning that the present work is focused on fractal analysis as a way to study the brain dynamics.
The structure of this paper is as follows. In section 2 we provide a rigorous description regarding some of the most representative fractal-based techniques to deal with the calculation of the self-similarity exponent of time series. In section 3, some selected applications of this kind of approaches for EEG signal processing are collected. We would like to point out that top-quality contributions already published in JCR journals from year 2010 have been considered along this work. Thus, the main goal of the present work is to provide the reader and updated guide concerning the current state of applications of fractal-based techniques to such research fields.
2 Calculating the self-similarity exponent of random processes
In this section, we collect some selected procedures to appropriately calculate the self-similarity exponent of random processes. It is well-known that the Hurst exponent (more precisely, the self-similarity index or exponent) of a random process throws valuable information regarding trends and fractal patterns on data sets (in particular, time series). In other words, a great value of the self-similarity index indicator (i.e, close to 1) means that some evidence regarding long-range dependence in the process under study may follow.
Some algorithms have been classically applied to estimate the self-similarity exponent of random processes. They include the classical R/S analysis and Detrended Fluctuation Analysis. However, other approaches appeared afterwards have been proved to be more versatile and accurate. Thus, Geometric method-based procedures and Fractal dimension algorithms constitute novel and accurate alternatives especially useful to explore fractal patterns for short length series.
Anyway, the approaches described in the following subsections constitute a valuable selection to test for fractal patterns in physiological time series.
2.1 Mandelbrot’s R/S analysis
The so-called R/ S analysis is one of the most applied procedures to tackle with the estimation of the self-similarity exponent. It was first contributed by Mandelbrot and Wallis in [5] based on previous ideas due to English hydrologist H.E. Hurst (c.f. [6]). It is also worth mentioning that Mandelbrot first introduced the R/S analysis in economy (c.f. [7, 8, 9]) and argued that the performance of such a methodology is superior to variance, spectral, and autocorrelation analyses. The R/S analysis is especially appropriate to deal with large time series that could be modelized in terms of (fractional) Brownian motions.
For a time series (of returns) of length n and for each m = 2k < n, divide it into
For each block Bi = {B1, …, Bm} : i = 1, …, d, calculate both the mean, Ei, and the standard deviation, Si.
Normalize the data of each block Bi by substracting its mean, Ei, i.e, let Nj = Bj −Ei,where j = 1, …, m.
Calculate the cumulative series (with mean 0) for each block
Determine the range of C j for each block, i.e, calculate Ri = max{Cj : j = 1, …, m} − min{Cj : j = 1, …, m}, where i = 1, …, d.
Rescale the range, i.e, calculate
Calculate the mean of the rescaled ranges, i.e,
The self-similarity exponent of the time series calculated according to R/S Analysis, HR/S, stands as the slope of the linear regression of log m vs. log RSm.
2.2 Detrended fluctuation analysis (DFA)
Detrended Fluctuation Analysis (DFA, hereafter), first contributed by Peng et al. (c.f. [10]), constitutes another broadly used approach to calculate the self-similarity index of random processes. It is noteworthy that it allows checking for correlation and scaling properties in time series (c.f. [11, 12, 13]). Thus, it becomes appropriate to study the evolution of the Hurst exponent of series which exhibit trends.
For a time series (of returns) of length n and for each m = 2k < n, let us divide it into
Determine the local trend of each block Bi.
Let Yj : j = 1, …, m be the detrended process in each block Bi, i.e, the difference between the original value of the series in the block and the local trend.
For each block, calculate
Determine the statistic
The Hurst exponent calculated by DFA, HDFA, stands as the slope of the linear regression of log m vs. log Fm.
It is worth mentioning that both estimators, HR/S and HDFA, throw information regarding memory in the series though not about the distribution of the increments of the corresponding process. Moreover, their definitions are both based on the variance (respectively, the standard deviation) of the process (respectively, its increments). However, even if such moments are infinite, such estimators still work properly (c.f. [14]). This fact implies, in particular, that when these estimators are applied to calculate the self-similarity exponent of either a Brownian motion or a Lévy stable motion with different self-similarity and without memory, then one gets HR/S = HDFA = 0.5.
2.3 Geometric method-based procedures (GM algorithms)
Geometric method-based procedures (GM algorithms, hereafter), GM1 and GM2, are both based on the next expression to estimate the self-similar exponent H of a random process:
where
2.3.1 GM1
For a time series (of log −returns) of length n and for each m = 2k < n, divide it into
Calculate the variation of each block Bi = {B1, …, Bm}, i.e, let Di = Bm − B1 for i = 1, …, d.
Calculate the mean of the variations of all the blocks:
The self-similarity exponent of the time series calculated according to GM1 stands as the slope of the linear regression of log m vs. log Mm.
2.3.2 GM2
Moreover, if additional information regarding the time series is available, e.g., if both the maximum and the minimum values of each period are known, then the following alternative to GM1 approach named GM2 may display valuable information concerning self-similar patterns and trends on the series.
For a time series (of log −returns) of length n and for each m = 2k < n, divide it into
Calculate the range of each block Bi = {B1, …, Bm}, i.e, let Ri = max{Bj : j = 1, …, m}− min{Bj : j = 1, …, m} for i = 1, …, d.
Calculate the mean of the ranges of all the blocks:
The Hurst exponent of the time series calculated by GM2 is the slope of the linear regression of log m vs. log Mm.
It is worth mentioning that both GM1 and GM2 approaches consider the log −values of the series, whereas R/S analysis uses the (log) returns. Interestingly, the validity of these geometrical procedures to properly calculate the self-similarity exponent of (fractional) Brownian motions and (fractional) Lévy stable motions has already been justified theoretically (c.f. [16, Corollaries 3.5 and 3.9]). Additionally, in that work, the authors described both GM algorithms in terms of fractal structures (c.f. [16, section 3]). Thus, they constitute two accurate geometrical methods to test for scaling and correlation properties on time series.
2.4 FD algorithms
Fractal dimension algorithms (FD algorithms, hereafter), were introduced from the viewpoint of fractal structures by Sánchez-Granero et al. in [1], where their accuracy to calculate the self-similarity exponent of a broad range of random processes was theoretically proved. Moreover, it was verified by Monte Carlo simulation that the three FD algorithms, FD1, FD2, and FD3 work properly for short series. Next, we describe how to calculate the self-similarity index of random processes throughout FD algorithms. With this aim, we shall utilize the concept of a fractal structure.
Firstly, recall that a family Γ of subsets of X is a covering of X if X = ∪{A : A ∈ Γ}. Thus, a fractal structure on a set X is defined as a countable family of coverings of X, Γ = {Γn : n ∈ N}, such that the two following conditions stand for all natural numbers:
For each A ∈ Γn+1, there exists B ∈ Γn such that A ⊆ B.
Each B ∈ Γn can be written as B = ∪{A ∈ Γn+1 : A ⊆ B}.
In other words, the covering Γn+1 is a strong refinement of Γn, called level n of Γ. If α : [0, 1] → R is a parameterization of a real curve and Γ = {Γn : n ∈ N} is the fractal structure on [0, 1] with levels given by Γn =
– FD1:
Let dn be the mean of {diam (A) : A ∈ Δn} for 1 ≤ n ≤ log2l, where diam (A) = sup{|x − y| : x, y ∈ A}.
Define
Calculate r as the mean of {rn : 1 ≤ n ≤ log2l− 1}.
The self-similarity exponent of the series calculated according to FD1 is given by H = − log2r.
It is worth noting that FD1 is valid to calculate the parameter of random processes satisfying the condition E[Xn] = 2H ·E[Xn+1]. In particular, it works properly if Xn ∼ 2H · Xn+1, which is the case of processes with stationary and self-affine increments with parameter H (c.f. [1, Theorem 1]). In addition, it holds that GM2 is also valid to calculate the parameter of random processes lying under the condition
Since such an equality is equivalent to E[Xn] = 2H · E[Xn+1], then the validity of GM2 approach is equivalent to the validity of FD1 for Hurst exponent calculation purposes.
– FD2: Given a random variable X, recall that its s−moment is defined by ms(X) = E[Xs] for s > 0, provided that such an expected value exists. Let Xk = M(2−k, ω) for each k ∈ N, where M(T, ω) = M(0, T, ω) and
where Y(s, t, ω) = X(s, ω)−X(t, ω). It is worth pointing out that {diam (A) : A ∈ Δk} is a sample of the random variable M(2−k, ω) (c.f. [1, Remark 1]). Hence, the FD2 approach can be described in the following terms.
Calculate ys = {yk,s : 1 ≤ k ≤ log2l−1} ,where
Let ys be the mean of each list ys.
Calculate the point s0 such that
The self-similarity exponent calculated via FD2 is given by
It turns out that FD2 approach is valid to appropriately calculate the parameter of random processes lying under the condition
(c.f. hypothesis (2) in [1, Theorem 3]). In particular, it holds for random functions such that
Going beyond, if Xn ∼ 2H ·Xn+1, then
– FD3: Next, we describe the so-called FD3 algorithm, an alternative to FD2 approach, which is also based on [1, Theorem 3].
Calculate {(k, βk,s) : 1 ≤ k ≤ log2l}, where βk,s = log2ms(Xk). Let βs be the slope of the regression line of {(k, βk,s) : 1 ≤ k ≤ log2l}.
Calculate s1 such that βs1 = −1.
The Hurst exponent calculated through FD3 is given by
Thus, FD3 procedure is valid to calculate the parameter of random processes satisfying the identity
Since such an expression is equivalent to
then FD3 is valid to calculate the self-similarity exponent of a random process with stationary and self-affine increments with parameter H, if and only if, FD2 is.
3 Applications of fractal analysis to analyse physiological time series
Fractal-based techniques have been widely applied for physiological time series to extract valuable information and analyze dynamical properties underlying subjects’ biosignals. Despite a wide range of biophisiological signals may be acquired and saved by diverse electronic devices, in this paper we shall be focused on some highlighted applications regarding EEG signals.
Usually, biosignal acquisition has been related to unhealthy subjects. However, along the last years healthy subjects are increasingly using biosignals in several applications. Next, we comment on some of them in the field of EEG.
Electroencephalogram signals (EEGs, hereafter) are potential fluctuations recorded from the scalp due to the brain electrical activity. It is worth pointing out that EEGs may be collected in distinct cognitive states or environments [17] and mathematically modeled as time series. The information extracted via fractal analysis becomes useful in medical and non-medical applications [18]. In the present paper, we have been focused on papers already appeared in Journal Citation Reports’ publications from 2010.
3.1 Medical applications
It is assumed that EEGs do reflect the brain dynamics, and hence, pathological states. This is the reason for which fractal and multifractal analyses have been extensively applied to medical biosignals in the last years [19]. The main clinical applications are surveyed next.
3.1.1 Epilepsy
Epilepsy is a neurological disorder leading patients to suffer spontaneous seizures. In each seizure, brain produces unexpected electrical discharges in a oscillatory state [20]. It is a common neurological disorder suffered by nearly 1% of the world population [21, 22]. An early detection of epilepsy becomes crucial to improve patients’ quality of life. It is worth pointing out that epilepsy diagnosis has been carried out via a visual inspection of EEGs by experts. In this way, different approaches to deal with epileptic seizure prediction from EEGs have been provided by scientists without requiring human inspection [23].
Since EEGs are identified as nonlinear systems and epileptic seizures are sudden excessive electrical discharges in a group of neurons, it reasonable that nonlinear techniques may become appropriate for seizure identification and detection [24].
With the aim to develop an automated system to detect epileptic seizures, fractal analysis have been applied for feature extraction as descriptors of the structure of EEGs which have been classified later by several machine learning based algorithms. In 2011, Yuan [24] characterized EEGs by extracting features via DFA and approximate entropy and classified them via an extreme learning machine. A satisfying recognition accuracy of 96.5% was reported. In 2012, Quang et al. [22] combined the ICA (Independent Component Analysis) with the Largest Lyapunov Exponent to clean EEGs. Further, Acharya et al. [25] combined both Hurst exponent and fractal dimension with other features achieving high accuracy from a small number of features. In 2013, Zhou conductedwavelet decomposition on EEGs with five scales and selected the wavelet coefficients [26]. Effective features including lacunarity and fluctuation index were extracted from the selected scales and then sent to a Bayesian Linear Discriminant obtaining satisfactory results. In 2015, Fergus et al. [23] extracted some features via the correlation dimension and mixed them with frequency domain features. They were ranked and then a classifying based on a k−nearest neighbor was conducted. Their results improved the performance of previous studies by as much as 10% in most cases. Nazami et al. [27] contributed a study regarding EEGs using both the Hurst exponent and the fractal dimension. The results of such analyses reported that they are able to forecast the onset of a seizure on an average of 25.76 seconds before the time of occurrence. In 2016, Upadhyay et al. [28] presented a comparative study among distinct feature ranking techniques for epileptic seizure detection. In this occasion, the EEGs were decomposed by means of 16 discrete wavelets. Several wavelet-based techniques for feature extraction including Kazt’s, Petrosian, and Higuchi’s dimensions were involved in such a study where Higuchi’s and Kazt’s threw the best results.
3.1.2 Depth of anesthesia
The anesthesia monitoring becomes crucial to guarantee a safety and comfortable scenario to work along a medical intervention [29]. Despite novel monitoring approaches have been applied to characterize EEGs [30, 31, 32], there is not an overall agreement regarding the automated depth of anesthesia monitoring: it constitutes an old problem in the literature and also a key aspect to tackle with. In fact, a high level of anesthesia may lead to over dosing effects. Nevertheless, a low level of substance may lead patients to suffer intra-operative awareness [29]. With this aim, a wide range of techniques for time series analysis including correlation dimension and Largest Lyapunov Exponents have been applied. However, they have not achieved a total acceptance due to their limitations to entirely describe the properties of the EEGs [33, 34]. The main limitation of fractal-based methods lies in the fact that EEGs usually display non-uniform and complex fluctuations leading to distinct fractal dimension values for a given brain state. Thus, fractal dimension methods may not describe accurately such signals [34]. Despite that, the performance of novel proposals for anesthesia monitoring are compared with fractal based techniques [35]. For instance, in 2017, Khulman and Manton [36] proposed auto–regressive moving average as a measure for anesthesia monitoring and compared it with Higuchi’s fractal dimension obtaining similar results. Interestingly, the medical equipment industry have developed the so-called Bispectral Index Score, currently the reference measure [29], though the incidence of awareness still remains for further research.
3.1.3 Autism
Autism Spectrum Disorder (ASD) constitutes a group of complex neurodevelopmental disorders, characterized by deficits in social communication and interaction, and restricted, repetitive, and stereotyped patterns of behavior. Individuals diagnosed with ASD have co-occurring intellectual disability, language disorder, and epilepsy at higher rates than the general population [37].
It holds that EEG analysis becomes a powerful tool to detect ASD. In 2010, Ahmadlou et al. [38] presented a paper entitled “Fractality and a Wavelet-Chaos-Neural Network” for ASD diagnosis where they were compared Higuchi’s and Katz’s methods for fractal dimension computation. The best results were achieved by Katz’s dimension.
3.1.4 Depression
Depression is a common and serious psychiatric disorder. It is generally characterized by feelings such as sadness, fatigue, discouragement, helplessness, despair, or hopelessness that continue for several months or longer [39]. The analysis of EEGs may reveal information concerning the evolution of the brain signal affected by depression [40, 41]. Despite the high incidence in the population, diagnosis for depression mainly consists on a combination of both an interview and a questionnarie about the observation of subjetive symptoms.
Higuchi’s and Katz’s dimensions combined with wavelet-chaos techniques were used as indicators of depressive disorders by Ahmadlou et al. [42]. Authors claimed that Higuchi’s dimension shows meaningful differences between both healthy and depressive groups. In 2013, band power, Higuchi’s dimension, DFA, correlation dimension, and Largest Lyapunov Exponentswere considered as classifiers to discriminate depression patients and normal controls [40]. The same year, Bachmann et al. [41] computed spectral asymmetry index and Higuchi’s dimension as features, obtaining similar results for depression identification. Later, in 2015, Acharya et al. [43] presented the novel Depression Diagnosis Index with satisfactory results. That work, fractal dimension, Largest Lyapunov Exponents, sample entropy, DFA, higher order spectra, and recurrence quantification analysis were involved for feature extraction and then combined.
3.1.5 Parkinson, Alzheimer, and schizophrenia
Alzheimer’s disease is a type of dementia characterized by the gradual destruction of the patient’s brain cells, neurofibrillary tangles, and senile plaques in different widespread brain regions [44]. In 2011, Ahmadlou et al. [45] applied both Katz’s and Higuchi’s dimensions as markers of abnormality in Alzheimer’s disease. Later, in 2016, Smith et al. [46] reported that Higuchi’s dimension becomes sensitive to brain activity changes typical in healthy aging and Alzheimer’s disease.
Other application consists of characterizing Parkinson’s disease (PD, hereafter). The pathophysiology of PD is known to involve altered patterns of neuronal firing and synchronization in cortical-basal ganglia circuits. One window into the nature of the aberrant temporal dynamics in the cerebral cortex of PD patients can be derived from analysis of the patients electroencephalography [47]. Only a few published works characterize PD via fractal analysis of time series. In 2016 appeared an interesting study where emotions in Parkinson subjects were detected by means of approximate entropy, correlation dimension, DFA, fractal dimension, higher order spectrum, Largest Lyapunov Exponents, and sample entropy for feature extraction [48].
On the other hand, schizofrenia is a severe and persistent debilitating psychiatric disorder that affects approximately 0.4−0.6%of the world’s population. Patients show disturbances in thoughts, affects, and perceptions, as well as difficulties in relationships with others [49]. In 2011, Sabeti et al. [49] applied fractal dimension combined with power spectrum and autoregressive coefficients to distinguish schizophrenic patients and control participants reporting satisfactory results. In 2016, Yu et al. [50] computed the box-counting dimension to estimate the cool executive function of EEG data recorded from first-episode schizophrenia patients and healthy controls during the performance of three cool executive function tasks. Results showed that the fractal dimension was different in first-episode schizophrenia patients during the manipulation of an executive function.
3.2 Non-medical applications
As it was stated above, fractal-based techniques have been also applied to deal with non-medical biosignals. Below we review some of them.
3.2.1 Brain Computer Interface
A Brain Computer Interface (BCI) system acquires and analyzes EEG signals to allow a direct communication and control pathway from the human brain to a computer [51]. At the beginning, BCI was used as a medical tool to allow communication or movements of people with severe disabilities. However, in the last years, researchers have applied BCI systems in different areas such as gaming, home automation, communication systems, robotics, …, etc [52].
Although linear features have been intensively used in BCI systems [52, 53], nonlinear techniques have been also applied to tackle with BCI applications. In 2010, Hsu [54] applied wavelet fractal features in a motor imagery paradigm BCI system to identify the movement of both the left and right hands. The next year, multiresolution fractal feature vectors were computed as well as a modified fractal dimension from wavelet data to develop an asynchronous BCI system [55]. Later, in 2013, it was presented an study based on multiresolution fractal feature vectors for Motor Imagery BCI [56]. On the other hand, in 2011, Esfahani et al. [57] used Largest Lyapunov Exponents with band power features to identify the satisfaction of the user in human-robot interaction. Also, Katz’s and Higuchi’s dimensions, R/S analysis, and Renyi’s entropywere tested by Loo et al. [58] to carry out a detailed comparison involving some feature extraction techniques in motor imagery-based BCI. It is worth pointing out that the best results were achieved by Katz’s dimension together with a fuzzy k−nearest neighbors classifier. In 2013, Wang and Sourina [59] presented a novel method to recognize mental arithmetic tasks for multifractal analysis of EEG signals named generalized Higuchi’s fractal dimension spectrum. Additionally, they were extracted power spectrum, autoregressive coefficients, and statistical features from EEGs. The results achieved got improved in both multi-channel and one-channel subject-dependent algorithms. Later, in 2015, Rodriguez et al. developed a study involving three approaches (DFA, GM2, and Generalized Hurst Exponent) for self-similarity exponent calculation purposes and compared them to deal with feature extraction in Motor Imagery Based Brain Computer Interface Systems [60].
3.2.2 Emotion recognition
It is worth mentioning that a real-time approach based on EEG emotion recognition may lead researchers to new pathways in human computer interaction involving many applications including entertainment, education, and medical applications to name a few [61].
A technology for biosignal analysis could be more interesting than some already existing emotion recognition systems based on the user’s face or gestures since it could allow to reflect the “true” emotion of the user [62].
In 2012, Sourina et al. [62] proposed an emotion recognition algorithm allowing to recognize 6 different emotions in real-time. The emotions were generated by using the International Affective Digitized Sounds (IADS). That work, fractal dimension values were computed by both box-counting and Higuchi’s algorithms and them used for feature classification.
4 Conclusions
This article provides an updated state-of-the-art regarding some applications of fractal-based techniques to test for fractality patterns in physiological time series. Firstly, we technically describe several approaches to properly deal with the calculation of the self-similarity exponent of a time series. They include broadly-used algorithms as well as recent procedures improving their accuracy and performance for a wide range of self-similar processes. In addition, we contribute a detailed review involving some high-quality studies developed in the context of electroencephalogram signals. Both medical and non-medical applications are deeply reviewed and commented as well.
Acknowledgement
The last author is partially supported by grants No. MTM2015-64373-P from Spanish Ministry of Economy and Competitiveness and No. 19219/PI/14 from Fundación Séneca of Región de Murcia.
References
[1] Sánchez-Granero M.A., Fernández-Martínez M., Trinidad Segovia J.E., Introducing fractal dimension algorithms to calculate the Hurst exponent of financial time series, Eur. Phys. J. B, 2012, 85: 86, https://doi.org/10.1140/epjb/e2012-20803-210.1140/epjb/e2012-20803-2Search in Google Scholar
[2] Rodríguez-Bermúdez G., García-Laencina P.J., Analysis of EEG Signals using Nonlinear Dynamics and Chaos: A review, Appl. Math. Inf. Sci., 2015, 9, 2309–2321.Search in Google Scholar
[3] Palaniappan R., Biological Signal Analysis, Ventus Publishing ApS, 2010.Search in Google Scholar
[4] Schomer D. L., Da Silva F. L., Niedermeyer’s Electroencephalography, Basic Principles, Clinical Applications, and Related Fields, 6th ed., Lippincott Williams & Wilkins, 2011.Search in Google Scholar
[5] Mandelbrot B.B., Wallis J.R., Robustness of the rescaled range R/S in the measurement of noncyclic long run statistical dependence, Water Resour. Res., 1969, 5, 967–988.10.1029/WR005i005p00967Search in Google Scholar
[6] Hurst H.E., Long-term storage capacity of reservoirs, Transactions of the American Society of Civil Engineers, 1951, 116, 770–799.10.1061/TACEAT.0006518Search in Google Scholar
[7] Mandelbrot B.B., When Can Price be Arbitraged Efflciently? A Limit to the Validity of the Random Walk and Martingale Models, Rev. Econ. Stat., 1971, 53, 225–236.10.2307/1937966Search in Google Scholar
[8] Mandelbrot B.B., Statistical Methodology for Nonperiodic Cycles: From the Covariance to R/S Analysis, Annals of Economic and Social Measurement, 1972, 1, 259–290.Search in Google Scholar
[9] Mandelbrot B.B., Fractals and Scaling in Finance. Discontinuity, Concentration, Risk. Selecta Volume E, 1st ed., Springer-Verlag, New York, 1997.10.1007/978-1-4757-2763-0Search in Google Scholar
[10] Peng C.-K., Buldyrev S.V., Havlin S., Simons M., Stanley H.E., Goldberger A.L., Mosaic organization of DNA nucleotides, Phys. Rev. E, 1994, 49, 1685–1689.10.1103/PhysRevE.49.1685Search in Google Scholar
[11] Ausloos M., Statistical physics in foreign exchange currency and stock markets, Physica A, 2000, 285, 48–65.10.1016/S0378-4371(00)00271-5Search in Google Scholar
[12] Di Matteo T., Aste T., Dacorogna M.M., Long-term memories of developed and emerging markets: Using the scaling analysis to characterize their stage of development, J. Bank Financ., 2005, 29, 827–851.10.1016/j.jbankfin.2004.08.004Search in Google Scholar
[13] Liu Y., Cizeau P., Meyer M., Peng C.-K., Stanley H.E., Correlations in economic time series, Physica A, 1997, 245, 437–440.10.1016/S0378-4371(97)00368-3Search in Google Scholar
[14] Montanari A., Taqqu M.S., Teverovsky V., Estimating long-range dependence in the presence of periodicity: An empirical study, Math. Comput. Model., 1999, 29, 217–228.10.1016/S0895-7177(99)00104-1Search in Google Scholar
[15] Sánchez Granero M.A., Trinidad Segovia J.E., García Pérez J., Some comments on Hurst exponent and the long memory processes on capital markets, Physica A, 2008, 387, 5543–5551.10.1016/j.physa.2008.05.053Search in Google Scholar
[16] Trinidad Segovia J.E., Fernández-Martínez M., Sánchez-Granero M.A., A note on geometric method-based procedures to calculate the Hurst exponent, Physica A, 2012, 391, 2209–2214.10.1016/j.physa.2011.11.044Search in Google Scholar
[17] Stam C.J., Nonlinear dynamical analysis of EEG and MEG: Review of an emerging field, Clin. Neurophysiol., 2005, 116, 2266–2301.10.1016/j.clinph.2005.06.011Search in Google Scholar PubMed
[18] Wang Q., Sourina O., Nguyen M.K., Fractal dimension based neurofeedback in serious games, Visual Comput., 2011, 27, 299–309.10.1007/s00371-011-0551-5Search in Google Scholar
[19] Lopes R., Betrouni N., Fractal and multifractal analysis: A review, Med. Image Anal., 2009, 13, 634–649.10.1016/j.media.2009.05.003Search in Google Scholar PubMed
[20] Iasemidis L.D., Sackellares J.C., The evolution with time of the spatial distribution of the largest Lyapunov exponent on the human epileptic cortex, In: Duke, D.W. and Pritchard, W.S. (Eds.), Measuring Chaos in the human brain, World Scientific, Singapore, 1991.Search in Google Scholar
[21] Mormann F., Andrzejak R.G., Elger C.E., Lehnertz K., Seizure prediction: the long and winding road, Brain, 2007, 130, 314–333.10.1093/brain/awl241Search in Google Scholar PubMed
[22] Dang Khoa T.Q., Minh Huong N.T., Van Toi, V., Detecting Epileptic Seizure from Scalp EEG Using Lyapunov Spectrum, Comput.Math. Method Med., 2012, http://dx.doi.org/10.1155/2012/84768610.1155/2012/847686Search in Google Scholar PubMed PubMed Central
[23] Fergus P., Hignett D., Hussain A., Al-Jumeily D., Abdel-Aziz K., Automatic Epileptic Seizure Detection Using Scalp EEG and Advanced Artificial Intelligence Techniques, Biomed Res. Int., 2015, http://dx.doi.org/10.1155/2015/98673610.1155/2015/986736Search in Google Scholar PubMed PubMed Central
[24] Yuan Q., Zhou W., Li S., Cai D., Epileptic EEG classification based on extreme learning machine and nonlinear features, Epilepsy Res., 2011, 96, 29–38.10.1016/j.eplepsyres.2011.04.013Search in Google Scholar PubMed
[25] Acharya U.R., Sree S.V., Chuan Alvin A.P., Yanti R., Suri J.S., Application of non–linearand wavelet based features for the automated identification of epileptic EEG signals, Int. J. Neural Syst., 2012, 22, https://doi.org/10.1142/S012906571250002510.1142/S0129065712500025Search in Google Scholar PubMed
[26] Zhou W., Liu Y., Yuan Q., Li X., Epileptic Seizure Detection Using Lacunarity and Bayesian Linear Discriminant Analysis in Intracranial EEG, IEEE Trans. Biomed. Eng., 2013, 60, 3375–3381.10.1109/TBME.2013.2254486Search in Google Scholar PubMed
[27] Namazi H., Kulish V.V., Hussaini J., Hussaini J., Delaviz A., Delaviz F., Habibi S., Ramezanpoor S., A signal processing based analysis and prediction of seizure onset in patients with epilepsy, Oncotarget, 2016, 7, 342–350.10.18632/oncotarget.6341Search in Google Scholar PubMed PubMed Central
[28] Upadhyay R., Padhy P.K., Kankar P.K., A comparative study of feature ranking techniques for epileptic seizure detection using wavelet transform, Comput. Electr. Eng., 2016, 53, 163–176.10.1016/j.compeleceng.2016.05.016Search in Google Scholar
[29] Cusenza M., Fractal analysis of the EEG and clinical applications, PhD thesis, Università degli studi di Trieste, Italy, 2012.Search in Google Scholar
[30] Shoushtarian M., Sahinovic M.M., Absalom A.R., Kalmar A.F., Vereecke H.E.M., Liley D.T.J., Struys M.R.F., Comparisons of Electroencephalographically Derived Measures of Hypnosis and Antinociception in Response to Standardized Stimuli During Target-Controlled Propofol-Remifentanil Anesthesia, Anesth. Analg., 2016, 122, 382–392.10.1213/ANE.0000000000001029Search in Google Scholar PubMed
[31] Shalbaf R., Behnam H., Moghadam H.J., Monitoring depth of anesthesia using combination of EEG measure and hemodynamic variables, Cogn. Neurodynamics, 2015, 9, 41–51.10.1007/s11571-014-9295-zSearch in Google Scholar PubMed PubMed Central
[32] Shalbaf R., Behnam H., Sleigh J.W., Steyn-Ross A., Voss L.J., Monitoring the depth of anesthesia using entropy features and an artificial neural network, J. Neurosci. Methods, 2013, 218, 17–24.10.1016/j.jneumeth.2013.03.008Search in Google Scholar PubMed
[33] Pradhan C., Jena S.K., Nadar S.R., Pradhan N., Higher-Order Spectrum in Understanding Nonlinearity in EEG Rhythms, Comput. Math. Method Med., 2012, http://dx.doi.org/10.1155/2012/20685710.1155/2012/206857Search in Google Scholar PubMed PubMed Central
[34] Zoughi T., Boostani R., Deypir M., A wavelet-based estimating depth of anesthesia, Eng. Appl. Artif. Intell., 2012, 25, 1710 1722.10.1016/j.engappai.2011.10.006Search in Google Scholar
[35] Kuhlmann L., Freestone D.R., Manton J.H., Heyse B., Vereecke H.E.M., Lipping T., Struys M.M.R.F., Liley D.T.J., Neural mass model-based tracking of anesthetic brain states, NeuroImage, 2016, 133, 438–456.10.1016/j.neuroimage.2016.03.039Search in Google Scholar PubMed
[36] Kuhlmann L.,Manton J.H., Heyse B., Vereecke H.E.M., Lipping T., Struys M.M.R.F., Liley D.T.J., Tracking Electroencephalographic Changes Using Distributions of Linear Models: Application to Propofol-Based Depth of Anesthesia Monitoring, IEEE Trans. Biomed. Eng., 2017, 64, 870–881.10.1109/TBME.2016.2562261Search in Google Scholar PubMed
[37] Buckley A.W., Scott R., Tyler A., Matthew Mahoney J., Thurm A., Farmer C., Swedo S., Burroughs S.A., Holmes G.L., State-Dependent Differences in Functional Connectivity in Young Children With Autism Spectrum Disorder, EBioMedicine, 2015, 2, 1905–1915.10.1016/j.ebiom.2015.11.004Search in Google Scholar PubMed PubMed Central
[38] Ahmadlou M., Adeli H., Adeli A., Fractality and a Wavelet-Chaos-Neural Network Methodology for EEG-Based Diagnosis of Autistic Spectrum Disorder, J. Clin. Neurophysiol., 2010, 27, 328–333.10.1097/WNP.0b013e3181f40dc8Search in Google Scholar PubMed
[39] Akar S.A., Kara S., Agambayev S., Bilgiç V., Nonlinear analysis of EEG in major depression with fractal dimensions, In: Engineering in Medicine and Biology Society (EMBC), 37th Annual International Conference of the IEEE, 2015, 7410–7413.10.1109/EMBC.2015.7320104Search in Google Scholar PubMed
[40] Hosseinifard B., Hassan Moradi M., Rostami R., Classifying depression patients and normal subjects using machine learning techniques and nonlinear features from EEG signal, Comput. Meth. Programs Biomed., 2013, 109, 339–345.10.1016/j.cmpb.2012.10.008Search in Google Scholar PubMed
[41] Bachmann M., Lass J., Suhhova A., Hinrikus H., Spectral Asymmetry and Higuchi’s Fractal Dimension Measures of Depression Electroencephalogram, Comput. Math. Method Med., 2013, http://dx.doi.org/10.1155/2013/25163810.1155/2013/251638Search in Google Scholar PubMed PubMed Central
[42] Ahmadlou M., Adeli H., Adeli A., Fractality analysis of frontal brain in major depressive disorder, Int. J. Psychophysiol., 2012, 85, 206–211.10.1016/j.ijpsycho.2012.05.001Search in Google Scholar PubMed
[43] Acharya U.R., Sudarshan V.K., Adeli H., Santhosh J., Koh J.E.W., Puthankatti S.D., Adeli A., A Novel Depression Diagnosis Index Using Nonlinear Features in EEG Signals, Eur. Neurol., 2015, 74, 79–83.10.1159/000438457Search in Google Scholar PubMed
[44] Mizuno T., Takahashi T., Cho R.Y., Kikuchi M., Murata T., Takahashi K., Wada Y., Assessment of EEG dynamical complexity in Alzheimer’s disease using multiscale entropy, Clin. Neurophysiol., 2010, 121, 1438–1446.10.1016/j.clinph.2010.03.025Search in Google Scholar PubMed PubMed Central
[45] Ahmadlou M., Adeli H., Adeli A., Fractality and a Wavelet-chaos-Methodology for EEG-based Diagnosis of Alzheimer Disease, Alzheimer Dis. Assoc. Dis., 2011, 25, 85–92.10.1097/WAD.0b013e3181ed1160Search in Google Scholar PubMed
[46] Smits F.M., Porcaro C., Cottone C., Cancelli A., Rossini P.M., Tecchio F., Electroencephalographic Fractal Dimension in Healthy Ageing and Alzheimer’s Disease, PLoS One, 2016, https://doi.org/10.1371/journal.pone.014958710.1371/journal.pone.0149587Search in Google Scholar PubMed PubMed Central
[47] Lainscsek C., Hernandez M.E., Weyhenmeyer J., Sejnowski T.J., Poizner H., non–lineardynamical analysis of EEG time series distinguishes patients with Parkinson’s disease from healthy individuals, Front. Neurol., 2013, https://doi.org/10.3389/fneur.2013.0020010.3389/fneur.2013.00200Search in Google Scholar
[48] Yuvaraj R.,Murugappan M., Hemispheric asymmetry non–linearanalysis of EEG during emotional responses from idiopathic Parkinson’s disease patients, Cogn. Neurodynamics, 2016, 10, 225–234.10.1007/s11571-016-9375-3Search in Google Scholar
[49] Sabeti M., Katebi S.D., Boostani R., Price G.W., A new approach for EEG signal classification of schizophrenic and control participants, Expert Syst. Appl., 2011, 38, 2063–2071.10.1016/j.eswa.2010.07.145Search in Google Scholar
[50] Yu Y., Zhao Y., Si Y., Ren Q., Ren W., Jing C., Zhang H., Estimation of the cool executive function using frontal electroencephalogram signals in first-episode schizophrenia patients, Biomed. Eng. Online, 2016, 15: 131, https://doi.org/10.1186/s12938-016-0282-y10.1186/s12938-016-0282-ySearch in Google Scholar
[51] Wolpaw J.R., Birbaumer N., McFarland D.J., Pfurtscheller G., Vaughan T.M., Brain-computer interfaces for communication and control, Clin. Neurophysiol., 2002, 113, 767–791.10.1016/S1388-2457(02)00057-3Search in Google Scholar
[52] Nicolas-Alonso L.F., Gomez-Gil J., Brain Computer Interfaces, a Review, Sensors, 2012, 12, 1211–1279.10.3390/s120201211Search in Google Scholar PubMed PubMed Central
[53] Lotte F., Congedo M., Lécuyer A., Lamarche F., Arnaldi B., A review of classification algorithms for EEG-based brain-computer interfaces, J. Neural Eng., 2007, 4, R1-R13.10.1088/1741-2560/4/2/R01Search in Google Scholar PubMed
[54] Hsu W.-Y., EEG-based motor imagery classification using neuro-fuzzy prediction and wavelet fractal features, J. Neurosci. Methods, 2010, 189, 295–302.10.1016/j.jneumeth.2010.03.030Search in Google Scholar PubMed
[55] HsuW.-Y., Continuous EEG signal analysis for asynchronous BCI application, Int. J. Neural Syst., 2011, 21, 335–450.10.1142/S0129065711002870Search in Google Scholar PubMed
[56] Hsu W.-Y., Single-trial motor imagery classification using asymmetry ratio, phase relation, wavelet-based fractal, and their selected combination, Int. J. Neural Syst., 2013, 23, https://doi.org/10.1142/S012906571350007X10.1142/S012906571350007XSearch in Google Scholar PubMed
[57] Esfahani E.T., Sundararajan V., Using brain-computer interfaces to detect human satisfaction in human-robot interaction, Int. J. Humanoid Robot., 2011, 8, 87–101.10.1142/S0219843611002356Search in Google Scholar
[58] Loo C.K., Samraj A., Lee G.C., Evaluation of Methods for Estimating Fractal Dimension in Motor Imagery-Based Brain Computer Interface, Discrete Dyn. Nat. Soc., 2011, http://dx.doi.org/10.1155/2011/72469710.1155/2011/724697Search in Google Scholar
[59] Wang Q., Sourina O., Real-Time Mental Arithmetic Task Recognition From EEG Signals, IEEE Trans. Neural Syst. Rehabil. Eng., 2013, 21, 225–232.10.1109/TNSRE.2012.2236576Search in Google Scholar PubMed
[60] Rodríguez-Bermúdez G., Sánchez-Granero M.A., García-Laencina P.J., Fernández-Martínez M., Serna J., Roca-Dorda J., Testing the Self-Similarity Exponent to Feature Extraction in Motor Imagery Based Brain Computer Interface Systems, Int. J. Bifurcation Chaos, 2015, 25, https://doi.org/10.1142/S021812741540023410.1142/S0218127415400234Search in Google Scholar
[61] Calvo R.A., D’Mello S., Affect Detection: An Interdisciplinary Review of Models, Methods, and Their Applications, IEEE Trans. Affect. Comput., 2010, 1, 18–37.10.1109/T-AFFC.2010.1Search in Google Scholar
[62] Sourina O., Liu Y., Nguyen M.K., Real-time EEG-based emotion recognition for music therapy, J. Multimodal User Interfaces, 2012, 5, 27–35.10.1007/s12193-011-0080-6Search in Google Scholar
© 2018 J. Roca et al., published by De Gruyter
This work is licensed under the Creative Commons Attribution-NonCommercial-NoDerivatives 4.0 License.
Articles in the same Issue
- Regular Articles
- A modified Fermi-Walker derivative for inextensible flows of binormal spherical image
- Algebraic aspects of evolution partial differential equation arising in the study of constant elasticity of variance model from financial mathematics
- Three-dimensional atom localization via probe absorption in a cascade four-level atomic system
- Determination of the energy transitions and half-lives of Rubidium nuclei
- Three phase heat and mass transfer model for unsaturated soil freezing process: Part 1 - model development
- Three phase heat and mass transfer model for unsaturated soil freezing process: Part 2 - model validation
- Mathematical model for thermal and entropy analysis of thermal solar collectors by using Maxwell nanofluids with slip conditions, thermal radiation and variable thermal conductivity
- Constructing analytic solutions on the Tricomi equation
- Feynman diagrams and rooted maps
- New type of chaos synchronization in discrete-time systems: the F-M synchronization
- Unsteady flow of fractional Oldroyd-B fluids through rotating annulus
- A note on the uniqueness of 2D elastostatic problems formulated by different types of potential functions
- On the conservation laws and solutions of a (2+1) dimensional KdV-mKdV equation of mathematical physics
- Computational methods and traveling wave solutions for the fourth-order nonlinear Ablowitz-Kaup-Newell-Segur water wave dynamical equation via two methods and its applications
- Siewert solutions of transcendental equations, generalized Lambert functions and physical applications
- Numerical solution of mixed convection flow of an MHD Jeffery fluid over an exponentially stretching sheet in the presence of thermal radiation and chemical reaction
- A new three-dimensional chaotic flow with one stable equilibrium: dynamical properties and complexity analysis
- Dynamics of a dry-rebounding drop: observations, simulations, and modeling
- Modeling the initial mechanical response and yielding behavior of gelled crude oil
- Lie symmetry analysis and conservation laws for the time fractional simplified modified Kawahara equation
- Solitary wave solutions of two KdV-type equations
- Applying industrial tomography to control and optimization flow systems
- Reconstructing time series into a complex network to assess the evolution dynamics of the correlations among energy prices
- An optimal solution for software testing case generation based on particle swarm optimization
- Optimal system, nonlinear self-adjointness and conservation laws for generalized shallow water wave equation
- Alternative methods for solving nonlinear two-point boundary value problems
- Global model simulation of OH production in pulsed-DC atmospheric pressure helium-air plasma jets
- Experimental investigation on optical vortex tweezers for microbubble trapping
- Joint measurements of optical parameters by irradiance scintillation and angle-of-arrival fluctuations
- M-polynomials and topological indices of hex-derived networks
- Generalized convergence analysis of the fractional order systems
- Porous flow characteristics of solution-gas drive in tight oil reservoirs
- Complementary wave solutions for the long-short wave resonance model via the extended trial equation method and the generalized Kudryashov method
- A Note on Koide’s Doubly Special Parametrization of Quark Masses
- On right-angled spherical Artin monoid of type Dn
- Gas flow regimes judgement in nanoporous media by digital core analysis
- 4 + n-dimensional water and waves on four and eleven-dimensional manifolds
- Stabilization and Analytic Approximate Solutions of an Optimal Control Problem
- On the equations of electrodynamics in a flat or curved spacetime and a possible interaction energy
- New prediction method for transient productivity of fractured five-spot patterns in low permeability reservoirs at high water cut stages
- The collinear equilibrium points in the restricted three body problem with triaxial primaries
- Detection of the damage threshold of fused silica components and morphologies of repaired damage sites based on the beam deflection method
- On the bivariate spectral quasi-linearization method for solving the two-dimensional Bratu problem
- Ion acoustic quasi-soliton in an electron-positron-ion plasma with superthermal electrons and positrons
- Analysis of projectile motion in view of conformable derivative
- Computing multiple ABC index and multiple GA index of some grid graphs
- Terahertz pulse imaging: A novel denoising method by combing the ant colony algorithm with the compressive sensing
- Characteristics of microscopic pore-throat structure of tight oil reservoirs in Sichuan Basin measured by rate-controlled mercury injection
- An activity window model for social interaction structure on Twitter
- Transient thermal regime trough the constitutive matrix applied to asynchronous electrical machine using the cell method
- On the zagreb polynomials of benzenoid systems
- Integrability analysis of the partial differential equation describing the classical bond-pricing model of mathematical finance
- The Greek parameters of a continuous arithmetic Asian option pricing model via Laplace Adomian decomposition method
- Quantifying the global solar radiation received in Pietermaritzburg, KwaZulu-Natal to motivate the consumption of solar technologies
- Sturm-Liouville difference equations having Bessel and hydrogen atom potential type
- Study on the response characteristics of oil wells after deep profile control in low permeability fractured reservoirs
- Depiction and analysis of a modified theta shaped double negative metamaterial for satellite application
- An attempt to geometrize electromagnetism
- Structure of traveling wave solutions for some nonlinear models via modified mathematical method
- Thermo-convective instability in a rotating ferromagnetic fluid layer with temperature modulation
- Construction of new solitary wave solutions of generalized Zakharov-Kuznetsov-Benjamin-Bona-Mahony and simplified modified form of Camassa-Holm equations
- Effect of magnetic field and heat source on Upper-convected-maxwell fluid in a porous channel
- Physical cues of biomaterials guide stem cell fate of differentiation: The effect of elasticity of cell culture biomaterials
- Shooting method analysis in wire coating withdrawing from a bath of Oldroyd 8-constant fluid with temperature dependent viscosity
- Rank correlation between centrality metrics in complex networks: an empirical study
- Special Issue: The 18th International Symposium on Electromagnetic Fields in Mechatronics, Electrical and Electronic Engineering
- Modeling of electric and heat processes in spot resistance welding of cross-wire steel bars
- Dynamic characteristics of triaxial active control magnetic bearing with asymmetric structure
- Design optimization of an axial-field eddy-current magnetic coupling based on magneto-thermal analytical model
- Thermal constitutive matrix applied to asynchronous electrical machine using the cell method
- Temperature distribution around thin electroconductive layers created on composite textile substrates
- Model of the multipolar engine with decreased cogging torque by asymmetrical distribution of the magnets
- Analysis of spatial thermal field in a magnetic bearing
- Use of the mathematical model of the ignition system to analyze the spark discharge, including the destruction of spark plug electrodes
- Assessment of short/long term electric field strength measurements for a pilot district
- Simulation study and experimental results for detection and classification of the transient capacitor inrush current using discrete wavelet transform and artificial intelligence
- Magnetic transmission gear finite element simulation with iron pole hysteresis
- Pulsed excitation terahertz tomography – multiparametric approach
- Low and high frequency model of three phase transformer by frequency response analysis measurement
- Multivariable polynomial fitting of controlled single-phase nonlinear load of input current total harmonic distortion
- Optimal design of a for middle-low-speed maglev trains
- Eddy current modeling in linear and nonlinear multifilamentary composite materials
- The visual attention saliency map for movie retrospection
- AC/DC current ratio in a current superimposition variable flux reluctance machine
- Influence of material uncertainties on the RLC parameters of wound inductors modeled using the finite element method
- Cogging force reduction in linear tubular flux switching permanent-magnet machines
- Modeling hysteresis curves of La(FeCoSi)13 compound near the transition point with the GRUCAD model
- Electro-magneto-hydrodynamic lubrication
- 3-D Electromagnetic field analysis of wireless power transfer system using K computer
- Simplified simulation technique of rotating, induction heated, calender rolls for study of temperature field control
- Design, fabrication and testing of electroadhesive interdigital electrodes
- A method to reduce partial discharges in motor windings fed by PWM inverter
- Reluctance network lumped mechanical & thermal models for the modeling and predesign of concentrated flux synchronous machine
- Special Issue Applications of Nonlinear Dynamics
- Study on dynamic characteristics of silo-stock-foundation interaction system under seismic load
- Microblog topic evolution computing based on LDA algorithm
- Modeling the creep damage effect on the creep crack growth behavior of rotor steel
- Neighborhood condition for all fractional (g, f, n′, m)-critical deleted graphs
- Chinese open information extraction based on DBMCSS in the field of national information resources
- 10.1515/phys-2018-0079
- CPW-fed circularly-polarized antenna array with high front-to-back ratio and low-profile
- Intelligent Monitoring Network Construction based on the utilization of the Internet of things (IoT) in the Metallurgical Coking Process
- Temperature detection technology of power equipment based on Fiber Bragg Grating
- Research on a rotational speed control strategy of the mandrel in a rotary steering system
- Dynamic load balancing algorithm for large data flow in distributed complex networks
- Super-structured photonic crystal fiber Bragg grating biosensor image model based on sparse matrix
- Fractal-based techniques for physiological time series: An updated approach
- Analysis of the Imaging Characteristics of the KB and KBA X-ray Microscopes at Non-coaxial Grazing Incidence
- Application of modified culture Kalman filter in bearing fault diagnosis
- Exact solutions and conservation laws for the modified equal width-Burgers equation
- On topological properties of block shift and hierarchical hypercube networks
- Elastic properties and plane acoustic velocity of cubic Sr2CaMoO6 and Sr2CaWO6 from first-principles calculations
- A note on the transmission feasibility problem in networks
- Ontology learning algorithm using weak functions
- Diagnosis of the power frequency vacuum arc shape based on 2D-PIV
- Parametric simulation analysis and reliability of escalator truss
- A new algorithm for real economy benefit evaluation based on big data analysis
- Synergy analysis of agricultural economic cycle fluctuation based on ant colony algorithm
- Multi-level encryption algorithm for user-related information across social networks
- Multi-target tracking algorithm in intelligent transportation based on wireless sensor network
- Fast recognition method of moving video images based on BP neural networks
- Compressed sensing image restoration algorithm based on improved SURF operator
- Design of load optimal control algorithm for smart grid based on demand response in different scenarios
- Face recognition method based on GA-BP neural network algorithm
- Optimal path selection algorithm for mobile beacons in sensor network under non-dense distribution
- Localization and recognition algorithm for fuzzy anomaly data in big data networks
- Urban road traffic flow control under incidental congestion as a function of accident duration
- Optimization design of reconfiguration algorithm for high voltage power distribution network based on ant colony algorithm
- Feasibility simulation of aseismic structure design for long-span bridges
- Construction of renewable energy supply chain model based on LCA
- The tribological properties study of carbon fabric/ epoxy composites reinforced by nano-TiO2 and MWNTs
- A text-Image feature mapping algorithm based on transfer learning
- Fast recognition algorithm for static traffic sign information
- Topical Issue: Clean Energy: Materials, Processes and Energy Generation
- An investigation of the melting process of RT-35 filled circular thermal energy storage system
- Numerical analysis on the dynamic response of a plate-and-frame membrane humidifier for PEMFC vehicles under various operating conditions
- Energy converting layers for thin-film flexible photovoltaic structures
- Effect of convection heat transfer on thermal energy storage unit