Global model simulation of OH production in pulsed-DC atmospheric pressure helium-air plasma jets
-
Saša Gocić
 and
Željko Mladenović
and
Željko Mladenović

Abstract
The results of global model simulation of an atmospheric pressure pulsed-DC helium plasma jet propagated in humid air, compared to the results of fluid model, are presented in this paper. The primary tasks of presented simulation were determination of the density and the main production pathways of OH radicals. The calculation reveals that global model gives higher OH densities than fluid model, especially at higher electron temperatures. This overestimation is mainly caused by the intrinsic assumptions of the global model, which impose limitations on its application for modelling of very transient physical processes such are streamers or plasma bullets. The main OH production and loss processes are well recognized by global model, and additional mechanisms are involved with respect to the case of fluid modelling. According to the presented results, global model will give satisfactory assessment of OH density and overall chemical composition of modelled plasmas, if the air fraction, electron density and temperature are correctly determined.
1 Introduction
The fast growing application of complex water-containing plasma systems in various fields, such as material processing [1, 2], bio-medical applications [3], surface modification [4], puts new requirements on the level of their understanding.
Special attention in the last decade was put on production of atmospheric pressure plasmas rich with OH radicals, as OH is one of the most reactive species in such systems [5]. Density and the underpinning production pathways of OH radicals can be determined both by the direct measurements [6, 7, 8] and by means of numerical modelling. Two groups of models have been mainly applied, global (volume averaged or zero-dimensional) models [9, 10, 11] and multidimensional fluid (1D or 2D) models [12, 13, 14, 15]. Despite neglecting the spatial derivatives, global model offers an opportunity of a fast assessment of chemical composition of complex plasmas, and determination of the main production pathways for all plasma species. On the other hand, modelling of plasmas formed in gas mixtures which contain humid air and/or water imposes restrictions on multidimensional models, mainly due to extremely large computational time and hardware resources.
In a recent paper [14] the result of a numerical study of the effect of water content on OH production in a pulsed-dc plasma jet in helium was presented. The main production and loss mechanisms of OH were analysed for 1%, 0.1% and 0.01% H2O contents in air. Spatial and temporal distributions of air mole fraction and streamer discharge parameters (the electron density and temperature, electric field and total ionization rates) were calculated by means of fluid modelling. The plasma chemistry set consists of 21 different species and 71 elementary reactions. This study is further extended to examination of the effects of pulse voltage rising time on discharge characteristic and plasma composition of a same gas mixture, especially on O and OH densities distributions [15].
On the other hand, global models have been used for an estimation of the chemical composition of atmospheric pressure plasmas created in mixtures containing helium as dominant gas with water [9], with real air [10], or with oxygen and water or humid-air [11]. Papers [16, 17] present an analysis of the influence of the humidity level on chemistry of reactive species in RF-driven atmospheric-pressure helium-oxygen mixture (0.5% of O2) plasmas.
The aim of this paper is to test the applicability of global model in a simulation of a pulsed-dc plasma jet in helium, described in [14]. The obtained results, particularly density and the main chemical processes responsible for creation and destruction of OH radicals, will be compared with the results of a fluid model [14]. With this idea, we have created a zero-dimensional code by using a comprehensive list of the chemical processes with rate coefficients from Appendix and supplementary data files of papers [16, 17]. Model comprises a reaction scheme with 1425 reactions for kinetics of 68 species. The results of the fluid simulation in [14] have been used as input parameters, and as a basis for testing of our model results. A similar comparison between fluid and global model has been made for the modelling of a streamer dielectric barrier discharge [18] and for atmospheric pressure radio-frequency plasmas [19].
The details of global model and the way how input parameters were adopted from Ref. [14] are summarized in Section 2. The analysis of our simulation’s results and their comparison with results obtained by fluid modelling follows in Section 3, and finally concluding remarks are given in Section 4.
2 Model description
The global model is taken in a reduced form and only the equation that describes the balance of particle number density is included. In addition, we assume that analysed plasma system is spatially homogeneous leading to the governing equations which include only the external terms of generation and loss in particle collisions [20], in the following form:
In the previous equation nα denotes concentration of species α, and the first and the second terms denote sum of the generation and loss terms of species α through specific volumetric chemical reactions and include two-body and three body processes. The rate coefficients for electron-impact processes are given as a function of the electron temperature Te in [eV] (mean electron energy) [16, 17].
Numerous global models [20], including the present work, are made for a uniform infinite system by using the mean energy as a parameter connecting different sources of input data. Determination of the mean electron energy is a very important issue in global modelling and implies solving of the electron power balance equation, simultaneously with particle balance equation for each plasma species. The mean electron energy is then assumed to be ϵ = 3/2 neTe (with Te in [eV]) based on the assumption of Maxwell-Boltzmann electron energy distribution function (EEDF). Another approach to obtain Te is to use results of a fluid model applied to the same plasma system, but with simplified chemistry set, as an input to the global model [12, 16]. We chose the former approach for our work, with idea to compare results of the plasma chemical part of the global and fluid models, with the same discharge parameters (i.e. electron density and electron temperature).
The simulation domain is fully described in papers [14, 15] and Figure 1 shows rough sketch of schematics of the plasma jet. When the positive voltage pulse is applied, starting from a needle tip area (anode), the discharge zone expands 2.3mm radially to the dielectric wall, and 3mm axially to the quartz plate. The grounded metal plate is assumed to be behind the quartz plate. The working gas is pure helium flowing into domain filled with humid air.
![Figure 1 (Colour online) Schematic of simulated plasma jet from [14]
with marked position and values of: a) electron temperature (red contours), b) maxima of OH density (magenta contours), c) higher electron density (brown contour), and d) lower electron densities (aqua blue contours), estimated from 2D model results [14]](/document/doi/10.1515/phys-2018-0051/asset/graphic/j_phys-2018-0051_fig_001.jpg)
(Colour online) Schematic of simulated plasma jet from [14] with marked position and values of: a) electron temperature (red contours), b) maxima of OH density (magenta contours), c) higher electron density (brown contour), and d) lower electron densities (aqua blue contours), estimated from 2D model results [14]
The estimation of input parameter from 2D simulation results is very important for application of global model, which basically deals with volume average quantities. Since the results in [14] were present in form from which volume average electron density and electron temperature cannot be correctly extracted, we decided to cover the whole interval of ne and Te. The spatial distributions of ne and Te presented in Figures 3a and 3b [14] are marked in Figure 1, together with position of maximal OH production. It is obvious that figure represents final stage of plasma plume (or streamer head) growth, with ne and Te distribution in that moment. According to figure 1, the region of maximal OH production overlaps with region where electron density is around 1.5·1013cm−3 and electron temperature between 6eV and 9eV. Bearing in mind fast streamer development and non-homogeneity of discharge process, [19, 21, 22, 23, 24], the early phase of streamer growth, with ne and Te distribution which differ from those in Figure 1, needs to be taken in consideration. So, we chose to run our code with the electron density’s values between 1.0·1013cm−3 and 6.0·1013cm−3, and with the range of electron temperatures from 1.5eV to 9.0eV, estimated from the spatial distributions of ne and Te presented in Figures 3a and 3b [14] and in Figure 1. Another important input parameter for modelling of atmospheric pressure plasma jet expanding in free air is the helium-air mixing ratio in the jet zone. In our calculation we estimated that, according to spatial overlapping of the position of OH density maxima and region with ne ≥ 1.5·1011cm−3 in Figure 1 with the air molar fraction distribution in Figure 1b in [14], the value around 5% can be taken as the maximum of the air amount in zone of plume propagation. On the other hand, the results of numerical simulation in recent paper [24] showed that the air amount in helium higher than 0.5% slows down streamer development in He/air mixture, through lowering of the electron energy peak value. Based on these results, we limited the air mole fraction to 0.01 (1% of air in helium). Finally, the input parameters in our simulation are as follows: air mole fraction in plasma zone is 1%, H2O contents in air are 1%, 0.1% and 0.01%, and peak values of N2 and O2 are (0.78, 0.21), (0.788, 0.211), (0.7888, 0.2111), respectively.
The system of rate-equations is solved by MATLAB ODE15s solver, with relative and absolute tolerances equal to 10−12 and 10−6, respectively. The pulse duration was 30ns and the time-step of 0.3ns was chosen. Similar modelling procedure was applied in case of a surface microdischarge in humid air at atmospheric pressure, up to 1000s [11]. The numerical procedure was tested by applying ODE45 solver for non-stiff system of differential equation, but the final concentrations were similar as in the calculation with ODE15s solver.
3 Results and discussion
We have started analysis of global model results with testing the sensitivity of global model results on the air content in helium. We made calculation with 5% and 1% of air in helium, in both case with 1% of the H2O in air. All results presented in this section were obtained at 30ns after the pulse application. The results of calculation are presented in Figure 2 together with OH density interval evaluated from minimal and maximal value of spatial distribution in Figure 5a from [14]. It is obvious that the global model in the case with 5% of air (upper part of Figure 2) gives OH densities which are up to two orders of magnitude higher than the peak value in 2D simulation [14]. Only at the lowest values of ne and Te, our results lie in the interval of OH densities predicted by the fluid model in [14]. In the case with 1% of air and with the same amount of water, calculated curves intersect OH interval from [14] for all three values of ne, but still are over targeted interval at the higher electron temperatures. In addition to above presented, this calculation additionally supports choice of 1% of air as input parameter.
![Figure 2 (Colour online) OH density as a function of Te
determined by global model with: 1% of air (full lines with symbols); and 5% of air (dashed line with symbol) compared on interval of [OH] from [14] (parallel dashed lines) for 1% of H2O in air](/document/doi/10.1515/phys-2018-0051/asset/graphic/j_phys-2018-0051_fig_002.jpg)
(Colour online) OH density as a function of Te determined by global model with: 1% of air (full lines with symbols); and 5% of air (dashed line with symbol) compared on interval of [OH] from [14] (parallel dashed lines) for 1% of H2O in air
Observed disagreement between results of global and fluid modelling is to some extent expected for the case of nanoseconds pulsed discharge, where streamer breakdown occurs. The growth of streamer is associated with rapidly development of ionization front, caused by the large gradient of electric field which produces hot electrons with Te up to 9eV [14, 15]. Indeed, this rapid development imposes some restrictions even on the fluid models, as have been discussed in papers [21, 22]. On the other hand, the data point in Figure 2 was calculated with assumption of the constant electron density at given electron temperature, in whole modelled domain. So, our global simulation does not include temporal development of ne and Te, and comparison with results of fluid simulation [14] is noted straightforward and quantitative, but more qualitative.
As it is noted above, in fluid simulation [14] the water fractions in air were 1%, 0.1% and 0.01%, and the calculated peak OH densities, from the Figure 5d of paper [14], are 6.3·1012cm−3, 7.0·1011cm−3 and 7.0·1010cm−3, respectively. As a test, we have run our code with these H2O fractions, but only for ne = 3.0·1013cm−3. The Figure 3 shows that in all three cases the global model predictions of OH density are over interval calculated by the fluid model [14], for the electron temperatures higher than 3 eV. Also, the results of our simulation, for given H2O amounts gives similar dependence of [OH] on Te, with values which decrease by an order or magnitude with decreasing H2O content.
![Figure 3 (Colour online) OH density as a function of Te obtained by global model with 1% of air for different H2O fractions (full lines with symbols) compared to results of fluid model[14] (parallel dashed lines). Vertical arrows connect compared data sets](/document/doi/10.1515/phys-2018-0051/asset/graphic/j_phys-2018-0051_fig_003.jpg)
(Colour online) OH density as a function of Te obtained by global model with 1% of air for different H2O fractions (full lines with symbols) compared to results of fluid model[14] (parallel dashed lines). Vertical arrows connect compared data sets
Calculated results with ne = 1·1013cm−3 and ne = 6·1013cm−3 are symmetrically positioned below and above that for ne = 3·1013cm−3 in Figure 3, as is expected from dependencies in Figure 2, and they are not shown for clarity of presentation. So, one can conclude that overlapping of our results and results of fluid modelling [14], with 0.1% and 0.01% H2O will be as in the case of 1% of H2O shown in Figure 2, and we will proceed further analysis only for 1% of H2O in air.
Another important task in modelling of atmospheric pressure plasmas generated in mixtures which contain water is revealing the main production and losses of OH radicals, as is done in [5, 8, 13, 14]. In order to reveal the main production and loss mechanisms, we have calculated the percentage contribution of all processes which determined OH radical’s kinetics, according the reactions list in [16, 17], with ne = 6·1013cm−3 and for the Te interval 1.5eV to 9eV. The results are presented in Table 2, and in Figure 4 and Figure 5. The percentage contributions in the case of ne = 1·1013cm−3 are not presented, but they are discussed in text. The Table 2 lists the main OH production and loss processes, which are labelled with R1-R5 and R6-R12, respectively.
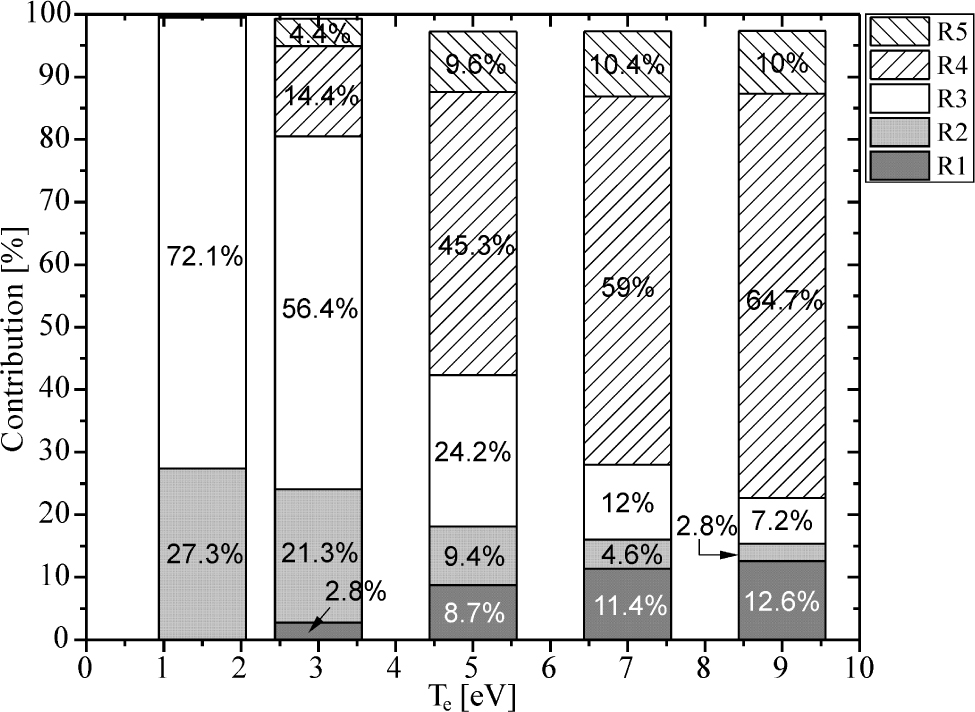
Contribution of different processes from Table 2 on OH production as a function of the electron temperature for ne = 6·1013cm−3
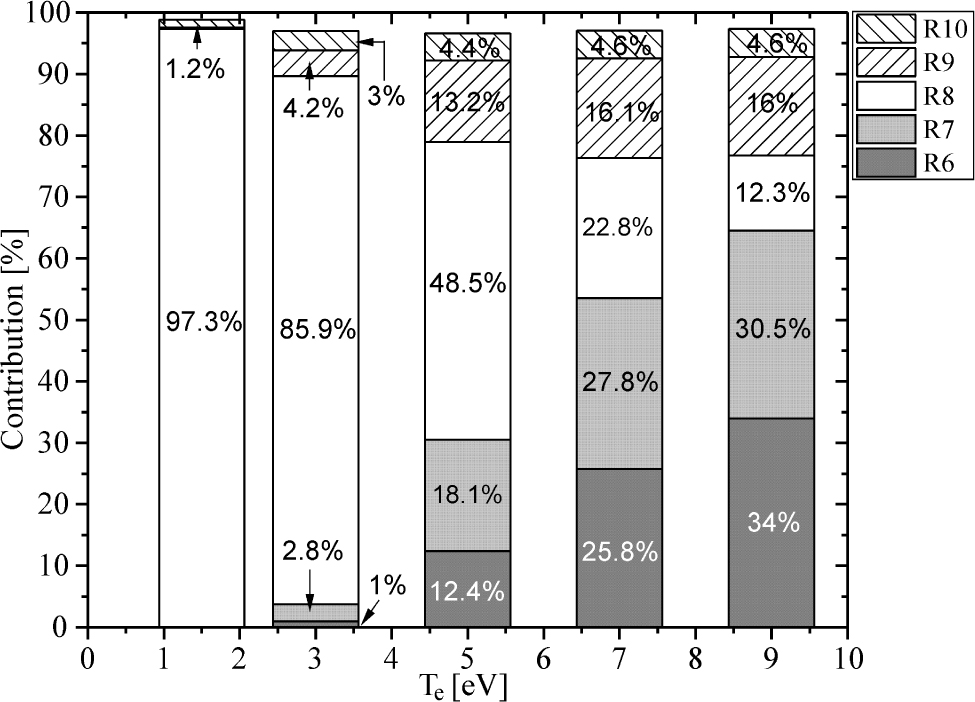
Contribution of different processes from Table 2 to OH destruction as a function of the electron temperature for ne = 6·1013cm−3
Compared to results of fluid model [14], processes R2 and R4 remain dominant in OH production in case of the global model, unlike the electron-impact dissociation of H2O with contribution that is now several orders of magnitude lower and is omitted from Table 2. Similar results are obtained in [4], where contribution of electron induced water dissociation to overall OH production is about 2%.
Electron impact dissociation of water is recognized as one of dominant mechanisms of OH production in plasmas with water content around several thousand ppm (particles per million) [5]. Furthermore, global model reveals additional processes of OH production (R1, R3 and R5) which were not included in the list of processes considered in fluid models [13, 14]. Dissociation of H2O by O(1S) is of particular interest, since it carries more than half of the OH production at low electron temperature, and around 7% at 9 eV, as it is shown in Figure 4.
On the other hand, the contribution of process R4 on OH production significantly increases at higher Te, mostly caused by increased production of H2O+ ions, since the rate coefficient for H2O+ recombination with electrons (Table 2) does not depend on the electron temperature [15]. According to our results, the production of H2O+ ions dominantly goes through charge transfer reactions with nitrogen ions (N+,
Figure 5 shows an analysis of the percentage contribution of processes R6-R10 on destruction of OH radicals. Our simulation reveals that the electron dissociation of OH (R8) dominates at low Te, mainly caused by the fact that the electron density is kept constant during 30 ns of simulation period, despite temporal growth during streamer development [14, 21, 22]. On the other hand, the processes involving positive ions He+ and N+ start to dominate in OH destruction at higher Te, above 7eV [8]. This is a direct consequence of an increased production of positive ions through electron impact and Penning ionization. The quenching of OH by N and O atoms (R9 and R10) was stated in [5] as an important loss mechanism, and has around of 20% contribution according to our results.
The percentage contributions of destruction processes shown in Figure 5 are slightly affected by decreasing of electron density. The calculation with ne = 1·1013cm−3 reveals that relative contributions of R8 in this case are approximately equal at low Te and differ within 2% at higher Te, compared to values in Figure 5. The net contribution of processes R6 and R7 is now few percent lower at higher Te, with decreasing of R6 contribution and increasing of R7 contribution within 5%. The three-body recombination reaction H + OH + M → M + H2O was stated in [5, 13, 14] as the main OH loss mechanism. According to results of our simulation, its contribution is approximately two orders of magnitude lower then contribution of R6-R8, in the whole modelled range of electron temperatures. Except for differences in kinetic scheme and used rate coefficients for this process [14, 16], observed disagreement may be explained by higher density of He+ and N+ ions according to our simulation, since global model calculation, generally, could give higher ion densities.
The question that is imposing after presented analysis is: whether the results of our global model may be improved? Having in mind that low temperature atmospheric pressure plasmas are strongly non-equilibrium, it is obvious that the choice of electron energy distribution functions (EEDF) would affects the kinetics of species [25, 26, 27]. Particularly, the non-equilibrium EEDF for higher energies will be quite different from equilibrium Maxwell-Boltzmann (MB) EEDF, due to considerable inelastic losses in processes of electronic excitation and ionization of helium gas. The rate coefficients for electronic collision calculated with assumption of MB EEDF and with non-equilibrium one, by solving of Boltzmann equation (BE), may be different by several orders of magnitude and lead to quite different chemical composition of modelled plasmas [25, 26, 27]. Some of rate coefficients in our calculation, taken from [16, 17] were expressed as a parametric function of electron temperature Te in [eV], with assumption of MB EEDF. The results presented in Figures 2-5, were calculated in this manner. On the other hand, with idea to test the influence of non-equilibrium EEDF on global model results, the rate coefficients for electron-molecules processes were obtained by solving Boltzmann equation with the two-term approximation solver BOLSIG+ [28]. In BOLSIG+ calculation, we have used cross section data from the MORGAN database [29] for He, O2, N2 and H2O as an input, for 1% of air in mixture and 1% of H2O in air (78% of N2 and 21% of O2). Figure 6 shows the test results, through the impact of non-equilibrium rate coefficients on OH densities. It is obvious that BE curves are significantly shifted to the lower OH densities, and they now approach to OH interval from [14] at higher Te, especially for ne = 6·1013cm−3. Decreasing of OH density in BE case is a direct consequence of a drop of H2O+ density, since its production is now reduced by using of lower rate coefficient.
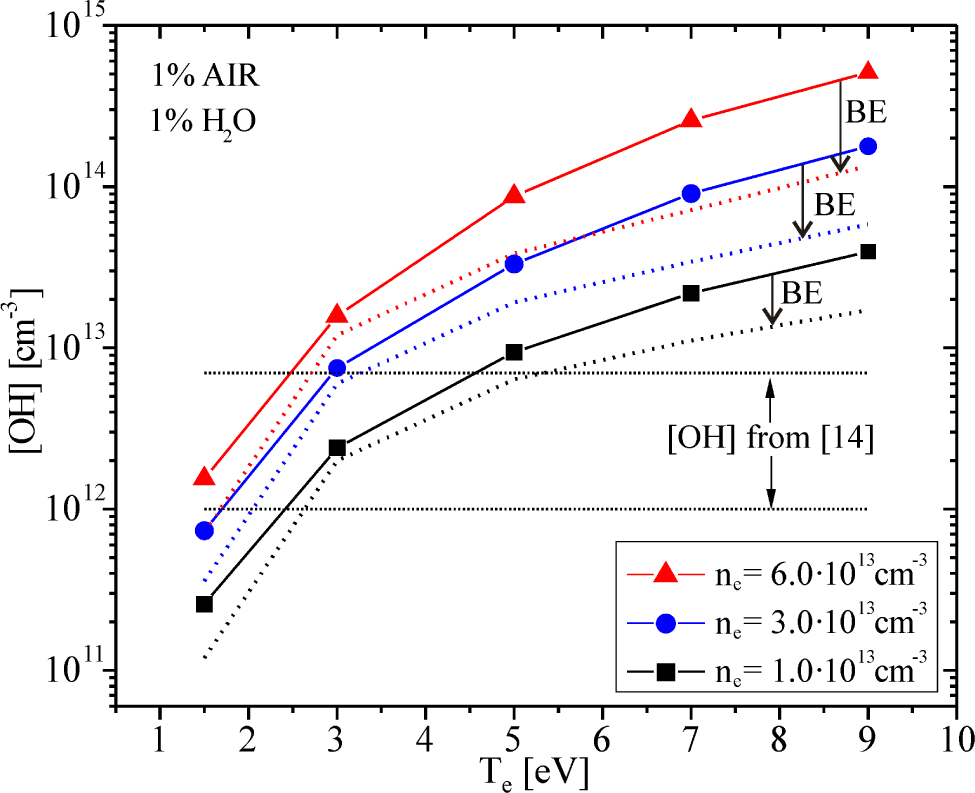
(Colour online) Influence of non-equilibrium EEDF on global model results. The OH densities drops are marked by a black arrow. Dotted curves are calculated with the non-equilibrium rate coefficients (BE EEDF)
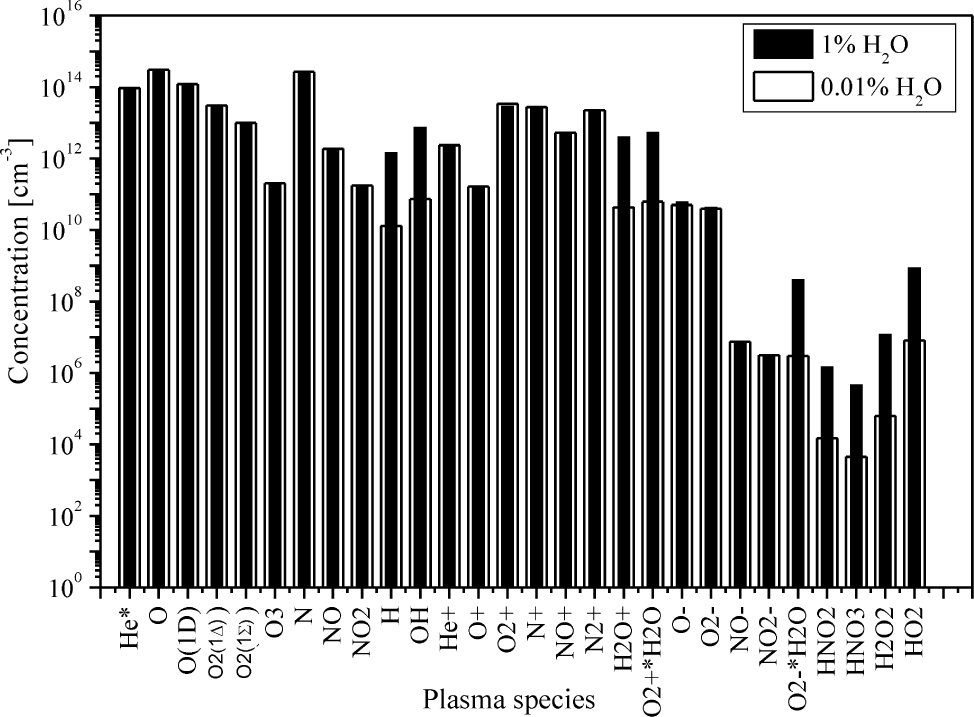
The plasma composition calculated by means of global model with 1% of air content, with the water content is given as percentage of the air: 1% (black bars) and 0.01% (white bars)
Another fact that would be stressed is concerned on choice of electron-impact rate coefficients. The fundamental characteristic of a streamer discharge is formation of a streamer head, an area with increased electric field strength, in front of which electron temperature reaches very high values (around 9 eV) and ionization frequency is maximized, as can be seen in Figures 3b, c, d in ref. [14] and in papers [21, 22]. So, adopting of the rate coefficients from [16, 17], where they were used for Te up to 3eV, in the modelling of streamer-like discharge with Te up to 9eV, is questionable, as was stated in literature [5, 20]. And finally, in Eq. (1), which describes time evolution of particle density, diffusion loss and loss by the flux of particles directed to the wall are omitted. Taking into consideration very short pulse duration of 30ns and atmospheric pressure, diffusion can be negligible [18]. From Figure 1a in [14] characteristic diffusion length for cylindrical geometry is estimated to be 1/λ2 = 2.235·106m−2 (for r = 2.25mm and z = 3mm), and with OH diffusion coefficient in He, DOH= 0.87·10−4 m2/s [30] we obtain diffusion loss frequency ≈ 200 1/s. Compared to dominant destruction mechanisms R6-R10, OH loss due to diffusion is four orders of magnitude lower.
Why use a global model? Despite a large number of different species and comprehensive set of processes that determine kinetics of different species, numerical solving of the system of Eq. (1) is not time-consuming and the calculation time for a single data point in Figures 2-6 is shorter than 10 seconds. The second advantage of global modelling is reflected through fast assessment of the plasma’s chemical composition. In each run of code, we obtained densities of all 68 species included in Table 1, and we are able to investigate the changes in chemical composition induced by different input parameters. So, global model allows us to assess the densities of many reactive oxygen and nitrogen species, as shown in Figure 7. The comparison of plasma’s chemical compositions for two different amounts of water in air (1% vs 0.01%) is also presented in Figure 7. The main difference arises in density of water-based species, with concentrations that are several orders of magnitude lower in case with 0.01% of H2O in air. The overall amount of oxygen and nitrogen reactive species is not affected by changes in the water content.
List of plasma species included in global model
| Neutral species | He, O2, N2, H2O, CO2, H2, NO, NO2, N2O |
| Reactive species | He*, |
| O, O(1D), O(1S), | |
| O2(v = 1), O2(v = 2), O2(v = 3), O2(v = 4), O2(1Δ), O2(1Σ), O3, | |
| N, N(2D), N(2P), N2(v = 1), N2(v = 2), N2(v = 3), N2(v = 4), | |
| CO3, CO4, NO3, | |
| H, OH, HO2, H2O2, HNO, HNO2, HNO3 | |
| Positive ions H2O+, H3O+ | He+, |
| Positive ions clusters | |
| Negative ions | |
| Negative ion clusters |
The list of the main OH production/loss processes with the rate coeflcients taken from [16, 17] and references therein.
| R1 | H2O+ + H2O → OH + H3O+ | 1.8·10−9 |
| R2 | O(1D) + H2O → OH + OH | 1.62·10−10exp(64.95/Tg) |
| R3 | O(1S) + H2O → OH + OH | 5.0·10−10 |
| R4 | e+H2O+ → H + OH | 3.8·10−7 |
| R5 | e+H3O+ → H + H + OH | 5.46·10−6· |
| R6 | He+ + OH → He + H + O+ | 1.1·10−9 |
| R7 | N+ + OH → H + NO+ | 3.4·10−10 |
| R8 | e− + OH → e− + O + H | 2.08·10−7Te−0.76exp(−6.9/Te) |
| R9 | N + OH → NO + H | 3.29·10−11exp(72.3/Tg) |
| R10 | O + OH → O2 + H | 2.2·10−11exp(120/Tg) |
Note. Units: Two-body rate coefficient cm3/s]. Electron temperature Te [eV]. Gas temperature Tg = 300K as in Ref. [14].
4 Conclusion
According to presented results, the intrinsic approximation of spatial homogeneity in global model imposes a significant limitation on its application in simulation of dynamic systems, such is a pulsed plasma jet. Rapid development of streamer (in form of plasma plumes or bullets) in space and time, ultimately requests using of higher order models, able to correctly describe streamer parameters [21, 22]. On the other hand, global model’s advantages, such as short computational time, comprehensive list of chemical reactions, fast assessment of chemical composition, fast determination of underlying chemistry pathways for each plasma species, make global model still very useful for modelling of atmospheric pressure plasmas. For those reasons such models are helpful in industry.
In making comparison of our results, we have employed data from the literature for a fluid model and assumed that it is essentially correct, in an attempt to test the applicability of the global model. In doing so one has to be aware that fluid models suffer from their own limitations, including the treatment of non-locality, spatially inhomogeneous plasma production, assumptions about the energy distribution function and using of the swarm data and the need to simultaneously solve a large number of equations thereby necessitating a simpler chemical model [21, 22]. All of these reasons could also be regarded as sources of discrepancy. We have however, taken information from the fluid model as initial conditions for our model in order to put comparisons on equal footing. Making comparison between a streamer model and a global model is particularly difficult due to small radial dimension of plasma while spatial diffusion would extend profiles of long lived species over a larger volume.
Acknowledgement
This paper has been produced under the funding of Serbian Ministry of Education, Science and Technological development through projects OI 171037.
References
[1] Lieberman M.A., Lichtenberg A.J., Principles of Plasma Discharges and Materials Processing, 2nd ed., 2005, Wiley, New Jersey.10.1002/0471724254Search in Google Scholar
[2] Makabe T., Petrović Z.Lj., Plasma electronics: Applications in Microelectronic Device Fabrication, 2006, Taylor & Francis Group, New York and London10.1201/9781420012279Search in Google Scholar
[3] Graves D.B., The emerging role of reactive oxygen and nitrogen species in redox biology and some implication for plasma applications to medicine and biology, J. Phys. D: Appl. Phys., 2012, 45, 263001.10.1088/0022-3727/45/26/263001Search in Google Scholar
[4] Dorai R., Kushner M.J., A model for plasma modification of polypropylene using atmospheric pressure discharges, J. Phys. D: Appl. Phys., 2003, 36, 666-685.10.1088/0022-3727/36/6/309Search in Google Scholar
[5] Bruggeman P., Schram D.C., On OH production in water containing atmospheric pressure plasmas, Plasma Sources Sci. Technol., 2010, 19, 045025.10.1088/0963-0252/19/4/045025Search in Google Scholar
[6] Bruggeman P., Cunge G., Sadeghi N., Absolute OH density measurements by broadband UV absorption in diffuse atmospheric-pressure He-H2O glow discharges, Plasma Sources Sci. Technol., 2012, 21, 035019.10.1088/0963-0252/21/3/035019Search in Google Scholar
[7] Yonemori S., Ono R., Flux of OH and O radicals onto a surface by an atmospheric-pressure helium plasma jet measured by laser-induced fluorescence, J. Phys. D: Appl. Phys., 2014, 47, 125401.10.1088/0022-3727/47/12/125401Search in Google Scholar
[8] Verreycken T., Bruggeman P.J., OH Dynamics in a Nanosecond Pulsed Plasma Filament in Atmospheric Pressure He–H2O upon the Addition of O2, Plasma Chem. Plasma Process. 2014, 34, 605-619.10.1007/s11090-014-9523-7Search in Google Scholar
[9] Liu D.X., Bruggeman P., Iza F., Rong M.Z., Kong M.G., Global model of low-temperature atmospheric-pressure He + H2O plasmas, Plasma Sources Sci. Technol., 2010, 19, 025018.10.1088/0963-0252/19/2/025018Search in Google Scholar
[10] Stalder K.R., Vidmar R.J., Nersisyan G., Graham W.G., Modelling the chemical kinetics of high-pressure glow discharges in mixtures of helium with real air, J. Appl. Phys., 2006, 99, 093301.10.1063/1.2193170Search in Google Scholar
[11] Sakiyama Y., Graves D.B., Chang H.W., Shimizu T., Morfill G.E., Plasma chemistry model of surface microdischarge in humid air and dynamics of reactive neutral species, J. Phys. D: Appl. Phys., 2012, 45, 425201.10.1088/0022-3727/45/42/425201Search in Google Scholar
[12] Niemi K., Waskoenig J., Sadeghi N., Gans T., O’Connell D., The role of helium metastable states in radio-frequency driven helium–oxygen atmospheric pressure plasma jets: measurement and numerical simulation, Plasma Sources Sci. Technol., 2011, 20, 055005.10.1088/0963-0252/20/5/055005Search in Google Scholar
[13] Liu X.Y., Pei X.K., Ostrikov K., Lu X.P., Liu D.W., The production mechanisms of OH radicals in a pulsed direct current plasma jet, Phys. Plasmas, 2014, 21, 093513.10.1063/1.4895496Search in Google Scholar
[14] Qian M.Y., Yang C.Y., Wang Z.D., Chen X.C., Liu S.Q., Wang D.Z., Numerical study of the effect of water content on OH production in a pulsed-dc atmospheric pressure helium-air plasma jet, Chin. Phys. B, 2016, 25(1), 015202.10.1088/1674-1056/25/1/015202Search in Google Scholar
[15] Qian M., Li G., Liu S., Zhang Y., Li S., Lin Z., Wang D., Effect of pulse voltage rising time on discharge characteristics of a helium-air plasma at atmospheric pressure, Plasma Sci. Technol., 2017, 19, 064015.10.1088/2058-6272/aa6154Search in Google Scholar
[16] Murakami T., Niemi K., Gans T., O’Connell D., Graham W.G., Chemical kinetics and reactive species in atmospheric pressure helium-oxygen plasmas with humid-air impurities, Plasma Sources Sci. Technol., 2013, 22, 015003.10.1088/0963-0252/22/1/015003Search in Google Scholar
[17] Murakami T., Niemi K., Gans T., O’Connell D., Graham W.G., Afterglow chemistry of atmospheric-pressure helium-oxygen plasmas with humid air impurities, Plasma Sources Sci. Technol., 2014, 23, 025005.10.1088/0963-0252/23/2/025005Search in Google Scholar
[18] Levko D., Raja L.L., Fluid vs. global approach for the modelling of active species production by streamer discharge, Plasma Sources Sci. Technol., 2017, 26, 035003.10.1088/1361-6595/aa5403Search in Google Scholar
[19] Niemi K., Gans T., O’Connel D., Comparison of a global model to semi-kinetic fluid simulations for atmospheric pressure radio-frequency plasmas, Plasma Sources Sci. Technol., 2013, 22, 032001.10.1088/0963-0252/22/3/032001Search in Google Scholar
[20] Hurlbatt A., Gibson A.R., Schröter S., Bredin J., Foote A.P.S., Grondein P., O’Connell D., Gans T., Concepts, Capabilities, and Limitations of Global Models: A Review, Plasma Process. Polym., 2017, 14, 1600138.10.1002/ppap.201600138Search in Google Scholar
[21] Dujko S., Markosyan A.H., White R.D., Ebert U., High-order fluid model for streamer discharges: I. Derivation of model and transport data, J. Phys. D: Appl. Phys., 2013, 46, 475202.10.1088/0022-3727/46/47/475202Search in Google Scholar
[22] Markosyan A.H., Dujko S., Ebert U., High-order fluid model for streamer discharges: II. Numerical solution and investigation of planar fronts, J. Phys. D: Appl. Phys., 2013, 46, 475203.10.1088/0022-3727/46/47/475203Search in Google Scholar
[23] Lu X., Laroussi M., Puech V., On atmospheric-pressure non-equilibrium plasma jets and plasma bullets, Plasma Sources Sci. Technol., 2012, 21, 034005.10.1088/0963-0252/21/3/034005Search in Google Scholar
[24] Liu Y., Tan Z., Chen X., Li X., Zhang H., Pan J., Wang X., An investigation of the effects of air on electron energy in atmospheric pressure helium plasma jets, Physics of Plasmas, 2018, 25, 033514.10.1063/1.5012576Search in Google Scholar
[25] Mukkavilli S., Lee C.K., Varghese K., Tavlarides L.L., Modeling of the electrostatic corona discharge reactor, IEEE Trans. Plasma Sci., 1998, 16, 652-660.10.1109/27.16554Search in Google Scholar
[26] Carman R.J., Mildren R.P., Electron energy distribution functions for modelling the plasma kinetics in DBD, J. Phys. D: Appl. Phys., 2000, 33, L99–L103.10.1088/0022-3727/33/19/101Search in Google Scholar
[27] Petrović Z. Lj., Šuvakov M., Nikitović Ž., Dujko S., Šašić O., Jovanović J., Malović G., Stojanović V., Kinetic phenomena in charged particle transport in gases, swarm parameters and cross section data, Plasma Sources Sci. Technol., 2007, 16, S1-S12.10.1088/0963-0252/16/1/S01Search in Google Scholar
[28] Hagelaar G.J.M., Pitchford L.C., Solving the Boltzmann equation to obtain electron transport coefficients and rate coefficients for fluid models, Plasma Sources Sci. Technol., 2005, 14, 722-733.10.1088/0963-0252/14/4/011Search in Google Scholar
[29] Morgan database, www.lxcat.net, retrieved on February 11, 2014Search in Google Scholar
[30] Ivanov A.V., Trakhtenberg S., Bertram A.K., Gershenzon Y.M., Molina M.J., OH, H2O and ozone gaseous diffusion coefficients, J. Phys. Chem. A, 2007, 111, 1632-1637.10.1021/jp066558wSearch in Google Scholar PubMed
© 2018 S. Gocić and Ž. Mladenović, published by De Gruyter
This work is licensed under the Creative Commons Attribution-NonCommercial-NoDerivatives 4.0 License.
Articles in the same Issue
- Regular Articles
- A modified Fermi-Walker derivative for inextensible flows of binormal spherical image
- Algebraic aspects of evolution partial differential equation arising in the study of constant elasticity of variance model from financial mathematics
- Three-dimensional atom localization via probe absorption in a cascade four-level atomic system
- Determination of the energy transitions and half-lives of Rubidium nuclei
- Three phase heat and mass transfer model for unsaturated soil freezing process: Part 1 - model development
- Three phase heat and mass transfer model for unsaturated soil freezing process: Part 2 - model validation
- Mathematical model for thermal and entropy analysis of thermal solar collectors by using Maxwell nanofluids with slip conditions, thermal radiation and variable thermal conductivity
- Constructing analytic solutions on the Tricomi equation
- Feynman diagrams and rooted maps
- New type of chaos synchronization in discrete-time systems: the F-M synchronization
- Unsteady flow of fractional Oldroyd-B fluids through rotating annulus
- A note on the uniqueness of 2D elastostatic problems formulated by different types of potential functions
- On the conservation laws and solutions of a (2+1) dimensional KdV-mKdV equation of mathematical physics
- Computational methods and traveling wave solutions for the fourth-order nonlinear Ablowitz-Kaup-Newell-Segur water wave dynamical equation via two methods and its applications
- Siewert solutions of transcendental equations, generalized Lambert functions and physical applications
- Numerical solution of mixed convection flow of an MHD Jeffery fluid over an exponentially stretching sheet in the presence of thermal radiation and chemical reaction
- A new three-dimensional chaotic flow with one stable equilibrium: dynamical properties and complexity analysis
- Dynamics of a dry-rebounding drop: observations, simulations, and modeling
- Modeling the initial mechanical response and yielding behavior of gelled crude oil
- Lie symmetry analysis and conservation laws for the time fractional simplified modified Kawahara equation
- Solitary wave solutions of two KdV-type equations
- Applying industrial tomography to control and optimization flow systems
- Reconstructing time series into a complex network to assess the evolution dynamics of the correlations among energy prices
- An optimal solution for software testing case generation based on particle swarm optimization
- Optimal system, nonlinear self-adjointness and conservation laws for generalized shallow water wave equation
- Alternative methods for solving nonlinear two-point boundary value problems
- Global model simulation of OH production in pulsed-DC atmospheric pressure helium-air plasma jets
- Experimental investigation on optical vortex tweezers for microbubble trapping
- Joint measurements of optical parameters by irradiance scintillation and angle-of-arrival fluctuations
- M-polynomials and topological indices of hex-derived networks
- Generalized convergence analysis of the fractional order systems
- Porous flow characteristics of solution-gas drive in tight oil reservoirs
- Complementary wave solutions for the long-short wave resonance model via the extended trial equation method and the generalized Kudryashov method
- A Note on Koide’s Doubly Special Parametrization of Quark Masses
- On right-angled spherical Artin monoid of type Dn
- Gas flow regimes judgement in nanoporous media by digital core analysis
- 4 + n-dimensional water and waves on four and eleven-dimensional manifolds
- Stabilization and Analytic Approximate Solutions of an Optimal Control Problem
- On the equations of electrodynamics in a flat or curved spacetime and a possible interaction energy
- New prediction method for transient productivity of fractured five-spot patterns in low permeability reservoirs at high water cut stages
- The collinear equilibrium points in the restricted three body problem with triaxial primaries
- Detection of the damage threshold of fused silica components and morphologies of repaired damage sites based on the beam deflection method
- On the bivariate spectral quasi-linearization method for solving the two-dimensional Bratu problem
- Ion acoustic quasi-soliton in an electron-positron-ion plasma with superthermal electrons and positrons
- Analysis of projectile motion in view of conformable derivative
- Computing multiple ABC index and multiple GA index of some grid graphs
- Terahertz pulse imaging: A novel denoising method by combing the ant colony algorithm with the compressive sensing
- Characteristics of microscopic pore-throat structure of tight oil reservoirs in Sichuan Basin measured by rate-controlled mercury injection
- An activity window model for social interaction structure on Twitter
- Transient thermal regime trough the constitutive matrix applied to asynchronous electrical machine using the cell method
- On the zagreb polynomials of benzenoid systems
- Integrability analysis of the partial differential equation describing the classical bond-pricing model of mathematical finance
- The Greek parameters of a continuous arithmetic Asian option pricing model via Laplace Adomian decomposition method
- Quantifying the global solar radiation received in Pietermaritzburg, KwaZulu-Natal to motivate the consumption of solar technologies
- Sturm-Liouville difference equations having Bessel and hydrogen atom potential type
- Study on the response characteristics of oil wells after deep profile control in low permeability fractured reservoirs
- Depiction and analysis of a modified theta shaped double negative metamaterial for satellite application
- An attempt to geometrize electromagnetism
- Structure of traveling wave solutions for some nonlinear models via modified mathematical method
- Thermo-convective instability in a rotating ferromagnetic fluid layer with temperature modulation
- Construction of new solitary wave solutions of generalized Zakharov-Kuznetsov-Benjamin-Bona-Mahony and simplified modified form of Camassa-Holm equations
- Effect of magnetic field and heat source on Upper-convected-maxwell fluid in a porous channel
- Physical cues of biomaterials guide stem cell fate of differentiation: The effect of elasticity of cell culture biomaterials
- Shooting method analysis in wire coating withdrawing from a bath of Oldroyd 8-constant fluid with temperature dependent viscosity
- Rank correlation between centrality metrics in complex networks: an empirical study
- Special Issue: The 18th International Symposium on Electromagnetic Fields in Mechatronics, Electrical and Electronic Engineering
- Modeling of electric and heat processes in spot resistance welding of cross-wire steel bars
- Dynamic characteristics of triaxial active control magnetic bearing with asymmetric structure
- Design optimization of an axial-field eddy-current magnetic coupling based on magneto-thermal analytical model
- Thermal constitutive matrix applied to asynchronous electrical machine using the cell method
- Temperature distribution around thin electroconductive layers created on composite textile substrates
- Model of the multipolar engine with decreased cogging torque by asymmetrical distribution of the magnets
- Analysis of spatial thermal field in a magnetic bearing
- Use of the mathematical model of the ignition system to analyze the spark discharge, including the destruction of spark plug electrodes
- Assessment of short/long term electric field strength measurements for a pilot district
- Simulation study and experimental results for detection and classification of the transient capacitor inrush current using discrete wavelet transform and artificial intelligence
- Magnetic transmission gear finite element simulation with iron pole hysteresis
- Pulsed excitation terahertz tomography – multiparametric approach
- Low and high frequency model of three phase transformer by frequency response analysis measurement
- Multivariable polynomial fitting of controlled single-phase nonlinear load of input current total harmonic distortion
- Optimal design of a for middle-low-speed maglev trains
- Eddy current modeling in linear and nonlinear multifilamentary composite materials
- The visual attention saliency map for movie retrospection
- AC/DC current ratio in a current superimposition variable flux reluctance machine
- Influence of material uncertainties on the RLC parameters of wound inductors modeled using the finite element method
- Cogging force reduction in linear tubular flux switching permanent-magnet machines
- Modeling hysteresis curves of La(FeCoSi)13 compound near the transition point with the GRUCAD model
- Electro-magneto-hydrodynamic lubrication
- 3-D Electromagnetic field analysis of wireless power transfer system using K computer
- Simplified simulation technique of rotating, induction heated, calender rolls for study of temperature field control
- Design, fabrication and testing of electroadhesive interdigital electrodes
- A method to reduce partial discharges in motor windings fed by PWM inverter
- Reluctance network lumped mechanical & thermal models for the modeling and predesign of concentrated flux synchronous machine
- Special Issue Applications of Nonlinear Dynamics
- Study on dynamic characteristics of silo-stock-foundation interaction system under seismic load
- Microblog topic evolution computing based on LDA algorithm
- Modeling the creep damage effect on the creep crack growth behavior of rotor steel
- Neighborhood condition for all fractional (g, f, n′, m)-critical deleted graphs
- Chinese open information extraction based on DBMCSS in the field of national information resources
- 10.1515/phys-2018-0079
- CPW-fed circularly-polarized antenna array with high front-to-back ratio and low-profile
- Intelligent Monitoring Network Construction based on the utilization of the Internet of things (IoT) in the Metallurgical Coking Process
- Temperature detection technology of power equipment based on Fiber Bragg Grating
- Research on a rotational speed control strategy of the mandrel in a rotary steering system
- Dynamic load balancing algorithm for large data flow in distributed complex networks
- Super-structured photonic crystal fiber Bragg grating biosensor image model based on sparse matrix
- Fractal-based techniques for physiological time series: An updated approach
- Analysis of the Imaging Characteristics of the KB and KBA X-ray Microscopes at Non-coaxial Grazing Incidence
- Application of modified culture Kalman filter in bearing fault diagnosis
- Exact solutions and conservation laws for the modified equal width-Burgers equation
- On topological properties of block shift and hierarchical hypercube networks
- Elastic properties and plane acoustic velocity of cubic Sr2CaMoO6 and Sr2CaWO6 from first-principles calculations
- A note on the transmission feasibility problem in networks
- Ontology learning algorithm using weak functions
- Diagnosis of the power frequency vacuum arc shape based on 2D-PIV
- Parametric simulation analysis and reliability of escalator truss
- A new algorithm for real economy benefit evaluation based on big data analysis
- Synergy analysis of agricultural economic cycle fluctuation based on ant colony algorithm
- Multi-level encryption algorithm for user-related information across social networks
- Multi-target tracking algorithm in intelligent transportation based on wireless sensor network
- Fast recognition method of moving video images based on BP neural networks
- Compressed sensing image restoration algorithm based on improved SURF operator
- Design of load optimal control algorithm for smart grid based on demand response in different scenarios
- Face recognition method based on GA-BP neural network algorithm
- Optimal path selection algorithm for mobile beacons in sensor network under non-dense distribution
- Localization and recognition algorithm for fuzzy anomaly data in big data networks
- Urban road traffic flow control under incidental congestion as a function of accident duration
- Optimization design of reconfiguration algorithm for high voltage power distribution network based on ant colony algorithm
- Feasibility simulation of aseismic structure design for long-span bridges
- Construction of renewable energy supply chain model based on LCA
- The tribological properties study of carbon fabric/ epoxy composites reinforced by nano-TiO2 and MWNTs
- A text-Image feature mapping algorithm based on transfer learning
- Fast recognition algorithm for static traffic sign information
- Topical Issue: Clean Energy: Materials, Processes and Energy Generation
- An investigation of the melting process of RT-35 filled circular thermal energy storage system
- Numerical analysis on the dynamic response of a plate-and-frame membrane humidifier for PEMFC vehicles under various operating conditions
- Energy converting layers for thin-film flexible photovoltaic structures
- Effect of convection heat transfer on thermal energy storage unit