
Characteristics of microscopic pore-throat structure of tight oil reservoirs in Sichuan Basin measured by rate-controlled mercury injection
-
Xinli Zhao
 ,
Shengchun Xiong
,
Shengchun Xiong

Abstract
Based on the results of rate-controlled mercury-injection experiments, the microscopic pore-throat structure characteristics of tight sandstone in Sha-1 Section and tight limestone in Da’anzhai Section of Sichuan Basin were quantitatively characterized. The results show that the pore radius distribution characteristics of tight oil reservoirs are similar. The main distribution is between 100~190 μm, and the average pore radius is 160 μm. While the distribution of the throat radius of tight sandstone and limestone is quite different, the distribution of the throat of sandstone samples is relatively concentrated, and the distribution of the throat of limestone samples is relatively sparse. There is a good positive correlation between the average throat radius and permeability, but the correlation between fractal dimension and permeability is not obvious. This indicates that the permeability is mainly affected by the radius of the throat. The pore-throat ratio in tight oil reservoirs is relatively large, and the resistance to seepage is greater during development. Therefore, during the development of tight oil, measures should be taken to increase the radius of the throat, reduce the ratio of pore radius to pore-throat radius, and improve the seepage capacity of the reservoir, thereby improving the development of tight oil.
1 Introduction
Tight oil is new area for unconventional oil and gas exploration and development after shale gas [1, 2]. It is praised as "black gold" by the oil industry [3]. Tight oil refers to the accumulation of petroleum in the system of dark shale, argillaceous silt and sandstone intercalation that are rich in organic matter and have very poor permeability, which occurs in the form of adsorption or free state [4]. The boundary of the physical properties of the tight layer is determined. The surface air permeability is < 1.0×10⁻³ μm2, the underground pressure permeability is < or equal to 0.1×10⁻³ μm2, and the porosity is less than 10% [5]. The Jurassic unconventional oil in the Sichuan Basin is continuously distributed over a large area and has a large resource potential. The tight oil reservoirs in Sichuan Basin have poor pore-throat structure and strong heterogeneity. The tight reservoir pore-throat geometry (pore type, shape, size, and distribution) not only controls the physical properties of the reservoir, but also directly affects the production and recovery of tight oil. It has been a popular topic for scholars [6, 7, 8].
Xiao Qianhua [9] used cryogenic nitrogen adsorption technology to study the microscopic pore structure characteristics of reservoir rocks in typical tight oil regions. Li Bo [10] visualized the pore type of tight oil reservoirs in the Da’anzhai Section of the Middle Jurassic Ziliujing Formation using thin-slide observation and scanning electron microscopy techniques. CT scanning techniqueswere used to reconstruct the three-dimensional microscopic pore-throat model of reservoir-dense limestone. It was found that a large number of nano-sized pores exist within the reservoir matrix, and pore-throat connectivity was poor. Zhou Shangwen [11] applied the NMR technique to carry out movable fluid tests on the samples of the Jurassic tight oil reservoir in the Sichuan Basin. The results of the study showed that the fluid content of the tight oil reservoir is very low and mainly distributed in small pores; its fluid availability is poor and difficult to develop. The above studies mainly focused on pore-throat type analysis based on the experimental results, but the pore and throat radius distributions were not quantitatively characterized. The influence of pore-throat structure on seepage capacity was also not discussed. Due to capillary pressure, the conventional mercury-intrusion technique will exhibit a low numerical value when the microscopic pores and throats of tight oil reservoirs are characterized. High-pressure mercury intrusion has an extremely high mercury-inlet pressure, which can cause artificial cracks. Large errors persist in the testing of small pores [12]. The rate-controlled mercury-injection technology ensures the quasi-static process of mercury ingression at a very low mercury ingression rate. According to the rise and fall of the mercury ingression, the microscopic pore structure parameter information can be obtained and the number of pores and throats can be directly obtained. Capillary pressure curves of the pores and throats are provided and the microscopic pore structure parameters, including the pore-throat radius distribution, are given. It also provides information that reflects the development of pores, throats, and the degree of development (the ratio of pore-radius to pore-throat radius) between pores and throats [13]. Taking the tight reservoirs of the Sha-1 and Da’anzhai sections of the Shaxiamiao Formation in the middle-lower Jurassic in the Sichuan Basin as an example, the authors used the RMI test technique to analyze the porosity, throat, and throat ratios of tight reservoirs. The microscopic pore structure of these reservoirs was finely characterized and the pore structure was studied using fractal theory. To provide a theoretical basis for the efficient development of tight reservoirs in the research region, the influence of the pore-throat structure of tight reservoirs on the seepage capacity was explored.
2 Sample
The Jurassic in the Sichuan Basin is mainly a set of inland fluvial and lacustrine deposits. Oil and gas are mainly distributed in the Middle-Lower Jurassic. The middle section of the Shaximiao Formation in the Lower and Middle Jurassic, the Liangshang Section and the Da’anzhai Section of the Liangshan group are three main production zones. Over 90% of the crude oil in the Chuanzhong area is produced from these three sections [14, 15, 16]. The samples for this study were taken from the Sha-1 Section of the Shaximiao Formation and the Da’anzhai Section, and the constant velocity mercury intrusion data of the core (Table 1). The selected lithology of the sand sample from the first section was sandstone with a porosity of 3% to 6% and permeability between 0.082×10⁻³ μm2 to 1.41×10⁻³ μm2. The lithology of the reservoir in the Da’anzhai Section is in the form of shell limestone. Six of the samples were selected for study and the porosity is between 1.76% and 3.06%, the matrix permeability is between 0.014×10⁻³ μm2 and 0.287×10⁻³ μm2, and the Da’anzhai Section is the source of hydrocarbons. The type of rock organic matter is mainly type II, and the value of Ro is between 0.9% and 1.5%. The abundance of petroleum resources with a source rock thickness > 20m is (6~10)×104t/km2 [17]. It can be seen from the above data that the main strata of the Shahemiao Formation and the Da’anzhai Section in the Sichuan Basin have extremely poor physical properties and are typical of tight oil reservoirs.
Thecharacterization parameters of rate-controlled mercury injection
| Sample | Lithology | Φ/% | K | Rt/ μm | Rp/ μm | η | Sf/% | Sp/% | St/% | Pd/MPa |
|---|---|---|---|---|---|---|---|---|---|---|
| H19 | Sandstone | 6.13 | 0.556 | 1.26 | 158.29 | 156.79 | 56.37 | 20.95 | 35.42 | 0.252 |
| H21 | Sandstone | 5.65 | 0.283 | 0.91 | 156.12 | 194.94 | 50.35 | 16.62 | 33.73 | 0.523 |
| 52 | Sandstone | 3.47 | 0.082 | 0.80 | 152.91 | 186.48 | 39.53 | 4.31 | 35.22 | 0.516 |
| 58 | Sandstone | 3.96 | 0.415 | 1.33 | 136.69 | 114.63 | 45.08 | 5.89 | 39.20 | 0.171 |
| 60 | Sandstone | 3.95 | 1.41 | 1.43 | 135.49 | 106.03 | 56.79 | 10.72 | 46.07 | 0.130 |
| 89 | Limestone | 2.14 | 0.014 | 0.54 | 145.48 | 282.12 | 8.80 | 1.11 | 7.70 | 1.025 |
| 103 | Limestone | 3.06 | 0.265 | 0.92 | 151.44 | 187.79 | 17.84 | 5.08 | 12.76 | 0.442 |
| 108-2 | Limestone | 2.14 | 0.287 | 0.79 | 144.72 | 216.12 | 27.98 | 8.06 | 19.92 | 0.483 |
| 109A | Limestone | 1.76 | 0.059 | 0.47 | 150.51 | 335.07 | 14.70 | 2.11 | 12.58 | 1.09 |
| 114A | Limestone | 2.25 | 0.632 | 1.21 | 144.47 | 145.23 | 37.23 | 14.11 | 23.12 | 0.294 |
| 132-1 | Limestone | 2.24 | 0.241 | 0.85 | 147.13 | 188.11 | 13.61 | 2.24 | 11.38 | 0.565 |
Φ-porosity; K-permeability, 10−3 μm2; Rt-average throat radius; Rp - average pore radius; η-pore-throat radius ratio; Sf -final total mercury saturation; Sp-pore mercury saturation; St-throat mercury saturation; Pd-displacement pressure. (the porosity of the rock samples is the conventional gas measurement porosity using the nitrogen test, and the permeability is the Klinkenberg permeability measured when the net confining pressure is 2MPa [18, 19]).
3 Experimental method
During the experiment, when the injected mercury enters the main throat (Figure 1a), the pressure gradually rises. The pressure drops rapidly after breakthrough (Figure 1b). The first pressure drop can be seen at P1. Then mercury gradually fills up the first pore and enters the next secondary throat, resulting in a second pressure fluctuation at P2. Next, all the secondary pores controlled by the main throat are filled successively until the pressure rises to the pressure at the main throat, which is a complete pore unit. The radius of the throat is determined by the pressure value of the breakthrough point, and the size of the pores is determined by the volume of mercury ingress, thus separating the pores and the throat in the core [13]. The rate-controlled mercury-injection instrument used in this experiment was an ASPE 730 rate-controlled mercury analyzer, manufactured by the United States Coretest Corporation. The mercury feed pressure was 0-1000psi (about 7MPa), the mercury feed rate was 0.00005mL/min, and the contact angle was 140∘. The interface tension coefficient was 485dyn/cm. The experimental sample was obtained by drilling a plug rock sample with a diameter of 2.5cm, drying it after washing oil and taking a small rock sample from the plug rock sample. The average volume of the sandstone sample was 3.7cm3 and the average volume of the limestone sample was 6.5cm3, and then a rate-controlled mercury injection experiment was performed after vacuuming.
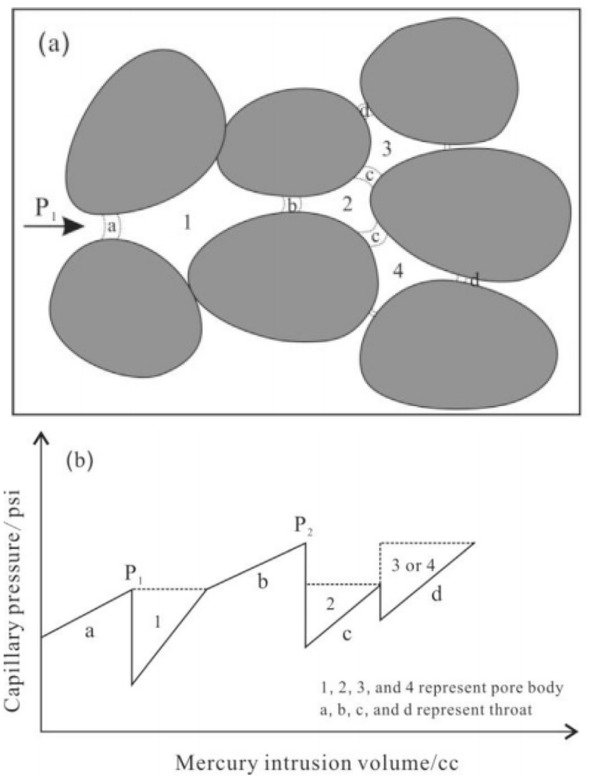
Rate-controlled mercury injection testing reservoir pore structure schematic. (a) Simplified schematic of pore body and throat configuration and (b) capillary pressure fluctuation and pore volume response
4 Results and discussion
4.1 Pore-throat distribution characteristics
4.1.1 Pore radius distribution characteristics
By analyzing the results of RMI experiments, we can see that the pore radius distribution of tight sandstones in the 5 sands (Figure 2a) is similar to the distribution of the pore radius of the tight limestones in the 6 Da’anzhai Sections (Figure 2b) Distribution in 100 μm~190 μm, the peak is about 160 μm. The predecessors found that their pore radius was distributed in the range of 100 μm~200 μm in the experiment of ultra-low permeability and tight permeability reservoirs. The peak value was about 140 μm [20, 21, 22]. Comparing the pore radius distribution characteristics of tight sandstones of Chang 6 and Chang 8 in the Ordos Basin, the main distribution is 100 μm~160 μm, and the peak is about 150 μm [23]. Thus, for ultra-low permeability [24] and tight reservoirs, the effect of pore radius distribution on reservoir permeability is not significant.
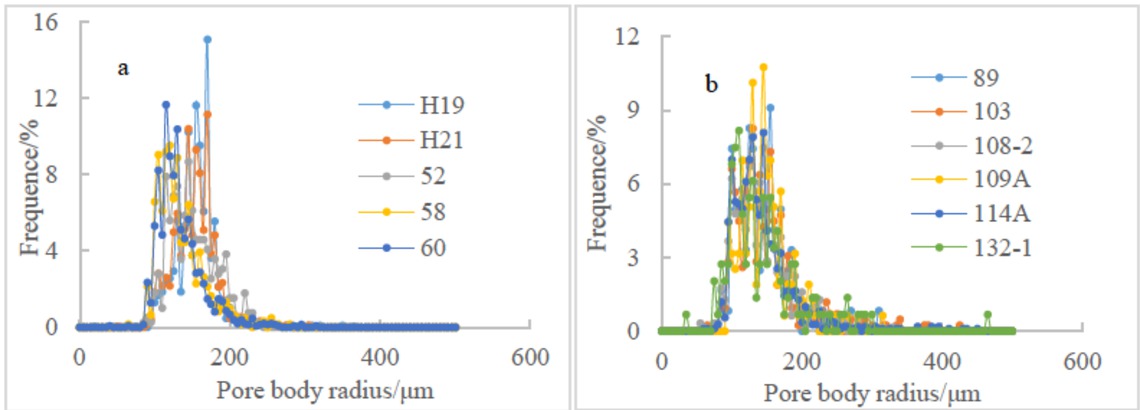
Pore size distribution by rate-controlled mercury injection of the samples
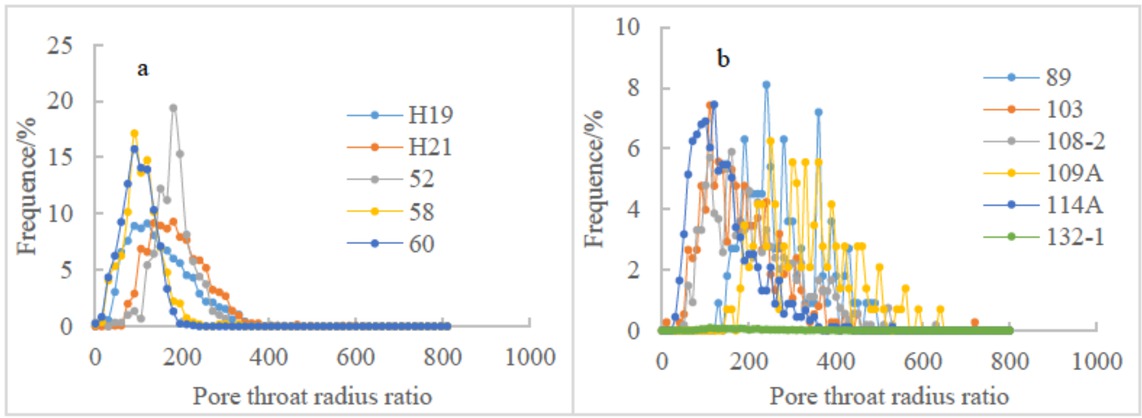
4.1.2 Throat radius distribution characteristics
The experimental results show that the characteristics of the distribution of the tight sandstone throat of the Sha-1
Section (Figure 3a) and the characteristics of the distribution of the limestone throat of the Da’anzhai Section (Figure 3b) are quite different. The distribution of throats in sandstone samples is relatively concentrated. The distribution of throats in limestone samples is relatively sparse. The radius of the throat of the sandstone is generally distributed between 0.2 μm and 1.8 μm with an average of approximately 0.5 μm. The main body radius of the limestone throat is 0.1 μm to 2.1 μm, with an average of 0.7 μm. As can be seen in Figure 3(b), the greater the permeability, the wider the distribution range and the more the peak distribution shifts to the right. Figure 4 shows the cumulative frequency distribution of five sandstone cores with different permeabilities. The cores with poor permeability and the small throats occupy a small part. When the value of permeability is 0.632×10⁻³ μm2 and 0.014×10⁻³ μm2, the throat with a radius < 1 μm occupies 40% and more than 90% respectively. There is a positive correlation between the average throat radius and permeability (Figure 5). The correlation coefficient is greater than 0.9 (R2 = 0.918), indicating that the permeability of tight oil reservoirs is greatly affected by the throat, which is consistent with previous research results [25]. Waterflooding is an important technology for oilfield development [26]. However, with the decrease of permeability, the pore-throat of ultra-low permeability reservoir is smaller and the fluid-solid coupling is stronger [27, 28]. The higher the irreducible water saturation, the larger the starting pressure gradient. Therefore, the ability of porous media to allow fluid to flow through is becoming weaker [29]. At the same time, when the mainstream throat radius is < 1 μm, the actual permeability of waterflooding will be reduced exponentially; therefore, the likelihood of waterflooding will be increased [30]. Some studies also have suggested that a throat radius >1.0 μm has an important influence on core fluid flow. When the proportion of throats with a radius >1 μm is less than 40%, it is considered that the development of reservoir water injection is not feasible [31]. Theproportion of the total pore volume occupied by the throat with a radius > 1.0 μm in tight reservoirs in the central Sichuan region is between 3% and 35%. Therefore, it is difficult for the tight reservoirs in this area to be water-average throat radius and permeability injected and it is easy to cause various sensitive injuries, affecting single well productivity.
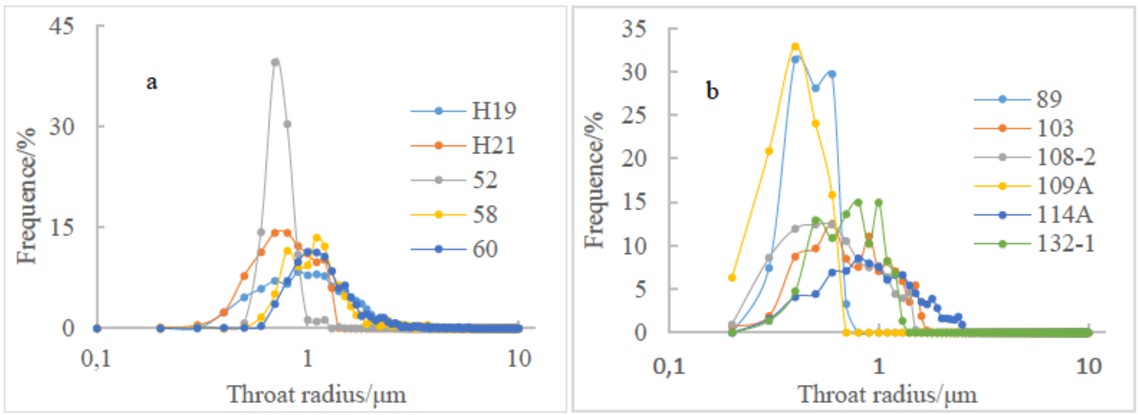
Throat size distribution by RMI of the samples
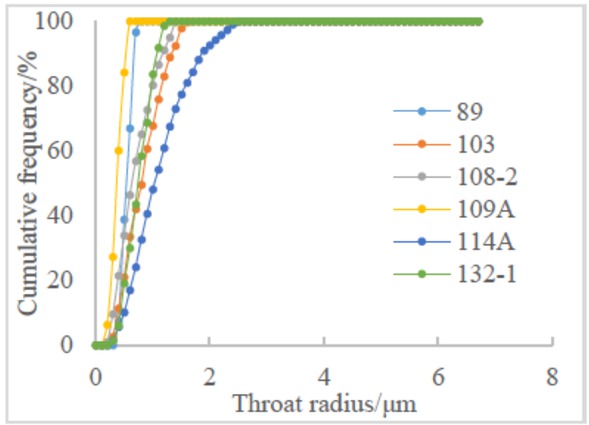
The cumulation frequency curves versus the throat radius of limestone
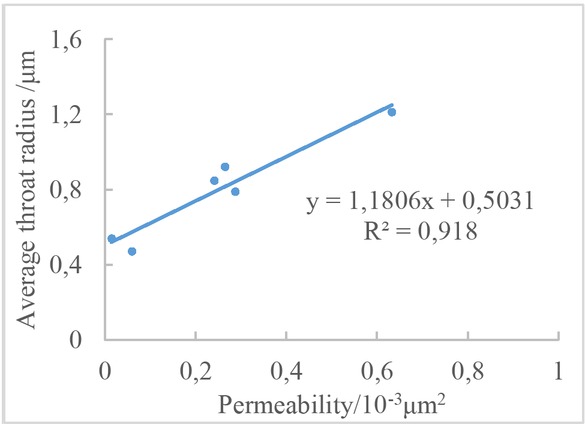
Correlationship between average throat radius and permeability
4.2 Capillary curve features
The pore and throat pressure and total capillary pressure curves, provided by the rate-controlled, mercury-injection test, can be used to visually reflect the relationship between mercury-inlet pressure, effective pore volume, effective throat volume, and total effective pore-throat volume [32, 33]. According to the tight rock sample, capillary pressure test results in the study area, there are 4 main types of pressure curves for rate-controlled mercury-intrusion capillary tubes, as shown in typical sandstone samples H19 and 52 (Figure 6a), and typical limestone samples 89 and 108-2 as shown in Figure 6b The detailed pore structure parameters are shown in Table 1. For the sandstone sample H19, the expulsion pressure is 0.252MPa, and the overall capillary drag-force curve in the early stage of mercury ingression is consistent with the pore capillary pressure curve. This indicates that mercury saturation is mainly controlled by pores in the early stage. As the pressure of incoming mercury increases, the pore capillary pressure curve becomes steep, and the overall mercury-influx curve is consistent with the capillary pressure curve of the throat. For sandstone sample 52, the expulsion pressure is 0.516MPa, which is higher than the expulsion pressure of sample H19. In the early stage of mercury ingression, the total mercury saturation is mainly controlled by the throat. The capillary pressure curve of 89 in the limestone sample is similar to that of the sandstone sample H19, and the capillary pressure curves of 108-2 and 52 are similar. However, the final mercury saturation of the limestone sample is lower than the final mercury saturation of the sandstone sample, which is related to its lithology. On the whole, for all rock samples in the study area, the pore mercury pressure curve gradually became steeper, parallel to the vertical axis, as the mercury-inlet pressure gradually increased (Figure 6).
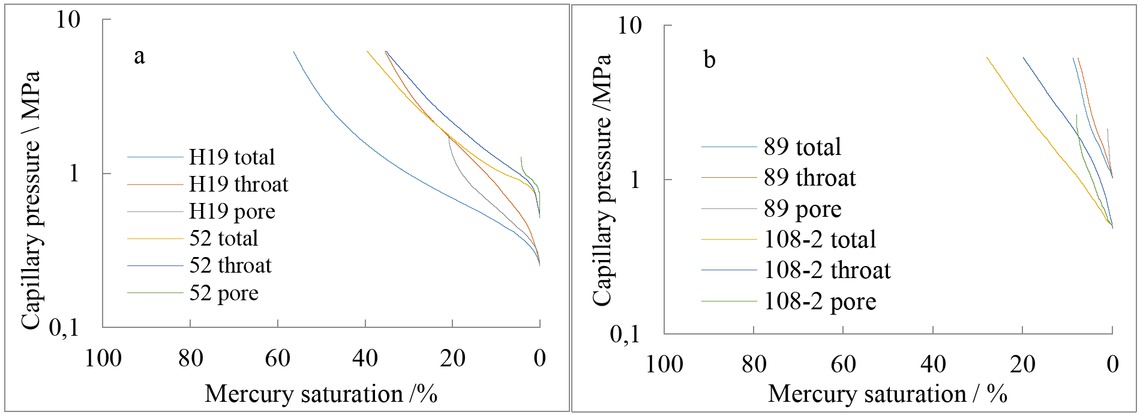
Capillary pressure curves of the representative samples
4.3 Pore structure fractal features
Fractal geometry is a branch of mathematics [34]. It can describe complex things in detail. The pore structure of reservoir rocks has fractal features [35, 36, 37, 38, 39, 40], which can be characterized quantitatively by fractal dimension. Based on the capillary beam model, the capillary pressure is calculated as follows:
In the formula: Pc is the capillary pressure, MPa; σ is the interfacial tension, N/m; θ is the contact angle, (∘); r is pore radius, μm.
The relationship between capillary force and wetting saturation can be written as [37]:
In the formula: S is the cumulative pore volume fraction in the rock, whose pore radius is smaller than a certain value. In the mercury-.injection test, saturation of the wetting phase corresponding to the capillary pressure, Pc, %;
D is the fractal dimension, dimensionless number; Pmin is the capillary pressure corresponding to the largest pore-throat, MPa.
From formula (2), it can be seen that there is a linear relationship between the logarithm of the reservoir capillary pressure and the corresponding logarithm of the saturation of the wetting phase. Therefore, we can use the mercury-intrusion test results for linear regression analysis to obtain the pore fractal dimension D that reflects the pore structure characteristics. According to the fractal theory, the fractal dimension in the three-dimensional Euclidean space is between 2 and 3. The smaller the fractal dimension is, the more regular the pore shape, the smoother the pore surface, the better the reservoir pore permeability. However, the pore permeability of the reservoir is poor. A fractal dimension greater than 3 indicates that the corresponding pores do not have fractal features [41, 42].
For rocks with better porosity within the reservoir, there is a good linear relationship between the logarithm of capillary pressure and the logarithm of the saturation of the wetting phase (Equation 2). The pore structure has good statistical self-similarity. As the fractal dimension decreases, the pore structure becomes better. The fractal dimension of the sample is shown in Table 2. The fractal dimension of the five sandstone samples is 2.7066 to 2.8035, with an average of 2.7523. The fractal dimension of the six limestone samples is 2.8544 to 2.9530, with an average of 2.9077.Moreover, the fractal dimension of sandstone is smaller than that of limestone, so the pore structure of sandstone is more regular than limestone. Taking the two representative samples H19 (Figure 7a) and 58 (Figure 7b) in the target layer of the study area as examples, the porosity of the two samples was 6.13% and 3.96%, respectively. The relationship between the logarithm of the capillary pressure and the logarithm of the saturation of the wetting phase is:
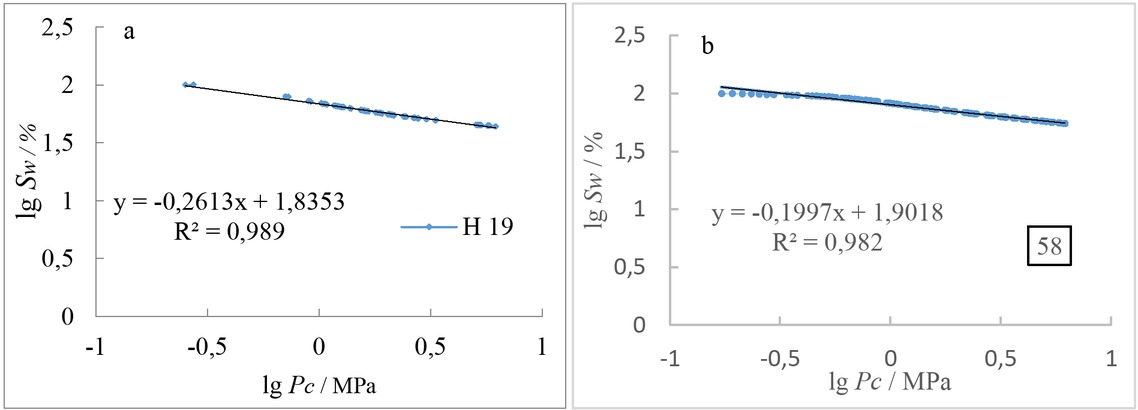
The relationship between capillary pressure and wetting phase saturation of H19 and 58 samples
Fractal dimension of sandstone and limestone
| Sample | Lithology | Φ/% | K | η | D | R2 |
|---|---|---|---|---|---|---|
| H19 | Sandstone | 6.13 | 0.556 | 156.79 | 2.7393 | 0.989 |
| H21 | Sandstone | 5.65 | 0.283 | 194.94 | 2.7066 | 0.994 |
| 52 | Sandstone | 3.47 | 0.082 | 186.48 | 2.7812 | 0.997 |
| 58 | Sandstone | 3.96 | 0.415 | 114.63 | 2.8035 | 0.986 |
| 60 | Sandstone | 3.95 | 1.41 | 106.03 | 2.7311 | 0.982 |
| 89 | Limestone | 2.14 | 0.014 | 282.12 | 2.9530 | 0.979 |
| 103 | Limestone | 3.06 | 0.265 | 187.79 | 2.9261 | 0.998 |
| 108-2 | Limestone | 2.14 | 0.287 | 216.12 | 2.8664 | 0.999 |
| 109A | Limestone | 1.76 | 0.059 | 335.07 | 2.9051 | 0.999 |
| 114A | Limestone | 2.25 | 0.632 | 145.23 | 2.8544 | 0.998 |
| 132-1 | Limestone | 2.24 | 0.241 | 188.11 | 2.9413 | 0.995 |
Φ-porosity; K -permeability,10−3 μm2; η-the ratio of pore radius to pore-throat radius;D-fractal dimension
H19 sample:
58 samples:
Using linear regression analysis, the fractal dimension of the pore structure of the two rock specimens is 2.7393 and 2.8035, respectively. Comparison shows that the fractal dimension of the H19 rock sample is smaller than the fractal dimension of the 58 rock sample. According to the foregoing rules, we can see that the pore structure of H19 is better, and the correlation between porosity and permeability is also better. The physical properties of the test of rock samples showed that the permeabilities of H19 and 58 samples were 0.556×10⁻³ μm2 and 0.415×10⁻³ μm2, respectively, confirming that the fractal dimension can reflect the quality of the rock pore structure. There is a good linear relationship between reservoir rock permeability and average throat radius (Figure 5), but the correlation between fractal dimension and rock reservoir permeability is not obvious (Figure 8). This is consistent with previous research [43]. It can be seen from Figure 9 that there is a certain correlation between the fractal dimension and the ratio of pore radius to pore-throat radius. As the fractal dimension increases, the ratio of pore radius to pore-throat radius increases.
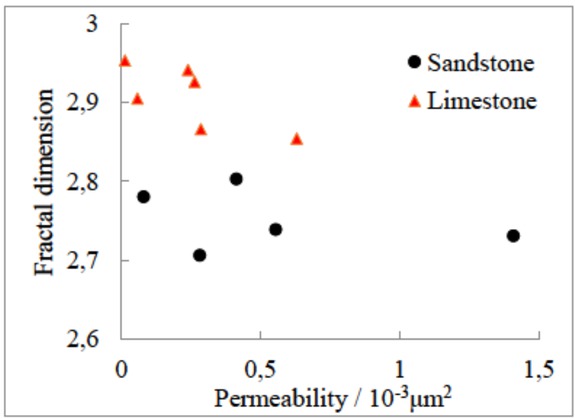
The relationship between fractal dimension and permeability
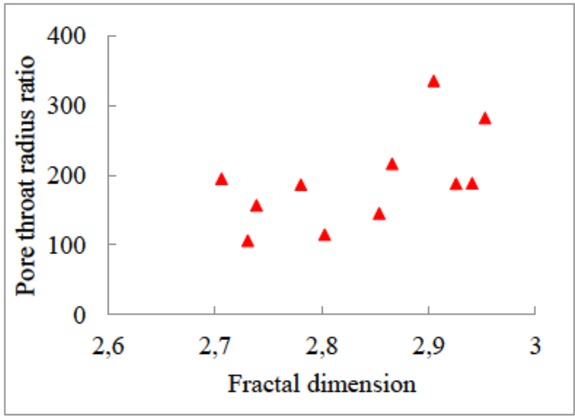
The relationship between fractal dimension and the pore-throat radius ratio
4.4 The ratio of pore radius to pore-throat radius distribution characteristics
The reservoir’s ratio of pore radius to pore-throat radius is one of the important parameters in the analysis of rock pore-throat characteristics. When the ratio between pore radius and throat radius is small, the throat’s ability to restrain oil (gas) is small. The connection of large throats is conducive to the recovery of oil and gas in pores. On the contrary, when the throat radius is relatively large, it indicates that the pores are connected by the smaller throats, and oil and gas must overcome relatively large capillary forces when passing through the narrow throats. This is not conducive to the recovery of oil and gas in pores [44, 45]. It can be seen from Figure 10 that the sandstone’s ratio of pore radius to pore-throat radius (Figure 10a) is mainly distributed between 30 and 300, and the limestone’s ratio of pore radius to pore-throat radius (Figure 10b) is mainly distributed between 40 and 480. Therefore, compared to the conventional reservoir ratio of pore radius to pore-throat radius, the ratio of pore radius to pore- throat radius of tight oil reservoirs is relatively large. Advanced technological transformation measures must be adopted to increase the radius of the throat and reduce the ratio of pore radius to pore-throat radius , so as to improve the development effect of the tight oil.
The ratio of pore radius to pore-throat radius size distribution by RMI of the samples
5 Conclusions
The oil reservoirs of the Sha-1 Section and Da’anzhai Section in the Shaxiamiao Formation of the Lower-Middle Jurassic in the Sichuan Basin are typical tight oil reservoirs. The permeability is < 0.1×10⁻³ μm2. The distribution characteristics of the pore radius of sandstone and limestone are similar, and the main distribution is between 100 μm and 190 μm, the average pore radius is 160 μm.
The distribution of the throats of sandstone and limestone is quite different. The distribution of the throat of sandstone samples is relatively concentrated, and the distribution of the throat of limestone samples is relatively sparse. The throat radius of sandstone is generally between 0.2 μm and 1.8 μm, and the average throat radius is about 0.5 μm. The throat radius of limestone is mainly between 0.1 μm and 2.1 μm, and the average throat radius is about 0.7 μm. A good positive correlation exists between the average throat radius and permeability, indicating that the permeability is mainly controlled by the throat.
The pore structure of reservoir rocks has fractal features that can be characterized quantitatively by fractal dimensions. Studies show that the smaller the fractal dimension, the better the pore structure. The fractal dimension of sandstone is smaller than that of limestone, so the pore structure of sandstone is more regular than limestone. The correlation between the fractal dimension and the rock reservoir permeability is not obvious.
The ratio of pore-throat radii between sandstone in the first sand section and the Da’anzhai Section is relatively large, indicating that the pores are connected by the smaller throat, and oil and gas passing through the narrow throat need to overcome relatively large capillary forces, resulting in low oil displacement efficiency. For tight oil reservoirs, during the development process, emphasis was placed on increasing the radius of the throat and reducing the radius of the pores. Therefore, the pore-throat radius ratio can be reduced so that the development effect of tight oil can be improved.
Acknowledgement
We gratefully acknowledge the financial support from the National Science and Technology Major Project (2017ZX05013-001).
References
[1] Zandong S., Unconventional oil and gas exploration and development, 2011, Beijing, Petrol. Industry Press.Search in Google Scholar
[2] Caineng Z., Shizhen T., et al., Unconventional petroleum geology, 2011, Beijing, Geological Publishing House.Search in Google Scholar
[3] Johnstone B., Bakklen black gold, Leader-Poster, 2007, 6.Search in Google Scholar
[4] Chengzao J., Caiceng Z., Jianzhong L., et al., Evaluation criteria, main types, basic characteristics and resource prospects of tight oil in China, Acta Petrolei- Sinica, 2012, 33(3), 343-350.Search in Google Scholar
[5] Caineng Z., Zhi Y., Rukai Z., et al., Unconventional oil and gas exploration, development and theoretical and technological advances in China, Geological J., 2015, 89(6), 979-1007.10.1111/1755-6724.12491Search in Google Scholar
[6] Behzad G., Allen G., Thomas E., et al., Saturation dependence of transport in porous media predicted by percolation and effective medium theories, Fractals, 2015, 23(1), 1540004.10.1142/S0218348X15400046Search in Google Scholar
[7] Huawei Z., Zhengfu N., Qing W. et al., Petrophysical characterization of tight oil reservoirs using pressure-controlled porosimetry combined with rate-controlled porosimetry, Fuel, 2015, 154, 233-242.10.1016/j.fuel.2015.03.085Search in Google Scholar
[8] Hao W., Chunlin Z., Youliang J. et al., An improved method of characterizing the pore structure in tight oil reservoirs: Integrated NMR and constant-rate-controlled porosimetry data, J. Petrol. Sci. Eng., 2018, DOI: 10.1016/j.petrol.2018.03.065.10.1016/j.petrol.2018.03.065Search in Google Scholar
[9] Qianhua X., Hao Z., Zhengming Y. et al., Low temperature nitrogen adsorption experiment in typical tight oil region in China, Special Oil and Gas Reservoirs, 2015, 22(4), 82-85.Search in Google Scholar
[10] Bo L., Hongsong L., YongjunW. et al., Micro-pore characteristics of tight oil reservoirs in the Da’anzhai Formation of the Ziliujing Formation in Central Sichuan Basin, J. Chengdu Univ. Techn. Sci. & Technol. Ed., 2018, 45(2), 211-220.Search in Google Scholar
[11] Shangwen Z., Huaqing X., Wei G., Experiments on the movable fluid of the Jurassic tight oil reservoir in the Middle Sichuan Basin, J. Liaoning Techn. Univ. (Natural Science Ed.), 2014(6), 768-772.Search in Google Scholar
[12] Kelai X., Yingchang G., Beyene G. et al., How does the pore-throat size control the reservoir quality and oiliness of tight sandstones? The case of the Lower Cretaceous Quantou Formation in the southern Songliao Basin, China, Marine Petrol. Geology, 2016, 76, 1-15.10.1016/j.marpetgeo.2016.05.001Search in Google Scholar
[13] Zhengming Y., Experimental technique for special low-ultra-low permeability reservoirs, 2012, Beijing, Petrol. Industry Press.Search in Google Scholar
[14] Shaoyong W., Jianzhong L., Denghua L. et al., The potential of tight oil resource in Jurassic Da’anzhai Formation of the Gongshanmiao oil field, central Sichuan Basin, Geology in China, 2013, 40(2), 477-486.Search in Google Scholar
[15] Xizhe L., Zhenhua G., Yujin W. et al., Geological characteristics and development strategies for Cambrian Longwangmiao Formation gas reservoir in Anyue gas field, Sichuan Basin, SW China, Petrol. Explor. Development, 2017, 44(3), 398-406.10.1016/S1876-3804(17)30049-6Search in Google Scholar
[16] Xizhe L., Zhenhua G.,Yong H. et al., Eflcient development strategies for large ultra-deep structural gas fields in China, Petrol. Explor. Development, 2018, 45(1), 111-118.10.1016/S1876-3804(18)30011-9Search in Google Scholar
[17] Bin Z., Jian H., Jiajing Y. et al., Control of tight source oil distribution by source rocks: A case study of Da’an Village in the Sichuan Basin, Bulletin of Mineralogy, Geochem., 2015, 34(1), 45-54.Search in Google Scholar
[18] Wei L., Zhengming Y., Xizhe L. et al., A method to select representative rock samples for digital core modeling, Fractals, 2017, 25(4),1740013.10.1142/S0218348X17400138Search in Google Scholar
[19] Wei L., Xizhe L., Zhengming Y. et al., Construction of dual pore 3-D digital cores with a hybrid method combined with physical experiment method and numerical reconstruction method, Transport in porous media, 2017, 120(1), 227-238.10.1007/s11242-017-0917-xSearch in Google Scholar
[20] Zhengming Y., Yingzhi Z., Mingqiang H. et al., Comprehensive reservoir evaluation method for low permeability oil fields, Acta PetroleiSinica, 2006, 27(2), 64-67.Search in Google Scholar
[21] Dianshi X., Zhengyuan L., Shu J. et al., Comparison and integration of experimental methods to characterize the full-range pore features of tight gas sandstone-A case study in Songliao Basin of China, Journal of Natural Gas Science & Engineering, 2016, 34,1412-1421.10.1016/j.jngse.2016.08.029Search in Google Scholar
[22] Hao W., Chunlin Z., Youliang J. et al., Size characterization of pore-throat in tight sandstone and control of reservoir properties: A case study of Yanchang Formation in Longdong area of Ordos Basin, Acta PetroleiSinica, 2017, 38(8), 876-887.Search in Google Scholar
[23] Weicheng L., Yanmei Z., Fang W. et al., Micropore-throat characteristics of tight oil reservoirs using constant-pressure mercury-intrusion technique: A case study of the Upper Triassic Yan-chang Formation in the Ordos Basin, Lithologic Reservoirs, 2012, 24(6), 60-65.Search in Google Scholar
[24] Daopin L., Development of low permeability sandstone oil-field,1997, Beijing, Petrol. Industry Press.Search in Google Scholar
[25] Qiang L., Study on the seepage mechanism of tight reservoirs in Sichuan Basin,2014, Beijing, Graduate University of Chinese Academy of Sciences (Institute of Fluid Dynamics).Search in Google Scholar
[26] Ganesh C., et al., Integratedmanagement of oilfield water injection development, 2001, Beijing, Petrol. Industry Press.Search in Google Scholar
[27] Ruifei W., Pingping S., Ziqi S. et al., Microscopic pore-throat characteristics of reservoirs in ultra-lowpermeability sandstone reservoirs, Editorial offlce of ACTA Petrolei Sinica, 2009, 30(4), 560-563.Search in Google Scholar
[28] Zhihai C., Microscopic pore-throat distribution and evaluation of movable oil in ultra-low permeability reservoirs: A case study of the Yingcheng Formation reservoir in Shiwu Oilfield, Petrol. Geology Sinica, 2011, 33(6), 657-661.Search in Google Scholar
[29] Wei X., Qun L., Xiangui L. et al., Proposed pressure gradient for low permeability reservoirs, Petrol. Explor. Development, 2009, 36(2), 232-236.10.1016/S1876-3804(09)60123-3Search in Google Scholar
[30] Yadong Q., Ailin J., Zhengming Y. et al., Feasibility evaluation method for water injection development in ultra-low permeability sandstone reservoirs, J. Centr. South Univ. Nat. Sci., 2014(11), 3886-3892.Search in Google Scholar
[31] Gavin L., Pre-Dancy flow: A missing piece of the improved oil recovery puzzle,SPE/DOE Symposium on Improved Oil Recovery, Soc. Petrol. Eng., 2004.10.2118/89433-MSSearch in Google Scholar
[32] Yuan H., Swanson B., Resolving pore-space characteristics by rate-controlled porosimetry, Spe Formation Evaluation, 1989, 4(1), 17-24.10.2118/14892-PASearch in Google Scholar
[33] Junchang S., Zhengming Y., Qianhua X., Development history of constant speed mercury injection technology and its application in oil and gas field development, Adv. Porous Flow, 2011, 1(1), 1-7.10.4236/apf.2011.11011Search in Google Scholar
[34] Mandelbrot B., The fractal geometry of nature,1982, New York, WH Freeman & Co.Search in Google Scholar
[35] Xinfang M., Shicheng Z., Zhaoxin L., Fractal dimension of pore structure calculated by piecewise regression method, J. China Univ. Petrol., 2004, 28(6), 54-56.Search in Google Scholar
[36] Xianguo Z., Tao Z., Chengyan L., Evaluation of pore structure of low permeability reservoir based on pore fractal feature, Litho-logic Reservoirs, 2013, 25(6), 40-45.Search in Google Scholar
[37] Naveen P., Asif M., Ojha K., Integrated fractal description of nanopore structure and its effect on CH4, adsorption on Jharia coals, India, Fuel, 2018, 232,190-204.10.1016/j.fuel.2018.05.124Search in Google Scholar
[38] Rui S., Mengmeng C., Jianjun L. et al., A pore-scale simulation on thermal-hydromechanical coupling mechanism of rock, Geofluids, 2017(21), 7510527.10.1155/2017/7510527Search in Google Scholar
[39] Rui S., Mengmeng C., Jianjun L., A correlation for heat transfer and flow friction characteristics of the offset strip fin heat exchanger, Int. J. Heat & Mass Transf., 2017, 115(PB), 695-705.10.1016/j.ijheatmasstransfer.2017.08.054Search in Google Scholar
[40] Rui S., Jianjun L., Mengmeng C., A new method to reconstruct structured mesh model from micro-computed tomography images of porous media and its application, Int. J. Heat & Mass Transf., 2017, 109, 705-715.10.1016/j.ijheatmasstransfer.2017.02.053Search in Google Scholar
[41] Liang Y., Ruicheng G., Qi’an M. et al., Sequence characteristics and control factors of the Lower Cretaceous in the Tanan Sag, Tamuztag Basin, China, Geological J., 2009, 83(6),827-835.Search in Google Scholar
[42] Wei L., Xizhe L., Zhengming Y. et al., A new improved threshold segmentation method for scanning images of reservoir rocks considering pore fractal characteristics, Fractals, 2018, 26(2),1840003.10.1142/S0218348X18400030Search in Google Scholar
[43] Yu S., Yadong Q., Zhengming Y. et al., Fractal study of low-permeability reservoirs based on constant rate mercury injection, Petrol. Geology Rec., 2009, 16(2), 88-90.Search in Google Scholar
[44] Rui S., Mengmeng C., Jianjun L., Single and multiple objective optimization of a natural gas liquefaction process, Energy, 2017, 124, 19-28.10.1016/j.energy.2017.02.073Search in Google Scholar
[45] Ruifei W., Pingping S., Ziqi S. et al., Micro pore-throat characteristics of ultra-low permeability sandstone reservoirs, Acta Petrolei Sinica, 2009, 30(4), 560-563.Search in Google Scholar
© 2018 X. Zhao et al., published by De Gruyter
This work is licensed under the Creative Commons Attribution-NonCommercial-NoDerivatives 4.0 License.
Articles in the same Issue
- Regular Articles
- A modified Fermi-Walker derivative for inextensible flows of binormal spherical image
- Algebraic aspects of evolution partial differential equation arising in the study of constant elasticity of variance model from financial mathematics
- Three-dimensional atom localization via probe absorption in a cascade four-level atomic system
- Determination of the energy transitions and half-lives of Rubidium nuclei
- Three phase heat and mass transfer model for unsaturated soil freezing process: Part 1 - model development
- Three phase heat and mass transfer model for unsaturated soil freezing process: Part 2 - model validation
- Mathematical model for thermal and entropy analysis of thermal solar collectors by using Maxwell nanofluids with slip conditions, thermal radiation and variable thermal conductivity
- Constructing analytic solutions on the Tricomi equation
- Feynman diagrams and rooted maps
- New type of chaos synchronization in discrete-time systems: the F-M synchronization
- Unsteady flow of fractional Oldroyd-B fluids through rotating annulus
- A note on the uniqueness of 2D elastostatic problems formulated by different types of potential functions
- On the conservation laws and solutions of a (2+1) dimensional KdV-mKdV equation of mathematical physics
- Computational methods and traveling wave solutions for the fourth-order nonlinear Ablowitz-Kaup-Newell-Segur water wave dynamical equation via two methods and its applications
- Siewert solutions of transcendental equations, generalized Lambert functions and physical applications
- Numerical solution of mixed convection flow of an MHD Jeffery fluid over an exponentially stretching sheet in the presence of thermal radiation and chemical reaction
- A new three-dimensional chaotic flow with one stable equilibrium: dynamical properties and complexity analysis
- Dynamics of a dry-rebounding drop: observations, simulations, and modeling
- Modeling the initial mechanical response and yielding behavior of gelled crude oil
- Lie symmetry analysis and conservation laws for the time fractional simplified modified Kawahara equation
- Solitary wave solutions of two KdV-type equations
- Applying industrial tomography to control and optimization flow systems
- Reconstructing time series into a complex network to assess the evolution dynamics of the correlations among energy prices
- An optimal solution for software testing case generation based on particle swarm optimization
- Optimal system, nonlinear self-adjointness and conservation laws for generalized shallow water wave equation
- Alternative methods for solving nonlinear two-point boundary value problems
- Global model simulation of OH production in pulsed-DC atmospheric pressure helium-air plasma jets
- Experimental investigation on optical vortex tweezers for microbubble trapping
- Joint measurements of optical parameters by irradiance scintillation and angle-of-arrival fluctuations
- M-polynomials and topological indices of hex-derived networks
- Generalized convergence analysis of the fractional order systems
- Porous flow characteristics of solution-gas drive in tight oil reservoirs
- Complementary wave solutions for the long-short wave resonance model via the extended trial equation method and the generalized Kudryashov method
- A Note on Koide’s Doubly Special Parametrization of Quark Masses
- On right-angled spherical Artin monoid of type Dn
- Gas flow regimes judgement in nanoporous media by digital core analysis
- 4 + n-dimensional water and waves on four and eleven-dimensional manifolds
- Stabilization and Analytic Approximate Solutions of an Optimal Control Problem
- On the equations of electrodynamics in a flat or curved spacetime and a possible interaction energy
- New prediction method for transient productivity of fractured five-spot patterns in low permeability reservoirs at high water cut stages
- The collinear equilibrium points in the restricted three body problem with triaxial primaries
- Detection of the damage threshold of fused silica components and morphologies of repaired damage sites based on the beam deflection method
- On the bivariate spectral quasi-linearization method for solving the two-dimensional Bratu problem
- Ion acoustic quasi-soliton in an electron-positron-ion plasma with superthermal electrons and positrons
- Analysis of projectile motion in view of conformable derivative
- Computing multiple ABC index and multiple GA index of some grid graphs
- Terahertz pulse imaging: A novel denoising method by combing the ant colony algorithm with the compressive sensing
- Characteristics of microscopic pore-throat structure of tight oil reservoirs in Sichuan Basin measured by rate-controlled mercury injection
- An activity window model for social interaction structure on Twitter
- Transient thermal regime trough the constitutive matrix applied to asynchronous electrical machine using the cell method
- On the zagreb polynomials of benzenoid systems
- Integrability analysis of the partial differential equation describing the classical bond-pricing model of mathematical finance
- The Greek parameters of a continuous arithmetic Asian option pricing model via Laplace Adomian decomposition method
- Quantifying the global solar radiation received in Pietermaritzburg, KwaZulu-Natal to motivate the consumption of solar technologies
- Sturm-Liouville difference equations having Bessel and hydrogen atom potential type
- Study on the response characteristics of oil wells after deep profile control in low permeability fractured reservoirs
- Depiction and analysis of a modified theta shaped double negative metamaterial for satellite application
- An attempt to geometrize electromagnetism
- Structure of traveling wave solutions for some nonlinear models via modified mathematical method
- Thermo-convective instability in a rotating ferromagnetic fluid layer with temperature modulation
- Construction of new solitary wave solutions of generalized Zakharov-Kuznetsov-Benjamin-Bona-Mahony and simplified modified form of Camassa-Holm equations
- Effect of magnetic field and heat source on Upper-convected-maxwell fluid in a porous channel
- Physical cues of biomaterials guide stem cell fate of differentiation: The effect of elasticity of cell culture biomaterials
- Shooting method analysis in wire coating withdrawing from a bath of Oldroyd 8-constant fluid with temperature dependent viscosity
- Rank correlation between centrality metrics in complex networks: an empirical study
- Special Issue: The 18th International Symposium on Electromagnetic Fields in Mechatronics, Electrical and Electronic Engineering
- Modeling of electric and heat processes in spot resistance welding of cross-wire steel bars
- Dynamic characteristics of triaxial active control magnetic bearing with asymmetric structure
- Design optimization of an axial-field eddy-current magnetic coupling based on magneto-thermal analytical model
- Thermal constitutive matrix applied to asynchronous electrical machine using the cell method
- Temperature distribution around thin electroconductive layers created on composite textile substrates
- Model of the multipolar engine with decreased cogging torque by asymmetrical distribution of the magnets
- Analysis of spatial thermal field in a magnetic bearing
- Use of the mathematical model of the ignition system to analyze the spark discharge, including the destruction of spark plug electrodes
- Assessment of short/long term electric field strength measurements for a pilot district
- Simulation study and experimental results for detection and classification of the transient capacitor inrush current using discrete wavelet transform and artificial intelligence
- Magnetic transmission gear finite element simulation with iron pole hysteresis
- Pulsed excitation terahertz tomography – multiparametric approach
- Low and high frequency model of three phase transformer by frequency response analysis measurement
- Multivariable polynomial fitting of controlled single-phase nonlinear load of input current total harmonic distortion
- Optimal design of a for middle-low-speed maglev trains
- Eddy current modeling in linear and nonlinear multifilamentary composite materials
- The visual attention saliency map for movie retrospection
- AC/DC current ratio in a current superimposition variable flux reluctance machine
- Influence of material uncertainties on the RLC parameters of wound inductors modeled using the finite element method
- Cogging force reduction in linear tubular flux switching permanent-magnet machines
- Modeling hysteresis curves of La(FeCoSi)13 compound near the transition point with the GRUCAD model
- Electro-magneto-hydrodynamic lubrication
- 3-D Electromagnetic field analysis of wireless power transfer system using K computer
- Simplified simulation technique of rotating, induction heated, calender rolls for study of temperature field control
- Design, fabrication and testing of electroadhesive interdigital electrodes
- A method to reduce partial discharges in motor windings fed by PWM inverter
- Reluctance network lumped mechanical & thermal models for the modeling and predesign of concentrated flux synchronous machine
- Special Issue Applications of Nonlinear Dynamics
- Study on dynamic characteristics of silo-stock-foundation interaction system under seismic load
- Microblog topic evolution computing based on LDA algorithm
- Modeling the creep damage effect on the creep crack growth behavior of rotor steel
- Neighborhood condition for all fractional (g, f, n′, m)-critical deleted graphs
- Chinese open information extraction based on DBMCSS in the field of national information resources
- 10.1515/phys-2018-0079
- CPW-fed circularly-polarized antenna array with high front-to-back ratio and low-profile
- Intelligent Monitoring Network Construction based on the utilization of the Internet of things (IoT) in the Metallurgical Coking Process
- Temperature detection technology of power equipment based on Fiber Bragg Grating
- Research on a rotational speed control strategy of the mandrel in a rotary steering system
- Dynamic load balancing algorithm for large data flow in distributed complex networks
- Super-structured photonic crystal fiber Bragg grating biosensor image model based on sparse matrix
- Fractal-based techniques for physiological time series: An updated approach
- Analysis of the Imaging Characteristics of the KB and KBA X-ray Microscopes at Non-coaxial Grazing Incidence
- Application of modified culture Kalman filter in bearing fault diagnosis
- Exact solutions and conservation laws for the modified equal width-Burgers equation
- On topological properties of block shift and hierarchical hypercube networks
- Elastic properties and plane acoustic velocity of cubic Sr2CaMoO6 and Sr2CaWO6 from first-principles calculations
- A note on the transmission feasibility problem in networks
- Ontology learning algorithm using weak functions
- Diagnosis of the power frequency vacuum arc shape based on 2D-PIV
- Parametric simulation analysis and reliability of escalator truss
- A new algorithm for real economy benefit evaluation based on big data analysis
- Synergy analysis of agricultural economic cycle fluctuation based on ant colony algorithm
- Multi-level encryption algorithm for user-related information across social networks
- Multi-target tracking algorithm in intelligent transportation based on wireless sensor network
- Fast recognition method of moving video images based on BP neural networks
- Compressed sensing image restoration algorithm based on improved SURF operator
- Design of load optimal control algorithm for smart grid based on demand response in different scenarios
- Face recognition method based on GA-BP neural network algorithm
- Optimal path selection algorithm for mobile beacons in sensor network under non-dense distribution
- Localization and recognition algorithm for fuzzy anomaly data in big data networks
- Urban road traffic flow control under incidental congestion as a function of accident duration
- Optimization design of reconfiguration algorithm for high voltage power distribution network based on ant colony algorithm
- Feasibility simulation of aseismic structure design for long-span bridges
- Construction of renewable energy supply chain model based on LCA
- The tribological properties study of carbon fabric/ epoxy composites reinforced by nano-TiO2 and MWNTs
- A text-Image feature mapping algorithm based on transfer learning
- Fast recognition algorithm for static traffic sign information
- Topical Issue: Clean Energy: Materials, Processes and Energy Generation
- An investigation of the melting process of RT-35 filled circular thermal energy storage system
- Numerical analysis on the dynamic response of a plate-and-frame membrane humidifier for PEMFC vehicles under various operating conditions
- Energy converting layers for thin-film flexible photovoltaic structures
- Effect of convection heat transfer on thermal energy storage unit