Multiscale monitoring of oleogels during thermal transition
-
 ,
,

Abstract
Thermal transitions, such as crystallization or relaxation, in heterogeneous materials are complex and occur at different length and time scales. Several devices are necessary for their analysis, leading to varying boundary conditions and multiple specimens across measurements. This study investigated the thermal transitions of oleogels, designed to replace animal products, composed of rapeseed oil with 20% w/w oleogelator. Three oleogels with either rice bran wax (RBX), ethyl cellulose (EC), or a 1:1 mixture of both were analyzed. To capture dynamic mechanisms at multiple length and time scales, a simultaneous multiscale experiment was conducted on a single sample under the same conditions. Accordingly, Raman and dielectric spectroscopy were coupled with dynamic mechanical analysis (DMA) over a temperature range of 150 to −10°C. Differential scanning calorimetry was also performed to validate the results. DMA revealed a gradual glass transition in EC oleogels at ∼120°C. Raman spectroscopy complemented these findings, providing detailed molecular insights into RBX crystallization starting at ∼60°C until ∼5°C, not detectable with DMA. Dielectric spectroscopy extended the frequency range of DMA and revealed a temperature-activated relaxation process > 500 Hz at ∼5°C in RBX-containing samples. This study demonstrated the potential of multiscale analyses to link mechanical, dielectric, and chemical processes to complex thermal processes occurring in soft materials such as oleogels. Furthermore, these results provide a basis for improving the applicability of plant-based fat substitutes.
Abbreviations
- DMA
-
dynamic mechanical analysis
- DSC
-
differential scanning calorimetry
- EC
-
ethyl cellulose
- RBX
-
rice bran wax
1 Introduction
Food science faces the challenge of precisely detecting thermal events across multiple length and time scales. These events, such as crystallization or glass transitions in heterogeneous materials, are complex and usually require multiple analytical devices to be properly quantified. This leads to variations in specimen geometries, sample environmental conditions, mechanical loading, or thermal histories, i.e., differing initial and boundary conditions across the experiments. For instance, oleogel crystallization can vary significantly if small quantities solidify under oscillatory shear in a rheometer compared to bulk crystallization under static conditions in a beaker. Similarly, the glass transition temperature can shift depending on the sample geometry or cooling rate. Thus, data interpretation and conclusions regarding thermal events are system-dependent and sometimes difficult to compare across methodologies.
The self-assembly of triacyl glycerides into lamellar crystal structures and the stacking of those into larger crystal clusters are responsible for the structure of fat [1]. These structures are needed in various foods, providing better texture, spreading, processing, and shelf life, while liquid oils cannot mimic those properties [2,3]. Since these structures build up across multiple length and time scales, techniques like differential scanning calorimetry (DSC), dynamic mechanical analysis (DMA), and Raman spectroscopy are vital in their characterization. With a recent trend of substituting animal-based products with plant-based counterparts, research on fat alternatives is increasing. Although traditional approaches like hydrogenation are efficient for oil structuring, they can cause the formation of harmful trans-fatty acids [4]. Therefore, an alternative approach is necessary. Oleogelation structures liquid oils into viscoelastic gels without creating trans-fatty acids and allows a reduction of saturated fatty acids in food products [5].
Rice bran wax (RBX) is a natural wax, which is mainly composed of wax esters (>90%) and varying proportions of free fatty acids, fatty alcohols, and hydrocarbons [6]. It has a high melting temperature ranging from 76 to 84°C and is a potent gelator, capable of forming oleogels at concentrations as low as 1 wt% [7–11]. These wax-based oleogels are stabilized by a three-dimensional crystal network entrapping liquid oil within its pores and oil adsorption onto the crystal surfaces [12]. Another oleogelation strategy involves the formation of noncovalent junction zones with polymers. Ethyl cellulose (EC) is the only food-grade polymer able to gel oils due to its hydrophobic and semi-crystalline properties [13]. Inducing oleogelation includes heating the EC–oil mixture above the glass transition temperature (>130°C, depending on the molecular weight), followed by a cooling step [14,15]. Multicomponent oleogels with polymeric and crystalline gelation strategies have shown some promising properties in the context of substituting animal-based fats [13,16–19]. This work analyzes single-component oleogels containing EC and RBX to evaluate the impact of each oleogelator, as well as multicomponent oleogels with a 1:1 combination of EC and RBX to assess their interactions and combined effects. The final product is a clear example of a complex hierarchical structure whose formation and final properties are governed by mechanisms at different length and time scales.
Previous studies analyzed liquid–sol transitions in foods and other soft materials separately with DMA, Raman spectroscopy, and dielectric spectroscopy [20–22]. Although different aspects of these transitions were observable, specific boundary conditions, such as temperature and chemical composition of sample batches, are responsible for precise transition points, necessitating a combined analysis approach. To capture these characteristics across multiple domains simultaneously, a multiscale experiment performed on a single specimen under identical environmental conditions is preferred. This guarantees identical initial and boundary conditions, leading to enhanced reliability and consistency in measurements across different methodologies.
This study employs a simultaneous multiscale analytical approach by integrating Raman spectroscopy, dielectric spectroscopy, and DMA to investigate the structural, dielectric, and mechanical properties of oleogels. Each method provides complementary insights at different length and time scales. Raman spectroscopy reveals phase transitions at the intramolecular level, dielectric spectroscopy captures dipolar relaxation and ion mobility within the oleogel network, while DMA assesses mechanical viscoelastic properties critical for texture and stability. For comparative purposes, DSC was also employed.
By coupling these techniques under a thermal gradient, we aim to evaluate the combination of DMA, Raman spectroscopy, and dielectric spectroscopy in the analysis of liquid–sol transition of oleogels. We hypothesize that the simultaneous combination of these methods will give unambiguous parameters for the glass transition of EC and the crystallization of RBX in oleogels at different length and time scales.
To the best of the author’s knowledge, this is the first time that these three techniques have been combined in a single experiment. Thus, this contribution also aims to evaluate the advantages and limitations of the method in order to establish a framework for future studies on similarly complex soft materials. The article is organized as follows: Materials and methods are described in Section 2. The experimental results and the discussion are provided in Section 3. Finally, the conclusions in Section 4 provide a summary of the results.
2 Materials and methods
2.1 Materials
Rapeseed oil was obtained from a local food retail market (MEGA eG, Stuttgart, Germany). Butylated hydroxytoluene (W218405-1KG-K) was supplied by Sigma-Aldrich (St. Louis, MI, USA) and EC (Ethocel Standard 10 Premium) by DOW Wolf Cellulosics GmbH (Bomlitz, Germany). Koster Keunen Holland B.V. (Aalst, Netherlands) kindly provided RBX (E00130).
2.2 Sample preparation
RBX and EC were mixed with 20 wt% total oleogelator concentration in the following ratios (RBX:EC): 20:0, 10:10, and 0:20. Each mixture was added to a beaker with 80 wt% rapeseed oil with an addition of 0.5 ppm butylated hydroxytoluene and transferred into an oil bath. The suspension was mixed with a propeller stirrer (100 rpm), heated from room temperature to 150 ± 1°C, and held for 10 min to fully dissolve the components. Then, the liquid oleogel was poured into a plastic mold with dimensions of 120 mm (length) × 120 mm (width) × 4 mm (height) and subsequently cooled for 25 min at 7°C. Finally, the oleogel was further processed and stored according to the experiments.
2.3 DSC
A DSC 8000 (Perkin Elmer, Waltham, Massachusetts, USA) was used for DSC measurements. Pieces of the oleogel were stored at 4°C for 1 day. Approximately 2–4 mg oleogel was weighed into an aluminum pan and sealed hermetically. The samples were heated from 20 to 140°C at a rate of 5 K/min with a holding time of 1 min at each start and end temperature and then subjected to a re-cooling process under the same conditions. Thermo-event temperatures were determined using the Pyris software from Perkin Elmer. Each oleogel was measured in triplicate.
2.4 Simultaneous DMA, dielectric, and Raman spectroscopy
The simultaneous dielectric, Raman, and dynamic mechanical characterization of the material was conducted by coupling a rheometer (MCR302e, Anton Paar, Graz, Austria) with an LCR meter (IM35536, Hioki, Ueda, Japan) and a Raman spectrometer (Cora 5001, Anton Paar, Graz, Austria). The rheometer was equipped with a glass-Peltier temperature unit for plate-plate and cone-plate measuring systems, paired with a Peltier hood. The glass plate inserted into the Peltier temperature device was coated on the upper side with an indium tin oxide coating, providing conductive properties while maintaining transparency for Raman spectroscopy. The Raman probe was placed right below the glass plate, measuring at one fixed position of the plate, which can be adjusted by an xy-adjustment screw. The contact between the LCR meter and measuring cell was established by a silver-wire contact to the upper measuring system, enabling it to oscillate with almost no friction due to the contact. The second contact was established by placing a copper ring on top of the indium tin oxide-coated glass plate, which was pressed on the surface by the mounting screw of the glass plate. The measurement was synchronized by the rheometer, submitting trigger signals to the Raman spectrometer and LCR meter. Figure 1 summarizes the experimental setup.
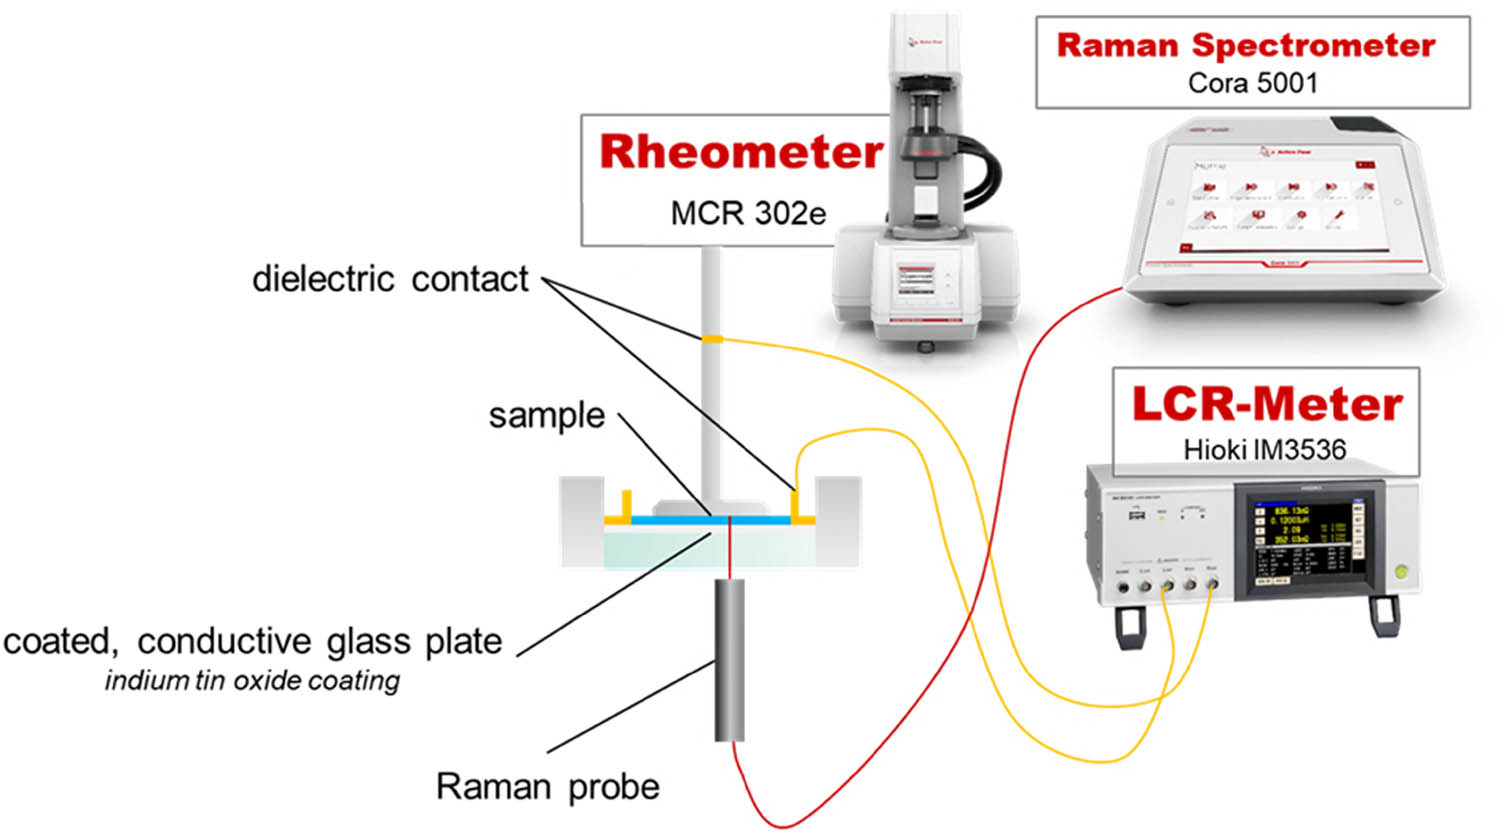
Schematic experimental setup of the multi-scale experiment. An indium tin oxide-coated glass temperature unit mounted to a rheometer served as a measuring cell for dielectric spectroscopy, Raman spectroscopy, and DMA from 150 to −10°C.
The aim of this work is to demonstrate the benefits of a novel combination of dielectric spectroscopy, Raman spectroscopy, and DMA. Accordingly, the data are discussed qualitatively. Reproducibility was assessed for one of the presented samples (data not shown) and showed a standard deviation in the range of 5–7% across all tested methods.
2.4.1 DMA
The macroscopic mechanical properties of the sample were obtained by an oscillatory measurement with the rheometer. The measurements were performed in plate-plate geometry [ISO 3219-2] using an upper plate with a diameter of 40 mm. The gap was adjusted to 0.5 mm as the sample was in a molten/amorphous state (150°C). A temperature-sweep between 150°C and −10°C was performed. Measurement points were taken every 30 s at a cooling rate of 2 K/min, resulting in 1 point per Kelvin. The shear strain was linearly decreased from 10 to 1%. A constant frequency of 1 Hz was set for the experiment. At this frequency, the shear strain remained within the linear viscoelastic range during the temperature sweep.
2.4.2 Dielectric spectroscopy
The parallel plate geometry served as a measurement cell for the dielectric experiment since it acted as a capacitor. At each measurement point of the rheometer, the LCR meter applied a sinusoidal alternating current voltage of 0.5 V with a frequency varying from 10 Hz to 1 MHz. The dielectric frequency sweep consisted of 100 logarithmically spaced points across this range and was completed in approximately 16 s. The complex impedance
2.4.3 Raman spectroscopy
The Raman probe was located right below the glass plate of the temperature unit of the rheometer and adjusted in the z-direction for the highest signal intensity. In the y-direction, the laser was positioned in the middle of the measuring cell. A probe with a 785 nm wavelength was operated at 450 mW in the reflection mode. At each measuring point of the rheometer, the spectra were obtained using a Raman spectrometer from 100 to 2,300 cm−1. The exposure time was set to 5 s. Afterward, the spectra were baseline-corrected and normalized over the band at 1,440 cm−1.
3 Results and discussion
3.1 DSC
Representative thermograms for all oleogels are shown in Figure 2. During heating, a single endothermic melting event was determined for both wax-containing oleogels. The RBX oleogels show a higher melting peak at 75.3 ± 0.6°C compared to the RBX:EC oleogels, which have a melting peak at 72.3 ± 0.9°C. This shift can be mainly attributed to the differences in the wax concentration as previously described for other waxes [19].

Representative heating (a) and cooling (b) thermograms of oleogels with three different ratios of RBX and EC. Measurements were performed from 20 to 140°C and back to 20°C at a rate of 5 K/min. The curves are labeled as RBX:EC ratios (w/w, relative to the total sample).
Similar behavior was found in the cooling cycle with one crystallization event and a higher crystallization peak for the RBX oleogels, relative to the multicomponent oleogels. RBX oleogels exhibit a peak crystallization temperature at 72.2 ± 0.2°C, and RBX:EC oleogels at 68.7 ± 0.4°C. Single melting and crystallization behavior was observed in previous studies with wax and EC containing oleogels [19,23]. Furthermore, RBX is considered a chemically homogeneous wax, with no more than one crystallization and melting peak per sample expected [9,11].
These thermodynamic events originate from a phase transition of RBX, involving combinations of either melting, dissolution, or crystallization, as extensively described in the literature [6,8,24,25]. The melting point for pure RBX has been determined to be in the range of 76–84°C [9–11]. Oleogels’ melting points are lower compared to those of the virgin waxes due to the solubility of the wax components in oil [8,25]. Thermal hysteresis between the recorded melting and crystallization events is a common crystallographic phenomenon explained by the energy barrier of nucleation. Therefore, recorded crystallization temperatures of RBX ranged between 76 and 70°C [8,9].
EC oleogels display no melting or crystallization events in the recorded temperature range, which is in accordance with the literature since semi-crystalline EC starts to melt at ∼180°C [15,26]. EC typically shows a glass transition at 120–135°C [17,26]. This is visible within the cooling cycle of EC oleogels at 130.3 ± 1.6°C. On the other hand, no glass transition is apparent in the heating cycle, which can be linked to thermal hysteresis, which has been described for EC oleogels before [26]. As seen in previous studies as well, no thermal events are observed at or below the glass transition temperature of EC [19,23,26–28]. This has been suggested as an indicator for no secondary structure formation of EC in oleogels [26]. These thermodynamic events are necessary to induce gelation, forming self-stable oleogels, which are necessary for plant-based fat alternatives [29]. Their analysis gives a deeper understanding of these processes and the thermal parameters that are crucial for food production.
3.2 DMA
Figure 3 shows the complex shear modulus

Complex shear modulus
The main glass transition can also be read from Figure 3b as a clear maximum in the loss factor for samples containing EC. The EC oleogel shows a maximum at a temperature of about 136°C, while the RBX:EC oleogel shows the maximum at a temperature of about 117°C. In addition, the RBX:EC oleogel shows the maximum in
3.3 Dielectric spectroscopy
In the dielectric spectroscopy, an electric current flowing through the sample in response to alternating electric fields generated by the LCR meter was measured as a function of the field frequency, which varied between 10 Hz and 1 MHz. Thus, the dielectric material was internally polarized. This interaction with the applied electric field results in a redistribution of charge within the atoms and molecules of the dielectric [20]. Consequently, two main raw dielectric data can be obtained from the experiment: the impedance

Frequency-dependent complex impedance
Samples with EC exhibit a stronger resistive response at low frequencies, with a transition toward capacitive behavior at higher frequencies. Consequently, the dielectric loss factor follows a decreasing trend with frequency from 10 to 1,000 Hz. At higher temperatures, an even stronger effect can be observed. Thus, the dielectric loss increases at low frequencies with more EC content and with increasing temperature (compare Figure 4b, d, and f). This behavior is typical for high-loss dielectric polymers [33,34]. If the frequency range is extended to lower values, a peak in
Figure 5 shows the impedance at 50 Hz over temperature with distinct behaviors for all three samples. From 150 to 50°C, oleogels containing EC show a similar behavior with decreasing temperature. At 150°C, the impedance starts at a value of ∼20 MΩ, increasing rapidly to >50 MΩ. This increase can be associated with the glass transition of EC and reflects the dynamic mechanical behavior discussed earlier (Section 3.2, DMA). With higher EC content, the T G,EC shifts to higher temperatures in good accordance with Figure 3b. The RBX oleogel already starts at 50 MΩ and shows a broad peak around ∼85°C. Samples containing RBX present a similar curve with decreasing temperature from 50 to −10°C, showing a slight decrease in impedance. The EC oleogel impedance slightly increases with decreasing temperature.

Complex impedance
Figure 6 compares the dielectric loss factor,

Dielectric loss factor
In the kHz-frequency range, samples containing RBX exhibit an additional peak in the dielectric loss factor (see red triangles and blue squares in Figure 6c and d). This peak shifts toward higher temperatures as frequency increases, appearing at ∼25°C at 5 kHz and shifting to ∼45°C at 50 kHz. At 0.5 kHz, a slight bend in the wax-containing curves indicates a peak around 5°C. This behavior suggests a temperature-activated relaxation process linked to the crystallization of wax esters present in the RBX (T
c,RBX). Since primary crystallization processes are generally frequency independent, the observed peak shift suggests a structural reorganization in the crystalline phase rather than primary crystallization [37]. Crystal nucleation results in many dispersed needle-like crystals, interacting with high frequencies due to short length scales. As the temperature decreases, crystal growth proceeds, resulting in the formation of a superstructure. Larger structures show higher relaxation times; thus, the peak in
3.4 Raman spectroscopy
Representative Raman spectra with wavenumbers from 900 to 1,700 cm−1 for the cooling samples are shown in Figure 7. The focus of this analysis will remain on bands around 1,061, 1,080, 1,130, 1,296, and 1,440 cm−1, as they offer interpretations concerning the oleogel properties over the given temperature range. Less insightful bands in this context include 975 cm−1 ν(C–O–C), 1,275 cm−1 δ(C–H), and 1,630 cm−1 ν(C═C). These bands are less informative due to their rapeseed oil association, which is not actively involved in the oleogels’ property changes [40–42]. The prominent bands at 1,061 and 1,130 cm−1 are attributed to symmetrical and asymmetrical ν(C–C) stretching vibrations, respectively [41,43]. These indicate trans sequences longer than 10 bonds, while a broad band around 1,080 cm−1 is associated with a mixture of gauche and trans bonds over a long range [44]. This leads to a direct correlation between the intensity of the 1,061 and 1,130 cm−1 bands and the samples’ crystallinity due to a low probability of random trans bond sequences >10 [44]. The bands at 1,296 and 1,440 cm−1 can be attributed to δ(CH2) bending vibrations, while 1,296 cm−1 is subcategorized into twisting vibrations [43,45]. The bands at around 1,061, 1,080, and 1,130 cm−1 are overlapping as well as the 1,275 and 1,296 cm−1 bands. This complicates the analysis and quantification of these bands, but qualitative conclusions can still be drawn.

Raman spectra between 900 and 1,700 cm−1 obtained during the cooling process from 150 to −10°C of oleogels with three different ratios of RBX and EC. The intensities are normalized over the stable 1,440 cm−1 band intensity. The curves are labeled as RBX:EC ratios (w/w, relative to the total sample).
Next, the Raman spectra for the two RBX-containing oleogels are discussed, as they show the same chemical trends, albeit to a different extent. The band at 1,296 cm−1 shows a clear peak at high temperatures, which becomes narrower and increases in intensity with lower temperatures. This can be linked to a growth in the samples’ crystalline content and, therefore, a direct indicator for a phase transition. As RBX transitions from a liquid to a crystalline state, its bands become narrower. This is due to a more defined force constant of the vibrating chemical bonds. The Raman band’s wavenumber is dependent on the force constant of the vibrating bonds. In a less defined liquid chemical environment, they have a broader distribution, while crystals with high order over long ranges lead to narrower bands [41]. The bands at 1,061 and 1,130 cm−1 are barely visible at higher temperatures, becoming more apparent as the temperature decreases. As previously described, these bands increase in intensity during crystallization due to their trans bond sequential origin. Accordingly, the band at 1,080 cm−1 decreases in intensity. Additionally, a slight shift toward a lower wavenumber is visible (e.g., band 1,296 cm−1). This might be attributed to a shift in the polymorphic form of the RBX crystals, comparable to cocoa butter polymorphs [46]. The EC oleogel shows no signs of crystallization as most bands remain constant over the temperature range. The bands at 1,338 and 1,600 cm−1 have been linked to pure EC in previous work and are recognizable in the EC oleogel spectra, although not clearly [47]. In the RBX:EC oleogel spectra, these bands are probably not discernable because of the low concentration of EC.
Due to their high variability, the normalized intensities of bands 1,061, 1,130, and 1,296 cm−1 are plotted over the cooling range from 150 to −10°C in Figure 8. The EC oleogel shows no temperature-dependent change in any relative band intensity. The RBX containing oleogels also show no temperature dependency until ∼60°C when a sudden increase in the relative band intensity can be seen. This leads to the conclusion of a phase transition from a liquid to a crystalline state around this temperature (T c,RBX). After this initial step, a gradual increase is visible until ∼5°C, which could suggest continuous crystal growth or a crystallization phenomenon after the first-order crystallization. The RBX oleogel shows a steeper slope and a higher plateau at low temperatures compared to the RBX:EC oleogel. This can be attributed to a higher total crystalline content coming from the higher wax content. The EC oleogel shows no phase transition over the whole temperature range, as the relative band intensities remain constant. As there was no thermodynamic phase transition visible in the thermograms, no change was expected for these relative intensities. The Raman spectroscopy results are in good qualitative agreement with DMA and DSC, showing a higher crystallization temperature for the RBX compared to the RBX:EC oleogel.

Raman spectra of the peak intensities at 1,061, 1,130, and 1,296 cm−1 over the intensity at 1,440 cm−1 obtained during the cooling process from 150 to −10°C of oleogels with three different ratios of RBX and EC. The curves are labeled as RBX:EC ratios (w/w, relative to the total sample).
3.5 Insights from the multiscale analysis of oleogels
DMA directly provides mechanical properties and their temperature dependence, which are critical to the texture and stability of oleogels in food applications. Here, the measurement at 1 Hz is of special interest since this frequency correlates well with chewing conditions [48]. From Figure 3a, for example, it can be seen that at temperatures between 130 and about 60°C, samples with EC show a much higher mechanical stability than samples without EC. Besides, the dynamic mechanical measurements are valuable in providing information about the glass transition in the samples containing EC (see black circles and blue squares in Figure 3b). Within this context, DMA is a good complement to the DSC data, where the glass transition is only visible within the cooling cycle of EC oleogels as a small bending in the curves at temperatures of about 130°C (Figure 2).
DMA is also helpful in describing the onset of crystallization from a macroscopic point of view, but does not provide enough information about crystallization kinetics since there is not enough data resolution between the onset of crystallization, say 65°C, and the observed plateau in
Additional insights into the crystallization kinetics can be obtained by analyzing the intensities of the 1,061, 1,130, and 1,296 cm−1 bands from the simultaneously measured Raman spectra. As shown in Figure 8, the Raman data show higher resolution between 65 and 50°C compared to the mechanical data in the same temperature range, especially in the peak at 1,130 cm−1 corresponding to asymmetric ν(C–C) stretching vibrations. In fact, while
DMA is indeed a highly sensitive method for studying glass transitions, with the added advantage of providing insights into the time dependence of these phenomena. However, in the experiment presented here, measurements were performed at a single frequency (1 Hz), but this is where simultaneous dielectric spectroscopy becomes particularly valuable. Dielectric spectroscopy is interesting, first because the dielectric frequency range selected complements the mechanical range. Recall that the dielectric loss factor holds a similar physical meaning to the mechanical loss factor, as both correlate with the energy dissipated internally by the sample. Although in the dielectric case, the excitation is electrical rather than mechanical, it is still interesting to have a complementary frequency range. For example, at a mechanical frequency of 1 Hz, the maximum in
The second complementary advantage is that the dielectric excitation occurs significantly faster than mechanical excitation at 1 Hz. In fact, for each individual data point obtained in the DMA temperature sweep, a complete dielectric spectrum was acquired. In other words, we can obtain time-dependent information about the relaxation processes in the time it takes to perform the DMA. This can be clearly seen from Figure 9, where, for the sake of comparison, the dielectric loss factor is plotted as a function of temperature for different frequencies on a logarithmic scale, for each of the samples: EC oleogel (a), RBX:EC oleogel (b), and RBX oleogel (c). Although the maximum in the

Dielectric loss factor
We hypothesize that this maximum is related to a relaxation process associated with the crystallization of wax esters present in RBX (T
c,RBX). The shift of
The agreement with Raman spectroscopy is also interesting based on the study of the peaks at 1,061, 1,130, and 1,296 cm−1 (Figure 8). As the temperature decreases, the crystallization process continues (as seen in the gradual increase of the peak intensity in Figure 8), probably leading to the formation of larger structures. Larger structures should have longer relaxation times, so that the local maximum in
4 Conclusion
A multiscale approach consisting of simultaneous DMA, Raman spectroscopy, and dielectric spectroscopy was used for thermal monitoring of oleogels in a temperature range between 150 and −10°C. The oleogels, intended to replace animal products, consisted of rapeseed oil structured with 20% w/w oleogelator. Three oleogel systems with either RBX, EC, or a 1:1 mixture of both as oleogelator were analyzed. DSC was also performed as a reference technique to validate the thermal events observed in the multiscale experiment.
DMA, performed at 1 Hz using a parallel plate geometry, was useful to evaluate the mechanical properties and temperature dependence in the oleogels, particularly important to check food texture and stability. DMA was also found to be a valid method for detecting the gradual glass transition occurring in oleogels containing EC. However, DMA was limited in detecting the crystallization kinetics occurring at lower temperatures in wax-containing oleogels. Raman spectroscopy complemented this information by providing detailed molecular insights when analyzing changes in the peak intensities at 1,061, 1,130, and 1,296 cm−1, corresponding to symmetric and asymmetric ν(C–C) stretching vibrations and δ(CH2) bending vibrations, respectively.
Dielectric spectroscopy extended the frequency range of DMA and provided insight into thermal transitions on a much shorter time scale. This was of particular interest in detecting a new local maximum in the dielectric loss factor observed in wax-containing olegels at frequencies above 500 Hz. The maximum was found to be frequency-dependent, leading to the hypothesis that it is related to a relaxation process associated with crystal reorganization during crystallization of wax esters. However, this interpretation remains speculative and would require further confirmation through structural characterization techniques like X-ray diffraction. The coupling of Raman and dielectric spectroscopy was thus useful to follow the structural transition occurring during crystallization, which remains undetectable by DMA.
The integration of the multiscale experiment proved effective in understanding the complex process of oleogel formation across different length and time scales. The results presented here emphasize the importance of simultaneous coupling of complementary methods for a successful understanding of hierarchical and complex structures as well as their transformation. This is the only way to ensure identical initial and boundary conditions during the measurement, leading to improved reliability and consistency of the results. We believe that this multiscale approach can be applied to study other complex soft materials. For successful quantitative results, future research should consider statistical analyses wherever applicable. In future applications, not only thermal reactions could be measured, but also cross-linking, reaction kinetics, and curing reactions would be of significant interest.
Acknowledgments
The authors gratefully acknowledge Koster Keunen Holland B.V. (Aalst, Netherlands) and DOW Wolf Cellulosics GmbH (Bomlitz, Germany) for providing free samples used in this study. DeepL Write was used in this work for spell-checking and language editing purposes. All output was critically reviewed, treated as recommended, and revised prior to implementation.
-
Funding information: The authors state no funding involved.
-
Author contributions: Conceptualization: J.A.R.A., D.O., and S.M.; formal analysis: S.H., M.M., and D.O.; investigation: S.M., D.O., S.H., M.M., and J.A.R.A.; methodology: D.O., S.M., J.A.R.A., and M.M.; resources: J.A.R.A. and J.W.; supervision: J.A.R.A. and J.W.; visualization: J.A.R.A., S.M., and D.O.; writing – original draft: S.H., S.M., D.O., J.A.R.A., and M.M.; writing – review and editing: S.M., D.O., J.A.R.A., and J.W.
-
Conflict of interest: Authors state no conflict of interest.
-
Ethical approval: The conducted research is not related to either human or animal use.
-
Data availability statement: The datasets generated during and/or analyzed during the current study are available from the corresponding author on reasonable request.
References
[1] Marangoni AG, Garti N, editors. Edible oleogels: Structure and health implications. 2nd edn. London; San Diego, CA; Cambridge, MA; Oxford; London; San Diego, CA; Cambridge, MA; Oxford: AOCS Press Academic Press; 2018.Search in Google Scholar
[2] Yi B, Kim M-J, Lee SY, Lee J. Physicochemical properties and oxidative stability of oleogels made of carnauba wax with canola oil or beeswax with grapeseed oil. Food Sci Biotechnol. 2017;26(1):79–87.10.1007/s10068-017-0011-8Search in Google Scholar PubMed PubMed Central
[3] Weiss J, Mannweiler S, Salminen H. Precision processing for value-added fats and oils. Annu Rev Food Sci Technol. 2025;16(1):39–61.10.1146/annurev-food-111523-121237Search in Google Scholar PubMed
[4] Härröd M, Møller P. Hydrogenation of fats and oils at supercritical conditions. In: Rohr PRv, Trepp C, editors. Process technology proceedings: High pressure chemical engineering. Vol. 12. Amsterdam, Netherlands: Elsevier; 1996. p. 43–8.10.1016/S0921-8610(96)80009-4Search in Google Scholar
[5] Manzoor S, Masoodi FA, Naqash F, Rashid R. Oleogels: Promising alternatives to solid fats for food applications. Food Hydrocolloids Health. 2022;2:100058.10.1016/j.fhfh.2022.100058Search in Google Scholar
[6] Doan CD, To CM, Vrieze Md, Lynen F, Danthine S, Brown A, et al. Chemical profiling of the major components in natural waxes to elucidate their role in liquid oil structuring. Food Chem. 2017;214:717–25.10.1016/j.foodchem.2016.07.123Search in Google Scholar PubMed
[7] Dassanayake LSK, Kodali DR, Ueno S, Sato K. Crystallization kinetics of organogels prepared by rice bran wax and vegetable oils. J Oleo Sci. 2012;61(1):1–9.10.5650/jos.61.1Search in Google Scholar PubMed
[8] Blake AI, Co ED, Marangoni AG. Structure and physical properties of plant wax crystal networks and their relationship to oil binding capacity. J Am Oil Chem Soc. 2014;91(6):885–903.10.1007/s11746-014-2435-0Search in Google Scholar
[9] Dassanayake LSK, Kodali DR, Ueno S, Sato K. Physical properties of rice bran wax in bulk and organogels. J Am Oil Chemists’ Soc. 2009;86(12):1163.10.1007/s11746-009-1464-6Search in Google Scholar
[10] Blake AI, Marangoni AG. The effect of shear on the microstructure and oil binding capacity of wax crystal networks. Food Biophys. 2015;10(4):403–15.10.1007/s11483-015-9398-zSearch in Google Scholar
[11] Ghazani SM, Dobson S, Marangoni AG. Hardness, plasticity, and oil binding capacity of binary mixtures of natural waxes in oliveoil. Curr Res Food Sci. 2022;5:998–1008.10.1016/j.crfs.2022.06.002Search in Google Scholar PubMed PubMed Central
[12] Toro-Vazquez JF, Morales-Rueda JA, Dibildox-Alvarado E, Charó-Alonso M, Alonzo-Macias M, González-Chávez MM. Thermal and textural properties of organogels developed by candelilla wax in safflower oil. J Am Oil Chem Soc. 2007;84(11):989–1000.10.1007/s11746-007-1139-0Search in Google Scholar
[13] Davidovich-Pinhas M, Barbut S, Marangoni AG. Development, characterization, and utilization of food-grade polymer oleogels. Annu Rev Food Sci Technol. 2016;7:65–91.10.1146/annurev-food-041715-033225Search in Google Scholar PubMed
[14] Gravelle AJ, Barbut S, Quinton M, Marangoni AG. Towards the development of a predictive model of the formulation-dependent mechanical behaviour of edible oil-based ethylcellulose oleogels. J Food Eng. 2014;143:114–22.10.1016/j.jfoodeng.2014.06.036Search in Google Scholar
[15] Davidovich-Pinhas M, Barbut S, Marangoni AG. The gelation of oil using ethyl cellulose. Carbohydr Polym. 2015;117:869–78.10.1016/j.carbpol.2014.10.035Search in Google Scholar PubMed
[16] Lopez-Martínez A, Charó-Alonso MA, Marangoni AG, Toro-Vazquez JF. Monoglyceride organogels developed in vegetable oil with and without ethylcellulose. Food Res Int. 2015;72:37–46.10.1016/j.foodres.2015.03.019Search in Google Scholar
[17] Gravelle AJ, Davidovich-Pinhas M, Barbut S, Marangoni AG. Influencing the crystallization behavior of binary mixtures of stearyl alcohol and stearic acid (SOSA) using ethylcellulose. Food Res Int (Ottawa, Ont). 2017;91:1–10.10.1016/j.foodres.2016.11.024Search in Google Scholar PubMed
[18] Rodríguez-Hernández AK, Pérez-Martínez JD, Gallegos-Infante JA, Toro-Vazquez JF, Ornelas-Paz JJ. Rheological properties of ethyl cellulose-monoglyceride-candelilla wax oleogel vis-a-vis edible shortenings. Carbohydr Polym. 2021;252:117171.10.1016/j.carbpol.2020.117171Search in Google Scholar PubMed
[19] Wang Z, Chandrapala J, Truong T, Farahnaky A. Multicomponent oleogels prepared with high- and low-molecular-weight oleogelators: Ethylcellulose and waxes. Foods (Basel, Switz). 2023;12(16):3093.10.3390/foods12163093Search in Google Scholar PubMed PubMed Central
[20] Völker-Pop L, Agudo JAR, Giehl C. Combined rheology and spectroscopy methods to characterize the cure behavior of epoxy resins. NOVEL TRENDS IN RHEOLOGY IX. AIP Conference Proceedings. AIP Publishing; 2023. p. 030001.10.1063/5.0159798Search in Google Scholar
[21] Sgreva NR, Noel J, Métivier C, Marchal P, Chaynes H, Isaiev M, et al. Thermo-physical characterization of Hexadecane during the solid/liquid phase change. Thermochim Acta. 2022;710:179180.10.1016/j.tca.2022.179180Search in Google Scholar
[22] Rondou K, Romanus M, Verwee E, Penagos IA, Witte Fd, Skirtach AG, et al. Crystallization behavior and structural build-up of palm stearin - wax hybrid fat blends. Food Biophys. 2024;19(4):1042–52.10.1007/s11483-024-09869-zSearch in Google Scholar
[23] Qu K, Ma J, Zhang H, Li X. Characterization of construction and physical properties of composite oleogel based on single low molecular weight wax and polymer ethyl cellulose. LWT. 2024;192:115722.10.1016/j.lwt.2024.115722Search in Google Scholar
[24] Brykczynski H, Wettlaufer T, Flöter E. Revisiting pure component wax esters as basis of wax‐based oleogels. J Am Oil Chem Soc. 2022;99(11):925–41.10.1002/aocs.12589Search in Google Scholar
[25] Scharfe M, Niksch J, Flöter E. Influence of minor oil components on sunflower, rice bran, candelilla, and beeswax oleogels. Eur J Lipid Sci Technol. 2022;124(7):2100068.10.1002/ejlt.202100068Search in Google Scholar
[26] Davidovich-Pinhas M, Barbut S, Marangoni AG. Physical structure and thermal behavior of ethylcellulose. Cellulose. 2014;21(5):3243–55.10.1007/s10570-014-0377-1Search in Google Scholar
[27] Ji L, Gravelle AJ. Modulating the behavior of ethyl cellulose-based oleogels: The impact food-grade amphiphilic small molecules on structural, mechanical, and rheological properties. Food Hydrocoll. 2025;159:110703.10.1016/j.foodhyd.2024.110703Search in Google Scholar
[28] Gómez-Estaca J, Herrero AM, Herranz B, Álvarez MD, Jiménez-Colmenero F, Cofrades S. Characterization of ethyl cellulose and beeswax oleogels and their suitability as fat replacers in healthier lipid pâtés development. Food Hydrocoll. 2019;87:960–9.10.1016/j.foodhyd.2018.09.029Search in Google Scholar
[29] Soleimanian Y, Goli SAH, Shirvani A, Elmizadeh A, Marangoni AG. Wax-based delivery systems: Preparation, characterization, and food applications. Compr Rev Food Sci Food Saf. 2020;19(6):2994–3030.10.1111/1541-4337.12614Search in Google Scholar PubMed
[30] Haj Eisa A, Laufer S, Rosen‐Kligvasser J, Davidovich‐Pinhas M. Stabilization of ethyl‐cellulose oleogel network using lauric acid. Eur J Lipid Sci Technol. 2020;122(2):1900044.10.1002/ejlt.201900044Search in Google Scholar
[31] El Khaled D, Castellano NN, Gázquez JA, Perea-Moreno A-J, Manzano-Agugliaro F. Dielectric spectroscopy in biomaterials: Agrophysics. Materials. 2016;9(5):310.10.3390/ma9050310Search in Google Scholar PubMed PubMed Central
[32] Lizhi H, Toyoda K, Ihara I. Discrimination of olive oil adulterated with vegetable oils using dielectric spectroscopy. J Food Eng. 2010;96(2):167–71.10.1016/j.jfoodeng.2009.06.045Search in Google Scholar
[33] Lizhi H, Toyoda K, Ihara I. Dielectric properties of edible oils and fatty acids as a function of frequency, temperature, moisture and composition. J Food Eng. 2008;88(2):151–8.10.1016/j.jfoodeng.2007.12.035Search in Google Scholar
[34] Ahmad Z. Polymer dielectric materials. In: Alexandru Silaghi M, editor. Dielectric material. London, UK: IntechOpen; 2012. p. 3–26.10.5772/50638Search in Google Scholar
[35] Samet M, Kallel A, Serghei A. Maxwell-Wagner-Sillars interfacial polarization in dielectric spectra of composite materials: Scaling laws and applications. J Compos Mater. 2022;56(20):3197–217.10.1177/00219983221090629Search in Google Scholar
[36] Puente-Córdova JG, Luna-Martínez JF, Mohamed-Noriega N, Miranda-Valdez IY. Electrical conduction mechanisms in ethyl cellulose films under DC and AC electric fields. Polymers. 2024;16(5):628.10.3390/polym16050628Search in Google Scholar PubMed PubMed Central
[37] Rodríguez Agudo JA, Haeberle J, Müller-Pabel M, Troiss A, Shetty A, Kaschta J, et al. Characterization of the temperature and frequency dependency of the complex Poisson’s ratio using a novel combined torsional-axial rheometer. J Rheol. 2023;67(6):1221–50.10.1122/8.0000675Search in Google Scholar
[38] Himawan C, Starov VM, Stapley AGF. Thermodynamic and kinetic aspects of fat crystallization. Adv Colloid Interface Sci. 2006;122(1–3):3–33.10.1016/j.cis.2006.06.016Search in Google Scholar PubMed
[39] Brykczynski H, Schmidt T, Penagos IA, Rondou K, van Bockstaele F, Flöter E. Crystallization of wax esters in oleogels – Relevance of chain length and ester bond position. Food Struct. 2025;44:100429.10.1016/j.foostr.2025.100429Search in Google Scholar
[40] Fechner PM, Wartewig S, Kiesow A, Heilmann A, Kleinebudde P, Neubert RHH. Interaction of water with different cellulose ethers: A Raman spectroscopy and environmental scanning electron microscopy study. J Pharm Pharmacol. 2005;57(6):689–98.10.1211/0022357056109Search in Google Scholar PubMed
[41] Vandenabeele P. Practical Raman spectroscopy: An introduction. 1st edn. Hoboken: John Wiley & Sons Incorporated; 2013. p. 1139.10.1002/9781119961284Search in Google Scholar
[42] Czamara K, Majzner K, Pacia MZ, Kochan K, Kaczor A, Baranska M. Raman spectroscopy of lipids: A review. J Raman Spectrosc. 2015;46(1):4–20.10.1002/jrs.4607Search in Google Scholar
[43] Zheng M, Du W. Phase behavior, conformations, thermodynamic properties, and molecular motion of multicomponent paraffin waxes: A Raman spectroscopy study. Vib Spectrosc. 2006;40(2):219–24.10.1016/j.vibspec.2005.10.001Search in Google Scholar
[44] Meier RJ. Studying the length of trans conformational sequences in polyethylene using Raman spectroscopy: a computational study. Polymer. 2002;43(2):517–22.10.1016/S0032-3861(01)00416-5Search in Google Scholar
[45] Saleem M, Ahmad N, Ullah R, Ali Z, Mahmood S, Ali H. Raman spectroscopy–based characterization of canola oil. Food Anal Methods. 2020;13(6):1292–303.10.1007/s12161-020-01752-0Search in Google Scholar
[46] Bresson S, Rousseau D, Ghosh S, Marssi ME, Faivre V. Raman spectroscopy of the polymorphic forms and liquid state of cocoa butter. Eur J Lipid Sci Technol. 2011;113(8):992–1004.10.1002/ejlt.201100088Search in Google Scholar
[47] Khichar KK, Dangi SB, Dhayal V, Kumar U, Hashmi SZ, Sadhu V, et al. Structural, optical, and surface morphological studies of ethyl cellulose/graphene oxide nanocomposites. Polym Compos. 2020;41(7):2792–802.10.1002/pc.25576Search in Google Scholar
[48] Oppen D, Schmidt F, Braitmaier SH, Hinrichs J, Weiss J. Modelling of dynamic mastication physics of cheese/casein gels as function of milk-fat distribution and intensity of thermo-mechanical treatment. Food Res Int. 2024;192:114694.10.1016/j.foodres.2024.114694Search in Google Scholar PubMed
[49] Müller-Pabel M, Rodríguez Agudo JA, Gude M. Measuring and understanding cure-dependent viscoelastic properties of epoxy resin: A review. Polym Test. 2022;114:107701.10.1016/j.polymertesting.2022.107701Search in Google Scholar
[50] Hossain MT, Macosko CW, McKinley GH, Ewoldt RH. Instrument stiffness artifacts: Avoiding bad data with operational limit lines of Gmax Emax. Rheol Acta. 2025;64(1):67–79.10.1007/s00397-024-01481-9Search in Google Scholar
[51] Steffe JF. Rheological methods in food process engineering. 2nd edn. East Lansing: Freeman Press; 1996. p. 418.Search in Google Scholar
[52] Chen J, Stokes JR. Rheology and tribology: Two distinctive regimes of food texture sensation. Trends Food Sci Technol. 2012;25(1):4–12.10.1016/j.tifs.2011.11.006Search in Google Scholar
© 2025 the author(s), published by De Gruyter
This work is licensed under the Creative Commons Attribution 4.0 International License.
Articles in the same Issue
- Research Articles
- Lie symmetry analysis of bio-nano-slip flow in a conical gap between a rotating disk and cone with Stefan blowing
- Mathematical modelling of MHD hybrid nanofluid flow in a convergent and divergent channel under variable thermal conductivity effect
- Advanced ANN computational procedure for thermal transport prediction in polymer-based ternary radiative Carreau nanofluid with extreme shear rates over bullet surface
- Effects of Ca(OH)2 on mechanical damage and energy evolution characteristics of limestone adsorbed with H2S
- Effect of plasticizer content on the rheological behavior of LTCC casting slurry under large amplitude oscillating shear
- Studying the role of fine materials characteristics on the packing density and rheological properties of blended cement pastes
- Deep learning-based image analysis for confirming segregation in fresh self-consolidating concrete
- MHD Casson nanofluid flow over a three-dimensional exponentially stretching surface with waste discharge concentration: A revised Buongiorno’s model
- Rheological behavior of fire-fighting foams during their application – a new experimental set-up and protocol for foam performance qualification
- Viscoelastic characterization of corn starch paste: (II) The first normal stress difference of a cross-linked waxy corn starch paste
- An innovative rheometric tool to study chemorheology
- Effect of polymer modification on bitumen rheology: A comparative study of bitumens obtained from different sources
- Rheological and irreversibility analysis of ternary nanofluid flow over an inclined radiative MHD cylinder with porous media and couple stress
- Rheological analysis of saliva samples in the context of phonation in ectodermal dysplasia
- Analytical study of the hybrid nanofluid for the porosity flowing through an accelerated plate: Laplace transform for the rheological behavior
- 10.1515/arh-2025-0060
- Brief Report
- Correlations for friction factor of Carreau fluids in a laminar tube flow
- Special Issue on the Rheological Properties of Low-carbon Cementitious Materials for Conventional and 3D Printing Applications
- Rheological and mechanical properties of self-compacting concrete with recycled coarse aggregate from the demolition of large panel system buildings
- Effect of the combined use of polyacrylamide and accelerators on the static yield stress evolution of cement paste and its mechanisms
- Special Issue on The rheological test, modeling and numerical simulation of rock material - Part II
- Revealing the interfacial dynamics of Escherichia coli growth and biofilm formation with integrated micro- and macro-scale approaches
- Construction of a model for predicting sensory attributes of cosmetic creams using instrumental parameters based on machine learning
- Effect of flaw inclination angle and crack arrest holes on mechanical behavior and failure mechanism of pre-cracked granite under uniaxial compression
- Special Issue on The rheology of emerging plant-based food systems
- Rheological properties of pea protein melts used for producing meat analogues
- Understanding the large deformation response of paste-like 3D food printing inks
- Seeing the unseen: Laser speckles as a tool for coagulation tracking
- Composition, structure, and interfacial rheological properties of walnut glutelin
- Microstructure and rheology of heated foams stabilized by faba bean isolate and their comparison to egg white foams
- Rheological analysis of swelling food soils for optimized cleaning in plant-based food production
- Multiscale monitoring of oleogels during thermal transition
- Influence of pea protein on alginate gelation behaviour: Implications for plant-based inks in 3D printing
- Observations from capillary and closed cavity rheometry on the apparent flow behavior of a soy protein isolate dough used in meat analogues
- Special Issue on Hydromechanical coupling and rheological mechanism of geomaterials
- Rheological behavior of geopolymer dope solution activated by alkaline activator at different temperature
- Special Issue on Rheology of Petroleum, Bitumen, and Building Materials
- Rheological investigation and optimization of crumb rubber-modified bitumen production conditions in the plant and laboratory