Revealing the interfacial dynamics of Escherichia coli growth and biofilm formation with integrated micro- and macro-scale approaches
-
Haneum Kim


Abstract
Bacterial biofilms present significant challenges across microbiology, environmental science, water management, and healthcare. This study employs Quartz crystal microbalance with dissipation monitoring (QCM-D) and interfacial rheology system (IRS) for in situ analysis of Escherichia coli biofilm growth and viscoelastic properties. By monitoring biofilm development at both bulk and micro scales in real-time, we identified three distinct growth phases: surface attachment and initial growth, maturation, and dispersion. Optimal biofilm formation occurred in Luria-Bertani medium medium at 5% (v/v) inoculation, as indicated by high complex viscosity and modulus values of 5.38 mPa·s and high complex modulus of 169.13 kPa. IRS data corroborated these findings, showing consistent elastic and viscous behavior patterns, with the storage modulus (G′) reaching 0.057 Pa·m and loss modulus (G″) peaking at 0.016 Pa·m during the maturation phase. Our results highlight the sensitivity of QCM-D in measuring biofilm properties and the effectiveness of using combined micro- and macro-scale methods for comprehensive biofilm characterization.
Graphical abstract

1 Introduction
Bacteria can colonize almost any surface by synthesizing a polymeric matrix, forming what are known as biofilms [1]. This phenomenon presents a significant challenge across various domains, leading to severe issues in environmental, industrial, and biomedical applications. Infections associated with biofilms are frequently encountered on surfaces such as the urinary system, teeth, and lungs. Additionally, numerous industries, including dairy, food, water systems, dentistry, and healthcare, suffer from the adverse effects of biofilm formation [2,3,4,5,6].
Biofilms are biologically active and dynamic communities comprising bacteria enveloped by a matrix of exopolysaccharides (EPS), extracellular polymers, DNA, and proteins [7,8]. This three-dimensional structure occupies the interstitial space between bacterial cells and plays a crucial role in protecting microbes against chemical and mechanical stresses, which are essential for their survival and persistence [9,10]. The bacterial matrix is a heterogeneous and dynamic substance with structures that vary over time and space, exhibiting properties of both solids and fluids [4,11]. The characteristics of biofilms evolve throughout their formation stages and in different environmental conditions due to their heterogeneous structure, which results from varied responses at both bulk- and micro-scales [4,10].
The mechanical properties of biofilms, including elastic strain, viscous creep, modulus, and toughness, are profoundly affected by various environmental, chemical, and hydrodynamic stresses [12,13,14]. Biofilms exhibiting high elastic moduli can endure substantial mechanical stress and resist deformation while remaining within the linear deformation regime [4,15]. These properties are modulated by the complex internal structure of the biofilm, which includes a crosslinked polymer network and interactions among negatively charged DNA, cations, and other matrix constituents [13,16,17,18]. Additionally, microorganisms within biofilms engage in sophisticated signaling mechanisms to coordinate their collective behaviors. This phenomenon, known as quorum sensing, enables bacterial cells to transition from a free-swimming state to a biofilm lifestyle [19,20,21].
The properties of biofilms at liquid–air or liquid–liquid interfaces can be examined to understand their behavior under different environmental conditions [22,23,24]. Such studies are essential for comprehending how biofilms adapt and survive in various settings. In situ measurements of the interfacial rheological response of bacterial biofilms offer valuable data on bacterial growth and biofilm formation dynamics [25,26,27]. These measurements are critical for revealing the mechanical stability and structural integrity of biofilms in situ. This information is crucial for understanding the overall structure and function of the biofilm matrix, as well as its interactions with the surrounding environment [22]. Despite these advancements, there remains a scarcity of studies that have thoroughly characterized the time-dependent behavior of biofilms and compared their properties at both bulk- and micro-scales during the growth and formation process [28,29]. Such comprehensive studies are necessary to elucidate the dynamic nature of biofilm development and to identify key factors that influence their mechanical properties and structural evolution over time.
In this work, we conduct a dual-mode investigation of bacterial biofilm growth and formation at both bulk and micro scales. Biofilm formation and viscoelastic properties were continuously monitored in real-time, allowing for dynamic observation of biofilm development. These two approaches were applied under different environmental conditions to facilitate biofilm growth and identify commonalities in the changes of physical properties over time. We aim to elucidate the dynamics of bacterial biofilm growth, providing insights into how biofilms respond to different environmental stimuli.
2 Materials and methods
2.1 Bacterial strain
Escherichia coli was cultivated in Lysogeny broth (LB, BD Difco), Sabouraud dextrose broth (SD, MB Cell), or Marine broth (Condalab) media to assess biofilm formation. Initially, seed cultures were grown in 4 mL of LB medium at 37°C with continuous shaking at 180 rpm for 15 h. For shake flask cultures, the seed cultures were inoculated at a concentration of 0.2% (v/v) into baffled flasks containing 50 mL of LB medium. These cultures were then incubated overnight at 37°C with continuous shaking at 180 rpm. This protocol ensured the consistent and reproducible formation of E. coli biofilms, allowing for subsequent experimental analysis. In addition, as shown in Figure 1, a flow chart was shown to systematically outline the experimental design and analytical workflow.

A flow chart for characterizing biofilm formation through micro-scale and macro-scale observations.
2.2 Quartz crystal microbalance with dissipation (QCM-D)
The QCM-D monitoring was employed to measure both the resonance frequency and the dissipation of energy resulting from material adhesion on the electrode surface. This technique facilitates real-time monitoring of molecular adsorption and interactions on various surfaces. The QCM-D (openQCM Q-1, Novaetech., Italy) uses AT-cut piezoelectric gold-quartz sensors oscillating at 10 MHz, which are particularly suitable for liquid biosensing applications [30,31]. For these measurements, the liquid sample is held on the sensitive gold surface within an open cell, following the mounting of the gold-quartz oscillator. During the experiments, changes in frequency and dissipation values were meticulously measured and recorded. The measurements of resonance frequency and dissipation were conducted at room temperature over a day.
2.3 Interfacial rheology
The interfacial rheological characteristics of bacterial cluster layers were measured using a rheometer (MCR 302, Anton Paar, Austria) equipped with a biconical disk geometry. After achieving a zero-gap configuration, the tip of the bicone was carefully positioned at the interface between the cultivated medium and oil. This positioning was done while applying the detected normal force to ensure precise determination of the surface. The interfacial storage modulus (
2.4 Morphology observations
The morphology of the E. coli biofilm was characterized using a field emission scanning electron microscope (FE-SEM, JSM-7900F, JEOL, Japan) operated at an accelerating voltage of 2.0 kV. Prior to imaging, the biofilms were rinsed with a phosphate-buffered saline solution to remove any non-adherent material. The samples were then coated with a thin layer of platinum using a sputter coater (108 Auto Sputter Coater, Cressington Scientific Instruments, USA) to enhance conductivity and imaging quality. For additional topographical and deflection analysis, the biofilms at the end of the formation process were examined using an atomic force microscope (AFM, NX20, Park Systems, Korea). The tapping mode was employed for these measurements as it is particularly effective in improving lateral resolution for soft materials such as bacterial film surfaces [32]. This dual approach, utilizing both FE-SEM and AFM, provided a comprehensive analysis of the biofilm morphology, allowing for detailed visualization of surface structures and the assessment of mechanical properties at the micro- and nanoscale levels.
3 Results and discussion
3.1 Micro-scale observations of biofilm formation
The formation of biofilms can be defined in five stages, as schematically illustrated in Figure 2a. It starts with (i) the attachment of planktonic bacteria to the surface and (ii) the production of extracellular polymeric substances (EPS) that result in irreversible cell attachment. During this period, the cells were surrounded by a slime-like substance made of extracellular polymers and exhibited colloidal-like behavior [33]. After that, (iii) bacterial structures were established and grew through quorum sensing, (iv) matured and solidified into a layer, and (v) dispersed their cells into the environment [25,34,35]. Cell interactions and inter-structural forces hydrodynamically changed the mechanical properties at each step [10]. Thus, in order to effectively control biofilms and eradicate the negative effects they can cause, it is crucial to have a thorough understanding of the mechanism by which they form and the mechanical properties, especially the viscoelastic behavior, of their matrix [14,19,36]. And the nomenclature of abbreviations used in this study is provided in Table 1.
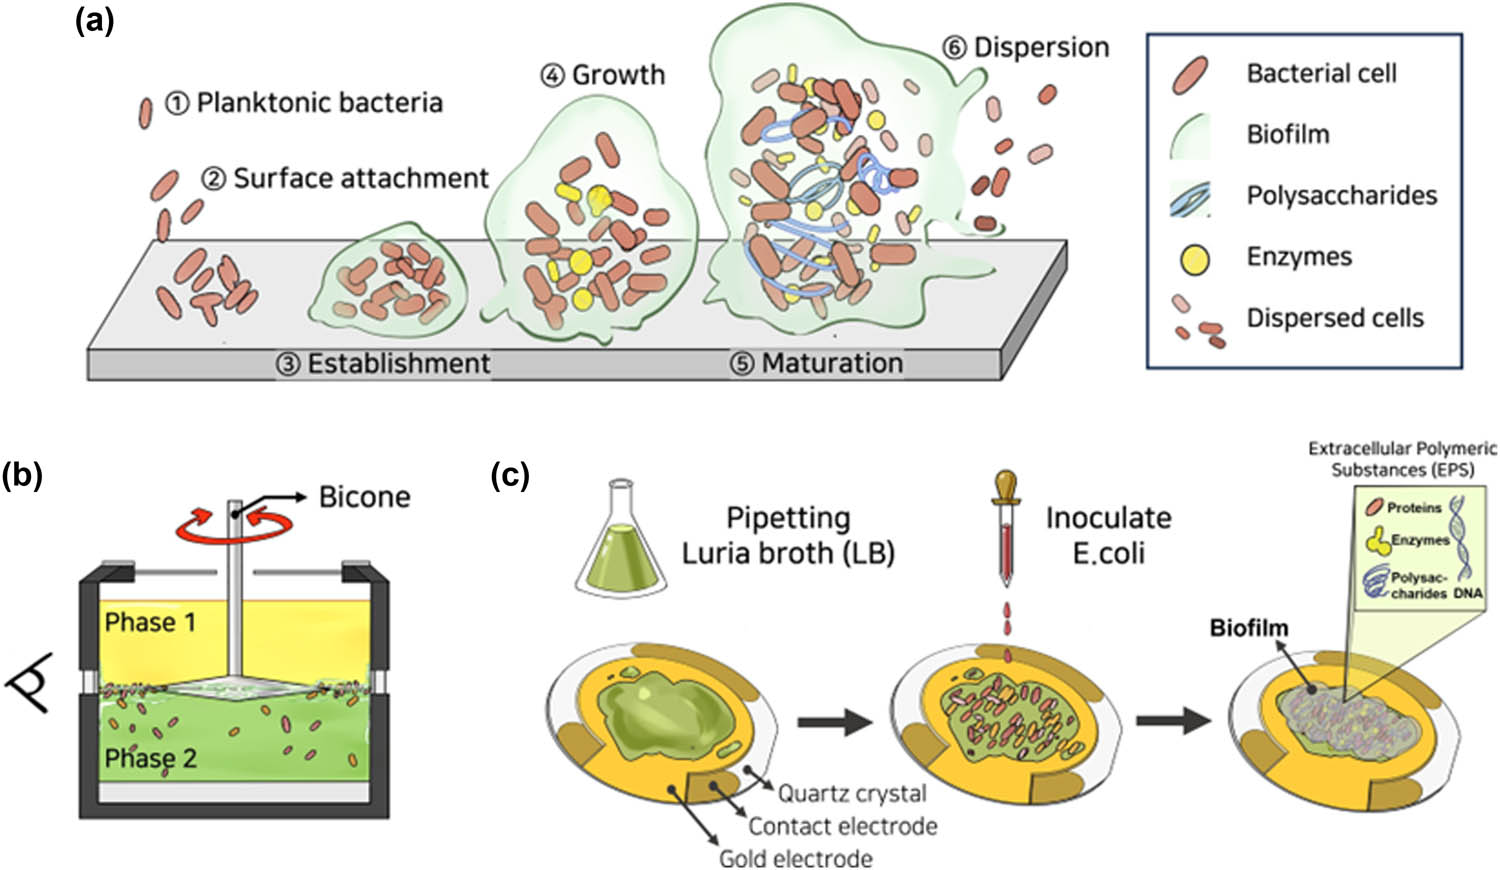
(a) Stages of bacterial biofilm development: attachment and interaction of planktonic bacteria (steps 1–3), growth and maturation with EPS production (steps 4 and 5), and dispersion at critical mass (step 6). (b) IRS measurements using bicone geometry. E. coli biofilms form at the interface between mineral oil (upper phase) and bacteria-laden medium (lower phase). (c) Experimental stages for monitoring biofilm formation on the QCM electrode during sensing measurements.
Nomenclature of abbreviations used in this study
| Abbreviation | Full name |
|---|---|
| E. coli | Escherichia coli |
| EPS | Extracellular polymeric substances |
| QCM-D | Quartz crystal microbalance with dissipation |
| IRS | Interfacial rheology system |
| LB | Luria-Bertani medium |
| SD | Sabouraud dextrose medium |
| ∆f | Delta frequency |
| ∆D | Delta dissipation |
|
|
Interfacial storage modulus |
|
|
Interfacial loss modulus |
| mPa s | Millipascal-seconds (unit of viscosity) |
| kPa | Kilopascal (unit of modulus) |
QCM-D is a highly sensitive analytical technique used to investigate the formation and properties of biofilms. The primary roles of QCM-D in biofilm research include real-time monitoring, quantification of adsorption, assessment of mechanical properties, analysis of interactions, and environmental response. This information is crucial for developing strategies to control biofilm formation and mitigate its impact in various applications, including medical devices, water treatment systems, and industrial processes. E. coli biofilm was grown on the surface of the sensor electrode, creating an organized biofilm structure at a temperature of 25°C. Figure 3 and Table 2 represent the QCM-D signal shifts that indicate E. coli growth at various concentrations in LB broth. The biofilm growth stages are characterized by three distinct phases: surface attachment and initial growth (green color, phase I), maturation (orange color, phase II), and dispersion (purple color, phase III). In phase I, a gradual decrease in frequency (∆f) and an increase in dissipation (∆D) were observed, attributed to bacterial adhesion and initial growth on the quartz plate. This behavior reflects the formation of a soft layer composed of bacteria and EPS. Phase II shows stabilization of both frequency and dissipation signals, indicating that the bacterial film has reached maturity. During this stage, the structure of the biofilm solidifies, and the viscoelastic properties stabilize.

QCM-D signal dynamics of E. coli biofilm growth on a gold substrate at room temperature for 28 ± h in LB medium. Bacterial volume concentrations: (a) 2%, (b) 5%, and (c) 10% (v/v), with corresponding DF plot graphs: (d) 2%, (e) 5%, and (f) 10% (v/v). Colors represent each phase of bacterial film formation: green (phase I), orange (phase II), and purple (phase III).
Resonance frequency and dissipation shifts obtained from QCM-D measurements under different volume concentrations at each biofilm formation stage
| Frequency shift (Hz) | Dissipation shift (µm) | |||||
|---|---|---|---|---|---|---|
| f 2%(v/v) | f 5%(v/v) | f 10%(v/v) | D 2%(v/v) | D 5%(v/v) | D 10%(v/v) | |
| Ⅰ | −300 ± 50 | −700 ± 50 | −400 ± 50 | 10 ± 10 | 40 ± 10 | 40 ± 10 |
| Ⅱ | −100 ± 20 | 100 ± 20 | −200 ± 20 | −10 ± 5 | −20 ± 5 | 20 ± 5 |
| Ⅲ | −30 ± 10 | −100 ± 20 | −40 ± 20 | −5 ± 3 | 10 ± 3 | 5 ± 3 |
In phase III, the biofilm reaches a critical mass and begins to disperse. The structure of the film collapses, resulting in a decrease in stiffness and mass, which is evidenced by an increase in dissipation shifts.
For the QCM-D measurements of 2, 5, and 10% (v/v) inoculated samples (Figure 3a–c), the ∆f and ∆D exhibited similar patterns. In phase I, following the initial microbe attachment period, ∆f exponentially decreased while ∆D correspondingly increased over approximately 8 ± 2 h. The duration of these attachments varied with concentration. During the subsequent establishment and maturation period (II), relatively gradual changes were observed in ∆f and ∆D. At this stage, the cells rigidly adhered to the sensor surface, indicating that they had reached a stable state. Therefore, when the bacterial film is well-formed, there are minimal mass changes and decreased energy dissipation. Figure 3a shows that for the 2% (v/v) data, the change in ∆f and ∆D ranged from −100 ± 20 Hz and −10 ± 5 µm over approximately 13 h. In Figure 3b, the 5% (v/v) data exhibited a range in ∆f and ∆D of 100 ± 20 Hz and −20 ± 5 µm over approximately 17 h. Figure 3c indicates that for the 10% (v/v) data, the change in ∆f and ∆D ranged from −200 ± 20 Hz and 20 ± 5 µm over approximately 20 h. These results suggest that the biofilm, particularly at a concentration of 5% (v/v), has reached a state of well-defined maturity, with the viscoelastic properties of the adhering film layer remaining largely unchanged. During the final dispersion period (III), the mass of the biofilm reached a critical point and began to collapse in structure. This behavior, along with the decrease in layer rigidity, is typically characterized by an increase in dissipated energy. Figure 3a shows that for the 2% (v/v) data, the change in ∆D was −5 µm over approximately 3 h. In Figure 3b, the 5% (v/v) data exhibited a ∆D range of 10 µm over approximately 3 h. Figure 3c indicates that for the 10% (v/v) data, the change in ∆D was 5 µm over approximately 3 h. These observations suggest that the E. coli biofilm formed at 5% (v/v) exhibits more robust properties for measuring mechanical strength and viscoelasticity changes during film formation than the other concentrations.
Frequency shift versus dissipation shift (D–F) plots, or QCM-D signatures, are used for qualitative analysis of cellular processes, revealing the effects of substrates and biomolecules on cell adhesion [37]. D–F plots analyze adsorbate conformation by examining the ∆f and ∆D relationship, showing energy loss per unit mass without time components [38,39,40]. The dissipation-to-frequency shift ratio, ∆D/(−∆f), from QCM-D measurements, determines biofilm characteristics on sensor surfaces [41]. Slope amplitude indicates layer rigidity, with positive values suggesting loosely packed layers. More viscous materials show higher dissipation per unit mass, indicating softer films. A straight D–F plot line suggests a homogeneous layer, while a curved line indicates changing conformation with increased coverage [42,43]. As adsorption progresses, ∆D versus ∆f graphs reveal changes in the viscoelastic properties of the attached layer, forming multiple linear segments (Figure 3d–f). Initially (phase I), bacterial cells form a dense layer on the quartz plate with minimal ∆D fluctuations and decreasing ∆f, indicating increased cell adhesion stability and a more compact matrix. During phase II, the closely clustered ∆D/(−∆f) values reflect smaller changes in ∆f and ∆D signals than in phase I, suggesting less pronounced mass and viscoelastic changes. Comparing D–F plot slopes helps assess the mechanical characteristics of the layers. The 5% (v/v) biofilm (Figure 3e) shows strong mechanical properties with a small, linear slope, whereas the 10% (v/v) sample (Figure 3f) displays a steeper slope, indicating a more viscous biofilm.
The QCM-D signal shifts for E. coli film growth, inoculated at 5% (v/v) in LB, SD, and Marine broths, are shown in Figure 4 and Table 3. The ∆f and ∆D behaviors are similar across different conditions. Biofilm formation occurs in three phases, which are adhesion and development (I), maturation and stabilization (II), and final dispersion (III). During phase I, mass increases were observed, indicated by changes in ∆f for SD (−800 ± 50 Hz), LB (−700 ± 50 Hz), and Marine (−300 ± 50 Hz). Corresponding changes in ∆D were SD (200 ± 10 µm), LB (40 ± 10 µm), and Marine (30 ± 10 µm). Significant variations in SD are attributed to the unique properties of the SD medium, supported by the dissipation shift graph (Figure 4b) and FE-SEM images (Figure 6B(b) and B(e)). During phase II, the LB sample exhibited ∆f and ∆D changes of 100 ± 20 Hz and −20 ± 5 µm, respectively. The SD sample showed no significant ∆D changes, while a slight increase was observed in the Marine broth sample. These findings suggest that the decrease in ∆f is due to the SD medium’s properties or increased salt content in the Marine broth, rather than pure biofilm characteristics. In phase III, the Marine broth and LB samples showed similar behavior, but changes in the Marine broth sample are influenced by medium properties, not just biofilm dispersion. The experiments concluded that biofilm formation was most effective in LB medium at 5% (v/v) inoculation, providing optimal conditions for biofilm development and stability.

QCM-D signal dynamics of E. coli biofilm growth inoculated with 5% (v/v) on a gold substrate at room temperature for 28 ± 2 h. Samples grown under different environmental conditions: (a) LB, (b) SD, and (c) Marine broth, with corresponding D–F plot graphs: (d) LB, (e) SD, and (f) Marine broth. Colors represent stages of bacterial film formation: green (phase I), orange (phase II), and purple (phase III).
Resonance frequency and dissipation shifts obtained from QCM-D measurement under different environmental conditions at each biofilm formation stage
| Frequency shift (Hz) | Dissipation shift (µm) | |||||
|---|---|---|---|---|---|---|
| f LB | f SD | f marine | D LB | D SD | D marine | |
| Ⅰ | −700 ± 50 | −800 ± 50 | −400 ± 50 | 40 ± 10 | 200 ± 10 | 30 ± 10 |
| Ⅱ | 100 ± 20 | −100 ± 50 | −100 ± 50 | −20 ± 5 | 20 ± 5 | 10 ± 3 |
| Ⅲ | −100 ± 20 | 20 ± 5 | −100 ± 50 | 10 ± 3 | 5 ± 2 | 10 ± 3 |
3.2 Viscoelastic characterizations of biofilm formation
The Sauerbrey equation is a fundamental principle in QCM experiments, relating the frequency change of the quartz crystal to the mass change on its surface. The equation is given by [38]
where n is the odd number of the harmonic (n = 3), C is the mass sensitivity constant, which is governed by the quartz material, and ∆m is the mass change at the crystal surface [38,44]. The analysis of viscoelastic films in contact with a liquid involves a model based on continuum mechanics, as described by [45,46,47]
where ω denotes the angular frequency, ρ
q and ρ
l represent the densities of quartz and liquid, respectively, µ
q is the shear modulus, and f
n
is the frequency at the overtone n. The values of ∆f
n
correspond to the measured frequency shift, whereas ∆Γ
n
(=∆D
n
f
n
/2) denote the change in the half bandwidth of the frequency spectrum at overtone n. Additionally, f
0 represents the fundamental resonant frequency [47]. Given the viscoelastic properties of the biofilms observed across all measured frequencies using QCM-D, we calculated the storage modulus (G′), loss modulus (G″), and complex modulus
The calculated values of the storage and loss moduli (Figure 5a and b) demonstrate changes in the mechanical properties during time-dependent formation phenomena. Fluid-like characteristics predominated during the dispersion phase, as indicated by higher energy dissipation. In contrast, solid-like properties became prominent during the attachment and maturation phases, as reflected in the increased storage modulus (G′). These findings exhibit slight variations in interfacial rheology measurements, likely due to differences in the growth environment configuration. Biofilm development on the QCM sensor surface involves interactions at the solid–liquid interface. In bulk rheology measurements, a bacterial film forms at the interfaces between the liquid phase of the growth medium and the mineral oil phase. The QCM, with significantly lower inertia compared to a bulk rheometer, is more sensitive to fluid characteristics, particularly when fluid viscosities are very low [47]. Similar to QCM-D results, the 5% (v/v) sample in the concentration comparison experiment and the sample grown in SD in the environment comparison experiment exhibit the most prominent viscoelastic characteristics and polymer structure production at the solid interface. Figure 5c shows that fully formed biofilms on a solid surface exhibit the highest complex viscosity and modulus when inoculated at 5% (v/v) in LB broth and in SD broth.

3.3 Macro-scale observations of biofilm formation
The interfacial rheology system (IRS) was used to study bacterial film development at the liquid–liquid interface. Biofilm formation involves complex structural changes over various phases, driven by increased bacterial film density and cell interactions [48]. For instance, layer adsorption increases both elastic and viscous moduli. To analyze viscoelastic properties during biofilm development, measurements of interfacial storage modulus (
The dynamics of E. coli biofilm formation were divided into three stages, analogous to QCM-D data (Figure 6a–d). During the initial attachment and growth stage (I), the interface is highly viscous, dominated by the interfacial loss modulus (

(a) In situ IRS measurements of E. coli biofilm formation at bacterial volume concentrations of 2, 5, and 10% (v/v) in LB medium. Interfacial storage modulus (
Biofilms were grown in LB medium at 2, 5, and 10% (v/v) for approximately 100 h, as shown in Figure 6a. During stage I, initial interfacial moduli were similar. The order of crossover points and subsequent increases in moduli was 2, 10, and 5% (v/v). Figure 6e shows that increased elasticity correlates with biofilm development. The highest
To investigate film strength, tan δ, the elasticity loss factor, is presented in Figure 5c and d. Tan δ is defined as the ratio of the loss modulus to the storage modulus (G″/G′) [52], used to describe damping properties of polymeric materials [53,54]. Despite the continuous upward trend in Marine broth, the LB medium at 5% (v/v) exhibited the most elastic characteristics, while the SD medium showed the highest viscosity, indicating a soft layer with minimal bacterial interactions.
3.4 Morphological observations of biofilm formation
E. coli biofilms were examined using FE-SEM and AFM to compare the morphological structures of various biofilms in different environments. Figure 7A and B show significant differences in biofilm structures at 17 and 48 h. Figure 7A displays growth in LB medium at 2, 5, and 10% (v/v) (a, b, c), as well as shows growth in SD broth and Marine broth at 5% (v/v) (d, e), respectively. At 17 h, bacterial growth and colonization began, with distinct cell shapes still visible (Figure 7A). Smooth microorganisms and EPS matrix were observed. Salt components were noted in the Marine broth sample due to the fact that seawater was used as a medium (Figure 7A(e)). Cell distribution differences were attributed to inoculation concentration. After 48 h, EPS production and matrix formation increased. EPS communities formed around colonies, and cell borders decreased. In the LB 5% (v/v) sample (Figure 7B(b)), E. coli cells were embedded in thick EPS structures, displaying smooth and rough morphologies. In the 5% (v/v) Marine broth sample, EPS and salt components filled spaces between cells (Figure 7B(e)). Comparing inoculation concentrations in LB (Figure 7B), the 5% (v/v) sample (b) showed the best film structure, followed by 10% (c) and 2% (v/v) (a). Under different environmental conditions (Figure 7B), the 5% (v/v) sample in LB (b) exhibited the most distinct morphology. Samples in SD broth (d) showed the lowest biomass, indicating SD broth’s unsuitability for E. coli growth. Marine broth samples (e) demonstrated lower biofilm formation than LB, with salt covering bacterial cells.

(A) FE-SEM images of E. coli biofilms grown for 17 h. (a–c) depict biofilms grown in LB medium with inoculation concentrations of 2, 5, and 10% (v/v), respectively. (d and e) Represent biofilms grown in SD and Marine broth, respectively, both at a 5% (v/v) inoculation concentration. (B) FE-SEM images of E. coli biofilms grown for 48 h, corresponding to (A), illustrating their progression after 30 h. (C) AFM images of E. coli biofilms grown under various conditions: (a) 2% (v/v) in LB, (b) 5% (v/v) in LB, (c) 10% (v/v) in LB, (d) 5% (v/v) in SD, and (e) 5% (v/v) in Marine broth. The growth period was 48 h, and Si wafers were used as substrate.
The motivation and added value of this study lie in the detailed and multifaceted analysis of biofilm formation under various conditions. Figure 7C shows AFM images, which measure topography and deflection simultaneously [55]. Using AFM, we obtained high-resolution images that characterize biofilm shape, interactions, and adhesion [56], providing spatial resolution to image individual cells and the EPS matrix [57]. In this study, AFM revealed the complete bacterial film structures after 48 h growth on a Si wafer, matching QCM-D conditions. AFM images, as shown in Figure 7C, provided spatial insights into biofilms formed under varying inoculation concentrations and growth media [25]. Among the tested conditions, the LB medium with 5% (v/v) inoculation (Figure 7C(c)) exhibited the most ordered cluster structure, characterized by a uniform distribution and height of bacterial cells, indicating optimal biofilm formation. In contrast, samples cultured in SD and Marine broths (Figure 7C(d and e)) displayed bright regions, suggesting the presence of salt or by-products rather than structured biofilms or EPS. These results align with QCM-D and IRS measurements, confirming that E. coli biofilms in LB medium at 5% (v/v) inoculation exhibit the most stable and well-structured morphology.
Figure 7C shows AFM images of various concentrations in LB: (a) 2%, (b) 5%, and (c) 10% (v/v). Samples (d) and (e) were inoculated with 5% (v/v) and cultured in SD and Marine broths. The most orderly cluster structure was seen in Figure 7C(b), with uniform bacterial cell distribution and height. Samples grown in LB showed rod-shaped E. coli morphology, with varying distribution. Bright regions in samples cultured in Marine and SD broths (Figure 7C(d and e)) suggested production of materials like salt, rather than bacterial film or EPS. These results align with QCM-D and IRS measurements, showing the E. coli 5% (v/v) sample in LB is optimal for well-structured biofilm formation.
4 Conclusion
This study employed QCM-D and IRS to investigate the time-dependent formation and rheological properties of E. coli biofilms under various growth conditions. Three distinct growth phases (surface attachment and initial growth, maturation, and dispersion) were identified at both micro- and macro-scales. Optimal biofilm formation occurred in LB medium with a 5% (v/v) inoculation, as indicated by higher complex viscosity and modulus values, uniform bacterial morphology, and structured cluster formation. QCM-D demonstrated high sensitivity in capturing viscoelastic characteristics, while IRS provided insights into elastic and viscous behaviors, confirming the mechanical properties of the biofilm. Moreover, the combination of QCM-D, IRS, FE-SEM, and AFM presents a robust framework for characterizing biofilm dynamics at both structural and mechanical levels. Since this study is limited to E. coli biofilms, future research should expand to include other species and explore interactions with antimicrobial agents to develop effective strategies for biofilm control and eradication. Despite these limitations, this study contributes to the deeper insights of combining QCM-D and IRS for comprehensive biofilm analysis, paving the way for improved biofilm management strategies across various fields.
-
Funding information: This work was partly supported by the National Research Foundation of Korea (NRF) grant funded by Global-Learning & Academic research institution for Master’s, PhD students, and Postdoc (LAMP) Program of National Research Foundation of Korea (NRF) grant funded by Ministry of Education (RS-2024-00442775) and the Korean government (MSIT) (RS-2024-00402807).
-
Author contributions: H.K. – conceptualization, data curation, formal analysis, investigation, methodology, software, validation, visualization, writing – original draft; D.L. – conceptualization, formal analysis, funding acquisition, methodology, project administration, resources, supervision, writing – review & editing; E.J. – data curation, formal analysis, investigation, methodology, resources; J.P. & K.L. – data curation, formal analysis, methodology, resources.
-
Conflict of interest: The authors state no conflict of interest.
-
Ethical approval: The conducted research is not related to either human or animal use.
-
Data availability statement: The datasets generated during and/or analyzed during the current study are available from the corresponding author on reasonable request.
References
[1] Lopez D, Vlamakis H, Kolter R. Biofilms cold spring harbor perspectives in biology. Biofilms Cold Spring Harb Perspect Biol. 2010. 10.1101/cshperspect.a000398.Search in Google Scholar PubMed PubMed Central
[2] Garrett TR, Bhakoo M, Zhang Z. Bacterial adhesion and biofilms on surfaces. Prog Nat Sci. 2008;18(9):1049–56.10.1016/j.pnsc.2008.04.001Search in Google Scholar
[3] Costerton JW, Stewart PS, Greenberg EP. Bacterial biofilms: a common cause of persistent infections. Science. 1999;284(5418):1318–22.10.1126/science.284.5418.1318Search in Google Scholar PubMed
[4] Wells M, Schneider R, Bhattarai B, Currie H, Chavez B, Christopher G, et al. Perspective: The viscoelastic properties of biofilm infections and mechanical interactions with phagocytic immune cells. Front Cell Infect Microbiol. 2023;13:1102199.10.3389/fcimb.2023.1102199Search in Google Scholar PubMed PubMed Central
[5] Yoo JA, Chen XD. An emission pattern of a thermophilic bacteria attached to or imbedded in porous supports. Int J Food Microbiol. 2002;73(1):11–21.10.1016/S0168-1605(01)00697-3Search in Google Scholar PubMed
[6] Qian PY, Cheng A, Wang R, Zhang R. Marine biofilms: diversity, interactions and biofouling. Nat Rev Microbiol. 2022;20(11):671–84.10.1038/s41579-022-00744-7Search in Google Scholar PubMed
[7] Flemming HC, Neu TR, Wozniak DJ. The EPS matrix: the “house of biofilm cells”. J Bacteriol. 2007;189(22):7945–7.10.1128/JB.00858-07Search in Google Scholar PubMed PubMed Central
[8] Pandit S, Fazilati M, Gaska K, Derouiche A, Nypelö T, Mijakovic I, et al. The exo-polysaccharide component of extracellular matrix is essential for the viscoelastic properties of Bacillus subtilis biofilms. Int J Mol Sci. 2020;21(18):6755.10.3390/ijms21186755Search in Google Scholar PubMed PubMed Central
[9] Stewart PS, Costerton JW. Antibiotic resistance of bacteria in biofilms. Lancet. 2001;358(9276):135–8.10.1016/S0140-6736(01)05321-1Search in Google Scholar
[10] Peterson BW, van der Mei HC, Sjollema J, Busscher HJ, Sharma PK. A distinguishable role of eDNA in the viscoelastic relaxation of biofilms. MBio. 2013;4(5):10-1128.10.1128/mBio.00497-13Search in Google Scholar PubMed PubMed Central
[11] Klapper I, Rupp CJ, Cargo R, Purvedorj B, Stoodley P. Viscoelastic fluid description of bacterial biofilm material properties. Biotechnol Bioeng. 2002;80(3):289–96.10.1002/bit.10376Search in Google Scholar PubMed
[12] Li Z, Saravanakumar K, Yao L, Kim Y, Choi SY, Yoo G, et al. Acer tegmentosum extract-mediated silver nanoparticles loaded chitosan/alginic acid scaffolds enhance healing of E. coli-infected wounds. Int J Biol Macromol. 2024;267:131389.10.1016/j.ijbiomac.2024.131389Search in Google Scholar PubMed
[13] Kovach KN, Fleming D, Wells MJ, Rumbaugh KP, Gordon VD. Specific disruption of established Pseudomonas aeruginosa biofilms using polymer-attacking enzymes. Langmuir. 2020;36(6):1585–95.10.1021/acs.langmuir.9b02188Search in Google Scholar PubMed PubMed Central
[14] Boudarel H, Mathias JD, Blaysat B, Gr´ediac M. Towards standardized mechanical characterization of microbial biofilms: analysis and critical review. npj Biofilms Microbiomes. 2018;4(1):17.10.1038/s41522-018-0062-5Search in Google Scholar PubMed PubMed Central
[15] Davey ME, O’toole GA. Microbial biofilms: from ecology to molecular genetics. Microbiol Mol Biol Rev. 2000;64(4):847–67.10.1128/MMBR.64.4.847-867.2000Search in Google Scholar PubMed PubMed Central
[16] Das T, Sehar S, Koop L, Wong YK, Ahmed S, Siddiqui KS, et al. Influence of calcium in extracellular DNA mediated bacterial aggregation and biofilm formation. PLoS One. 2014;9(3):e91935.10.1371/journal.pone.0091935Search in Google Scholar PubMed PubMed Central
[17] Shokeen B, Pham E, Esfandi J, Kondo T, Okawa H, Nishimura I, et al. Effect of calcium ion supplementation on oral microbial composition and biofilm formation in vitro. Microorganisms. 2022;10(9):1780.10.3390/microorganisms10091780Search in Google Scholar PubMed PubMed Central
[18] Jacobs HM, O’Neal L, Lopatto E, Wozniak DJ, Bjarnsholt T, Parsek MR. Mucoid Pseudomonas aeruginosa can produce calcium-gelled biofilms independent of the matrix components Psl and CdrA. J Bacteriol. 2022;204(5):e00568–21.10.1128/jb.00568-21Search in Google Scholar PubMed PubMed Central
[19] Prentice JA, van de Weerd R, Bridges AA. Cell-lysis sensing drives biofilm formation in Vibrio cholerae. Nat Commun. 2024;15(1):2018.10.1038/s41467-024-46399-1Search in Google Scholar PubMed PubMed Central
[20] Bridges AA, Prentice JA, Wingreen NS, Bassler BL. Signal transduction network principles underlying bacterial collective behaviors. Annu Rev Microbiol. 2022;76(1):235–57.10.1146/annurev-micro-042922-122020Search in Google Scholar PubMed PubMed Central
[21] Idrees M, Sawant S, Karodia N, Rahman A. Staphylococcus aureus biofilm: Morphology, genetics, pathogenesis and treatment strategies. Int J Environ Res Public Health. 2021;18(14):7602.10.3390/ijerph18147602Search in Google Scholar PubMed PubMed Central
[22] Rivas DP, Hedgecock ND, Stebe KJ, Leheny RL. Dynamic and mechanical evolution of an oil–water interface during bacterial biofilm formation. Soft Matter. 2021;17(35):8195–210.10.1039/D1SM00795ESearch in Google Scholar
[23] Trejo M, Douarche C, Bailleux V, Poulard C, Mariot S, Regeard C, et al. Elasticity and wrinkled morphology of Bacillus subtilis pellicles. Proc Natl Acad Sci. 2013;110(6):2011–6.10.1073/pnas.1217178110Search in Google Scholar PubMed PubMed Central
[24] Koza A, Hallett PD, Moon CD, Spiers AJ. Characterization of a novel air–liquid interface biofilm of Pseudomonas fluorescens SBW25. Microbiology. 2009;155(5):1397–406.10.1099/mic.0.025064-0Search in Google Scholar PubMed
[25] Ripa R, Shen AQ, Funari R. Detecting Escherichia coli biofilm development stages on gold and titanium by quartz crystal microbalance. ACS Omega. 2020;5(5):2295–302.10.1021/acsomega.9b03540Search in Google Scholar PubMed PubMed Central
[26] Rühs PA, Böni L, Fuller GG, Inglis RF, Fischer P. In-situ quantification of the interfacial rheological response of bacterial biofilms to environmental stimuli. PLoS One. 2013;8(11):e78524.10.1371/journal.pone.0078524Search in Google Scholar PubMed PubMed Central
[27] Chew SC, Rice SA, Kjelleberg S, Yang L. In situ mapping of the mechanical properties of biofilms by particle-tracking microrheology. J Visualized Exp: JoVE. 2015;106:53093.10.3791/53093-vSearch in Google Scholar
[28] Gordon VD, Davis-Fields M, Kovach K, Rodesney CA. Biofilms and mechanics: a review of experimental techniques and findings. J Phys D: Appl Phys. 2017;50(22):223002.10.1088/1361-6463/aa6b83Search in Google Scholar
[29] Lin YJ, Barman S, He P, Zhang Z, Christopher GF, Biswal SL. Combined interfacial shear rheology and microstructure visualization of asphaltenes at air-water and oil-water interfaces. J Rheology. 2018;62(1):1–10.10.1122/1.5009188Search in Google Scholar
[30] Bhalla N, Lee D, Sathish S, Shen AQ. Dual-mode refractive index and charge sensing to investigate complex surface chemistry on nanostructures. Nanoscale. 2017;9(2):547–54.10.1039/C6NR07664ESearch in Google Scholar PubMed
[31] Payam AF, Kim B, Lee D, Bhalla N. Unraveling the liquid gliding on vibrating solid liquid interfaces with dynamic nanoslip enactment. Nat Commun. 2022;13(1):6608.10.1038/s41467-022-34319-0Search in Google Scholar PubMed PubMed Central
[32] Yang H, Wang Y, Lai S, An H, Li Y, Chen F. Application of atomic force microscopy as a nanotechnology tool in food science. J Food Sci. 2007;72(4):R65–75.10.1111/j.1750-3841.2007.00346.xSearch in Google Scholar PubMed
[33] Nguyen H, Ybarra A, Başağaoğlu H, Shindell O. Biofilm viscoelasticity and nutrient source location control biofilm growth rate, migration rate, and morphology in shear flow. Sci Rep. 2021;11(1):16118.10.1038/s41598-021-95542-1Search in Google Scholar PubMed PubMed Central
[34] Sharma S, Mohler J, Mahajan SD, Schwartz SA, Bruggemann L, Aalinkeel R. Microbial biofilm: a review on formation, infection, antibiotic resistance, control measures, and innovative treatment. Microorganisms. 2023;11(6):1614.10.3390/microorganisms11061614Search in Google Scholar PubMed PubMed Central
[35] Speziale P, Geoghegan JA. Biofilm formation by staphylococci and streptococci: structural, functional, and regulatory aspects and implications for pathogenesis. Front Cell Infect Microbiology. 2015;5(31). 10.3389/fcimb.2015.00031.Search in Google Scholar PubMed PubMed Central
[36] Highmore CJ, Melaugh G, Morris RJ, Parker J, Direito SOL, Romero M, et al. Translational challenges and opportunities in biofilm science: a BRIEF for the future. npj Biofilms Microbiomes. 2022;8(1):68.10.1038/s41522-022-00327-7Search in Google Scholar PubMed PubMed Central
[37] Fredriksson C, Khilman S, Kasemo B, Steel D. In vitro real-time characterization of cell attachment and spreading. J Mater Sci: Mater Med. 1998;9:785–8.10.1023/A:1008927624337Search in Google Scholar
[38] Dixon MC. Quartz crystal microbalance with dissipation monitoring: enabling real-time characterization of biological materials and their interactions. J Biomol Tech: JBT. 2008;19(3):151.Search in Google Scholar
[39] Rodahl M, Kasemo B. On the measurement of thin liquid overlayers with the quartz-crystal microbalance. Sens Actuators A: Phys. 1996;54(1–3):448–56.10.1016/S0924-4247(97)80002-7Search in Google Scholar
[40] Fang J, Ren C, Zhu T, Wang K, Jiang Z, Ma Y. Comparison of the different responses of surface plasmon resonance and quartz crystal microbalance techniques at solid–liquid interfaces under various experimental conditions. Analyst. 2015;140(4):1323–36.10.1039/C4AN01756KSearch in Google Scholar PubMed
[41] Funari R, Ripa R, Söderström B, Skoglund U, Shen AQ. Detecting gold biomineralization by delftia acidovorans biofilms on a quartz crystal microbalance. ACS Sens. 2019;4(11):3023–33.10.1021/acssensors.9b01580Search in Google Scholar PubMed
[42] Voinova MV, Rodahl M, Jonson M, Kasemo B. Viscoelastic acoustic response of layered polymer films at fluid-solid interfaces: continuum mechanics approach. Phys Scr. 1999;59(5):391.10.1238/Physica.Regular.059a00391Search in Google Scholar
[43] Singh K, Blanford CF. Electrochemical quartz crystal microbalance with dissipation monitoring: a technique to optimize enzyme use in bioelectrocatalysis. Chemcatchem. 2014;6(4):921–9.10.1002/cctc.201300900Search in Google Scholar
[44] Sauerbrey G. Verwendung von Schwingquarzen zur Wägung dünner Schichten und zur Mikrowägung. Z für Phys. 1959;155:206–22.10.1007/BF01337937Search in Google Scholar
[45] Pax M, Rieger J, Eibl RH, Thielemann C, Johannsmann D. Measurements of fast fluctuations of viscoelastic properties with the quartz crystal microbalance. Analyst. 2005;130(11):1474–7.10.1039/b504302fSearch in Google Scholar PubMed
[46] Wolff O, Seydel E, Johannsmann D. Viscoelastic properties of thin films studied with quartz crystal resonators. Faraday Discuss. 1997;107:91–104.10.1039/a703017gSearch in Google Scholar
[47] Hodges CS, Harbottle D, Biggs S. Investigating adsorbing viscoelastic fluids using the quartz crystal microbalance. ACS Omega. 2020;5(35):22081–90.10.1021/acsomega.0c02100Search in Google Scholar PubMed PubMed Central
[48] Moormeier DE, Bayles KW. Staphylococcus aureus biofilm: a complex developmental organism. Mol Microbiol. 2017;104(3):365–76.10.1111/mmi.13634Search in Google Scholar PubMed PubMed Central
[49] Rühs PA, Böcker L, Inglis RF, Fischer P. Studying bacterial hydrophobicity and biofilm formation at liquid–liquid interfaces through interfacial rheology and pendant drop tensiometry. Colloids Surf B: Biointerfaces. 2014;117:174–84.10.1016/j.colsurfb.2014.02.023Search in Google Scholar PubMed
[50] Pelipenko J, Kristl J, Rošic R, Baumgartner S, Kocbek P. Interfacial rheology: an overview of measuring techniques and its role in dispersions and electrospinning. Acta Pharm. 2012;62(2):123–40.10.2478/v10007-012-0018-xSearch in Google Scholar PubMed
[51] Hollenbeck EC, Fong JCN, Lim JY, Yildiz FH, Fuller GG, Cegelski L. Molecular determinants of mechanical properties of V. cholerae biofilms at the air-liquid interface. Biophys J. 2014;107(10):2245–52.10.1016/j.bpj.2014.10.015Search in Google Scholar PubMed PubMed Central
[52] Barnes HA, Hutton JF, Walters K. An introduction to rheology. Vol. 37, Amsterdam, Netherlands: Elsevier; 1989.Search in Google Scholar
[53] Sundaram H, Cassuto D. Biophysical characteristics of hyaluronic acid soft-tissue fillers and their relevance to aesthetic applications. Plastic Reconstructive Surg. 2013;132(4S-2):5S–21S.10.1097/PRS.0b013e31829d1d40Search in Google Scholar PubMed
[54] Rao MA. Rheology of fluid and semisolid foods: principles and applications. New York, USA: Springer Science & Business Media; 2010.Search in Google Scholar
[55] Oh YJ, Lee NR, Jo W, Jung WK, Lim JS. Effects of substrates on biofilm formation observed by atomic force microscopy. Ultramicroscopy. 2009;109(8):874–80.10.1016/j.ultramic.2009.03.042Search in Google Scholar PubMed
[56] Wright CJ, Shah MK, Powell LC, Armstrong I. Application of AFM from microbial cell to biofilm. Scanning. 2010;32(3):134–49.10.1002/sca.20193Search in Google Scholar PubMed
[57] Chatterjee S, Biswas N, Datta A, Dey R, Maiti P. Atomic force microscopy in biofilm study. Microscopy. 2014;63(4):269–78.10.1093/jmicro/dfu013Search in Google Scholar PubMed
© 2025 the author(s), published by De Gruyter
This work is licensed under the Creative Commons Attribution 4.0 International License.
Articles in the same Issue
- Research Articles
- Lie symmetry analysis of bio-nano-slip flow in a conical gap between a rotating disk and cone with Stefan blowing
- Mathematical modelling of MHD hybrid nanofluid flow in a convergent and divergent channel under variable thermal conductivity effect
- Advanced ANN computational procedure for thermal transport prediction in polymer-based ternary radiative Carreau nanofluid with extreme shear rates over bullet surface
- Effects of Ca(OH)2 on mechanical damage and energy evolution characteristics of limestone adsorbed with H2S
- Effect of plasticizer content on the rheological behavior of LTCC casting slurry under large amplitude oscillating shear
- Studying the role of fine materials characteristics on the packing density and rheological properties of blended cement pastes
- Deep learning-based image analysis for confirming segregation in fresh self-consolidating concrete
- MHD Casson nanofluid flow over a three-dimensional exponentially stretching surface with waste discharge concentration: A revised Buongiorno’s model
- Rheological behavior of fire-fighting foams during their application – a new experimental set-up and protocol for foam performance qualification
- Viscoelastic characterization of corn starch paste: (II) The first normal stress difference of a cross-linked waxy corn starch paste
- An innovative rheometric tool to study chemorheology
- Effect of polymer modification on bitumen rheology: A comparative study of bitumens obtained from different sources
- Rheological and irreversibility analysis of ternary nanofluid flow over an inclined radiative MHD cylinder with porous media and couple stress
- Rheological analysis of saliva samples in the context of phonation in ectodermal dysplasia
- Analytical study of the hybrid nanofluid for the porosity flowing through an accelerated plate: Laplace transform for the rheological behavior
- Brief Report
- Correlations for friction factor of Carreau fluids in a laminar tube flow
- Special Issue on the Rheological Properties of Low-carbon Cementitious Materials for Conventional and 3D Printing Applications
- Rheological and mechanical properties of self-compacting concrete with recycled coarse aggregate from the demolition of large panel system buildings
- Effect of the combined use of polyacrylamide and accelerators on the static yield stress evolution of cement paste and its mechanisms
- Special Issue on The rheological test, modeling and numerical simulation of rock material - Part II
- Revealing the interfacial dynamics of Escherichia coli growth and biofilm formation with integrated micro- and macro-scale approaches
- Construction of a model for predicting sensory attributes of cosmetic creams using instrumental parameters based on machine learning
- Effect of flaw inclination angle and crack arrest holes on mechanical behavior and failure mechanism of pre-cracked granite under uniaxial compression
- Special Issue on The rheology of emerging plant-based food systems
- Rheological properties of pea protein melts used for producing meat analogues
- Understanding the large deformation response of paste-like 3D food printing inks
- Seeing the unseen: Laser speckles as a tool for coagulation tracking
- Composition, structure, and interfacial rheological properties of walnut glutelin
- Microstructure and rheology of heated foams stabilized by faba bean isolate and their comparison to egg white foams
- Rheological analysis of swelling food soils for optimized cleaning in plant-based food production
- Multiscale monitoring of oleogels during thermal transition
- Influence of pea protein on alginate gelation behaviour: Implications for plant-based inks in 3D printing
- Observations from capillary and closed cavity rheometry on the apparent flow behavior of a soy protein isolate dough used in meat analogues
- Special Issue on Hydromechanical coupling and rheological mechanism of geomaterials
- Rheological behavior of geopolymer dope solution activated by alkaline activator at different temperature
- Special Issue on Rheology of Petroleum, Bitumen, and Building Materials
- Rheological investigation and optimization of crumb rubber-modified bitumen production conditions in the plant and laboratory