Deep learning-based image analysis for confirming segregation in fresh self-consolidating concrete
-
Azhar Akbotina
 and
Pawel Sikora
and
Pawel Sikora

Abstract
Segregation in self-consolidating concrete (SCC) can significantly impact the quality and structural integrity of concrete applications. Traditional methods for assessing segregation, such as the visual stability index and column segregation tests, often involve manual intervention, introducing subjectivity and delaying the assessment process. This study proposes a novel image-based approach using deep learning, specifically the YOLOv8 segmentation model, to quantify and assess segregation in fresh SCC mixes. Utilizing high-resolution images from slump flow tests, the model identifies critical indicators of segregation, including the mortar halo and aggregate pile. These features are evaluated with two newly introduced quantitative metrics: the mortar halo index (I mh) and the aggregate pile index (I ap). Experimental validation demonstrates high model precision (96.4%) and recall (85.6%), establishing it as a robust tool for on-site quality control. Furthermore, the study examines the relationship between segregation levels and compressive strength, revealing a strong correlation between increased segregation and reduced strength. The proposed feedback-based optimization strategy for mix proportions enables real-time adjustments to mitigate segregation risks. This approach enhances the objectivity and efficiency of segregation assessments, facilitating improved mix design and overall concrete performance on construction sites.
1 Introduction
Self-consolidating concrete (SCC) is a significant advancement in concrete technology, designed to flow under its own weight and fill formwork without the need for mechanical vibration [1]. Introduced in Japan in the late 1980s, SCC has transformed the construction industry by addressing critical challenges related to concrete placement and compaction [2,3]. Its highly fluid properties allow for superior consolidation even in densely reinforced sections without segregation [4]. This characteristic ensures uniform strength and durability throughout the structure while significantly reducing the labor and time associated with conventional concrete methods [5]. Moreover, SCC offers practical advantages such as reducing noise pollution from mechanical vibrations and enhancing workplace safety by minimizing tripping hazards [6]. In addition, SCC allows for increased flexibility in detailing reinforcing bars, thereby improving the overall efficiency and safety of construction projects [7].
Despite its numerous advantages, the application of SCC presents challenges, particularly issues related to segregation. Maintaining a uniform distribution of components is key to the stability of SCC, which resists segregation to ensure a consistent mixture [8]. Segregation occurs when aggregates settle due to insufficient buoyant and restoring forces, leading to water bleeding, uneven material distribution, and reduced concrete quality [4,9]. The loss of stability in SCC can cause various issues such as pipe blockages during pumping, obstructions around reinforcement, the formation of voids, and honeycomb defects [10]. An optimal balance between workability and stability can be achieved through precise control over mix proportions and the selection of appropriate materials [11]. Several methods have been proposed to assess SCC stability and quantify segregation, including column segregation [12], segregation probe [13,14], flow trough [15], and sieve stability tests [16]. However, these tests are often costly, resource-intensive, and time-consuming, involving iterative procedures by operators [17].
To overcome these limitations, researchers have developed automated methods to monitor and enhance stability, providing more precise and reliable assessments of segregation. For example, an innovative approach was introduced employing image processing technology to analyze images of cut-hardened concrete specimens [18]. In this process, images were converted into binary representations, and algorithms were applied to identify aggregate particles, measure their radii, and assess the mortar layer necessary for evaluating stability. The hardened visual stability index, a quantitative metric, was used to provide a more precise and efficient assessment of SCC stability compared to traditional visual methods. Despite the advantages of this automated approach, it remains constrained by the need to create and harden cylinder specimens, resulting in delays in stability assessment and limiting its ability to evaluate segregation risks in the fresh state.
With the development of artificial intelligence techniques, machine learning and deep learning algorithms have been adopted to predict the rheology, workability, and mechanical properties of SCC [19]. For instance, a comprehensive dataset of several SCC mixtures with thirteen parameters related to their compositions was assembled, and a random forest algorithm was employed to forecast the rheological properties of SCC, which were subsequently used to estimate various SCC characteristics, including the segregation rate. The results demonstrated a high level of accuracy in predicting both the rheological and mechanical properties of SCC. However, the practical applicability of this model was limited by the restricted number of input parameters and potential biases inherent in the published data used for model training. In addition, 3D point cloud analysis has been utilized for assessing aggregate segregation in fresh SCC [20]. This approach involved scanning the surface of the slump flow to capture 3D point cloud data, encompassing spatial and RGB color information. Post-processing techniques were employed to segment the point cloud data of SCC, enabling detailed analysis of the diameter, height, and curvature of the slump flow. Aggregate segregation was quantified by calculating the volume of segregation suspicious region at the core of the slump flow. The depth-data-based methodology was validated through comparisons with standardized qualitative tests and digital image analysis of hardened SCC specimens, demonstrating significant reliability and effectiveness. Nevertheless, this methodology primarily focused on SCC containing coarse aggregates up to 25 mm in size and did not account for bleeding phenomena, potentially affecting the comprehensive representation of segregation patterns.
To address these limitations, a novel image-based method for quality control of fresh concrete was introduced [21]. This approach involved capturing digital images of fresh concrete following the standard slump flow test and employing a segmentation model for semi-supervised learning to extract relevant information [22]. Correlations between image-derived parameters and conventional concrete properties were successfully established, demonstrating the potential of digital techniques for improving quality control in SCC production. However, the practical implementation and interpretation of the results may be challenged by the complexity of the convolutional neural network model used. These previous studies have made substantial contributions to the development of automated methods for addressing segregation issues in concrete, offering valuable insights into innovative approaches for assessing segregation and enhancing concrete quality control. Despite these advancements, there remains a substantial gap in practical and objective methods for monitoring segregation during SCC-related construction activities. Proposed methodologies often face challenges with onsite implementation, limiting their applicability in real-world scenarios. Additionally, the absence of a feedback-based approach to optimize SCC mixes in response to segregation issues further exacerbates this problem. Developing a practical solution that reduces subjectivity in stability assessment and facilitates mix design optimization is essential for improving construction efficiency and reliability, thereby ensuring the integrity and longevity of SCC structures.
This study aims to reduce subjectivity in the segregation assessment of fresh SCC by developing an approach that minimizes individual interpretations through numerical indexes, thus enhancing reliability and consistency. To achieve this, the YOLOv8 segmentation model was adopted to quantify and assess segregation in fresh SCC mixes. Utilizing high-resolution images from slump flow tests, the model identifies critical indicators of segregation, including the mortar halo and aggregate pile. The proposed approach seeks to be practically applicable in construction site settings, considering cost, time, and resource requirements, thereby bridging the gap between theoretical advancements and practical construction practices. In addition, the study introduces a feedback-based methodology for optimizing SCC mixes, enabling adjustments based on segregation assessment results, ultimately improving the quality and durability of SCC structures. Through these efforts, the study confirms an image-based approach for more objective segregation assessment and proposes mix optimization strategies tailored to observed segregation levels, facilitating continuous improvement in concrete quality and structural integrity.
2 Materials and methods
2.1 Dataset preparation
To develop an accurate image segmentation model, two distinct datasets were carefully prepared. The first dataset consisted of 107 slump flow images collected from various sources, including publications, books, and websites. Despite certain limitations, such as imbalanced representation and inconsistent image quality, this dataset enabled the model to refine its performance by adjusting its weights, thereby reducing the need for additional data collection. The second dataset was generated through experimental work involving slump flow tests on SCC mixtures. The mixtures, summarized in Table 1, were formulated using the mix designs outlined in [20,23,24,25], which specify the compositions required to achieve different levels of segregation. A total of 89 high-resolution images were captured under controlled conditions, depicting SCC mixtures with varying degrees of segregation. The images were taken from a height of 150 cm above the concrete flow to ensure full coverage and avoid distortion, providing an accurate representation of the concrete’s behavior while maintaining consistency and standardization in the image acquisition process.
Mix proportions of the samples
| Mix | Water (kg/m3) | Cement (kg/m3) | Fly ash (kg/m3) | Coarse aggregate (kg/m3) | Sand (kg/m3) | SP∗ (kg/m3) | w/b | Sand/TA∗∗ |
|---|---|---|---|---|---|---|---|---|
| SCC1 | 180 | 450 | — | 845 | 845 | 5.4 | 0.40 | 0.50 |
| SCC2 | 180 | 450 | — | 845 | 940 | 5.4 | 0.40 | 0.53 |
| SCC3 | 180 | 450 | — | 845 | 1,020 | 5.4 | 0.40 | 0.55 |
| SCC4 | 190 | 450 | — | 845 | 1,020 | 5.4 | 0.42 | 0.55 |
| SCC5 | 200 | 450 | — | 845 | 1,020 | 5.4 | 0.44 | 0.55 |
| SCC6 | 190 | 360 | 90 | 870 | 935 | 5.4 | 0.42 | 0.52 |
| SCC7 | 190 | 360 | 90 | 870 | 1,050 | 5.4 | 0.42 | 0.55 |
| SCC8 | 210 | 360 | 90 | 870 | 1,050 | 5.4 | 0.47 | 0.55 |
| SCC9 | 220 | 360 | 90 | 870 | 1,050 | 5.4 | 0.49 | 0.55 |
| SCC10 | 220 | 360 | 90 | 870 | 1,050 | 6.2 | 0.49 | 0.55 |
| SCC11 | 220 | 405 | 90 | 870 | 1,050 | 6.2 | 0.44 | 0.55 |
| SCC12 | 220 | 405 | 90 | 870 | 1,090 | 6.2 | 0.44 | 0.56 |
| SCC13 | 235 | 405 | 90 | 870 | 1,090 | 6.2 | 0.47 | 0.56 |
*SP: superplasticizer, **Sand/TA: sand–to-total aggregate ratio.
The images were manually labeled into three categories – concrete flow, mortar halo, and aggregate pile – using the Roboflow software [26]. Preprocessing included resizing the images to 640 × 640 pixels and applying data augmentation techniques such as flipping, rotating, and adjusting brightness to enhance the diversity of the dataset and ensure image quality [27,28]. Transfer learning was employed with a pre-trained YOLOv8 model to improve segmentation accuracy, enabling the model to perform effectively even with a relatively small dataset [29].
2.2 Segmentation of segregation features in slump flow images
The initial phase of the methodology involved segmenting segregation features in slump flow images of SCC. The visual stability index (VSI) was used to identify visible properties indicative of segregation, a crucial factor in evaluating the stability of SCC mixtures. VSI, widely utilized in both laboratory and construction settings, assigns values ranging from 0 to 3 based on SCC’s resistance to segregation. Lower VSI values indicate better stability, with SCC mixtures rated 0 or 1 considered acceptable for use, while those rated 2 or 3 require modification of the mixture [30]. Based on the VSI, segregation in SCC is typically characterized by two primary visual features: the pile of aggregate at the center of the concrete flow and the mortar halo at the outer edge. These features are critical for assessing the stability and quality of the concrete mixture. Consequently, the segmentation of these features was a key focus of this study.
To achieve this, computer vision techniques were employed to effectively analyze visual data and extract meaningful information [31]. The You Only Look Once (YOLO) model, first introduced in 2016, revolutionized object detection by enabling real-time processing with a single network pass, eliminating the need for sliding window or two-stage detection approaches [32]. YOLOv8, released by Ultralytics in 2023, was employed in this study for instance segmentation due to its superior speed and accuracy [33]. The model leverages a convolutional architecture with key components such as the C2f module and Spatial Pyramid Pooling Fusion, which enhance gradient flow, feature extraction, and overall detection accuracy [34]. Specifically, we utilized YOLOv8s-seg, an instance segmentation variant of YOLOv8, to precisely detect segregation features in slump flow images. Model training and inference were conducted using Google Colab Pro, leveraging high-performance cloud computing resources. The training process utilized an NVIDIA Tesla T4 GPU to accelerate deep learning computations. The model’s input consists of images paired with corresponding segmentation labels stored in YOLO format, where each labeled instance includes a class ID (e.g., slump flow, mortar halo, or aggregate pile) and a segmentation mask represented by polygon coordinates defining the object boundary. The output comprises bounding boxes and segmentation masks highlighting detected objects within the image, class labels identifying each region, and confidence scores indicating prediction reliability. The segmentation model’s performance was evaluated using precision (P), recall (R), mean Average Precision at a 50% overlap threshold (mAP50), and mean Average Precision across overlap thresholds from 50 to 95% (mAP50-95). These metrics provided a robust assessment of the model’s ability to accurately classify and identify relevant instances of segregation [35]. The results confirmed the model’s efficacy in detecting and segmenting segregation features with high accuracy.
2.3 Quantitative metrics for segregation evaluation
To reduce subjectivity in segregation assessment, this study introduced quantitative metrics for evaluating the severity of segregation in SCC. Two key parameters were proposed: the mortar index, I mh, and the aggregate pile index, I ap, which quantify the relative sizes of the mortar halo and aggregate pile, respectively. These metrics provide a reliable and reproducible means to assess segregation risk, enabling construction site workers to implement corrective actions as needed. The metrics are calculated using the following formulas:
where A mh is the area of the mortar halo, A cf is the area of the concrete flow, and A ap is the area of the aggregate pile. These areas were determined by analyzing binary masks generated by the YOLOv8-seg model, ensuring precise quantification without duplication. It should be noted that the aggregate pile index (I ap) is based on the footprint area of the aggregate pile rather than its height. While this approach effectively quantifies horizontal segregation patterns, it does not account for cases where severe segregation leads to vertical accumulation of aggregates. Since vertical distribution plays a crucial role in segregation severity, incorporating 3D imaging techniques in future studies could provide a more comprehensive assessment by capturing height variations in aggregate piles. Previous studies have demonstrated the potential of 3D imaging techniques in assessing fresh concrete properties, which could offer valuable insights into the vertical distribution of aggregates [36].
To establish segregation levels, the indexes were calculated using images from published literature representing various segregation levels based on the VSI [30,31]. Percentiles, such as the 5th, 15th, and 40th, were systematically used to define thresholds through statistical analysis of the index data. While some degree of subjectivity may persist in interpreting the results, the primary goal was to provide general recommendations rather than rigid classifications. The proposed thresholds guide the assessment of segregation severity and inform intervention strategies. Table 2 summarizes these thresholds, offering a reference for categorizing segregation severity and implementing appropriate corrective measures.
Ranges of quantitative metrics for segregation evaluation
| Segregation level | Mortar halo index (I mh) | Aggregate pile index (I ap) |
|---|---|---|
| No/Low | <0.030 | <0.040 |
| Slight | 0.030–0.090 | 0.040–0.052 |
| Moderate | 0.090–0.120 | 0.052–0.072 |
| Severe | >0.120 | >0.072 |
To analyze the relationship between segregation levels and concrete compressive strength, cubic samples measuring 50 × 50 × 50 mm3 were prepared using various SCC mixtures. As shown in Table 1, the mixtures included cement-only binders as well as cement-fly ash binders to evaluate the influence of different binder compositions on compressive strength development. Each mixture produced three samples, resulting in a total of 39 specimens. After casting, the samples were demolded 24 h later and cured in water for 28 days. Compressive strength tests were conducted following the curing period. Compressive strength testing was conducted using a universal testing machine. Theoretical strength values were calculated based on an adjusted Abrams-type relation for 50 mm cubes, with a conversion factor applied to account for differences in specimen size [37,38]. Statistical analyses, including correlation coefficients and error assessment, were performed to evaluate the influence of segregation on the mechanical properties of the SCC mixes [39]. This methodology facilitated a detailed analysis of how segregation impacts compressive strength, providing insights into the relationship between concrete stability and its structural performance.
2.4 Feedback-based recommendations for mix proportions
Feedback-based recommendations for optimizing mix proportions were developed using the mortar halo and aggregate pile indices as key indicators. These recommendations, grounded in literature that examines the effects of factors such as cementitious material content, water-to-cement ratio, and admixture types on segregation behavior, are designed to address varying degrees of segregation [10,11,40,41]. The approach considers scenarios where both the aggregate pile and mortar halo features are present, as well as cases where only one feature is observed. This ensures targeted optimization strategies to effectively mitigate segregation issues in SCC production.
3 Results and discussion
3.1 Performance of image segmentation model
The performance of the image segmentation model was examined using two datasets: a pre-training dataset of 107 images and a produced dataset of 89 images. The YOLOv8 segmentation model pre-trained on the COCO dataset [42] was used, with data augmentation expanding the training set to 252 images. Fine-tuning was conducted by adjusting the batch size to 16, achieving the best balance between precision, recall, and mAP50.
The produced dataset was also augmented, increasing the training set to 219 images. The model, trained for 214 epochs with a batch size of 16, demonstrated excellent pixel-wise segmentation (Mask) performance, achieving a precision of 94.6%, recall of 85.6%, mAP50 of 90.4%, and mAP50-95 of 72.6%. Detailed class-wise performance metrics, including both bounding box detection (Box) and pixel-wise segmentation (Mask), are summarized in Table 3. For the “concrete flow” and “aggregate pile” classes, the model achieved perfect precision and recall of 100%, while for the “mortar halo” class, precision was 83.7%, and recall was 56.9%, reflecting the complexity of the feature. The model demonstrated rapid convergence, with a training time of 0.145 h and an inference time of 3.9 ms. These results illustrate the high accuracy and efficiency of the model, making it suitable for handling large datasets. Figure 1 presents the test set segmentation masks, highlighting the model has strong generalization capability.
Performance metrics of the pre-trained model on the produced dataset
| Class | Box | Mask | ||||||
|---|---|---|---|---|---|---|---|---|
| P (%) | R (%) | mAP50 (%) | mAP50-95 (%) | P (%) | R (%) | mAP50 (%) | mAP50-95 (%) | |
| All | 94.6 | 85.6 | 90.5 | 78.0 | 94.6 | 85.6 | 90.4 | 72.6 |
| Concrete flow | 100 | 100 | 99.5 | 98.6 | 100 | 100 | 99.5 | 97.7 |
| Mortar halo | 83.7 | 56.9 | 72.5 | 48.8 | 83.7 | 56.9 | 72.2 | 35.0 |
| Aggregate pile | 100 | 100 | 99.5 | 86.5 | 100 | 100 | 99.5 | 85.1 |
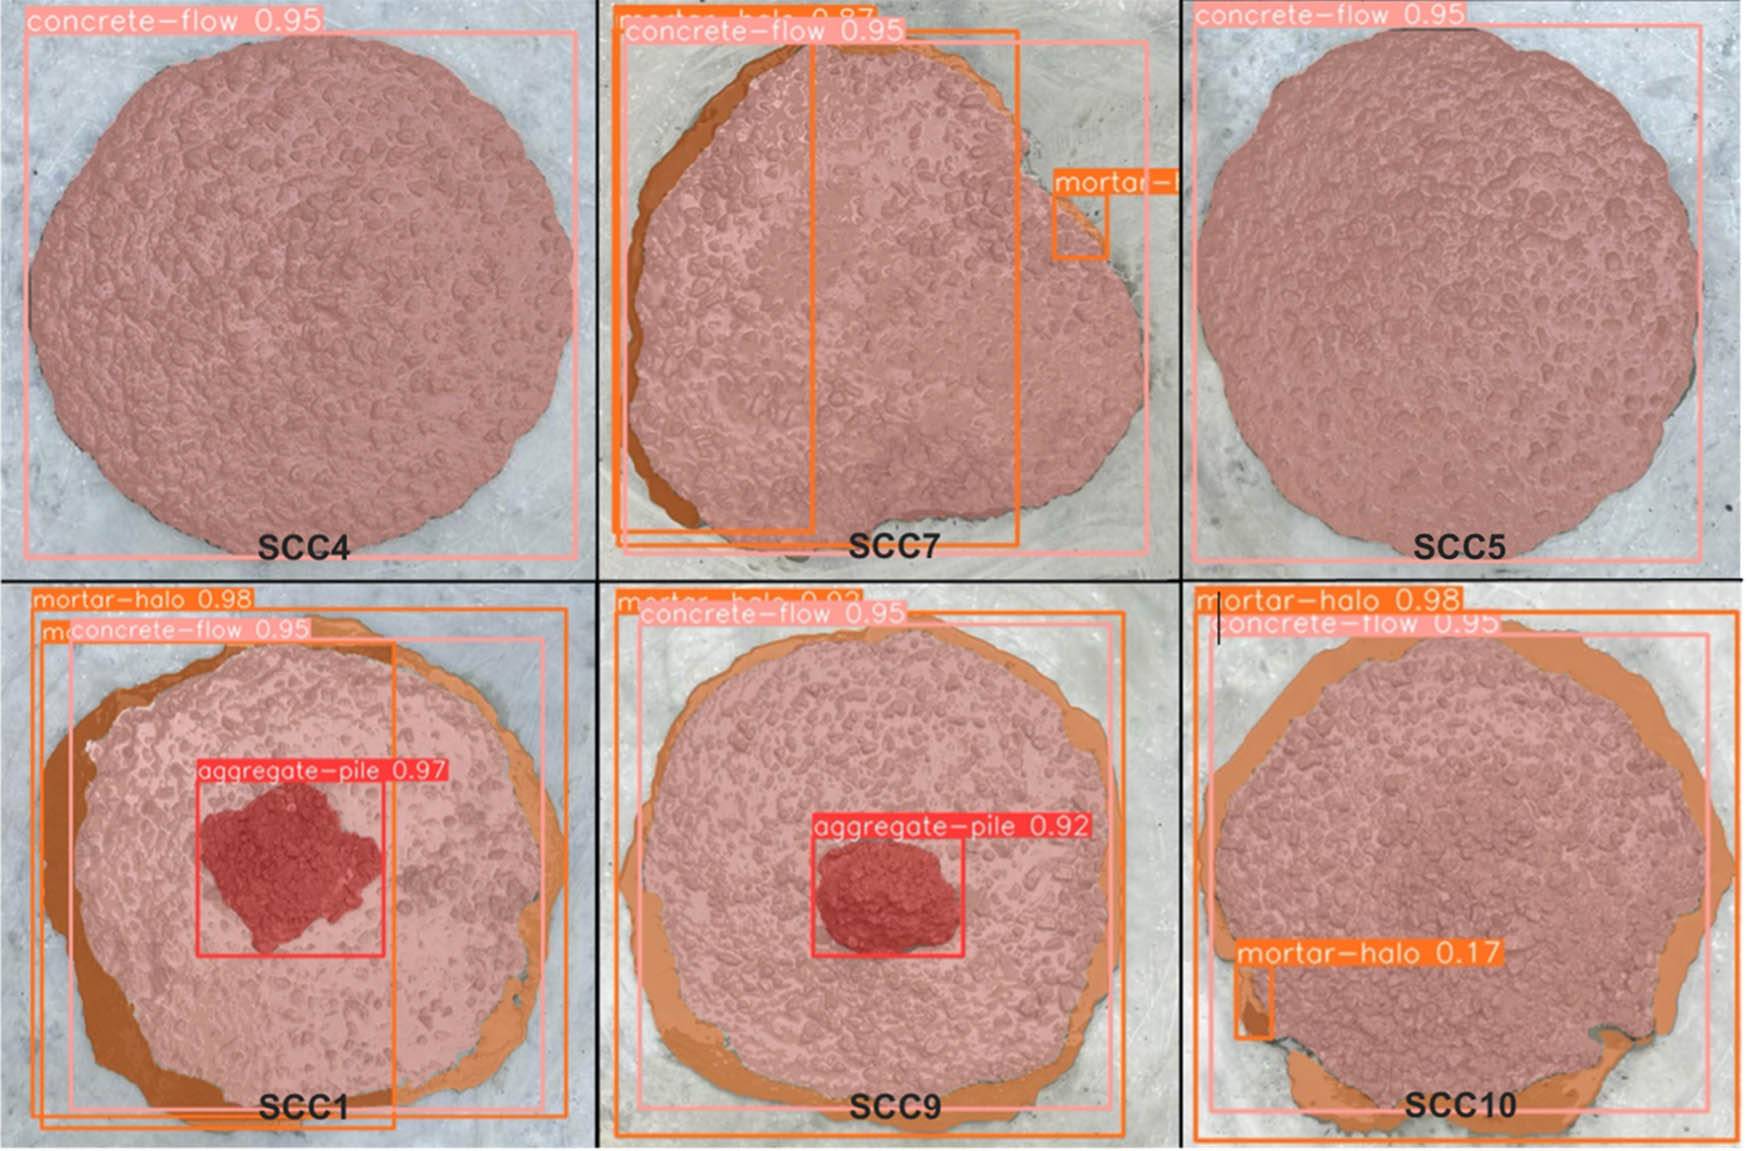
Segmented images from the test set.
3.2 Quantitative evaluation of segregation features
A quantitative assessment of segregation features is presented based on the segmentation results. The model computed the mortar halo and aggregate pile indices to characterize segregation levels. These indices provide quantitative measures to evaluate the degree of segregation. The analysis identified varying segregation levels across the material samples. In Figure 2, a significant mortar halo indicated moderate segregation, whereas Figure 3 highlighted both mortar halo and aggregate piles, indicating severe segregation. These findings aligned with the original images, validating the effectiveness of the model in identifying and classifying segregation features. Furthermore, the predicted indices were compared with true labels, revealing a low error rate. The model demonstrated a 13.15% error for the mortar halo index and a 6.12% error for the aggregate pile index, confirming its reliability in segregation characterization.

Results of quantitative evaluation of test image (moderate case of segregation, SCC7).

Results of quantitative evaluation of test image (severe case of segregation, SCC9).
3.3 Correlation of segregation level with compressive strength
To investigate the relationship between segregation level and concrete compressive strength, experimental results from 39 SCC samples were analyzed. The sample preparation, curing, and testing procedures were conducted as described in Section 2.3. Compressive strength values were compared to theoretical predictions to assess the impact of segregation on mechanical performance. The samples were demolded after 24 h and cured in water for 28 days until compressive strength testing. Experimental and theoretical values were analyzed to examine the influence of segregation on concrete strength. Theoretical compressive strength values were calculated using an Abrams-type relation adjusted for 50 × 50 × 50 mm3 samples [37]. The formula applied is:
A conversion factor of 0.89 was applied to these values – since the formula was originally calculated for 100-mm cube specimens – to ensure consistency with the experimental results from the 50-mm cube samples [38].
Figure 4 presents a clustered column bar chart comparing the experimental compressive strength values with theoretical values for each concrete mix. The results indicate that severe segregation generally leads to lower compressive strength compared to mixes with moderate or slight segregation. This trend is reflected in the reduced average compressive strength for mixes exhibiting severe segregation. Conversely, mixes with stable properties achieve higher compressive strength, with those incorporating fly ash achieving the highest values. The obtained results also highlight percentage errors between experimental and theoretical values, showing that mixes with severe and moderate segregation have larger variance compared to stable and slightly segregated mixes.

Comparison of experimental and theoretical compressive strength with error percentage.
The box plot presented in Figure 5 illustrates the relationship between segregation level and compressive strength in concrete samples. Each box represents the interquartile range (25th to 75th percentiles) of compressive strength values for a given segregation level, providing insights into data variability and central tendency. The whiskers extend to the minimum and maximum values, while the line inside each box represents the median compressive strength. A clear trend is observed that samples with higher segregation levels tend to exhibit lower compressive strength, reinforcing the detrimental effects of segregation on mechanical performance. This suggests that as segregation severity increases, the structural integrity of the material is compromised, resulting in reduced load-bearing capacity. In contrast, samples with slight and stable segregation demonstrate higher and more consistent compressive strength, indicating that a well-mixed and homogeneous composition enhances mechanical properties. In addition, the increased variability in compressive strength for samples with severe and moderate segregation, as indicated by the extended box sizes, suggests that higher segregation levels introduce inconsistencies in material distribution. This may lead to unpredictable structural performance. These findings emphasize not only the negative impact of segregation on strength but also the importance of mitigating segregation through optimized mix design and stringent quality control.

The relationship between segregation level and compressive strength.
Pearson correlation coefficients and p-values were calculated to quantify the relationship between segregation and compressive strength. The Pearson correlation coefficient r measures the strength and direction of the linear relationship between segregation level and compressive strength, while the p-value evaluates the statistical significance of the correlation coefficient [39]. The results summarized in Table 4 demonstrate a strong positive correlation between segregation level and compressive strength, with high correlation coefficients and significant p-values for mixes with cement-only binders and those with cement–fly ash binders. This indicates a consistent relationship between segregation and compressive strength, highlighting the substantial impact of segregation on the mechanical properties of concrete.
Correlation coefficients and p-values
| Data | Pearson’s correlation coefficient (r) | p-value |
|---|---|---|
| Mixes with cement binder | 0.971 | 1.782 × 10⁻⁹ |
| Mixes with cement and fly ash binder | 0.842 | 2.417 × 10⁻⁷ |
| All mixes | 0.827 | 8.708 × 10⁻¹¹ |
These findings underscore the importance of controlling segregation to maintain desirable strength characteristics in concrete mixes. The analysis provides valuable insights into the influence of segregation levels on concrete performance, reinforcing the need for precise control and monitoring during mix design and production.
3.4 Analysis of optimization recommendations
The analysis of optimization recommendations proposed by the image-based approach evaluates the feasibility of suggested improvements for concrete mix proportions based on observed segregation features. The recommendations focus on addressing specific segregation issues while adhering to established practices for optimizing concrete mix designs. Figure 6 presents the model’s recommendations for mitigating severe segregation in the SCC1 mix, characterized by a fine aggregate-to-total aggregate ratio (FA/TA) of 0.5 and a water-to-binder ratio (w/b) of 0.4. The proposed adjustments include revising the mix design, enhancing the uniformity of the aggregate blend, and optimizing the superplasticizer dosage. These measures aim to improve mix stability and address observed segregation challenges effectively.

Mix optimization recommendations for SCC1 mix.
Figure 7 presents the model’s recommendations for addressing severe segregation in the SCC10 mix (FA/TA = 0.55, high superplasticizer dosage, w/b = 0.49), where a prominent mortar halo indicates segregation. Suggested modifications include reducing the water-to-binder ratio and incorporating additional cementitious materials to enhance paste cohesion and minimize bleeding. These adjustments are aimed at improving mix stability by reducing water demand and addressing segregation at its source. Figure 8 highlights recommendations for mitigating moderate segregation observed in the SCC7 mix, specifically a visible mortar halo. For this mix (w/b = 0.42), the model suggests lowering the water-to-binder ratio further and incorporating a viscosity-modifying admixture to improve paste cohesion and reduce bleeding, enhancing overall stability. Figure 9 shows recommendations for slight segregation in the SCC13 mix (FA/TA = 0.56, w/b = 0.47, increased SP dosage). Here, the model advises a minor reduction in the water-to-binder ratio to bolster paste cohesion. This approach is deemed sufficient for addressing the observed segregation with minimal adjustments. Figure 10 presents the model’s evaluation of the stable SCC4 mix, which indicates no changes are required. The current mix composition is identified as optimal, reflecting the model’s capability to distinguish stable mixes from those requiring modifications.

Mix optimization recommendations for SCC10 mix.

Mix optimization recommendations for SCC7 mix.

Mix optimization recommendations for SCC13 mix.

Mix optimization recommendations for SCC4 mix.
The proposed recommendations specifically address the identified segregation issues, ranging from severe to slight, and align with best practices for optimizing concrete mix designs. Implementing these adjustments can enhance concrete quality and contribute to improved construction outcomes.
4 Conclusions
This study presents an image-based approach utilizing YOLOv8 segmentation to evaluate segregation in SCC. The proposed methodology enhances objectivity and accuracy in assessing concrete quality, addressing the critical need for reliable on-site evaluation tools. Key findings and contributions of this research include the following:
Two comprehensive datasets were developed: one from publicly available sources and another from experimental work, comprising a total of 196 images. These datasets enabled precise labeling and effective model training, allowing for a detailed analysis of segregation features.
The analysis revealed a strong positive correlation between segregation levels and compressive strength. Segregated samples generally exhibited lower compressive strength, emphasizing the importance of mitigating segregation to achieve desired strength properties in SCC.
The YOLOv8 model demonstrated high precision (94.6%) and recall (85.6%) in identifying segregation features. Although the performance for detecting the mortar halo was slightly lower, the model showed robust capabilities for real-world concrete quality assessment. Recommendations generated by the model include adjusting the mix design, optimizing the water-to-binder ratio, and incorporating specific additives to minimize segregation and enhance concrete performance.
The incorporation of an image-based approach guided by the VSI represents a significant advancement by reducing subjectivity and enhancing reliability. Despite these advances, achieving absolute certainty in detecting segregation solely from slump flow tests remains challenging. Future research should aim to expand the model’s applicability by integrating a wider variety of mix compositions, binder types, and aggregate sizes. Enhancing segmentation accuracy for features such as mortar halo can be achieved by increasing dataset diversity and improving image quality under varying lighting conditions. In addition, further research could explore the integration of 3D imaging techniques to capture height variations in aggregate piles, providing a more comprehensive assessment of segregation severity and enhancing the reliability of automated detection methods. Addressing these limitations will enhance the model’s effectiveness for practical applications and advance the field of SCC quality evaluation.
Acknowledgments
This work was supported by the National Research Foundation of Korea (NRF) grant funded by the Korean Government (MSIT) (No. 2022R1C1C1004684) and the Korea Agency for Infrastructure Technology Advancement (KAIA) grant funded by the Ministry of Land, Infrastructure and Transport (Grant RS-2021-KA163381). This research was also supported by Yonsei University Research Fund 2023-22-0135.
-
Funding information: This work was supported by the National Research Foundation of Korea (NRF) grant funded by the Korean Government (MSIT) (No. 2022R1C1C1004684) and the Korea Agency for Infrastructure Technology Advancement (KAIA) grant funded by the Ministry of Land, Infrastructure and Transport (Grant RS-2021-KA163381). This research was also supported by Yonsei University Research Fund 2023-22-0135.
-
Author contributions: Azhar Akbotina: ideas, methodology, validation, data curation, supervision, writing – original draft, and review & editing. Sang-Yeop Chung: validation, formal analysis, data curation, writing – original draft, and review & editing. Pawel Sikora: investigation, validation, and writing – review & editing.
-
Conflict of interest: The authors declare that they have no competing financial interests or personal relationships that may have influenced the work reported in this study.
-
Ethical statement: The conducted research is not related to either human or animal use.
-
Data availability statement: The datasets generated during and/or analysed during the current study are available from the corresponding author on reasonable request.
References
[1] Institute AC. Self-consolidating concrete (ACI 237R-07). Detroit Michigan: American Concrete Institute; 2007.Search in Google Scholar
[2] Okamura H, Ouchi M. Self-compacting concrete. J Adv Concr Technol. 2003;1(1):5–15.10.3151/jact.1.5Search in Google Scholar
[3] Goodier CI. Development of self-compacting concrete. Proc Inst Civ Eng-Struct Build. 2003;156(4):405–14.10.1680/stbu.156.4.405.37839Search in Google Scholar
[4] Bonen D, Shah SP. Fresh and hardened properties of self-consolidating concrete. Prog Struct Eng Mater. 2004;7(1):14–26.10.1002/pse.186Search in Google Scholar
[5] Khayat KH, Hu C, Monty H. Stability of self-consolidating concrete advantages and potential applications. In PRO 7: 1st International RILEM Symposium on Self-Compacting Concrete. Vol. 7, RILEM Publications; 1999. p. 143.Search in Google Scholar
[6] Bartos PJM, Cechura J. Improvement of working environment in concrete construction by the use of self–compacting concrete. Struct Concr. 2001;2(3):127–32.10.1680/stco.2.3.127.40106Search in Google Scholar
[7] Rwamamara R, Simonsson P. Self-compacting concrete use for construction work environment sustainability. J Civ Eng Manag. 2012;18(5):724–34.10.3846/13923730.2012.723399Search in Google Scholar
[8] Panesar DK, Shindman B. The effect of segregation on transport and durability properties of self consolidating concrete. Cem Concr Res. 2012;42(2):252–64.10.1016/j.cemconres.2011.09.011Search in Google Scholar
[9] Koehler EP, Fowler DW, Foley EH, Rogers GJ, Watanachet S, Jung MJ. Self-consolidating concrete for precast structural applications: mixture proportions workability and early-age hardened properties. USA: Center for Transportation Research; 2007. p. FHWA/TX-08/0-5134-1.Search in Google Scholar
[10] Zhang Z, Xiao J, Zhang Q, Han K, Wang J, Hu X. A state-of-the-art review on the stability of self-consolidating concrete. Constr Build Mater. 2021;268:121099.10.1016/j.conbuildmat.2020.121099Search in Google Scholar
[11] Bonen D, Deshpande Y, Olek J, Shen L, Struble L, Lange D, et al. Robustness of SCC. Self-Consolidating Concr. 2007;4:33–42.Search in Google Scholar
[12] International A. Standard test method for static segregation of self consolidating concrete using column technique. USA: ASTM International; 2006.Search in Google Scholar
[13] Standard test method for static segregation of fresh self-consolidating concrete cylinders using the static segregation probe; 2008.Search in Google Scholar
[14] Shen L, Jovein HB, Li M. Measuring static stability and robustness of self-consolidating concrete using modified Segregation Probe. Constr Build Mater. 2014;70:210–6.10.1016/j.conbuildmat.2014.07.112Search in Google Scholar
[15] Shen L, Jovein HB, Sun Z, Wang Q, Li W. Testing dynamic segregation of self-consolidating concrete. Constr Build Mater. 2015;75:465–71.10.1016/j.conbuildmat.2014.11.010Search in Google Scholar
[16] Group EP. The European guidelines for self-compacting concrete. Farnham UK: EFNARC; 2005.Search in Google Scholar
[17] Libre NA, Khoshnazar R, Shekarchi M. Repeatability responsiveness and relative cost analysis of SCC workability test methods. Mater Struct. 2012;45:1087–100.10.1617/s11527-011-9818-6Search in Google Scholar
[18] Fang C, Labi S. Image-processing technology to evaluate static segregation resistance of hardened self-consolidating concrete. Transp Res Rec. 2007;2020(1):1–9.10.3141/2020-01Search in Google Scholar
[19] Cheng B, Mei L, Long WJ, Kou S, Li L, Geng S. Ai-guided proportioning and evaluating of self-compacting concrete based on rheological approach. Constr Build Mater. 2023;399:132522.10.1016/j.conbuildmat.2023.132522Search in Google Scholar
[20] Yoon J, Li Z, Kim H. Evaluation of aggregate segregation in self-consolidating concrete using 3D point cloud analysis. J Build Eng. 2024;82:108199.10.1016/j.jobe.2023.108199Search in Google Scholar
[21] Schack T, Coenen M, Haist M. Bildbasierte frischbetonprufung–teil 1: Konsistenz und leimgehalt des frischbetons. Beton Stahlbetonbau. 2023;118(4):220–8.10.1002/best.202300013Search in Google Scholar
[22] Coenen M, Schack T, Beyer D, Heipke C, Haist M. Consistency: learning instance representations for semi-supervised panoptic segmentation of concrete aggregate particles. Mach Vis Appl. 2022;33(4):57.10.1007/s00138-022-01313-xSearch in Google Scholar
[23] Keske SD. Assessment of stability test methods for self-consolidating concrete. USA: Auburn University; 2011.Search in Google Scholar
[24] Cussigh F, Sonebi M, Schutter GD. Project testing SCC segregation test methods. In Proceedings of the Third International RILEM Conference on SCC. Reykjavik, Islande: 2003. p. 311–22.Search in Google Scholar
[25] Alami MM. Development of a new test method to evaluate dynamic stability of self-consolidating concrete. 8th International RILEM Symposium on Self-Compacting Concrete, Rilem, France; 2014.Search in Google Scholar
[26] Dwyer B, Nelson J, Solawetz J. Roboflow (version 1.0) [software]. USA: Roboflow; 2022. https://roboflow.com.Search in Google Scholar
[27] Khosla C, Saini BS. Enhancing performance of deep learning models with different data augmentation techniques: A survey. In 2020 International Conference on Intelligent Engineering and Management (ICIEM). IEEE; 2020. p. 79–85.10.1109/ICIEM48762.2020.9160048Search in Google Scholar
[28] Hao Y, Pei H, Lyu Y, Yuan Z, Rizzo JR, Wang Y, et al. Understanding the impact of image quality and distance of objects to object detection performance. In 2023 IEEE/RSJ International Conference on Intelligent Robots and Systems (IROS). IEEE; 2023. p. 11436–42.10.1109/IROS55552.2023.10342139Search in Google Scholar
[29] Guisiano JE, Moulines E, Lauvaux T, Sublime J. Oil and gas automatic infrastructure mapping: Leveraging high-resolution satellite imagery through fine-tuning of object detection models. In International Conference on Neural Information Processing. Singapore: Springer Nature Singapore; 2023. p. 442–58.10.1007/978-981-99-8148-9_35Search in Google Scholar
[30] ASTM International Committee C09 on Concrete and Concrete Aggregates. Standard Test Method for Slump Flow of Self-consolidating Concrete1. USA: ASTM International; 2014.Search in Google Scholar
[31] Bai R, Wang M, Zhang Z, Lu J, Shen F. Automated construction site monitoring based on improved YOLOv8-seg instance segmentation algorithm. IEEE Access. 2023;11:139082–96.10.1109/ACCESS.2023.3340895Search in Google Scholar
[32] Redmon J, Divvala S, Girshick R, Farhadi A. You only look once: Unified, real-time object detection. Proceedings of the IEEE Conference on Computer Vision and Pattern Recognition; 2016. p. 779–88.10.1109/CVPR.2016.91Search in Google Scholar
[33] Jocher G, Chaurasia A, Qiu J. YOLO by Ultralytics. USA: Ultralytics; 2023. Available online: https://github.com/ultralytics/ultralytics (accessed on 28 February 2023).Search in Google Scholar
[34] Terven J, Córdova-Esparza DM, Romero-González JA. A comprehensive review of yolo architectures in computer vision: From yolov1 to yolov8 and yolo-nas. Mach Learn Knowl Extraction. 2023;5(4):1680–716.10.3390/make5040083Search in Google Scholar
[35] Casas GG, Ismail ZH, Limeira MMC, da Silva AAL, Leite HG. Automatic detection and counting of stacked eucalypt timber using the YOLOv8 model. Forests. 2023;14(12):2369.10.3390/f14122369Search in Google Scholar
[36] Schack T, Coenen M, Haist M. Digital slump flow: Image-based assessment of fresh concrete homogeneity as part of the slump flow test. Case Stud Constr Mater. 2024;21:e03973.10.1016/j.cscm.2024.e03973Search in Google Scholar
[37] Dhaheer MSA, Al-Rubaye MM, Alyhya WS, Karihaloo BL, Kulasegaram S. Proportioning of self–compacting concrete mixes based on target plastic viscosity and compressive strength: Part I - mix design procedure. J Sustain Cem-Based Mater. 2015;5(4):199–216.10.1080/21650373.2015.1039625Search in Google Scholar
[38] Qasim OA. Specimen size and shape effects on the concrete properties, thermal conductivity and heat generation from hydration for different concrete types. J Comput Theor Nanosci. 2019;16(10):4072–91.10.1166/jctn.2019.8487Search in Google Scholar
[39] Berman JJ. Data simplification: taming information with open-source tools. USA: Morgan Kaufmann; 2016.Search in Google Scholar
[40] Neville AM. Properties of concrete. 5th edn. UK: Pearson; 2011.Search in Google Scholar
[41] Mehta P, Monteiro PJM. Concrete: Microstructure, properties, and materials. 4th edn. USA: McGraw-Hill Education; 2014.Search in Google Scholar
[42] Lin TY, Maire M, Belongie S, Hays J, Perona P, Ramanan D, et al. Microsoft coco: Common objects in context. In Computer Vision–ECCV 2014: 13th European Conference, Zurich, Switzerland. Springer International Publishing; 2014. p. 740–55.10.1007/978-3-319-10602-1_48Search in Google Scholar
© 2025 the author(s), published by De Gruyter
This work is licensed under the Creative Commons Attribution 4.0 International License.
Articles in the same Issue
- Research Articles
- Lie symmetry analysis of bio-nano-slip flow in a conical gap between a rotating disk and cone with Stefan blowing
- Mathematical modelling of MHD hybrid nanofluid flow in a convergent and divergent channel under variable thermal conductivity effect
- Advanced ANN computational procedure for thermal transport prediction in polymer-based ternary radiative Carreau nanofluid with extreme shear rates over bullet surface
- Effects of Ca(OH)2 on mechanical damage and energy evolution characteristics of limestone adsorbed with H2S
- Effect of plasticizer content on the rheological behavior of LTCC casting slurry under large amplitude oscillating shear
- Studying the role of fine materials characteristics on the packing density and rheological properties of blended cement pastes
- Deep learning-based image analysis for confirming segregation in fresh self-consolidating concrete
- MHD Casson nanofluid flow over a three-dimensional exponentially stretching surface with waste discharge concentration: A revised Buongiorno’s model
- Rheological behavior of fire-fighting foams during their application – a new experimental set-up and protocol for foam performance qualification
- Viscoelastic characterization of corn starch paste: (II) The first normal stress difference of a cross-linked waxy corn starch paste
- An innovative rheometric tool to study chemorheology
- Effect of polymer modification on bitumen rheology: A comparative study of bitumens obtained from different sources
- Rheological and irreversibility analysis of ternary nanofluid flow over an inclined radiative MHD cylinder with porous media and couple stress
- Rheological analysis of saliva samples in the context of phonation in ectodermal dysplasia
- Analytical study of the hybrid nanofluid for the porosity flowing through an accelerated plate: Laplace transform for the rheological behavior
- Brief Report
- Correlations for friction factor of Carreau fluids in a laminar tube flow
- Special Issue on the Rheological Properties of Low-carbon Cementitious Materials for Conventional and 3D Printing Applications
- Rheological and mechanical properties of self-compacting concrete with recycled coarse aggregate from the demolition of large panel system buildings
- Effect of the combined use of polyacrylamide and accelerators on the static yield stress evolution of cement paste and its mechanisms
- Special Issue on The rheological test, modeling and numerical simulation of rock material - Part II
- Revealing the interfacial dynamics of Escherichia coli growth and biofilm formation with integrated micro- and macro-scale approaches
- Construction of a model for predicting sensory attributes of cosmetic creams using instrumental parameters based on machine learning
- Effect of flaw inclination angle and crack arrest holes on mechanical behavior and failure mechanism of pre-cracked granite under uniaxial compression
- Special Issue on The rheology of emerging plant-based food systems
- Rheological properties of pea protein melts used for producing meat analogues
- Understanding the large deformation response of paste-like 3D food printing inks
- Seeing the unseen: Laser speckles as a tool for coagulation tracking
- Composition, structure, and interfacial rheological properties of walnut glutelin
- Microstructure and rheology of heated foams stabilized by faba bean isolate and their comparison to egg white foams
- Rheological analysis of swelling food soils for optimized cleaning in plant-based food production
- Multiscale monitoring of oleogels during thermal transition
- Influence of pea protein on alginate gelation behaviour: Implications for plant-based inks in 3D printing
- Observations from capillary and closed cavity rheometry on the apparent flow behavior of a soy protein isolate dough used in meat analogues
- Special Issue on Hydromechanical coupling and rheological mechanism of geomaterials
- Rheological behavior of geopolymer dope solution activated by alkaline activator at different temperature
- Special Issue on Rheology of Petroleum, Bitumen, and Building Materials
- Rheological investigation and optimization of crumb rubber-modified bitumen production conditions in the plant and laboratory