Understanding the large deformation response of paste-like 3D food printing inks
-
Yagmur Bugday
 ,
Alexandra Alicke
,
Alexandra Alicke

Abstract
Extrusion-based three-dimensional (3D) food printing is an emerging technique, relying crucially on the rheological behavior of the ink for success. This study aims to understand the rheological properties of the paste-like 3D food printing inks near the processing conditions. Experimental artifacts, particularly the edge fracture at high deformations, are a common challenge when working with pastes. While steady shearing is the most informative measurement, it is not practical due to experiential artifacts. We characterized the rheology of these inks with oscillatory measurements, described the deformation response with a constitutive model, and translated the information from oscillatory testing to steady shearing. The novel constitutive model is a generalization of the Oldroyd-B model using a shear-rate-dependent viscosity following Herschel Bulkley. The model parameters were estimated by non-linear least-squares fitting. The constitutive model successfully predicted the sample response at large deformations and the steady-shear flow response, such as those encountered in 3D food printing. The applicability of the methodology can be extended for different materials that are challenging to characterize. We explored methods to measure the rheological properties of paste-like materials prone to edge fracture, aiming for an accurate description of their response under processing.
1 Introduction
Interest in extrusion-based three-dimensional (3D) food printing, also known as direct ink writing, is rising due to its ability to create customized foods with desired nutrient levels, textures, and flavors that match the needs of specific customer groups, a concept known as personalized nutrition. It provides the opportunity to work with various materials to provide solutions for special needs, such as customized foods for dysphagia patients [1].
During extrusion-based printing with the application of different materials such as plastics, cement, food, and bio-based inks, the inks undergo a reversible solid-to-liquid transformation during the extrusion and deposition stages [2,3,4]. This can be achieved by phase transition or yield stress mechanisms [5]. Specifically, the ink must easily flow during extrusion, and after deposition, it must solidify to carry its own weight and weight of the upper layers to achieve shape fidelity [6]. Our work focuses on yield-stress inks, specifically highly filled pea-based pastes.
We assume that our paste-like yield stress materials consist of densely packed soft granules surrounded by a viscoelastic matrix, resulting an elastic-dominated nature until the yield stress is exceeded [7,8]. Above the yield stress, a solid-to-liquid transition is expected to occur, resulting in a rearrangement in the internal structure and energy dissipation. As a result, the material shows viscous characteristics. Yield stress materials typically show a decrease in viscosity with increasing shear rate, also known as shear thinning. Shear thinning property is recognized to be beneficial for extrusion by decreasing the driving force to push the material through the nozzle and maintain the flow [5,9,10]. Finally, post-printing microstructure recovery is based solely on rheological properties.
On the one hand, a successful print with yield stress inks requires satisfying the rheological constraints for extrusion and proper layer-by-layer deposition while maintaining a consistent formulation throughout the printing process [11]. On the other hand, the rheological constraints for printability are challenging to describe. In addition, the rheology of an unexplored formulation is often challenging to measure because of the possible experimental artifacts and the complex nature of the yield stress materials. As a result, successful printing with a target formulation often relies on trial and error, which usually takes a long development time. Recently, Venkatachalam et al. [8] revealed that macronutrient composition could be linked to printability by hydrating samples as a fraction of the average water-holding capacity (WHC) of dry matter. Moreover, with Bugday et al. [12], we have recently shown that inks with different macronutrient and water content, when hydrated according to the WHC, have a considerable degree of similarity in their rheological response. We observed that the water content modulates the yield stress and the linear elastic modulus, both recognized as essential parameters for printing [13]. At the same time, high-strain and shear rate responses are independent of the formulation for the formulations studied. These provide promising approaches for understanding the rheology, printability, and composition; however, the accurate rheological characterization and prediction of the ink characteristics prior to processing the ink still remain a challenge.
For extrusion-based printing purposes, the most relevant information is often the shear rate-dependent stress evolution to connect with the extrusion force [14]. However, carrying out steady shearing rheology is challenging due to different possible measurement artifacts such as shear banding, wall slip, and edge fracture for paste-like materials [6,15]. The wall slip and shear banding are considered to be easier to minimize by lowering the measurement gap and using higher friction geometries for our paste. However, edge fracture, i.e., cracking of the sample edge at high shearing rates, appears as a natural result of high deformation in steady shearing and is highly challenging to avoid [16]. The energy dissipation caused by the edge fracture can be misinterpreted as viscous flow only by observing the data. Hence, one must observe the sample deformation during testing. Researchers usually prefer capillary rheometry as a substitute, which comes with its hurdles, such as quantification of wall slip, effects of entry pressure, possible phase separation, and large granule size [17,18]. Another alternative is oscillatory rheology, which limits the total strain experienced by the sample, applies a cyclic deformation to the material, and promises an improvement to overcome edge fracture [19].
It is challenging to capture the rheology associated with steady-state flow behavior from transient oscillatory data [20]. Rogers et al. [21] suggest that non-linear oscillatory data can be interpreted as a sequence of physical processes, and it may be possible to extract information about steady shear flow conditions. On the one hand, the continuous change of the stress response brought about by medium- and large-amplitude oscillatory strain measurements makes it challenging to interpret the continuous shearing properties. On the other hand, control of total strain is a promising strategy for approaching such challenging samples that present extreme edge fracture.
Recently, van der Sman et al. [22] showed that with a generalized constitutive model, it is possible to capture the shear rate evolution of shear stress and strain dependency of the storage (G′) and loss (G″) modulus for different types of multicomponent printing inks. The constitutive model is a generalized upper-convected Oldroyd-B model, where the relaxation time is the additive combination of two factors. The first factor is the Maxwell relaxation time, and the second is the shear rate and strain amplitude-dependent relaxation time. In the latter term, the elastic modulus is defined as a function of the strain amplitude, and the relaxation time is a function of the shear rate. This makes the model capture both the strain and the shear rate-dependent characteristics. van der Sman et al. [22] focused on capturing trends in strain amplitude-dependent (first harmonics) G′ and G″ and predicting steady shear. There are various approaches in the literature to capture the solid-to-liquid transition, strain amplitude, and shear rate effects. For example, adapted relaxation time models [23] and models that include shear thinning or strain softening terms such as [24,25]. The current constitutive model is similar to these models, and the greatest advantage is that it combines shear and shear rate effects with yield stress. The constitutive model offers a decoupling of strain and rate softening, which is a good fit for our materials, as shown by Bugday et al. [12]. Also, the model has many special cases, such as the Oldroyd-B, White-Metzner, and Herschel–Bulkley models, explained further in a study by van der Sman et al. [22]. However, the single-mode Oldroyd-B model may limit the pure linear viscoelastic response at the smaller strains. This can also influence the response in the solid-to-liquid transition region [22], suggesting that investigating the model on oscillatory waveform data would improve the fitting accuracy. Our aim is to evaluate the robustness of the model and to pursue a fitting strategy on the waveform data, which is free of experimental artifacts such as edge fracture.
This article aims to characterize the rheology of paste-like 3D printing inks and investigate how the information from oscillatory experiments can be translated to steady shearing using the novel constitutive model [22]. The novelty of the work lies in the application of this technique to the challenging-to-characterize 3D food printing inks to further capture their constitutive response near the processing conditions and contribute to their utilization in a process model. We use multicomponent pea-based inks hydrated according to the WHC of the ingredients, similar to our previous study [12]. We perform linear and non-linear oscillatory tests and stress growth experiments. Our objective with rheological measurements is to interrogate the response of paste-like food inks at large deformations and high shear rates to connect it to 3D printing. Extra care is given to minimize the experimental artifacts, such as wall slip and edge fracture. To prevent edge fracture in oscillatory testing, we limit the strain amplitude. Stress growth testing is preferred over a continuous rate sweep by observing the edge fracture and the time-dependent evolution of the structure. We utilized linear and non-linear oscillatory data to estimate the constitutive model parameters. We develop a non-linear least-squares-based fitting strategy for fitting the transient oscillatory waveform data to estimate the parameters; we further analyze the fitted model parameters for the goodness and accuracy of the fitting. Finally, we compare the experimentally measured steady shear response and viscoelastic modulus with the predictions.
2 Theory
2.1 Problem description and solution
The state of microstructure was described by the two-dimensional (2D) Cauchy–Green tensor, denoted by
in terms of the elastic deformation gradient tensor
where
where
Consequently, the change in the conformation tensor is defined as
For oscillatory flow,
where
For steady shear flow,
2.2 The constitutive model
The model is a generalized Oldroyd-B model with a modified relaxation time term. The relaxation time term has two elements: a Maxwell element (
The Maxwell element that is indicated as the first term on the right-hand side of equation (11) provides a relaxation time. The second component, with G eff and η eff, is the effective modulus and effective viscosity and is defined as
and they contribute to the shear rate and strain responses to capture the strain softening and the shear thinning responses. Equation (13) describes the shear rate dependency of viscosity as a Herschel–Bulkley relation, where
3 Materials and methods
3.1 Materials
The food inks described in this study were prepared using ingredients fractionated from peas, namely pregelatinized (PG) starch (Nastar Precooked Pea Starch), raw starch (Nastar Native Pea Starch), native (partially denatured) protein (Pisane M9 Pea Protein), and insoluble fiber (Swelite C Pea Fiber), which Cosucra Groupe Warcoing SA in Belgium kindly provided.
We hydrated the dry ingredients with pure water.
3.2 Methods
3.2.1 Hydration strategy and raw material characterization
Hydration was performed based on the WHC of the dry ingredients. The approach has been introduced by Venkatachalam et al. [8], suggesting that similar rheology can be obtained if the samples are hydrated according to their WHC.
The materials were tested for moisture content (MC) and WHC. The measurement of the MC was based on a weighing method before and after complete drying. Furthermore, the WHC of pure ingredients was measured based on analyzing the residual water on the soaked samples. Following soaking, the sample was centrifuged, and the residual moisture was analyzed by weighing it before and after complete drying. We refer to Venkatachalam et al. [8] for a complete description of the methods. The measured reference values for this study are provided in Table 1.
Reference values for the MC and the WHC of the ingredients
| Substance | Moisture content | WHC |
|---|---|---|
| g water/g dry solids | g water/g dry solids | |
| PG pea starch | 0.29 | 5.78 |
| Raw pea starch | 0.09 | 1.02 |
| Pea protein | 0.33 | 6.56 |
| Pea fibre | 0.17 | 11.15 |
3.2.2 Sample preparation
Pea fractions were combined based on dry ratios to obtain printing inks with the details in Table 2. The dry fraction was hydrated based on the predetermined fraction of the WHC of the mixture, as calculated based on
where
Weight ratio of the nutrients on a dry basis
| Sample | Raw starch | Fiber | Protein |
|---|---|---|---|
| Protein rich | 1 | 1 | 3 |
| Fibre rich | 1 | 3 | 1 |
The dry ingredients were weighed and mixed in a beaker with a spoon to create a homogeneous mixture. Then, the powder mixture was introduced into the water at room temperature. The mixture was homogenized by a conventional mixer (Tristar Kitchen Mixer, UK) with a flat mixing hook for 5 min. The samples were then transferred to plastic jars and sealed with Parafilm to prevent evaporation. They were tested on the same day. All samples contained PG starch in a 1:10 ratio of PG starch: total dry mass.
The batch size was 150 g for each sample preparation.
3.2.3 Rheological measurements
Rheological measurements were performed using an Anton Paar MCR 501 rheometer (Anton Paar GmbH, Austria) at 25°C. A circulating water bath and Peltier heating system ensured temperature stability. Measurements were performed using a 50 mm diameter stainless steel plate-plate measurement system with a cross-hatched profile surface (PP50/P2). This design is selected to reduce the apparent wall slip between the material and the plate. The cross-hatched plates offered a more effective solution to prevent slippage than sandpaper-coated or sandblasted surfaces for our large granular pastes.
At the beginning of each experiment, 5 g of sample was placed on the bottom plate of the rheometer, and the gap height was adjusted to 1 mm for measurement. The measurement gap has been reached with a downward speed of 1 mm/s to 5 mm, 500 µm/s to 2 mm, and 100 µm/s to 1 mm.
The normal force was limited to 40 N during the sample loading to avoid damaging the rheometer force sensor. The excess material was scraped out. Before the tests, the material was allowed to rest for 2 min without any deformation applied to relax and release the residual stress of loading. The duration of 2 min was established by tracking the normal stress until it reached equilibrium.
All rheological measurements were replicated for two batches of the same preparation to cover batch-to-batch variations and ensure repeatability. The error bars on any rheology data represent the standard deviation between replicates. The average values are used for the fitting.
3.2.4 Strain amplitude sweep
A strain amplitude sweep is performed to interrogate the behavior of G′ and G″ as a function of strain amplitude to detect the limits of the linear viscoelastic region. After loading on the rheometer plate, strain amplitudes of 0.1 to 1,000% were applied at a constant frequency of 1 Hz. 5 data points were collected per decade. The G′ and G″ were recorded after five cycles for each strain amplitude. The sample was visually inspected during the testing to detect the edge fracture. Preliminary testing at various gap heights ensures the absence of wall slip.
Accordingly, a measurable region with no experimental artifacts and, more specifically, no edge fracture was detected. Within that region, seven strain amplitudes are selected to be further tested individually to represent the partial energy dissipation-dominated regions, further discussed in Section 4.1.
3.2.5 Frequency sweep
A frequency sweep is performed to examine the sample response under small deformations. G′ and G″ were expressed as a function of the frequency at a strain amplitude of 0.1% for protein-rich and 0.05% for fiber-rich inks and frequencies from 0.1 to 100 Hz. Five data points were collected per decade.
G′ and G″ were recorded after five cycles for each frequency.
3.2.6 Stress growth experiments
A continuous shear rate sweep was not possible to perform without having an edge fracture due to accumulating deformation in a sweep. Accordingly, we decided to perform individual start-up tests to discover the limits for the edge fracture.
Stress growth experiments were conducted to observe the steady shearing behavior of the inks and build a flow curve. Individual start-up tests were held at various constant shear rates [0.063, 0.1, 0.17, 0.28, 0.45, 0.73, 1.2, 1.96, 3.21, 5.25, 8.58, 14, 23, 37, 61 s−1]; the transient shear stress data were recorded until the strain reached around 103. A fresh sample was loaded for each shear rate. The sample was closely watched during testing to spot where the edge fracture started to dominate the measurements.
We further evaluated whether the individual tests can provide insights into the steady shearing properties and can provide comparable outputs with the steady shear translation of the oscillatory data.
3.2.7 Non-linear oscillatory measurements
Non-linear oscillatory measurements were conducted at seven amplitudes 5, 10, 15, 30, 50, 100, and 120% strain, and three different frequencies 2, 4, and 8 Hz. A new sample is loaded onto the rheometer for every combination of amplitude and frequency. Each test consisted of 20 cycles, with the complete waveform data collected once every four cycles. A full wave consisted of 256 data points.
3.2.8 Building flow curves
The flow curves were constructed using two methods: (1) from the non-linear oscillatory data and (2) from the stress growth data. The stress growth-built flow curves were constructed using the stress values at the strain closest to the strain 120%, obtained at each shear rate since 120% was the observed limit for the edge fracture. Ideally, a steady state should be achieved at sufficiently long times. However, this was preceded by the edge fracture, making it impossible to reach a steady state.
The non-linear oscillatory data flow curve was constructed based on the understanding and the approach described in Rogers et al. [21]. They claim that non-linear oscillatory testing can be seen as sequences of physical processes, and it is possible to link the non-linear oscillatory data to the steady shear flow curves. First, the non-linear oscillatory data from the three highest amplitudes (120, 100, 50%) at each frequency (2, 4, 8 Hz) was expressed in shear-rate versus shear-stress Lissajous plots. Second, the positive portion of the shear rate and stress were extracted for analysis. The shear rate at the maximum shear stress was detected and called
3.2.9 Large deformation correction for plate–plate geometries
The cross-hatched parallel plate geometry provided a solution for the wall slip. However, it is known that the shear rate and strain are known to be not uniform throughout the plate radius [29]. We analyzed the extent of variation by the method suggested by De Souza Mendes et al. [30] for oscillatory tests.
Accordingly, the corrected shear stress values were calculated using the non-linear oscillatory datasets at each frequency, according to equation (18) in De Souza Mendes et al. [30]. The slope of the log–log plot of shear rate amplitude versus torque amplitude is calculated. This slope is then used to obtain corrected stress values. The correction was observed to cause approximately a maximum of 10% deviation in the measured shear stress amplitudes and no change in the non-linear oscillatory curve shapes, as shown in supplementary materials Figure S1 for 120% amplitude at 8 Hz for protein-rich ink, which has the highest strain and the frequency, hence the highest shear rate obtained in the experiments. Accordingly, we considered this not to cause any inconsistency in the model fitting and evaluation. Thus, we continued with the rheometer provided data.
3.2.10 Fitting protocol
We perform non-linear regression where an arbitrary non-linear model
where
where
The
The normalization can be explained as follows. Some parameters possibly differ in a range covering multiple orders of magnitudes in their absolute form. In that case, during the minimization process, the whole parameter space cannot be covered by using a constant step size for all parameters. We used a constant step size and modified the parameter values to fall between 0 and 1. Accordingly, the first step was to analyze the expected lower and upper boundaries for each parameter; if there is at least an order of magnitude expected, then the logarithm of the boundaries was taken to move smoothly between two ends of the parameter range. Furthermore, we applied a max–min normalization to obtain the unitless parameters. The values of p l and p u used in this study are given in Table 3.
Upper and lower predicted boundary values for the parameters
| Condition | G 0(ω) | τ M(ω) | σ 0 | n | γ˙cr | α | I 1c |
|---|---|---|---|---|---|---|---|
| Lower boundary | 102 | 10−2 | 102 | 10−1 | 10−2 | 10−1 | 10−4 |
| Upper boundary | 106 | 102 | 104 | 8 × 10⁻¹ | 103 | 8 × 10⁻¹ | 103 |
Nelder–Mead minimization algorithm from the Python minimize function is used to find the minimum of the non-linear least squares estimator for the normalized parameter set θ∗. The reason for choosing Nelder–Mead was that it is a non-gradient-based algorithm, in which the gradient-based algorithms utilizing finite differences for derivative approximation can result in poor error estimates [31]. The step size for the minimization was 10−4 for the normalized parameters. We used an objective function value-based tolerance, where the tolerance was prescribed as 10−4, to terminate the minimization. These are the default options for the Nelder–Mead algorithm; hence, we started from there and did not need to change the settings [32].
Figure 1 describes the minimization function protocols. We first fitted the linear viscoelastic region, then the non-linear region; hence, we performed sequential fitting. The protocol is shown in Figure 1a for the linear region. The frequency sweep data is fitted to a single relaxation time Oldroyd-B model (see equation (2)) since the constitutive model reduces to an Oldroyd-B model at low shear rates and small deformations. The fitting was performed separately for each frequency on the waveform data. The model parameters

Summary of the fitting procedure for linear (a) and non-linear region data fitting, (b1) where all parameters fitted together, (b2) sequential fitting.
Following the fitting of the linear region parameters as shown in Figure 1a, the frequency dependency of
where
For the estimation of the non-linear parameters, non-linear viscoelastic data at 5, 10, 15, 30, 50, 100, 120% and frequencies 2, 4, and 8 Hz is fitted to the full constitutive model introduced in Section 2.2 by keeping the
The goodness of the non-linear least squares fitting is evaluated by the mean square error (MSE), equation (16) normalized by the number of data points. All the outcomes were assessed by comparing the predicted and measured non-linear oscillatory data, steady shear data, and the linear viscoelastic moduli
The potential spread in all the non-linear least squared fitted model parameters was evaluated by the F-test method described in Vugrin et al. [31] within 95%. Furthermore, the spread of the Herschel–Bulkley and power-law model fittings was assessed using the square root of the diagonal elements of the covariance matrix. The covariance matrix is not preferred in the case of non-linear fitting due to the non-gradient-based fitting algorithm (Nelder–Mead) used in fitting. In that case, the covariance matrix needs to be computed by an extra step, including differentiation of the objective function with respect to the parameter minima, which is referred to as a calculation that is potentially problematic [31].
4 Results and discussion
4.1 Inspection of the frequency and strain amplitude sweeps
The strain amplitude sweep and frequency sweep response of both the protein and fiber-rich inks are provided in Figure 2. From Figure 2a, it is clear that the ink shows strain softening characteristics with increasing strain amplitude at a constant frequency [35]. Furthermore, Figure 2a and b show that inks under lower deformations behave viscoelastic, with

(a) Strain amplitude sweeps at 2 Hz and (b) frequency sweep at 0.1% strain for protein-rich and 0.05% for fiber-rich.
Winter [34] states that the relaxation time for materials above the gelling point becomes very large, and the network structure near the gelling point is very fragile; hence, it can break down by large deformations, leading to energy dissipation. However, handling large deformations for some materials, hence maintaining a steady shear flow, can be challenging due to the edge fracture. Edge fracture is observed in various materials, such as colloidal suspensions, non-colloidal systems, and viscoelastic fluids [36,37,38]. It is defined as the destabilization of the air–fluid interface. It is claimed to be related to elasticity, specifically the critical magnitude of the second normal stress difference [39]. Thus, the formation of an edge fracture must be closely watched. Since our inks are granular pastes showing highly elastic responses, the strain amplitude and frequency sweeps were visually inspected for edge fracture while performing the experiments. The gray region in Figure 2a indicates the initiation of the edge fracture, detected by visual inspection, which is around 120% strain amplitude for both of our inks. To further clarify our observation, we provide videos in the supporting material Video 3, where we compare the oscillatory and steady shear tests.
Considering the edge fracture, we have selected the amplitudes shown by the dashed vertical lines in Figure 2a to be further tested beyond the linear viscoelastic regime (LVE) and used in the model fit part. It can be seen in Figure 2a that
4.2 Inspection of non-linear oscillatory data and stress growth
We provide non-linear oscillatory data for protein-rich inks in Figure 3. As indicated in the subfigures, the Lissajous curves show the stress-strain relation at three different non-linear amplitudes and frequencies. Note that the curves are normalized by the maximum stress on the y-axis and maximum strain on the x-axis.

Non-linear oscillatory data at 10, 50, and 120% and 2, 4, and 8 Hz, expressed in strain–stress Lissajous plots.
The curves in Figure 3 form ellipses in the low strain amplitudes in the LVE regime and are known to be a characteristic shape of an elastic response. With increased strain amplitude, the Lissajous curves undergo a transition from the ellipse to a distorted shape, indicating the contribution of higher harmonics in the stress response and an increase in viscous behavior [35,40]. Furthermore, with strain, the decreasing slope of the stress–strain curve at zero strain indicates strain softening, as we also observed in Figure 2 [40].
Another important observation from Figure 3 is the effect of changing frequency at the same strain amplitude. The curve shape appears independent of the frequency, but the absolute values depend on the frequency. This becomes important in fitting the non-linear parameters of equations (12) and (13). Accordingly, we expect the non-linear model parameters that determine the curve shape (
In Figure 4, we provide the outcomes of the stress growth testing. The data points in Figure 4a and b demonstrate the experimental measurements. While Figure 4a presents the stress values associated with a given shear rate, in Figure 4b, the focus is on the evolution of the curve shape.

Stress growth data of the protein-rich samples (a) the data in the actual scale and (b) comparison with the unity line.
The shear stress increases with strain at a specific shear rate, reaches a peak, and then decreases. The unity line in Figure 4b is placed to indicate decay in stress. Importantly, no plateau has been reached in the shear stress. A short plateau is observed before the decay at 0.1 s−1, as seen in Figure 4b. Consequently, obtaining reliable steady-state data is hardly possible at 0.1 s−1 and not feasible above 0.1 s−1. Our observations suggest that edge fracture is the primary reason for the continuous decrease in shear stress, and this represents the challenge in steady-shear measurements explained earlier in Section 4.1. However, it has been observed that until 120% strain, the edge fracture is not prominent, meaning that the data until this region are still free of experimental artifacts and can possibly provide an accurate description. We provide experimental evidence in Figure S9 on the difference between a stress growth constructed and a continuous flow curve, the flow curve constructed by decreasing the logarithmic time from 100 to 20 s from the lowest to the highest shear rate. With this motivation, we constructed flow curves using shear stress data before the edge fracturing region. The extracted data points and the Herschel–Bulkley model fitting are shown in pink circles and the continuous line in Figure 5 with the model parameters. A Herschel–Bulkley model can describe the flow curve constructed by the stress growth data and displays a yield stress material response [41]. However, 120% strain, where the data are extracted, is shortly after the peak in shear stress, so it is possible that it does not reflect a steady-state response.

Non-linear oscillatory testing extracted flow curves for protein-rich (opaque markers) and fiber-rich (transparent markers) and Herschel–Bulkley fittings. Stress growth data at 120% and its Herschel–Bulkley model fitting.
We evaluated the stress growth flow curves in comparison with the flow curves constructed by the non-linear oscillatory data. The flow curve building methodology from non-linear oscillatory data is described in Section 3.2.8. Flow curves extracted from non-linear oscillatory data are provided in Figure 5, shown with colorful markers, which are also expressed with the Herschel–Bulkley fitting parameters. The different shapes of the markers represent the data from different frequencies, the different colors represent the different amplitudes, and the transparent markers show the fiber-rich samples. Compared with the stress growth flow curves obtained in the same formulation, the non-linear oscillatory flow curves extracted for the protein-rich inks appear to be lower in shear stress in the shear thinning region. The reflection of the difference on the parameters of the Herschel–Bulkley model appears to be on
We believe that the deformation experienced during the measurements is the main reason behind the difference between non-linear oscillatory and stress-growth extracted flow curves. Considering our approach to building the stress growth flow curve, i.e., taking the stress values near the stress maxima (∼120%) before the edge fracture occurs, we measure the material’s initial response to a given deformation condition [42]. Hence, we start from an undisturbed structure, deform the material under steady shear, and a continuous increase in the strain eventually damages the sample catastrophically, leading to edge fracture and resulting in a constant decay of the shear stress, as shown in Figure 4. However, in the case of non-linear oscillatory measurements, deformation is cyclically provided by oscillating around a strain amplitude, and we record the sample response after the material exhibits a steady state response. The non-linear oscillatory data displayed are recorded after 20 cycles. The higher values obtained in the case of stress growth flow curves appear to be significant, indicating the initial structural deformation response [41]. It can also be inferred that the effects of possible time-dependent structural evolution, also known as thixotropy, can play a role [43]. To support our observation, we provided the non-linear oscillatory Lissajous plots at 2 Hz, after each 4th cycle, provided in Figure 6. It can be seen that the maximum value of the stress decreases with each cycle, and they start to collapse on top of each other after the 16th cycle. Hence, we observe a time-dependent adaptation of the stress response to achieve a steady regime, which is why the last cycle is needed for further analysis and data fitting.

Positive stress values of the strain–stress Lissajous plots obtained in non-linear oscillatory testing at 2 Hz for protein-rich inks for different cycles in a measurement.
On the one hand, there is a difference between the flow curves obtained by the two methods, namely the stress growth and the non-linear oscillatory flow curves, and it is highly possible that this arises from the time-dependent evolution. On the other hand, the yield stress plateau and the shear thinning exponent can be predicted from both methods. All in all, we consider non-linear oscillatory-predicted flow curves to provide a more comparable situation with the extrusion conditions since the sample has already been exposed to various flow types until reaching the nozzle due to contraction.
4.3 Model fitting of the experimental data
4.3.1 Linear region fitting
To describe the linear region behavior, waveform data from each frequency are individually fitted to the single-mode Oldroyd-B model. Hence,

(a) Experimental and predicted waveform data of the linear viscoelastic region for the protein-rich sample, (b) relaxation time with changing frequency, and (c) linear elastic modulus with changing frequency. (b) and (c) involves the logarithmic slopes.
The fitted parameters, standard error percentages, and the associated MSE values are presented in Table 4. The visual inspection from Figure 7a and the MSE values being close to zero suggest that the model parameters describe the data well and the fitting is successful. Considering the percentage errors in the parameters, we see that the potential spread in the parameter values at a 95% confidence interval does not exceed 2% of their values. This indicates that the minimum obtained by the objective function appears to be precise.
Frequency-dependent Oldroyd-B model parameters fitted by the small amplitude oscillatory data
| ω (Hz) | G 0(ω) (Pa) | τ M(ω) (s) | MSE × 104 (−) |
|---|---|---|---|
| 0.10 | 10818.83 ± 18.35 | 6.21 ± 0.04 | 0.05 |
| 0.16 | 11646.58 ± 5.82 | 4.29 ± 0.01 | 0.01 |
| 0.25 | 12428.74 ± 31.00 | 2.84 ± 0.03 | 0.13 |
| 0.40 | 13215.30 ± 9.24 | 1.84 ± 0.01 | 0.01 |
| 0.63 | 13994.62 ± 185.59 | 1.04 ± 0.05 | 3.66 |
| 1.00 | 14796.26 ± 98.86 | 0.75 ± 0.02 | 0.85 |
| 1.58 | 15683.04 ± 229.87 | 0.40 ± 0.02 | 4.51 |
| 2.51 | 16612.77 ± 71.25 | 0.29 ± 0.01 | 0.37 |
| 3.98 | 17583.63 ± 15.80 | 0.19 ± 0.00 | 0.02 |
| 6.31 | 18642.44 ± 343.88 | 0.09 ± 0.01 | 7.10 |
| 10.00 | 19607.50 ± 138.82 | 0.08 ± 0.00 | 0.96 |
We understand from Figure 7b and c that
In the literature, the parameters of the Oldroyd-B model are commonly obtained by fitting the viscoelastic moduli of the entire frequency region since it covers information from multiple time scales and contains information about the relaxation response [44]. However, our materials show critical gel response, as shown in Figure 2, which appears dominantly elastic under small deformations and mildly dependent on the frequency. For this reason, our inks are expected to have a distribution of relaxation times different from an ideal single-mode Oldroyd-B material [28]. One strategy for accurately describing the rheological response of our inks is to use a multi-mode Oldroyd-B model. However, it comes with an enormous increase in the number of the model parameters since every extra relaxation mode would come with five associated non-linear parameters. Hence, it increases the complexity of the fitting and the potential for errors in fitting [45]. Furthermore, we have already shown with the non-linear oscillatory data (in Figure 3) that the shape of the Lissajous curves in non-linear regions is not dependent on the frequency; there is no need to have multiple nodes while describing the non-linear region. Thus, we chose a single-mode Oldroyd-B model to express the linear region behavior and fit the parameters per frequency. In this way, the fitting procedure is facilitated compared to a multi-mode model fitting with fewer parameters.
In summary, we expect that the single-mode Oldroyd-B model, fitted at each frequency, will provide a sufficient description in the linear region without increasing the number of model parameters. The model will be fitted assuming
4.3.2 Non-linear region fitting
We estimate the parameters of the non-linear model by fitting the data of the non-linear oscillatory waveforms to the proposed constitutive model (see Section 2.2).
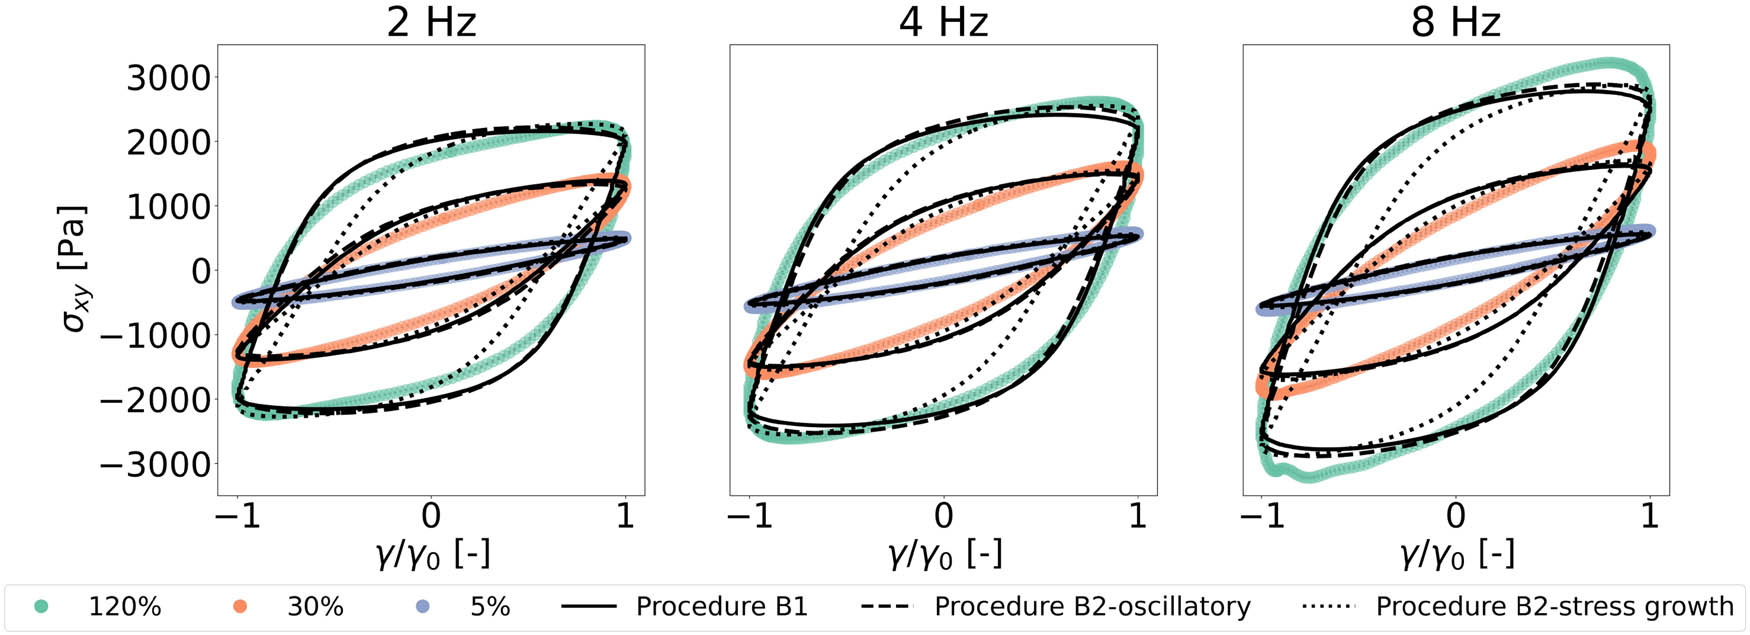
Experimental and predicted waveform data using the full constitutive model and the estimated linear and non-linear parameters, protein-rich samples at 2, 4, and 8 Hz.
We observe from Figure 8 that the model predictions, when visually evaluated, provide a good description of the non-linear oscillatory data. Maxima and minima are accurately represented, with well-captured curve shapes for B2-oscillatory and B1. Figure 8 shows that the B2-oscillatory procedure provides results similar to B1 for fitting non-linear oscillatory data. However, procedure B2-stress growth did not result in a similar prediction with others, providing a poorer description between the negative and positive stress maxima indicated by a higher MSE value, as shown in Figure 9f. The difference between procedure B2-oscillatory and B2-stress-growth seems to stem from the additional physical phenomena introduced by the time-dependent structural evolution observed in the stress growth testing, as previously detailed in Section 4.2.

Non-linear parameter values obtained at different fitting conditions indicated by the plot title (a)–(e), MSE values (f).
The first question we asked was whether the non-linear parameters (
The second investigation was whether we could externally predict the viscosity evolution, i.e., Herschel Bulkley model parameters (from equation (13)), and prescribe into the fitting. We compared the results of fitting procedures B1 and B2, described in Figure 1. In procedure B2, the Herschel Bulkley parameters (
Evaluation of the error values in Figure 9f shows that all fitting procedures provided parameters with less than 16% for protein-rich inks within the 95% confidence interval. This indicates that the minimization algorithm appears to be performing well in finding the minima of the objective function.
4.4 Predicting the steady and oscillatory flow
Finally, we use the estimated parameters from the fitting in the previous section to predict the steady shear response of the flow curves, which is the main goal of the analysis. The predicted flow curve was compared with those generated by oscillatory and stress growth tests, given in Section 4.2. We also provided the G′ and G″ calculated by the estimated parameters to confirm the model parameters and evaluate the amplitude dependency of the model. The results are reported in Figure 10 for protein-rich inks at 2 and 8 Hz frequencies. The results from fiber-rich inks are provided in Figure S7.

(a) Flow curves from non-linear oscillatory data, stress growth, and the model predictions and (b) predicted and measured strain amplitude sweeps, protein-rich samples.
We first focus on the flow-curve predictions and highlight the general trends. Figure 10a shows the measurable shear rate limit without edge fracture with a vertical line at 0.1 s−1. Above that, a steady-state shear stress cannot be obtained for a given shear rate, as discussed in Section 4.2.
The model predictions show that B1 and B2, at different frequencies, resulted in trends similar to the shear rates observed for all cases. The stress in a lower shear rate region displays an Oldroyd-B fluid with constant viscosity. Following the shear rate, Oldroyd-B model response undergoes a transition as the adapted relaxation term dominates. With increasing shear rate, the predicted stress values change near the yield stress (
It can be observed that neither fitting case shows a clear and extensive yield stress plateau reaching a constant stress value at lower shear rates, as an ideal Herschel–Bulkley fluid would show. That is due to the nature of the model, which has been designed to describe the lower deformation region as a viscoelastic fluid, a single-mode Oldroyd-B, and not an elastic solid. Hence, shear stress still appears as a function of the shear rate at low shear rates for times longer than the relaxation time. To clarify that our inks are yield-stress materials, we performed creep testing for the protein-rich samples and provided the results in Figure S8. It can be observed from Figure S8A that when
On the one hand, the lack of a clear plateau in the full constitutive model can pose a difference compared to the pure Herschel–Bulkley model response (from fitting procedure B2). On the other hand, when compared with the data points extracted from the non-linear oscillatory testing, the constitutive model collapses on the data points. This can be explained as follows. Ideally, for materials showing a critical gel response (
In that case, the model allowed us to use the experimentally available data for constitutive modeling, where most of the data is in the region elastic and viscous phenomenon is observed together. We consider this to be an important contribution.
One can argue that the Herschel–Bulkley model can represent a sufficient description of the flow properties when used alone. However, it lacks viscoelasticity, a clear phenomenon when considering the linear region response. Furthermore, considering the challenges in measuring the steady shear response, using the constitutive model by van der Sman et al. [22] provides the opportunity to have a more comprehensive understanding of the material response. The model can potentially capture the yield stress recovery and the post-deposition phenomenon in printing, such as stress relaxation, filament deformation under gravity, and the layers above.
We want to highlight the effects of having frequency-dependent linear regime parameters; we can observe the impact by comparing dashed and solid lines of the same color in Figure 10. At low shear rates, they show a difference in the shear stress. With increasing shear rate, the shear stress behavior from two different frequencies starts to come closer to each other, eventually collapsing at higher shear rates. This shows that the Herschel–Bulkley response entirely dominates the response at high shear rates (
Differences in the fitting protocols were discussed next. The stepwise fitting introduces several advantages. First, it reduces the number of parameters that need to be optimized and facilitates the fitting of non-linear oscillatory data. Second, it helps reduce the risk of error that can possibly occur from colinearity in the parameters. This can affect the resulting minima of the parameters [48]. Thus, the stepwise fitting is promising in improving the fitting of the parameters.
The experimental data in the higher shear rate region is limited to ∼60 1/s, which is the maximum shear rate reached by the non-linear oscillatory data before the edge fracture. The model must predict the response at higher shear rates above that limit, governed by the parameters
From Figure 9b and d, the estimated parameters
We want to evaluate further the change caused by the prescription of the Herschel–Bulkley parameters. On the one hand, the predicted Lissajous curves from Figure 8, procedure B1 and B2-oscillatory predictions seem similar. Furthermore, their flow curve prediction appears comparable, as shown in Figure 10. Accordingly, we understand that prescribing the Herschel–Bulkley parameters helps overcome the effects of colinearity by introducing physically meaningful parameters and getting a more realistic and accurate minimum indicated by the MSE values. On the other hand, the prescription of the stress growth Herschel–Bulkley parameters, described in the procedure B2-stress growth, did not improve the fitting. This can be explained by the difference in the physical phenomenon captured by the stress growth and the oscillatory experiments. The shear stress values were higher in the case of stress growth flow curves than in the case of non-linear oscillatory flow curves. Figure S6 shows the maximum values of the predicted and the measured transient stress values reached after the relaxation. Hence, it can result in misleading outputs when the stress-growth estimated flow parameters are used to improve the high shear rate region fitting. It can be observed from Figure 9 that the MSE values were highest in the B2-stress growth fitting.
Overall, the external fitting of the Herschel–Bulkley parameters can provide improvement. However, it is critical to know that the flow curves and the oscillatory data capture the same phenomenon.
Lastly, the
The proposed model is robust enough to capture the waveform expression of non-linear oscillatory strain response at various frequencies and translate it to the steady shearing response. With the model, we could describe the high deformation response of our challenging yield stress material with limited data that can be measured without any edge fracture. However, there is still room for improvement. First, the predicted flow curves hardly display any clear yield stress plateau, and the solid-to-liquid transition response is not very well captured. In that case, the single-mode Oldroyd-B model choice in the linear region can be altered to a multi-mode description to better interpret the linear region and obtain a more accurate representation to capture the transition from the linear to non-linear response in the case of steady shear and oscillatory flow. Secondly, we observed that the material shows more complicated rheological phenomena besides the steady-state response, such as time-dependent structural evolution (see Section 4.2). The effects of flow-induced time-dependent structural adaptation and the subsequent recovery, also known as the thixotropy, hold critical importance both in measuring and modeling the material properties. New and additional rheological experimental protocols are needed to fully analyze the time response of the structure and decouple it from shear rate or strain amplitude-dependent effects [49]. Also, the model cannot capture the time-dependent curves in the current form; however, it is encouraging that it is possible to implement the time-dependent structural breakdown and build-up into the model for a more precise material description. For example, a mechanistic approach to model inelastic time-dependent structural changes incorporates a structure parameter that indicates the degree of structure in the material and modifies the viscosity term [50]. With such a modification, the model is promising for capturing all the extrusion (solid-to-fluid traditions) and deposition (fluid-to-solid transition) phenomena and achieving performance material descriptions under processing conditions. Within the scope of this work, we focused on the development and evolution of shear stresses, and it is also important to discuss the formation of the normal forces during the shear flow since it can affect the processing and the product properties, e.g., leading to die swell. In the extrusion of viscoelastic polymers and gels, die swell is often considered to be significant [51,52]. In the extrusion of pastes such as cement or food, the normal forces were expected due to the interaction of the granular particles; however, die swell is not commonly reported [53]. This requires further research and understanding to clarify the importance of the normal forces in 3D food printing pastes. It is promising that the current model can capture the formation of normal forces due to the presence of upper convected derivative terms, and it can be further modified to capture different normal stress responses, but it is important to have an accurate dataset on the normal force.
5 Conclusion
With our study, we developed a fitting strategy for parameter estimation using the non-linear oscillatory data with a complex 3D food printing ink. We challenged the measurable limits of paste-like food inks and presented a way to understand the non-linear deformation response of our inks, using the novel constitutive model developed for soft, edible, glassy materials for 3D food printing applications by [54]. Considering the aim of our research, we captured an approach to describe the flow behavior of highly filled pastes showing a solid-to-liquid transition in flow by using the constitutive model. Edge fracture could be prevented by controlling the total strain applied in the testing, and it was possible to extract steady shear information from the oscillatory data. Accordingly, we conclude that it is possible to predict processing-related, i.e., large deformation, response from non-linear waveform data using this constitutive model. We believe our methodology will broaden process modeling applications and improve the accuracy of predicted parameters, not only in food printing but also for other complex materials that are difficult to measure and model.
Acknowledgments
We acknowledge financial support from Wageningen Food & Biobased Research, TNO, Ruitenberg Ingredients BV, LambWeston Holdings, Inc., and Gastronology 3D Food Works. Special thanks to Nick Jaensson for the lively discussion on non-linear least-squares fitting. Further, we would like to acknowledge the Processing and Performance group members in TU Eindhoven for the great feedback on the progress.
-
Funding information: This research was funded by the Dutch Research Council (NWO) under grant number 18763.
-
Author contributions: Yagmur Bugday – conceptualization, methodology, investigation, formal analysis, writing of the original draft. Alexandra Alicke – conceptualization, supervision, reviewing, and editing. Patrick Anderson – conceptualization, supervision, funding acquisition, reviewing, and editing. Ruud van der Sman – conceptualization, supervision, funding acquisition, reviewing, and editing.
-
Conflict of interest: Authors declare no conflict of interest.
-
Ethical approval: The conducted research is not related to either human or animal use.
-
Data availability statement: Data will be available upon request.
References
[1] Wei Y, Guo Y, Li R, Ma A, Zhang H. Rheological characterization of polysaccharide thickeners oriented for dysphagia management: Carboxymethylated curdlan, konjac glucomannan and their mixtures compared to xanthan gum. Food Hydrocoll. 2021;110:106198. 10.1016/j.foodhyd.2020.106198.Search in Google Scholar
[2] Acierno D, Patti A. Fused deposition modelling (FDM) of thermoplastic-based filaments: process and rheological properties—an overview. Materials. 2023;16(24):7664. 10.3390/ma16247664.Search in Google Scholar PubMed PubMed Central
[3] Corker A, Ng HC, Poole RJ, Garcia-Tunon E. 3D printing with 2D colloids: Designing rheology protocols to predict’printability’ of soft-materials. Soft Matter. 2019;15:1444–56. 10.1039/c8sm01936c.Search in Google Scholar PubMed
[4] Hossain SS, Lu K. Recent progress of alumina ceramics by direct ink writing: Ink design, printing and post-processing. Ceram Int. 2023;49(7):10199–212. 10. 1016/j.ceramint.2023.01.143.Search in Google Scholar
[5] Liu Y, Hildner M, Roy O, Van den Bogert WA, Lorenz J, Desroches M, et al. On the selection of rheological tests for the prediction of 3D printability. J Rheol. 2023;67:791. 10.1122/8.0000612.Search in Google Scholar
[6] Griebler JJ, Tappan AS, Rogers SA, Kopatz JW, Grillet AM. Methodology to determine printability criteria of highly concentrated pastes through rheological characterization. Addit Manuf. 2024;96:104578. 10.1016/j. addma.2024.104578.Search in Google Scholar
[7] Nelson AZ, Schweizer KS, Rauzan BM, Nuzzo RG, Vermant J, Ewoldt RH. Designing and transforming yield-stress fluids. Curr Opin Solid State Mater Sci. 2019;23(5):100758. 10.1016/j.cossms.2019.06.002.Search in Google Scholar
[8] Venkatachalam A, Balasubramaniam A, Wilms PF, Zhang L, Schutyser MA. Impact of varying macronutrient composition on the printability of pea-based inks in extrusion-based 3D food printing. Food Hydrocoll. 2023;142:108760. 10.1016/j.foodhyd.2023.108760.Search in Google Scholar
[9] Herrada-Manch’on H, Fern’andez MA, Aguilar E. Essential guide to hydrogel rheology in extrusion 3D printing: how to measure it and why it matters? Gels. 2023;9(7):517. 10.3390/gels9070517.Search in Google Scholar PubMed PubMed Central
[10] Tian H, Wu J, Hu Y, Chen X, Cai X, Wen Y, et al. Recent advances on enhancing 3D printing quality of protein-based inks: A review. Compr Rev Food Sci Food Saf. 2024;23:e13349. 10.1111/1541-4337.13349.Search in Google Scholar PubMed
[11] Maldonado-Rosas R, Tejada-Ortigoza V, Cuan-Urquizo E, Mendoza-Cachú D, Morales-de la Peña M, Alvarado-Orozco JM, et al. Evaluation of rheology and printability of 3D printing nutritious food with complex formulations. Addit Manuf. 2022;58:103030. 10.1016/j.addma.2022.103030.Search in Google Scholar
[12] Bugday Z, Venkatachalam A, Anderson P, van der Sman R. Rheology of paste-like food inks for 3D printing: Effects of nutrient and water content. Curr Res Food Sci. 2024;9:100847. 10.1016/j.crfs.2024.100847.Search in Google Scholar PubMed PubMed Central
[13] Liu Z, Bhandari B, Prakash S, Mantihal S, Zhang M. Linking rheology and printability of a multicomponent gel system of carrageenan-xanthan-starch in extrusion based additive manufacturing. Food Hydrocoll. 2019;87:413–24. 10.1016/j.foodhyd.2018.08.Search in Google Scholar
[14] Wei P, Cipriani C, Hsieh CM, Kamani K, Rogers S, Pentzer E. Go with the flow: Rheological requirements for direct ink write printability. J Appl Phys. 2023;134:100701. 10.1063/5.0155896.Search in Google Scholar
[15] Ewoldt RH, Johnston MT, Caretta LM. Experimental challenges of shear rheology: how to avoid bad data. In: Spagnolie S, editor. Complex fluids in biological systems. Biological and medical physics, biomedical engineering. New York, NY: Springer; 2015. p. 207–41. 10.1007/978-1-4939-2065-5_6.Search in Google Scholar
[16] Keentok M, Xue SC, Keentok M, Xue SC. Edge fracture in cone-plate and parallel plate flows. Technical Report; 1999.10.1007/s003970050184Search in Google Scholar
[17] Steffe JF. Rheological methods in food process engineering. East Lansing, Michigan, USA: Freeman Press; 1996.Search in Google Scholar
[18] Wilms P, Wieringa J, Blijdenstein T, van Malssen K, Kohlus R. Quantification of shear viscosity and wall slip velocity of highly concentrated suspensions with non-Newtonian matrices in pressure driven flows. Rheol Acta. 2021;60:423–37. 10.1007/s00397-021-01281-5.Search in Google Scholar
[19] Meeker SP, Bonnecaze RT, Cloitre M. Slip and flow in pastes of soft particles: Direct observation and rheology. J Rheol. 2004;48:1295–320. 10.1122/1.1795171.Search in Google Scholar
[20] Coblas D, Broboana D, Balan C. Correlation between large amplitude oscillatory shear (LAOS) and steady shear of soft solids at the onset of the fluid rheological behavior. Polymer. 2016;104:215–26. 10.1016/j.polymer.2016.06.003.Search in Google Scholar
[21] Rogers SA, Erwin BM, Vlassopoulos D, Cloitre M. A sequence of physical processes determined and quantified in LAOS: Application to a yield stress fluid. J Rheol. 2011;55:435–58. 10.1122/1.3544591.Search in Google Scholar
[22] van der Sman R, Renzetti S, Tian B. Rheology of edible soft glassy materials. Food Hydrocoll. 2024;149:109586. 10.1016/j.foodhyd. 2023.109586.Search in Google Scholar
[23] Saramito P. A new elastoviscoplastic model based on the Herschel-Bulkley viscoplastic model. J Non-Newtonian Fluid Mech. 2009;158:154–61. 10.1016/j.jnnfm.2008.12.001.Search in Google Scholar
[24] Donley GJ, Singh PK, Shetty A, Rogers SA, Weitz DA. Elucidating the G” overshoot in soft materials with a yield transition via a time-resolved experimental strain decomposition. PNAS. 2020;117(36):21945–52. 10.1073/pnas.2003869117/-/DCSupplemental.Search in Google Scholar
[25] Kamani K, Donley GJ, Rogers SA. Unification of the rheological physics of yield stress fluids. Phys Rev Lett. 2021;126:218002. 10.1103/PhysRevLett.126.218002.Search in Google Scholar PubMed
[26] Dantzig JA, Tucker CL. Modeling in materials processing. New York, USA: Cambridge University Press; 2001.10.1017/CBO9781139175272Search in Google Scholar
[27] Ng TSK, McKinley GH, Ewoldt RH. Large amplitude oscillatory shear flow of gluten dough: A model power-law gel. J Rheol. 2011;55:627–54. 10.1122/1.3570340.Search in Google Scholar
[28] Morrison FA. Understanding rheology. New York, USA: Oxford University Press; 2001.Search in Google Scholar
[29] Macosko CW. Rheology: principles, measurements, and applications. New York, USA: VCH; 1994.Search in Google Scholar
[30] De Souza Mendes PR, Alicke AA, Thompson RL. Parallelplate geometry correction for transient rheometric experiments. Appl Rheol. 2014;24:52721. 10.3933/APPLRHEOL-24-52721.Search in Google Scholar
[31] Vugrin KW, Swiler LP, Roberts RM, Stucky-Mack NJ, Sullivan SP. Confidence region estimation techniques for nonlinear regression in groundwater flow: Three case studies. Water Resour Res. 2007;43:W03423. 10.1029/2005WR004804.Search in Google Scholar
[32] Gao F, Han L. Implementing the Nelder-Mead simplex algorithm with adaptive parameters. Comput Optim Appl. 2012;51:259–77. 10.1007/s10589-010-9329-3.Search in Google Scholar
[33] Vuik C, Vermolen F, van Gijzen M, Vuik M. Numerical methods for ordinary differential equations. Delft, The Netherlands: TU Delft Open; 2023. 10. 5074/T.2023.001.Search in Google Scholar
[34] Winter HH. Transient networks evolution of rheology during chemical gelation. Prog Colloid Polym Sci. 1987;75:104–10.10.1007/BF01188363Search in Google Scholar
[35] Hyun K, Wilhelm M, Klein CO, Cho KS, Nam JG, Ahn KH, et al. A review of nonlinear oscillatory shear tests: Analysis and application of large amplitude oscillatory shear (LAOS). Prog Polym Sci. 2011;36(12):1697–753. 10.1016/j.progpolymsci.2011.02.002.Search in Google Scholar
[36] Chan ST, Varchanis S, Haward SJ, Shen AQ. Perspective on edge fracture. J Rheol. 2023;67:949–63. 10.1122/8. 0000625.Search in Google Scholar
[37] Hemingway EJ, Kusumaatmaja H, Fielding SM. Edge fracture in complex fluids. Phys Rev Lett. 2017;119(2):028006. 10.1103/PhysRevLett.119.028006.Search in Google Scholar PubMed
[38] Tanner RI, Dai S. Edge fracture in non-colloidal suspensions. J Non-Newtonian Fluid Mech. 2019;272:104171. 10.1016/j.jnnfm.2019.104171.Search in Google Scholar
[39] Tanner RI, Keentok M. Shear fracture in cone-plate rheometry. J Rheol. 1983;27:47–57. 10.1122/1.549698.Search in Google Scholar
[40] Mermet-Guyennet MRB, Gianfelice de Castro J, Habibi M, Martzel N, Denn MM, Bonn D. LAOS: The strain softening/strain hardening paradox. J Rheol. 2015;59:21–32. 10.1122/1.4902000.Search in Google Scholar
[41] Dinkgreve M, Paredes J, Denn MM, Bonn D. On different ways of measuring “the” yield stress. J Non-Newtonian Fluid Mech. 2016;238:233–41. 10.1016/j.jnnfm.2016.11.001.Search in Google Scholar
[42] Coussot P. Yield stress fluid flows: A review of experimental data. J Non-Newton Fluid Mech. 2014;211:31–49. 10.1016/j.jnnfm.2014.05.006.Search in Google Scholar
[43] Mewis J, Wagner NJ. Thixotropy. Adv Colloid Interface Sci. 2009;147–148:214–27. 10.1016/j.cis.2008. 09.005.Search in Google Scholar
[44] Snijkers F, D’Avino G, Maffettone PL, Greco F, Hulsen MA, Vermant J. Effect of viscoelasticity on the rotation of a sphere in shear flow. J Non-Newtonian Fluid Mech. 2011;166:363–72. 10.1016/j.jnnfm.2011.01.004.Search in Google Scholar
[45] Singh PK, Soulages JM, Ewoldt RH. On fitting data for parameter estimates: residual weighting and data representation. Rheol Acta. 2019;58:341–59. 10.1007/s00397-019-01135-1.Search in Google Scholar
[46] Winter HH. The critical gel. In Structure and dynamics of polymer and colloidal systems. Dordrecht, the Netherlands: Springer Science & Business Media; chapter The Critical Gel; 2002. p. 439–70.10.1007/978-94-010-0442-8_14Search in Google Scholar
[47] Guo C, Zhang M, Devahastin S. 3D extrusion-based printability evaluation of selected cereal grains by computational fluid dynamic simulation. J Food Eng. 2020;286:110113. 10.1016/j. jfoodeng.2020.110113.Search in Google Scholar
[48] Dormann CF, Elith J, Bacher S, Buchmann C, Carl G, Carre G, et al. Collinearity: A review of methods to deal with it and a simulation study evaluating their performance. Ecography. 2013;36:27–46. 10.1111/j.1600-0587.2012.07348.x.Search in Google Scholar
[49] Wang Y, Ewoldt RH. New insights on carbon black suspension rheology—Anisotropic thixotropy and antithixotropy. J Rheol. 2022;66:937–53. 10.1122/8.0000455.Search in Google Scholar
[50] Larson RG, Wei Y. A review of thixotropy and its rheological modeling. J Rheol. 2019;63:477–501. 10.1122/1.5055031.Search in Google Scholar
[51] Oyinloye TM, Yoon WB. Investigation of flow field, die swelling, and residual stress in 3D printing of surimi paste using the finite element method. Innovative Food Sci Emerging Technol. 2022;78:103008. 10.1016/j.ifset.2022.103008.Search in Google Scholar
[52] Spanjaards M, Hulsen MA, Anderson PD. Die shape optimization for extrudate swell using feedback control. J Non-Newtonian Fluid Mech. 2021;293:104552. 10.1016/j.jnnfm.2021.104552.Search in Google Scholar
[53] Coussot P. Rheophysics of pastes: A review of microscopic modelling approaches. Soft Matter. 2007;3:528–40. 10.1039/b611021p.Search in Google Scholar PubMed
[54] van der Sman RG, Voudouris P, Hamoen JR. Extrapolation of classical rheometry of plant protein pastes to extrusion conditions. Food Hydrocoll. 2024;150:109663. 10.1016/j.foodhyd.2023.109663.Search in Google Scholar
© 2025 the author(s), published by De Gruyter
This work is licensed under the Creative Commons Attribution 4.0 International License.
Articles in the same Issue
- Research Articles
- Lie symmetry analysis of bio-nano-slip flow in a conical gap between a rotating disk and cone with Stefan blowing
- Mathematical modelling of MHD hybrid nanofluid flow in a convergent and divergent channel under variable thermal conductivity effect
- Advanced ANN computational procedure for thermal transport prediction in polymer-based ternary radiative Carreau nanofluid with extreme shear rates over bullet surface
- Effects of Ca(OH)2 on mechanical damage and energy evolution characteristics of limestone adsorbed with H2S
- Effect of plasticizer content on the rheological behavior of LTCC casting slurry under large amplitude oscillating shear
- Studying the role of fine materials characteristics on the packing density and rheological properties of blended cement pastes
- Deep learning-based image analysis for confirming segregation in fresh self-consolidating concrete
- MHD Casson nanofluid flow over a three-dimensional exponentially stretching surface with waste discharge concentration: A revised Buongiorno’s model
- Rheological behavior of fire-fighting foams during their application – a new experimental set-up and protocol for foam performance qualification
- Viscoelastic characterization of corn starch paste: (II) The first normal stress difference of a cross-linked waxy corn starch paste
- An innovative rheometric tool to study chemorheology
- Effect of polymer modification on bitumen rheology: A comparative study of bitumens obtained from different sources
- Rheological and irreversibility analysis of ternary nanofluid flow over an inclined radiative MHD cylinder with porous media and couple stress
- Rheological analysis of saliva samples in the context of phonation in ectodermal dysplasia
- Analytical study of the hybrid nanofluid for the porosity flowing through an accelerated plate: Laplace transform for the rheological behavior
- Brief Report
- Correlations for friction factor of Carreau fluids in a laminar tube flow
- Special Issue on the Rheological Properties of Low-carbon Cementitious Materials for Conventional and 3D Printing Applications
- Rheological and mechanical properties of self-compacting concrete with recycled coarse aggregate from the demolition of large panel system buildings
- Effect of the combined use of polyacrylamide and accelerators on the static yield stress evolution of cement paste and its mechanisms
- Special Issue on The rheological test, modeling and numerical simulation of rock material - Part II
- Revealing the interfacial dynamics of Escherichia coli growth and biofilm formation with integrated micro- and macro-scale approaches
- Construction of a model for predicting sensory attributes of cosmetic creams using instrumental parameters based on machine learning
- Effect of flaw inclination angle and crack arrest holes on mechanical behavior and failure mechanism of pre-cracked granite under uniaxial compression
- Special Issue on The rheology of emerging plant-based food systems
- Rheological properties of pea protein melts used for producing meat analogues
- Understanding the large deformation response of paste-like 3D food printing inks
- Seeing the unseen: Laser speckles as a tool for coagulation tracking
- Composition, structure, and interfacial rheological properties of walnut glutelin
- Microstructure and rheology of heated foams stabilized by faba bean isolate and their comparison to egg white foams
- Rheological analysis of swelling food soils for optimized cleaning in plant-based food production
- Multiscale monitoring of oleogels during thermal transition
- Influence of pea protein on alginate gelation behaviour: Implications for plant-based inks in 3D printing
- Observations from capillary and closed cavity rheometry on the apparent flow behavior of a soy protein isolate dough used in meat analogues
- Special Issue on Hydromechanical coupling and rheological mechanism of geomaterials
- Rheological behavior of geopolymer dope solution activated by alkaline activator at different temperature
- Special Issue on Rheology of Petroleum, Bitumen, and Building Materials
- Rheological investigation and optimization of crumb rubber-modified bitumen production conditions in the plant and laboratory