Rheological analysis of saliva samples in the context of phonation in ectodermal dysplasia
-
Maximilian Eckhardt


Abstract
Ectodermal dysplasia (ED) is a rare inherited disorder affecting embryonic ectoderm structures, leading to reduced development of skin appendages and certain eccrine glands. Displaying reduced salivation and impaired acoustic quality in males, ED offers a unique chance to study the role of laryngeal mucus in the phonation process. This study analyzed saliva rheology as a non-invasive substitute for laryngeal mucus to investigate potential causal relationships. Saliva samples from 36 ED patients and 99 controls were collected for 5 min following a 15 min abstention from eating, drinking, or smoking. The viscoelastic properties have been measured by a rheometer with a parallel plate system. Storage (G′) and loss (G″) moduli were recorded and compared between ED and controls. ED subjects exhibited significantly lower G′ and G″ at lower frequencies and strains, yet slightly higher values at increased frequencies and strains among males. These findings suggest reduced resistance of saliva to external forces for ED. Transferred to the laryngeal level, this behavior might impair the mucus’ retention rate on the vocal folds. The results also hint at altered hyaluronic acid content in ED, guiding further correlation studies investigating voice conspicuities.
Abbreviations
- ED
-
Ectodermal dysplasia
- EDm/f/b
-
Ectodermal dysplasia in males/females/boys
- C
-
Controls
- Cm/f/b
-
Controls in males/females/boys
- XLHED
-
X-linked hypohidrotic ectodermal dysplasia
1 Introduction
In spite of the major role of the human voice in social and professional aspects of today’s society, the phonation process is not yet fully understood [1,2,3,4]. Recently, the impact of the laryngeal mucus as a hydrating boundary layer in the larynx and vocal tract on phonation and the role of the structural compositions and tissue properties of the vocal folds have come into focus of research [5,6,7,8,9,10,11]. Ex vivo experiments allow direct access and complete control of the boundary conditions, but typically lack, to some degree, in realism of the acoustic modulation in the vocal tract [10]. Various diseases with altered mucus production that also affect the voice, such as ectodermal dysplasia (ED), cystic fibrosis, and Sjögren’s disease [12,13,14,15], provide a suitable model for in vivo studies, although direct access to the larynx is profoundly limited.
Among other symptoms, the most common hypohidrotic form of ED is characterized by a reduced number and activity of all glands of ectodermal origin, including the salivary and mucosal glands in the whole respiratory tract [16,17]. Although the reduced glandular function is an obviously contributing factor, the striking voice of patients with ED cannot yet be fully explained. The symptoms of ED result from a hereditary disorder in the development of the ectoderm [18], and the most frequent form of ED is inherited X-linked recessively, so that males are more strongly affected by ED than women [16,19].
Previous studies by Semmler et al. [12] reported a significantly reduced salivary function in the experimental group of ED subjects compared to the control group by measuring the generated saliva weight over a certain duration. Furthermore, this study demonstrated a reduced voice quality objectively and systematically by means of the multimodal measurement protocol established by the European Laryngological Society for a functional assessment of voice pathologies [12,20]. A recent study by Pelka et al. [21] presented statistically significant differences between male ED and control subjects concerning the mechanical parameters representing tissue characteristics of the vocal folds derived from high-speed videoendoscopy. Despite these findings, no clear correlation with voice quality in ED subjects has yet been revealed [12,20,21].
Another important factor could be the laryngeal mucus with its rheological characteristics, which acts as a boundary layer in the fluid-structure-acoustic interaction, generating the primary voice signal in the larynx [10,22]. The long-term goal is to further investigate whether there is an explanation for the striking vocal characteristics of ED subjects on the laryngeal level. Due to the invasive extraction procedure required for laryngeal mucus samples [11], the investigation is instead performed on resting saliva, which is believed to be a suitable substitute since the salivary gland function is severely affected in subjects with ED. Therefore, the aim of the present study is an initial exploration of differences in the rheology of saliva samples between ED subjects and controls to expand our knowledge about this issue and guide future research approaches.
So far, the viscoelastic properties of human saliva have barely been studied in patients with reduced salivary function [23,24], and it is unclear which factors in saliva contribute to its rheological properties [25]. Rereddy et al. found that post-radiation and anticholinergic-induced xerostomia patients, despite similar shear viscosities, exhibited significantly increased extensional viscosity compared to healthy controls, indicating altered saliva rheology associated with dry mouth conditions [23]. The study by Chaudhury et al. suggests that qualitative changes in mucin glycosylation – particularly reduced sialylation of MUC7 – contribute to altered extensional rheology of saliva in Sjögren’s syndrome. These changes may underlie the sensation of oral dryness, independent of the saliva volume [24].
In line with other rheological studies on human and simulated/artificial saliva [26,27,28,29], in our approach, we employ a plate-plate rheometer to analyze the viscoelastic properties at variable frequency and shear stress.
We hypothesize that the different viscoelastic characteristics of saliva in ED subjects could emerge from divergent compositions of hyaluronic acids at specific molecular masses [12,30]. Once the transferability of our findings between saliva and mucus is established, substitute solutions would be conceivable. We are confident that our work will eventually contribute to improving patient care for the ED as well as increase our understanding of the phonation process in general.
2 Methods
2.1 Study participants
Initially, the experimental group examined in this study included 46 test persons with a clinically diagnosed ED. These participants were recruited via the German ED patient organization (Ektodermale Dysplasie e.V.) in 2022. For further analysis, only patients with genetically confirmed X-linked hypohidrotic ectodermal dysplasia (XLHED) were taken into account [31]. Some samples had to be excluded because of insufficient saliva volume or unsuccessful measurements.
Overall, the experimental group (with XLHED) included 14 male subjects (EDm), 17 female subjects (EDf) aged between 13 and 71 years, and 5 boys up to 12 years of age (EDb), which were investigated separately for statistical purposes. The frequency sweep included 36 people with XLHED. In the strain sweep, 31 people with XLHED were considered.
The healthy control group, without current or previous voice pathologies, comprised 44 male test subjects (Cm) and 50 female test subjects (Cf) aged between 13 and 64 years and additionally 5 boys (Cb). In the control group, the frequency sweep included 99 healthy subjects and 85 healthy subjects in the strain sweep.
The numbers and mean values of the age in all six subgroups are shown in Table 1. Please note that the group classification (adult/children) was differentiated on the basis of voice status. In this study, all subjects up to the age of 12 years had not yet undergone voice change according to perceptual assessment. The study is covered by a positive vote of the local ethics committee (ref. No 21-437-B) of the medical faculty at the Friedrich-Alexander-Universität Erlangen-Nürnberg.
Included number of subjects, mean values, and standard deviations of the investigated parameter age averaged for all test groups
| Frequency sweep | ||||||
|---|---|---|---|---|---|---|
| EDm | Cm | EDf | Cf | EDb | Cb | |
| N = 14 | N = 44 | N = 17 | N = 50 | N = 5 | N = 5 | |
| Age (years) | 37.8 ± 16.3 | 32.2 ± 14.0 | 45.2 ± 12.2 | 35.0 ± 13.8 | 10.0 ± 1.1 | 10.2 ± 1.3 |
| Strain sweep | ||||||
|---|---|---|---|---|---|---|
| EDm | Cm | EDf | Cf | EDb | Cb | |
| N = 13 | N = 35 | N = 14 | N = 45 | N = 4 | N = 5 | |
| Age (years) | 36.6 ± 16.4 | 34.7 ± 14.6 | 45.5 ± 13.0 | 36.1 ± 14.3 | 10.3 ± 1.1 | 10.2 ± 1.3 |
2.2 Data acquisition and measurement protocol
Samples of resting saliva were obtained for a period of 5 min in a collection cup. The subjects had been instructed not to eat, drink, smoke, use chewing gum, etc., for at least 15 min beforehand. The samples were then transferred and aliquoted to Eppendorf tubes and deep-frozen on dry ice for transport and long-term storage at −20°C before collective analysis. The saliva samples were slowly thawed at 4°C over the duration of 1 h and centrifuged for 5 min at 3,000 × g prior to the rheological measurement to separate any potential solid components. The samples were stored at 4°C until the measurement to avoid any degeneration.
The samples were measured with a plate-plate rheometer of type HAAKE™ MARS™ 60 Rheometer (Thermo Fisher Scientific Inc., Waltham, MA, USA) with a plate diameter of 25 mm and a gap of 120 μm at 25°C. For our available sample volumes (<200 µl), we chose the largest possible plate diameter. It has been shown before that thin-gap parallel-disk configurations provide reliable results for low viscosities down to a gap of 20 µm [32].
All measurements were conducted following a pre-shear for homogenizing the dispensed saliva sample at 0.5 Hz. In the stress-controlled frequency sweep, the oscillation frequency was varied between f = 1–10 Hz in 15 steps at a regulated stress of τ = 0.1 Pa. Subsequently, in the stress-controlled strain sweep, the applied shear stress was systematically varied between τ = 0.01–20 Pa at 0.5 Hz in 30 steps. Each set of measurements took 9.4 min per sample, and on average, 15 samples were measured in each batch. The measurements were carried out blinded and in no particular order. Storage modulus G′ in Pa and loss modulus G″ in Pa were determined in both frequency and strain sweeps.
2.3 Data processing and analysis
To enable meaningful comparisons over all measurements, the data points of the strain sweep were interpolated in 30 logarithmically distributed steps by a piecewise cubic Hermite interpolation in the largest shared range, where all measurements provide interpolated values [33,34]. This resulted in a strain range of γ = 0.1–70%. The interpolation was performed with Matlab R2021b.
The statistical analysis was conducted with regard to differences between ED subjects and controls, but separately for the male and female subgroups due to the X-linked genetic inheritance of ED, which yields more pronounced and consistent symptoms in males. The male children were evaluated separately to reveal age-related differences.
For every investigated frequency in the frequency sweep and every investigated shear strain in the interpolated strain sweep, an individual mean value comparison over the absolute values of storage and loss moduli is performed in each group (male/female/boys). Additionally, a mean value comparison is performed on the shear strain values of the cross-over points of the loss and storage moduli curves in the strain sweep.
A Shapiro–Wilk test with a significance level of p = 0.05 was used to test the subgroups for normal distribution. The nonparametric Mann–Whitney U test for comparison of two groups was used with a significance level of p = 0.05 to look for statistically significant differences between the subgroups (EDm <> Cm, EDf <> Cf, EDb <> Cb). All statistical tests were conducted utilizing SPSS version 29.
3 Results
3.1 Mean value comparison of storage and loss moduli
The numbers of subjects included in each subgroup for the frequency sweep and the strain sweep are listed in Table 1. In Tables 2–5, the mean values and standard deviations for each group are illustrated. Tables 2 and 3 show the rheological measurements at the different frequencies. Tables 4 and 5 present the rheological measurements in relation to different shear strains. The results of the statistical analysis are presented in Tables A1–A4: Tables A1 and A2 in relation to the different analyzed frequencies and Tables A3 and A4 with regard to the different amplitude swipes. The subgroups in the columns were ordered for separate group comparison of males (left: EDm <> Cm), females (middle: EDf <> Cf), and boys (right: EDb <> Cb). Statistically significant differences (p < 0.05 in the Mann–Whitney U test) between ED subjects and controls are highlighted in bold letters in both tables.
Mean values and standard deviations of all investigated frequencies for storage modulus G′ averaged for all test groups
| Storage modulus G′ from frequency sweep on resting saliva | ||||||
|---|---|---|---|---|---|---|
| Frequency f (Hz) | G′_EDm | G′_Cm | G′_EDf | G′_Cf | G′_EDb | G′_Cb |
| N = 14 | N = 44 | N = 17 | N = 50 | N = 5 | N = 5 | |
| Mean ± std | Mean ± std | Mean ± std | Mean ± std | Mean ± std | Mean ± std | |
| 1.00 | 0.30 ± 0.26 | 0.61 ± 0.58 | 0.29 ± 0.18 | 0.46 ± 0.42 | 0.22 ± 0.15 | 1.51 ± 0.82 |
| 1.18 | 0.31 ± 0.25 | 0.65 ± 0.62 | 0.33 ± 0.45 | 0.45 ± 0.42 | 0.17 ± 0.13 | 1.47 ± 0.80 |
| 1.39 | 0.29 ± 0.29 | 0.67 ± 0.66 | 0.28 ± 0.21 | 0.47 ± 0.44 | 0.22 ± 0.16 | 1.54 ± 0.80 |
| 1.64 | 0.33 ± 0.28 | 0.80 ± 0.81 | 0.41 ± 0.45 | 0.52 ± 0.44 | 0.28 ± 0.14 | 1.66 ± 0.85 |
| 1.93 | 0.57 ± 0.60 | 0.69 ± 0.65 | 0.72 ± 1.30 | 0.52 ± 0.45 | 0.32 ± 0.23 | 1.63 ± 0.99 |
| 2.28 | 0.36 ± 0.40 | 0.64 ± 0.66 | 0.79 ± 2.07 | 0.65 ± 0.78 | 0.95 ± 1.82 | 1.68 ± 1.02 |
| 2.68 | 1.28 ± 2.29 | 0.99 ± 1.29 | 1.41 ± 1.99 | 1.01 ± 1.58 | 0.84 ± 0.59 | 1.79 ± 0.99 |
| 3.16 | 1.20 ± 2.01 | 2.55 ± 6.89 | 1.83 ± 4.42 | 2.06 ± 4.97 | 0.51 ± 0.47 | 1.70 ± 1.11 |
| 3.73 | 3.80 ± 6.70 | 2.37 ± 5.45 | 3.69 ± 6.58 | 2.06 ± 2.51 | 6.56 ± 11.89 | 1.00 ± 0.77 |
| 4.39 | 4.99 ± 7.84 | 2.49 ± 4.15 | 3.25 ± 5.96 | 1.96 ± 3.13 | 3.24 ± 4.53 | 0.92 ± 0.75 |
| 5.18 | 8.27 ± 9.94 | 8.65 ± 14.4 | 8.30 ± 8.85 | 5.71 ± 7.39 | 5.21 ± 6.47 | 2.68 ± 3.25 |
| 6.11 | 14.6 ± 12.5 | 8.85 ± 11.2 | 16.7 ± 17.6 | 12.8 ± 19.2 | 17.3 ± 21.9 | 7.45 ± 4.06 |
| 7.20 | 22.4 ± 23.0 | 12.3 ± 14.7 | 22.5 ± 21.3 | 17.1 ± 18.8 | 27.4 ± 25.5 | 6.31 ± 2.97 |
| 8.48 | 56.7 ± 49.4 | 35.1 ± 45.3 | 53.8 ± 50.7 | 43.4 ± 54.1 | 31.3 ± 9.91 | 10.8 ± 7.60 |
| 10.0 | 106.1 ± 80.5 | 61.9 ± 71.7 | 88.3 ± 71.8 | 86.9 ± 100.9 | 50.3 ± 37.7 | 34.6 ± 20.9 |
Statistically significant differences (p < 0.05 in Mann–Whitney U test) between ED subjects and controls are highlighted in bold style.
Mean values and standard deviations of all investigated frequencies for loss modulus G″ averaged for all test groups
| Loss modulus G″ from frequency sweep on resting saliva | ||||||
|---|---|---|---|---|---|---|
| Frequency f (Hz) | G″_EDm | G″_Cm | G″_EDf | G″_Cf | G″_EDb | G″_Cb |
| N = 14 | N = 44 | N = 17 | N = 50 | N = 5 | N = 5 | |
| Mean ± std | Mean ± std | Mean ± std | Mean ± std | Mean ± std | Mean ± std | |
| 1.00 | 0.19 ± 0.09 | 0.28 ± 0.20 | 0.18 ± 0.08 | 0.24 ± 0.15 | 0.16 ± 0.05 | 0.53 ± 0.27 |
| 1.18 | 0.19 ± 0.11 | 0.31 ± 0.19 | 0.26 ± 0.31 | 0.25 ± 0.16 | 0.12 ± 0.08 | 0.54 ± 0.27 |
| 1.39 | 0.21 ± 0.15 | 0.32 ± 0.21 | 0.23 ± 0.13 | 0.29 ± 0.13 | 0.22 ± 0.10 | 0.55 ± 0.26 |
| 1.64 | 0.26 ± 0.14 | 0.44 ± 0.26 | 0.32 ± 0.20 | 0.34 ± 0.21 | 0.28 ± 0.02 | 0.55 ± 0.28 |
| 1.93 | 0.25 ± 0.16 | 0.41 ± 0.32 | 0.48 ± 0.71 | 0.32 ± 0.17 | 0.22 ± 0.11 | 0.62 ± 0.27 |
| 2.28 | 0.36 ± 0.26 | 0.58 ± 1.10 | 0.70 ± 0.79 | 0.53 ± 0.41 | 0.53 ± 0.52 | 0.59 ± 0.34 |
| 2.68 | 1.05 ± 1.98 | 0.57 ± 0.63 | 0.85 ± 1.21 | 0.87 ± 2.80 | 0.65 ± 0.32 | 0.71 ± 0.15 |
| 3.16 | 2.15 ± 4.32 | 1.29 ± 3.32 | 0.70 ± 1.03 | 0.83 ± 1.40 | 0.62 ± 0.80 | 0.66 ± 0.36 |
| 3.73 | 6.18 ± 11.86 | 2.39 ± 6.24 | 4.34 ± 9.25 | 4.03 ± 11.98 | 2.16 ± 2.18 | 1.07 ± 0.75 |
| 4.39 | 5.16 ± 6.36 | 2.54 ± 5.46 | 3.67 ± 5.62 | 1.71 ± 2.15 | 6.20 ± 11.3 | 1.14 ± 0.27 |
| 5.18 | 7.97 ± 12.27 | 5.71 ± 11.17 | 8.80 ± 15.62 | 4.12 ± 7.22 | 4.09 ± 5.22 | 1.09 ± 0.21 |
| 6.11 | 12.0 ± 25.1 | 8.97 ± 16.4 | 13.2 ± 18.3 | 10.3 ± 19.3 | 6.22 ± 7.53 | 8.21 ± 10.7 |
| 7.20 | 20.3 ± 14.3 | 9.73 ± 10.1 | 15.3 ± 12.8 | 12.5 ± 11.0 | 17.1 ± 10.3 | 5.76 ± 3.57 |
| 8.48 | 47.3 ± 44.5 | 23.7 ± 33.8 | 25.1 ± 37.6 | 23.7 ± 35.92 | 14.8 ± 16.3 | 31.5 ± 41.4 |
| 10.0 | 47.9 ± 55.7 | 50.6 ± 98.4 | 20.7 ± 24.0 | 52.2 ± 65.2 | 26.9 ± 53.4 | 86.9 ± 98.7 |
Statistically significant differences (p < 0.05 in the Mann–Whitney U test) between ED subjects and controls are highlighted in bold style.
Mean values and standard deviations of all investigated shear stress amplitudes for storage modulus G′ averaged for all test groups
| Storage modulus G′ from strain sweep on resting saliva | ||||||
|---|---|---|---|---|---|---|
| Shear strain γ (%) | G′_EDm | G′_Cm | G′_EDf | G′_Cf | G′_EDb | G′_Cb |
| N = 13 | n = 35 | N = 14 | N = 45 | N = 4 | N = 5 | |
| Mean ± std | Mean ± std | Mean ± std | Mean ± std | Mean ± std | Mean ± std | |
| 0.10 | 0.40 ± 0.28 | 0.77 ± 0.62 | 0.38 ± 0.18 | 1.10 ± 3.31 | 0.24 ± 0.09 | 1.54 ± 0.71 |
| 0.13 | 0.39 ± 0.24 | 0.75 ± 0.58 | 0.35 ± 0.19 | 1.03 ± 2.91 | 0.23 ± 0.09 | 1.51 ± 0.67 |
| 0.16 | 0.37 ± 0.21 | 0.72 ± 0.55 | 0.34 ± 0.18 | 0.95 ± 2.55 | 0.24 ± 0.08 | 1.43 ± 0.61 |
| 0.20 | 0.36 ± 0.19 | 0.69 ± 0.50 | 0.34 ± 0.16 | 0.87 ± 2.14 | 0.23 ± 0.08 | 1.34 ± 0.55 |
| 0.25 | 0.33 ± 0.16 | 0.65 ± 0.46 | 0.34 ± 0.14 | 0.77 ± 1.70 | 0.23 ± 0.07 | 1.24 ± 0.49 |
| 0.31 | 0.31 ± 0.14 | 0.61 ± 0.43 | 0.30 ± 0.15 | 0.67 ± 1.24 | 0.23 ± 0.07 | 1.13 ± 0.43 |
| 0.39 | 0.29 ± 0.11 | 0.56 ± 0.38 | 0.28 ± 0.14 | 0.57 ± 0.82 | 0.23 ± 0.06 | 1.01 ± 0.38 |
| 0.49 | 0.26 ± 0.09 | 0.51 ± 0.34 | 0.26 ± 0.13 | 0.48 ± 0.48 | 0.22 ± 0.05 | 0.90 ± 0.33 |
| 0.61 | 0.24 ± 0.09 | 0.46 ± 0.29 | 0.25 ± 0.12 | 0.41 ± 0.30 | 0.21 ± 0.04 | 0.77 ± 0.28 |
| 0.76 | 0.22 ± 0.09 | 0.40 ± 0.25 | 0.23 ± 0.11 | 0.36 ± 0.25 | 0.20 ± 0.03 | 0.65 ± 0.23 |
| 0.96 | 0.20 ± 0.08 | 0.35 ± 0.20 | 0.21 ± 0.10 | 0.31 ± 0.20 | 0.19 ± 0.03 | 0.54 ± 0.19 |
| 1.20 | 0.18 ± 0.07 | 0.30 ± 0.17 | 0.19 ± 0.09 | 0.27 ± 0.16 | 0.17 ± 0.03 | 0.45 ± 0.15 |
| 1.50 | 0.16 ± 0.06 | 0.26 ± 0.14 | 0.16 ± 0.08 | 0.23 ± 0.12 | 0.15 ± 0.03 | 0.36 ± 0.12 |
| 1.89 | 0.13 ± 0.05 | 0.22 ± 0.11 | 0.14 ± 0.07 | 0.19 ± 0.08 | 0.12 ± 0.02 | 0.29 ± 0.09 |
| 2.36 | 0.11 ± 0.04 | 0.18 ± 0.09 | 0.13 ± 0.06 | 0.16 ± 0.06 | 0.10 ± 0.01 | 0.23 ± 0.06 |
| 2.96 | 0.09 ± 0.04 | 0.15 ± 0.07 | 0.11 ± 0.05 | 0.13 ± 0.05 | 0.08 ± 0.01 | 0.19 ± 0.05 |
| 3.71 | 0.07 ± 0.02 | 0.13 ± 0.06 | 0.09 ± 0.04 | 0.11 ± 0.05 | 0.07 ± 0.02 | 0.15 ± 0.04 |
| 4.65 | 0.05 ± 0.02 | 0.10 ± 0.05 | 0.08 ± 0.03 | 0.09 ± 0.04 | 0.07 ± 0.01 | 0.12 ± 0.04 |
| 5.83 | 0.05 ± 0.02 | 0.08 ± 0.04 | 0.07 ± 0.02 | 0.07 ± 0.03 | 0.06 ± 0.02 | 0.10 ± 0.03 |
| 7.31 | 0.04 ± 0.02 | 0.07 ± 0.04 | 0.06 ± 0.02 | 0.06 ± 0.03 | 0.06 ± 0.02 | 0.08 ± 0.03 |
| 9.17 | 0.04 ± 0.02 | 0.05 ± 0.03 | 0.06 ± 0.02 | 0.05 ± 0.02 | 0.05 ± 0.02 | 0.06 ± 0.03 |
| 11.5 | 0.04 ± 0.02 | 0.04 ± 0.03 | 0.05 ± 0.03 | 0.04 ± 0.02 | 0.05 ± 0.02 | 0.04 ± 0.02 |
| 14.4 | 0.04 ± 0.02 | 0.04 ± 0.02 | 0.05 ± 0.04 | 0.03 ± 0.02 | 0.04 ± 0.01 | 0.02 ± 0.02 |
| 18.1 | 0.04 ± 0.02 | 0.04 ± 0.02 | 0.05 ± 0.05 | 0.03 ± 0.02 | 0.03 ± 0.01 | 0.02 ± 0.01 |
| 22.6 | 0.05 ± 0.03 | 0.04 ± 0.03 | 0.06 ± 0.06 | 0.04 ± 0.03 | 0.03 ± 0.01 | 0.02 ± 0.01 |
| 28.4 | 0.06 ± 0.04 | 0.05 ± 0.04 | 0.07 ± 0.07 | 0.06 ± 0.04 | 0.05 ± 0.02 | 0.03 ± 0.04 |
| 35.5 | 0.09 ± 0.05 | 0.06 ± 0.04 | 0.10 ± 0.06 | 0.08 ± 0.05 | 0.07 ± 0.02 | 0.05 ± 0.05 |
| 44.6 | 0.12 ± 0.06 | 0.09 ± 0.05 | 0.13 ± 0.05 | 0.11 ± 0.05 | 0.10 ± 0.04 | 0.08 ± 0.05 |
| 55.9 | 0.15 ± 0.05 | 0.12 ± 0.05 | 0.16 ± 0.04 | 0.14 ± 0.05 | 0.14 ± 0.05 | 0.11 ± 0.04 |
| 70.0 | 0.18 ± 0.03 | 0.15 ± 0.05 | 0.19 ± 0.03 | 0.16 ± 0.04 | 0.18 ± 0.03 | 0.14 ± 0.04 |
Statistically significant differences (p < 0.05 in the Mann–Whitney U test) between ED patients and controls are highlighted in bold type.
Mean values and standard deviations of all investigated shear stress for loss modulus G″ averaged for all test groups
| Loss modulus G″ from strain sweep on resting saliva | ||||||
|---|---|---|---|---|---|---|
| Shear strain γ (%) | G″_EDm | G″_Cm | G″_EDf | G″_Cf | G″_EDb | G″_Cb |
| N = 13 | N = 35 | N = 14 | N = 45 | N = 4 | N = 5 | |
| Mean ± std | Mean ± std | Mean ± std | Mean ± std | Mean ± std | Mean ± std | |
| 0.10 | 0.23 ± 0.12 | 0.35 ± 0.22 | 0.21 ± 0.11 | 0.78 ± 3.08 | 0.89 ± 1.53 | 0.56 ± 0.23 |
| 0.13 | 0.23 ± 0.12 | 0.35 ± 0.22 | 0.20 ± 0.11 | 0.75 ± 2.91 | 0.82 ± 1.39 | 0.55 ± 0.22 |
| 0.16 | 0.22 ± 0.12 | 0.35 ± 0.21 | 0.21 ± 0.10 | 0.72 ± 2.71 | 0.74 ± 1.22 | 0.55 ± 0.22 |
| 0.20 | 0.22 ± 0.12 | 0.35 ± 0.21 | 0.21 ± 0.10 | 0.68 ± 2.47 | 0.54 ± 0.82 | 0.54 ± 0.21 |
| 0.25 | 0.21 ± 0.12 | 0.34 ± 0.20 | 0.20 ± 0.11 | 0.64 ± 2.19 | 0.54 ± 0.82 | 0.54 ± 0.21 |
| 0.31 | 0.20 ± 0.11 | 0.33 ± 0.20 | 0.19 ± 0.10 | 0.58 ± 1.87 | 0.43 ± 0.61 | 0.53 ± 0.19 |
| 0.39 | 0.19 ± 0.10 | 0.33 ± 0.19 | 0.19 ± 0.10 | 0.52 ± 1.53 | 0.32 ± 0.39 | 0.51 ± 0.18 |
| 0.49 | 0.18 ± 0.09 | 0.32 ± 0.18 | 0.19 ± 0.09 | 0.46 ± 1.20 | 0.22 ± 0.20 | 0.50 ± 0.17 |
| 0.61 | 0.18 ± 0.08 | 0.30 ± 0.17 | 0.18 ± 0.09 | 0.41 ± 0.94 | 0.15 ± 0.07 | 0.48 ± 0.15 |
| 0.76 | 0.17 ± 0.07 | 0.29 ± 0.16 | 0.17 ± 0.08 | 0.38 ± 0.83 | 0.12 ± 0.04 | 0.45 ± 0.14 |
| 0.96 | 0.16 ± 0.06 | 0.27 ± 0.15 | 0.16 ± 0.07 | 0.35 ± 0.73 | 0.12 ± 0.05 | 0.43 ± 0.13 |
| 1.20 | 0.15 ± 0.05 | 0.26 ± 0.13 | 0.15 ± 0.07 | 0.32 ± 0.62 | 0.12 ± 0.05 | 0.39 ± 0.11 |
| 1.50 | 0.14 ± 0.04 | 0.23 ± 0.12 | 0.14 ± 0.06 | 0.28 ± 0.51 | 0.11 ± 0.04 | 0.35 ± 0.10 |
| 1.89 | 0.13 ± 0.04 | 0.21 ± 0.11 | 0.13 ± 0.05 | 0.25 ± 0.40 | 0.11 ± 0.04 | 0.31 ± 0.09 |
| 2.36 | 0.12 ± 0.03 | 0.19 ± 0.09 | 0.12 ± 0.04 | 0.21 ± 0.31 | 0.11 ± 0.03 | 0.27 ± 0.08 |
| 2.96 | 0.11 ± 0.02 | 0.17 ± 0.08 | 0.11 ± 0.04 | 0.19 ± 0.24 | 0.11 ± 0.03 | 0.24 ± 0.06 |
| 3.71 | 0.10 ± 0.02 | 0.15 ± 0.07 | 0.11 ± 0.03 | 0.17 ± 0.21 | 0.10 ± 0.02 | 0.21 ± 0.05 |
| 4.65 | 0.09 ± 0.03 | 0.14 ± 0.06 | 0.10 ± 0.03 | 0.15 ± 0.18 | 0.10 ± 0.11 | 0.18 ± 0.04 |
| 5.83 | 0.07 ± 0.03 | 0.12 ± 0.05 | 0.10 ± 0.02 | 0.13 ± 0.15 | 0.09 ± 0.01 | 0.16 ± 0.04 |
| 7.31 | 0.05 ± 0.03 | 0.10 ± 0.05 | 0.09 ± 0.03 | 0.11 ± 0.12 | 0.07 ± 0.01 | 0.14 ± 0.04 |
| 9.17 | 0.05 ± 0.03 | 0.07 ± 0.05 | 0.08 ± 0.05 | 0.09 ± 0.10 | 0.05 ± 0.03 | 0.11 ± 0.03 |
| 11.5 | 0.05 ± 0.04 | 0.07 ± 0.04 | 0.07 ± 0.06 | 0.07 ± 0.08 | 0.03 ± 0.02 | 0.09 ± 0.04 |
| 14.4 | 0.06 ± 0.05 | 0.07 ± 0.04 | 0.06 ± 0.06 | 0.07 ± 0.07 | 0.02 ± 0.01 | 0.04 ± 0.04 |
| 18.1 | 0.07 ± 0.06 | 0.08 ± 0.05 | 0.08 ± 0.06 | 0.08 ± 0.07 | 0.03 ± 0.03 | 0.04 ± 0.03 |
| 22.6 | 0.10 ± 0.06 | 0.09 ± 0.06 | 0.10 ± 0.07 | 0.10 ± 0.07 | 0.08 ± 0.02 | 0.07 ± 0.04 |
| 28.4 | 0.13 ± 0.06 | 0.11 ± 0.06 | 0.13 ± 0.06 | 0.13 ± 0.06 | 0.12 ± 0.03 | 0.09 ± 0.06 |
| 35.5 | 0.16 ± 0.05 | 0.13 ± 0.06 | 0.17 ± 0.04 | 0.16 ± 0.05 | 0.15 ± 0.03 | 0.13 ± 0.05 |
| 44.6 | 0.19 ± 0.03 | 0.16 ± 0.05 | 0.20 ± 0.02 | 0.18 ± 0.04 | 0.18 ± 0.03 | 0.17 ± 0.03 |
| 55.9 | 0.20 ± 0.02 | 0.19 ± 0.04 | 0.21 ± 0.01 | 0.20 ± 0.03 | 0.20 ± 0.02 | 0.20 ± 0.02 |
| 70.0 | 0.21 ± 0.05 | 0.20 ± 0.03 | 0.21 ± 0.01 | 0.20 ± 0.05 | 0.21 ± 0.01 | 0.20 ± 0.01 |
Statistically significant differences (p < 0.05 in the Mann–Whitney U test) between ED patients and controls are highlighted in bold style.
Focusing on the frequency sweeps of the adult males, which are visualized in Figure 1, the male ED group (EDm) shows statistically significantly lower values for storage modulus G′ and loss modulus G″ concerning the lower frequencies below 2 Hz (Tables A1 and A2). Within this range, the mean values of the storage modulus G′ for EDm (blue in Figure 1) are only 41–49% of the mean values of Cm (green in Figure 1), while the mean values of the loss modulus G″ are 59–68% for EDm compared to Cm. For higher frequencies over 3.7 Hz, the mean values of storage and loss moduli G′ and G″ are mostly higher for EDm compared to Cm. However, only for few investigated frequencies, the differences displayed statistical significance. At 10 Hz, the G′ mean value for EDm is 171% of the Cm mean value and the G″ mean values for EDm are at 203% for 4.39 Hz and 208% for 7.2 Hz of the Cm mean values (Tables A1 and A2).
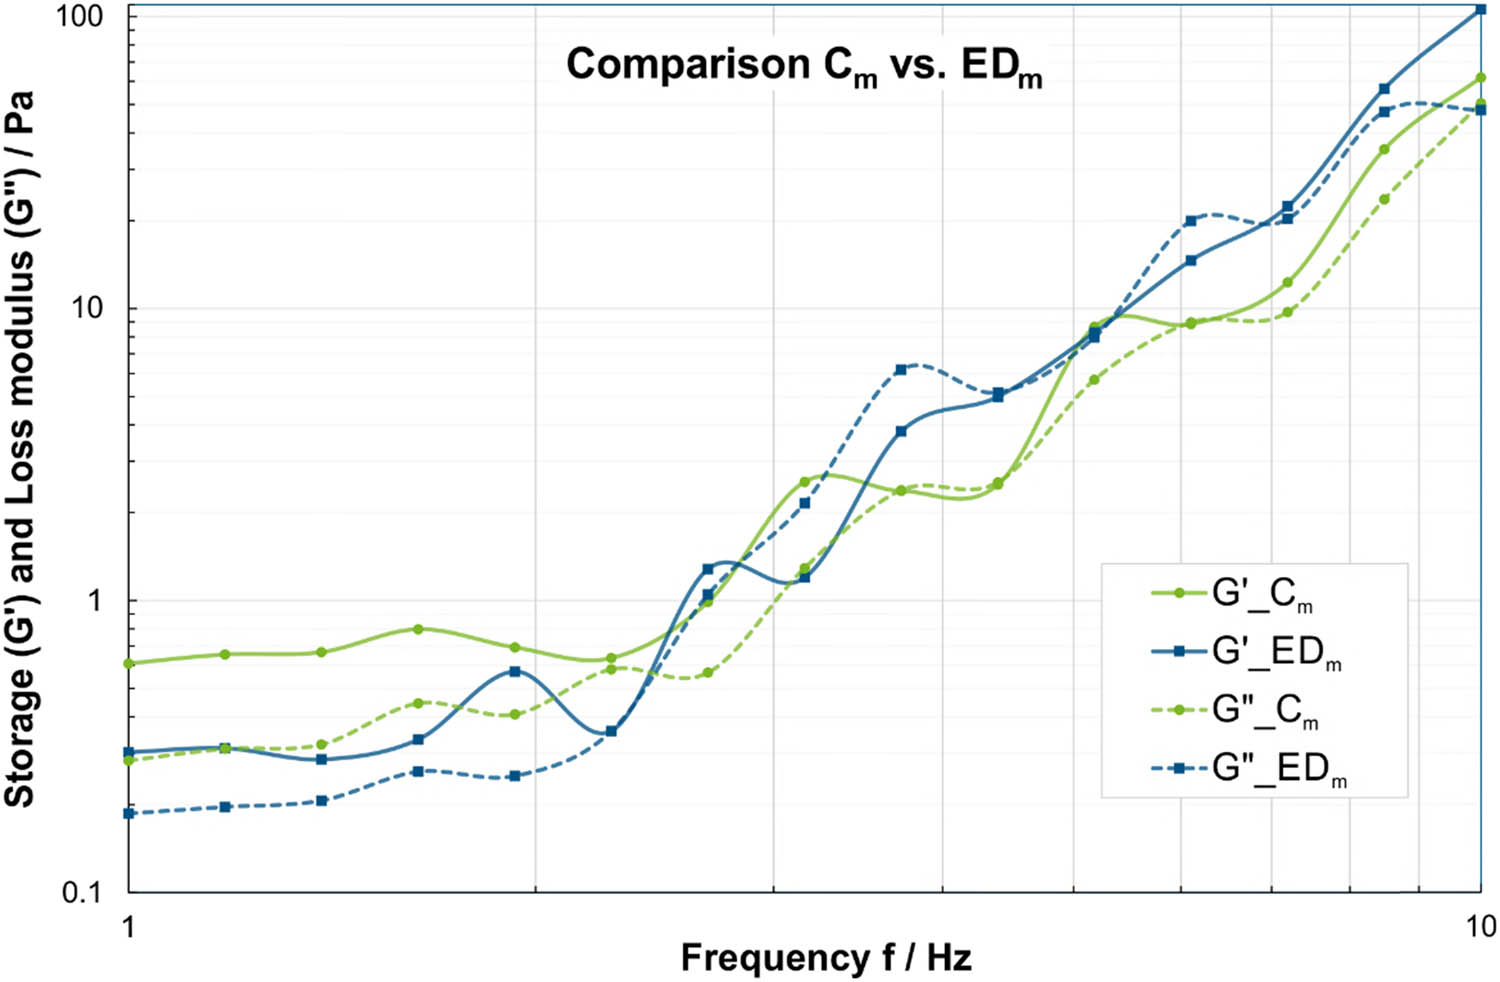
Comparison of storage modulus (solid lines) and loss modulus (dashed lines) in frequency sweeps at τ = 0.01 Pa between saliva samples from male ED subjects (EDm) in blue and male controls (Cm) in green. Please note that the dashed/solid lines between the data points are for visualization of group affiliation and do not indicate an interpolation or dependency.
Throughout all frequencies for both G′ and G″, the EDf values behaved mostly similar to the EDm group, lower storage and loss moduli than Cf for lower frequencies and higher or equal values than Cf for higher frequencies (Figure 2). In contrast to the male subgroups, none of the differences in G′ and G″ between the female subgroups were statistically significant, as illustrated in Tables A1 and A2.
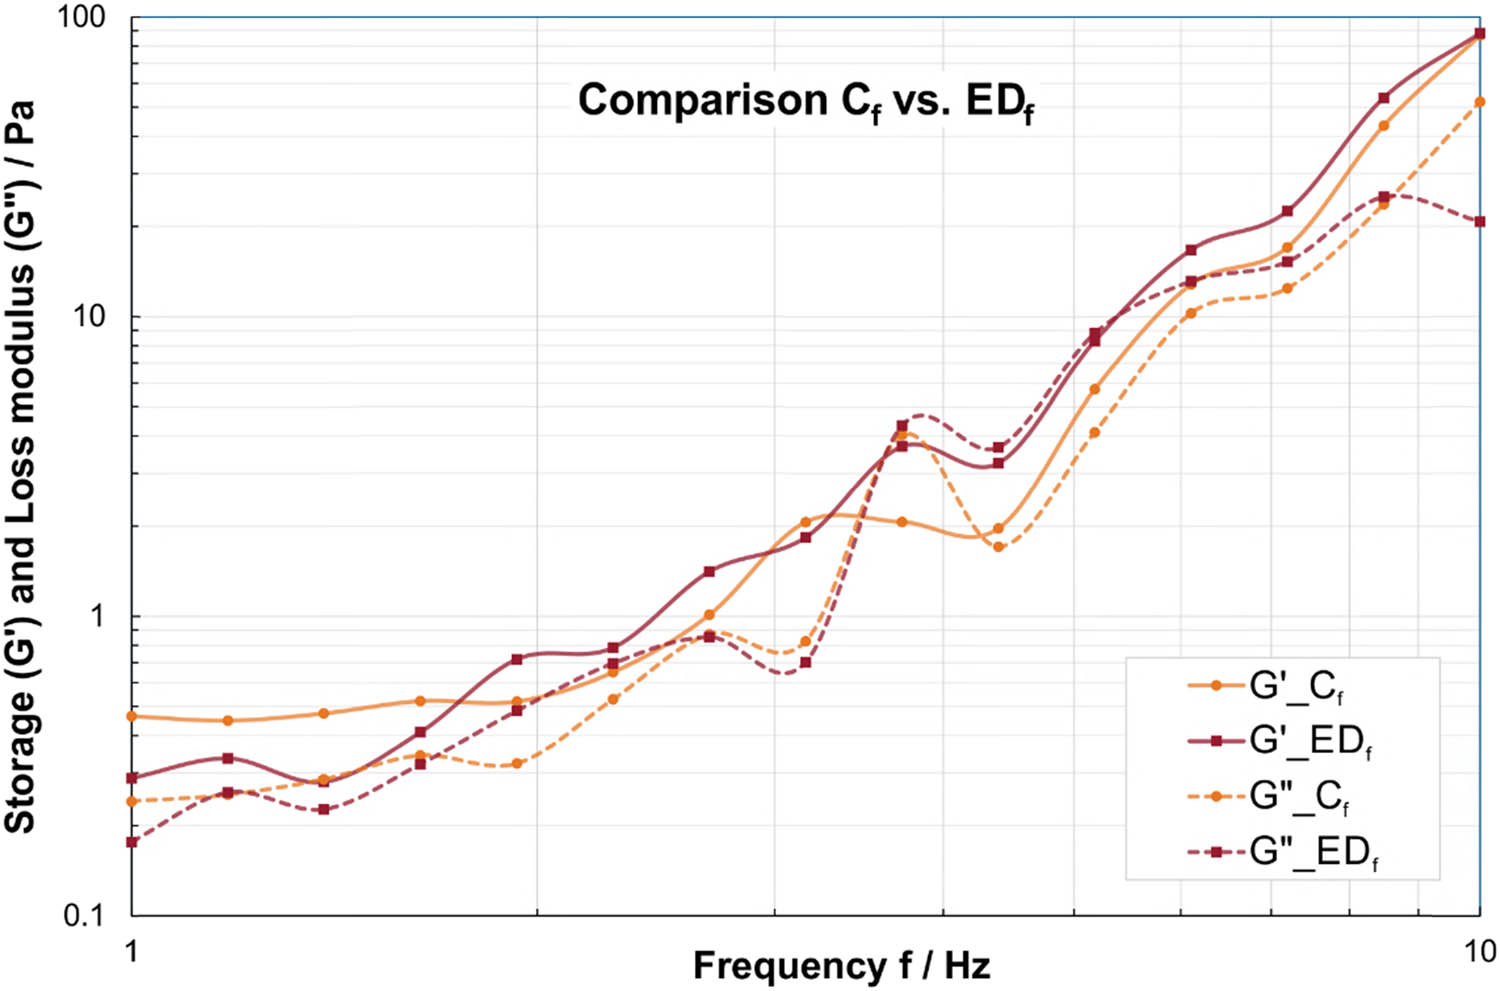
Comparison of storage modulus (solid lines) and loss modulus (dashed lines) in frequency sweeps at τ = 0.01 Pa between saliva samples by female ED subjects (EDf) in red and female controls (Cf) in orange. Please note that the dashed/solid lines between the data points are for visualization of group affiliation and do not indicate an interpolation or dependency.
Concerning the boys, the statistical analysis yields a similar trend to the male adults, with significant differences of G′ and G″ at lower frequencies. Between 1 and 2 Hz, the mean values of the storage modulus G′ for EDb are only 12–20% of the mean values of Cb, while the mean values of the loss modulus G″ are 22–40% for EDb compared to Cb.
Considering the strain sweeps in Tables 4 and 5, it can be observed that the EDm group displays statistically significantly lower G′ and G″ values, particularly at lower strains (Figure 3). Between 0.1 and 7.3%, the mean values of the storage modulus G′ for EDm are only 52–61% of the mean values of Cm, while the mean values of the loss modulus G″ are 58–71% for EDm compared to Cm. Conversely, at all higher strains between 7.3 and 70%, the EDm group tends to have equal or slightly higher G′ values compared to group Cm, with only one significant case at 70% with G′ mean value for EDm being 120% of the Cm mean value. Similarly, for G″, the EDm group tends to have slightly higher or equal values compared to group Cm. Apart from that, these differences are not statistically significant according to Tables A3 and A4.
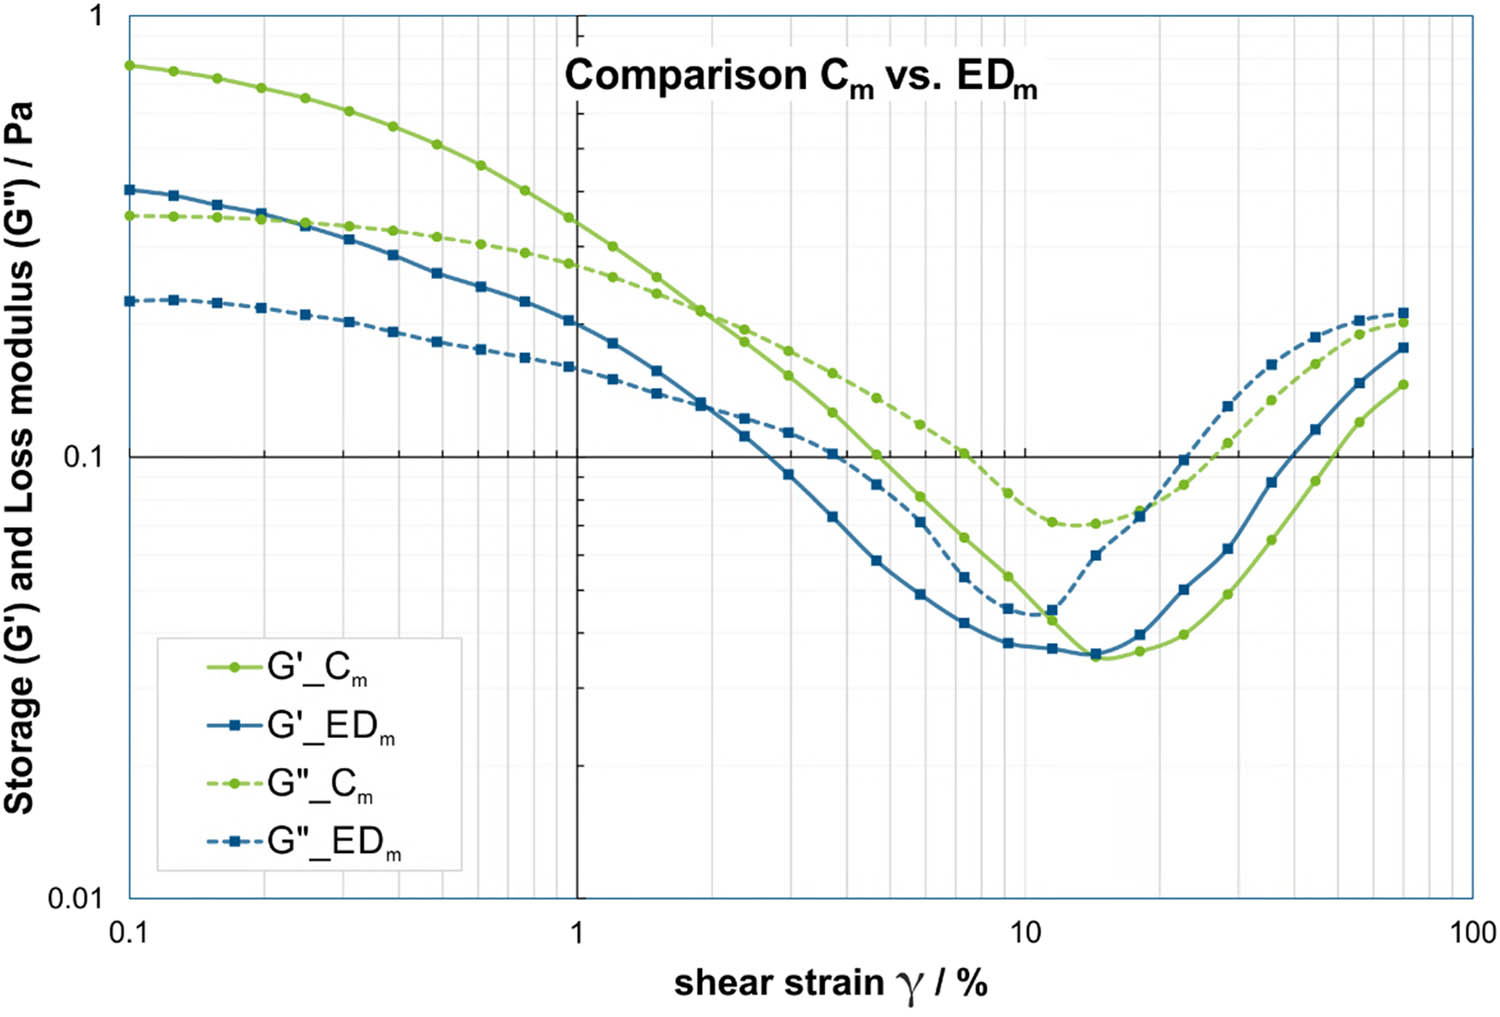
Comparison of storage modulus (solid lines) and loss modulus (dashed lines) in strain sweep at f = 0.5 Hz between saliva samples from male ED subjects (EDm) in blue and male controls (Cm) in green. Please note that the dashed/solid lines between the data points are for visualization of group affiliation and do not indicate an interpolation or dependency.
Similar to the frequency sweeps, over all investigated strain levels for both G′ and G″, the EDf values displayed similar trends to the EDm group, lower storage and loss moduli than Cf for lower strains and slightly higher or equal values than Cf at higher strains (Figure 4). Only two of the differences in G′ between the female subgroups were statistically significant at 0.31% and 70%. However, the analysis on the storage modulus G″ showed statistically significant differences in the continuous range of 0.3–2.96% with mean values of 33–58% for EDf compared to Cf and at two further strain levels of 0.13% and 55.9%.
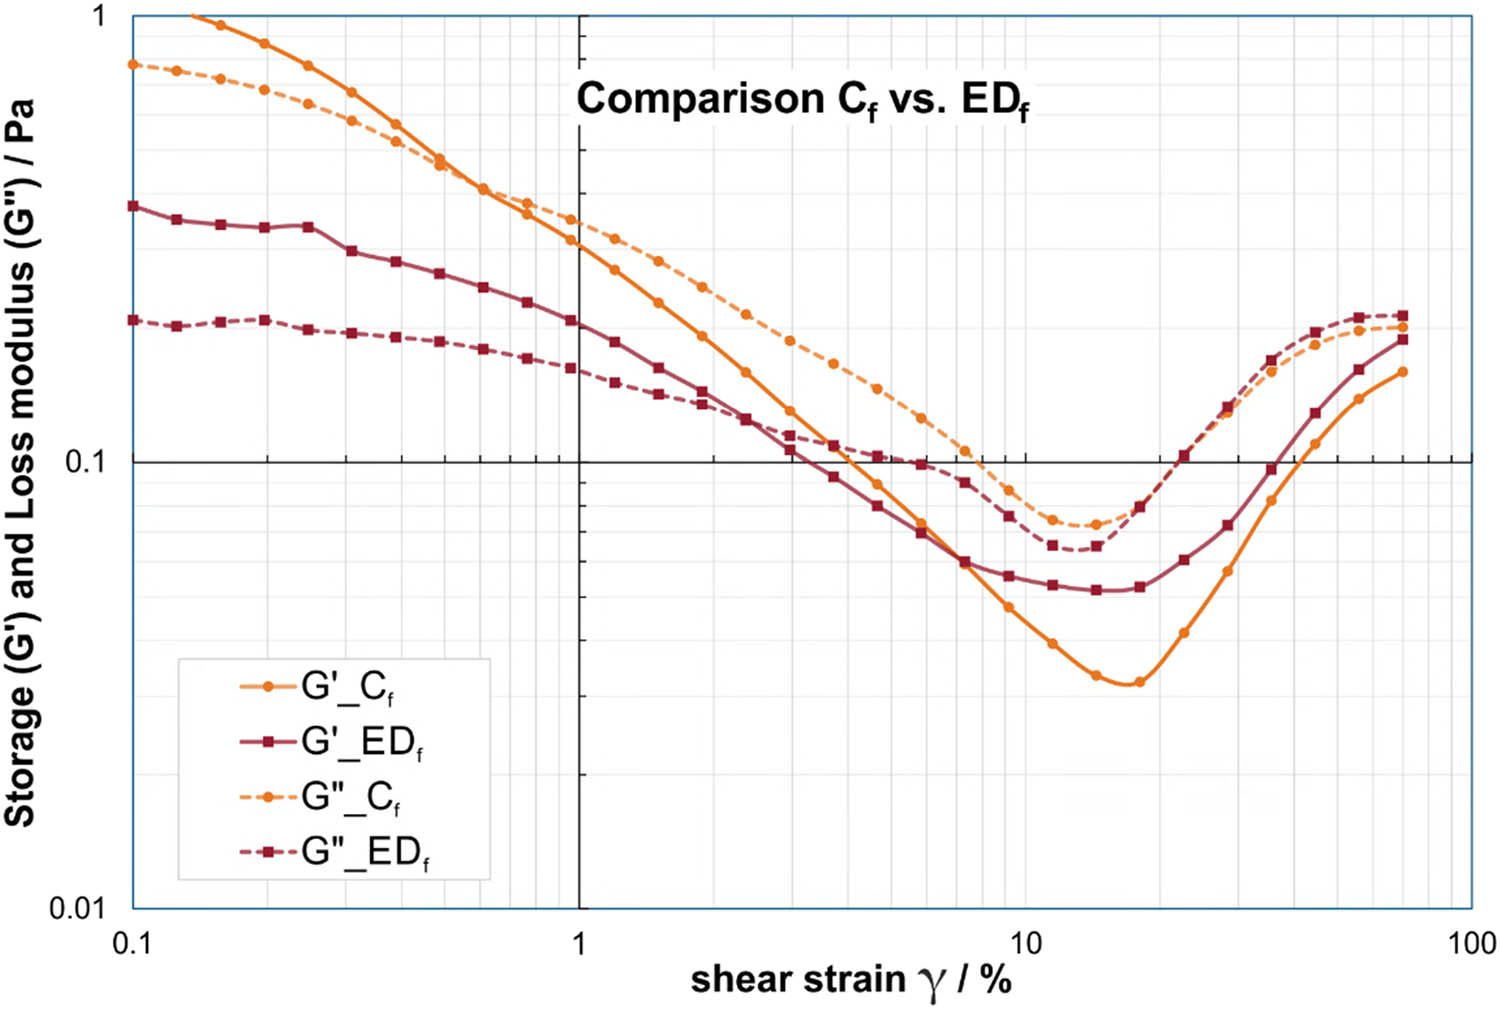
Comparison of storage modulus (solid lines) and loss modulus (dashed lines) in strain sweep at f = 0.5 Hz between saliva samples from female ED subjects (EDf) in red and female controls (Cf) in orange. Please note that the dashed/solid lines between the data points are for visualization of group affiliation and do not indicate an interpolation or dependency.
In the subgroup of boys, the statistical analysis of G′ reflects the tendency of the male adults with significant differences of G′ at lower strain levels (Table 4). Between strains of 1–4.7%, the mean values of the storage modulus G′ for EDb are only 16–58% of the mean values of Cb. G″ displayed no statistical differences in the strain sweeps for the lowest and highest strain levels, but for strain levels 0.6–7.3%, where the mean values of the loss modulus G″ are 30–56% for EDb compared to Cb (Table 5).
3.2 Cross-over points in amplitude/strain sweeps
Overall strain measurements, a common behavior can be observed: the storage modulus G′ is larger than the loss modulus G″ for lower strain levels until a characteristic cross-over point is reached. For higher strain levels, the rheological characteristic is then generally inverted, yielding a larger loss modulus G″ than storage modulus G′. For all available strain sweeps, an additional analysis was conducted on the original measurement data (before interpolation) in order to determine and compare the position of the lowest cross-over points of G′ and G″ on the shear strain axis.
Even though the averaged curves in Figure 4 indicated a shift of the cross-over points between EDf and Cf toward higher strain levels for female ED subjects compared to their corresponding controls, the statistical analysis in Table 6 as well as the boxplot diagram in Figure 5 demonstrated that the cross-over points of G′ and G″ in the strain sweeps were not significantly displaced for male and female adults. Only for the boys, a statistically significant difference could be detected. The cross-over points of Cb are shifted toward lower strain levels compared to the EDb group and all other groups, respectively.
(a) Mean values and standard deviations of all investigated cross-over points in the shear stress analysis averaged for all test groups and (b) detailed results of Mann–Whitney U test for comparison of two groups calculated separately for male (EDm vs Cm), female (EDf vs Cf), and boys (EDb vs Cb) test subjects
| (a) Shear strain of cross-over points between G′ and G″ in strain sweeps | |||||
|---|---|---|---|---|---|
| EDm | Cm | EDf | Cf | EDb | Cb |
| N = 13 | N = 35 | N = 13 | N = 45 | N = 5 | N = 5 |
| Mean ± std | Mean ± std | Mean ± std | Mean ± std | Mean ± std | Mean ± std |
| 2.03 ± 1.01 | 2.21 ± 1.25 | 2.57 ± 1.37 | 2.14 ± 1.24 | 2.17 ± 0.77 | 1.58 ± 0.24 |
| (b) Statistical results: Mann–Whitney U | |||||
|---|---|---|---|---|---|
| (p < 0.05) | |||||
| EDm <> Cm | EDf <> Cf | EDb <> Cb | |||
| Z | p -value | Z | p -value | Z | p -value |
| −0.104 | 0.917 | −1.388 | 0.165 | −1.984 | 0.047 |
Statistically significant differences (p < 0.05 in Mann–Whitney U test) between ED patients and controls are highlighted in bold type.
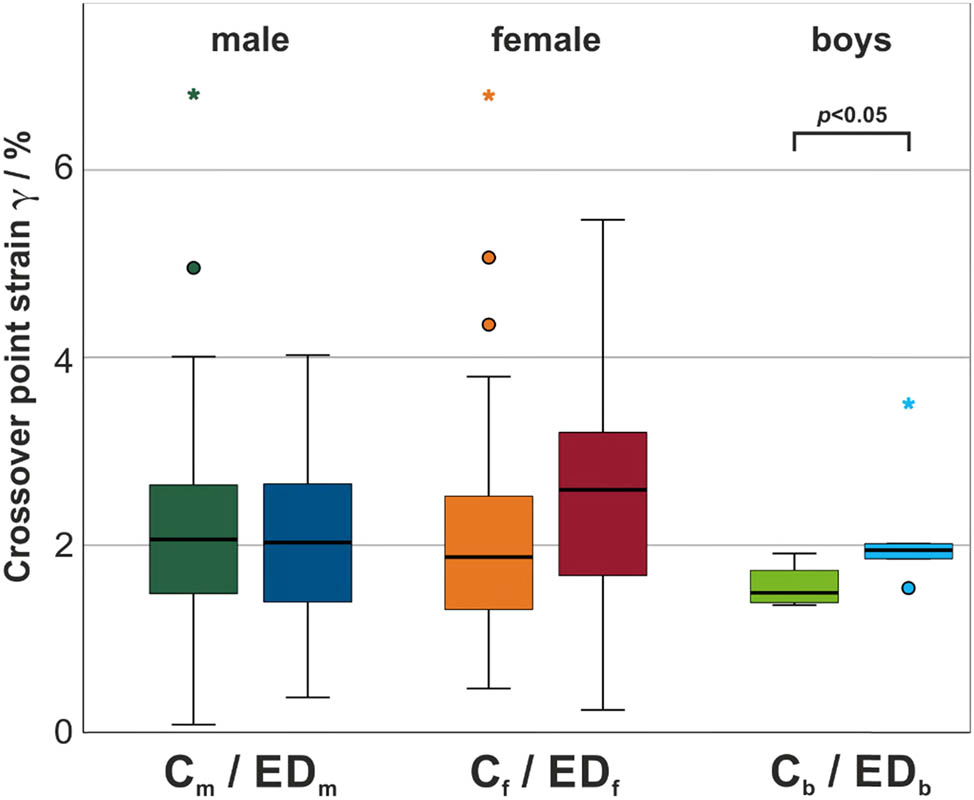
Boxplot diagram with median and interquartile ranges of the lowest cross-over points in strain sweeps for all test groups. Statistically significant difference within each gender group is indicated by brackets (p < 0.05).
4 Discussion
The rheology of resting saliva as a substitute for laryngeal mucus was analyzed in order to identify the underlying causality of the conspicuous voice in patients with ED. The statistical analysis of the rheological characteristics determined by frequency and amplitude sweeps yielded statistically significantly lower values for storage modulus G′ and loss modulus G″ for the male ED group (EDm/EDb) compared to their corresponding male control group (Cm/Cb) at the lower frequencies and lower strain levels. It has to be noted that the data obtained from the frequency sweeps display high standard deviations, as shown in Tables 2 and 3, and therefore should be interpreted carefully. The significant differences in the viscoelastic characteristics for the quasi-static range (low frequency/low strain) indicate a reduced resistance against external forces on the saliva in male ED patients compared to healthy control subjects. This rheological divergence carries implications for the retention of saliva on saliva-coated tissue as well as for omnipresent tribomechanical loading cases, for instance, during swallowing. It is possible that the typical swallowing problems in ED are not only due to the reduced saliva production, but also to the altered rheological properties [35].
Even though a statistically significant difference was found in the cross-over points of storage and loss moduli in the strain sweep for the boys, this result must be considered with caution in view of the small number of participants. The cross-over point represents a measure for describing the gradual transition from the domination of elastic effects to the domination of viscous effects with increasing strain, comparable with the transition from a viscoelastic solid state to a viscoelastic liquid state [36]. Significant variations of this metric may further affect the adherence of saliva to surrounding tissue under mechanical stress, hence promoting the viscous-dominated behavior of saliva, with ED boys displaying the cross-over point at elevated strains compared to their controls.
To our knowledge, this rheological study demonstrates for the first time that male subjects with ED not only exhibit reduced saliva production compared to the control groups [12], but that the viscoelastic properties of the saliva are also significantly different. Since the glandular function is systematically affected in the most common hypohidrotic ED [16], these findings can most likely also be extended to the laryngeal mucus [10,12]. When transferring the findings on ED saliva to the laryngeal level, we hypothesize that this viscoelastic behavior would certainly influence the retention rate of the laryngeal mucus on the vocal folds. We assume that an increased effluent into the airways could contribute to the increased susceptibility to respiratory tract infections observed in ED patients [37,38]. Microaspiration, in which secretion of the upper respiratory tract, along with particulate material and microorganisms, reaches the respiratory tract by passing the vocal folds, is known as an important pathogenic mechanism in pneumonia [39].
The deviating viscoelasticity of the saliva from ED males raises the question of its origin. A study by Rebenda et al. could illustrate a strong dependency between the molecular weight of hyaluronic acids and the viscoelastic properties of the corresponding solutions by means of rheological measurements [30,40]. In general, the hyaluronic acid solutions with lower molecular weights displayed lower viscosity. For smaller molecular weights, the progression of storage and loss moduli was found to start at considerably lower values at low frequencies but display a greater increase toward higher frequencies than large molecular weights. Referring to the present study on ED, the progression of the G′ and G″ of the male ED groups (EDm/EDb) compared to their corresponding male control groups (Cm/Cb) mirrors the behavior of hyaluronic acid solutions with smaller molecular weight, which suggests that the content of hyaluronic acid in saliva is systematically altered in male ED subjects [30]. We hypothesize that the significant differences found in the viscoelastic characteristics may be, at least in part, resulting from a decreased molecular weight of hyaluronic acid in ED.
Overall performed measurements, the comparison between ED subjects and controls in the female subgroups displayed similar trends to the corresponding male subgroups, but yielded no statistical significance in the frequency sweeps. However, in the strain sweeps, the loss modulus was statistically significantly lower for EDf than Cf. This is in line with former studies on ED and the fact that the most frequent ED is inherited X-linked, which means that women are typically less affected [16,19]. An in-depth analysis regarding the differences between male and female ED subjects with thorough consideration of the genetic background would be highly desirable [31].
5 Limitations/outlook
A natural limitation of studies on rare diseases such as ED is the limited number of participants, which limits the power of the statistical analyses and therefore valid conclusions.
Another justifiable limitation is the use of easily accessible saliva samples instead of laryngeal mucus, which must be collected in an invasive procedure. Nevertheless, a thorough investigation of the saliva in the ED may provide helpful hints toward systemically altered parameters in the glandular function. In this regard, future studies are planned to analyze the composition of saliva samples in more detail and to determine the content of enzymes, proteins, and hyaluronic acid, also taking into account the distribution over different molecular masses.
Furthermore, it could provide important insights to take both saliva and mucus samples from people without ED who are placed under sedation/anesthesia for other reasons in order to analyze the correlation of these two secretions and thus better assess the transferability of our findings.
So far, the various influences of eating, drinking, and smoking habits, as well as medication and also the exact genetic variants, have not yet been taken into account due to the small group sizes, which would be highly desirable in subsequent studies. Despite difficulties in practical realization, it would be further favorable if the exact time of measurement in the circadian rhythm were also taken into account [41].
6 Conclusions
The present study showed statistically significantly lower values for storage modulus G′ and loss modulus G″ concerning the lower frequencies and lower strains for the male ED group EDm compared to the control group Cm. The same effect was only observed in the loss module G″ of the strain sweeps of female ED subjects EDf. The significant differences found in the viscoelastic properties indicated a reduced resistance of the resting saliva against external forces in ED patients compared to healthy control subjects. Transferred to the laryngeal level, these findings would have an influence on the retention rate of the laryngeal mucus on the vocal folds. The altered progression of storage and loss moduli in ED subjects could be explained by deviating distributions in the molecular mass of hyaluronic acid.
Even though further studies are needed, the presented data provide a promising indication toward the underlying causes on the laryngeal level leading to the voice conspicuities in ED subjects. Once we understand this relationship, new therapeutic approaches similar to saliva substitutes could emerge, from which ED and other diseases with a reduced glandular function, like Sjögren, etc., would benefit [42–44]. By prospectively allowing for correlations between rheological characteristics of mucus, saliva, and the genetic expression, targeted treatments could emerge. Although ED is a rare disease, we can gain knowledge of the fundamental principles of phonation and the role of mucus by investigating the voice of ED patients in comparison to healthy control subjects.
Acknowledgments
We thank all members of the support group “Ektodermale Dysplasie e.V.” for their cooperation and participation in this study.
-
Funding information: We acknowledge financial support from the Medical Research Foundation at the University Hospital Erlangen, Germany.
-
Author contributions: ME performed the statistical analysis, contributed to the interpretation of data, and drafted the manuscript. BT contributed to the measurements, data curation, interpretation of data, and revision of the manuscript. AH performed the rheological analysis. SW contributed to the data acquisition and the rheological analysis. SS contributed to data analysis, interpretation of the rheological data, and editing of the manuscript. DD contributed to the interpretation of the data and the review of the manuscript. OW supervised data analysis, contributed to the interpretation of the data, and edited the manuscript. HS provided his expertise in genetic analysis and contributed to the review of the manuscript. MS designed the study, supervised the data acquisition, data analysis, and revision of the manuscript. All authors read and approved the final manuscript.
-
Conflict of interest: The authors declare that they have no competing interests.
-
Ethical approval: The present study is covered by a positive vote of the local ethics commission (ref. No 21-437-B) at the medical faculty at the Friedrich-Alexander-Universität Erlangen-Nürnberg, Germany.
-
Informed consent: Informed consent has been obtained from all individuals included in this study.
-
Data availability statement: The data that support the findings of this study are not openly available due to reasons of sensitivity and are available from the corresponding author upon reasonable request.
Appendix A
Detailed results of Mann–Whitney U test for comparison of two groups calculated separately for male (EDm <> Cm), female (EDf <> Cf), and boys (EDb <> Cb) test subjects
| Resting saliva | Storage modulus G′ | |||||
|---|---|---|---|---|---|---|
| Frequency f (Hz) | Mann–Whitney U (p < 0.05) | |||||
| EDm <> Cm | EDf <> Cf | EDb <> Cb | ||||
| Z | p-value | Z | p-value | Z | p-value | |
| 1.00 | −2.126 | 0.034 | −1.398 | 0.162 | −2.611 | 0.009 |
| 1.18 | −2.235 | 0.025 | −1.607 | 0.108 | −2.611 | 0.009 |
| 1.39 | −2.726 | 0.006 | −1.621 | 0.105 | −2.611 | 0.009 |
| 1.64 | −2.907 | 0.004 | −1.484 | 0.138 | −2.611 | 0.009 |
| 1.93 | −1.127 | 0.260 | −0.749 | 0.454 | −2.193 | 0.028 |
| 2.28 | −1.799 | 0.072 | −1.715 | 0.086 | −1.567 | 0.117 |
| 2.68 | −0.109 | 0.913 | −0.836 | 0.403 | −1.567 | 0.117 |
| 3.16 | −0.218 | 0.827 | −0.173 | 0.863 | −1.567 | 0.117 |
| 3.73 | −0.709 | 0.479 | −0.562 | 0.574 | −0.313 | 0.754 |
| 4.39 | −1.663 | 0.096 | −0.648 | 0.517 | −1.358 | 0.175 |
| 5.18 | −0.999 | 0.318 | −1.016 | 0.310 | −0.940 | 0.347 |
| 6.11 | −1.790 | 0.073 | −0.807 | 0.420 | −0.104 | 0.917 |
| 7.20 | −1.726 | 0.084 | −1.383 | 0.167 | −1.776 | 0.076 |
| 8.48 | −1.908 | 0.056 | −0.879 | 0.379 | −2.402 | 0.016 |
| 10.0 | −2.071 | 0.038 | −0.908 | 0.364 | −0.940 | 0.347 |
Significant p-values (p < 0.05) are highlighted in bold type.
Detailed results of Mann–Whitney U test for comparison of two groups calculated separately for male (EDm <> Cm), female (EDf <> Cf), and boys (EDb <> Cb) test subjects
| Resting saliva | Loss modulus G″ | |||||
|---|---|---|---|---|---|---|
| Frequency f (Hz) | Mann–Whitney U (p < 0.05) | |||||
| EDm <> Cm | EDf <> Cf | EDb <> Cb | ||||
| Z | p-value | Z | p-value | Z | p-value | |
| 1.00 | −2.199 | 0.028 | −1.643 | 0.100 | −2.611 | 0.009 |
| 1.18 | −2.853 | 0.004 | −1.023 | 0.306 | −2.611 | 0.009 |
| 1.39 | −2.344 | 0.019 | −1.441 | 0.150 | −2.193 | 0.028 |
| 1.64 | −2.871 | 0.004 | −0.598 | 0.550 | −1.776 | 0.076 |
| 1.93 | −2.262 | 0.024 | −0.584 | 0.560 | −2.611 | 0.009 |
| 2.28 | −0.945 | 0.345 | −0.216 | 0.829 | −0.940 | 0.347 |
| 2.68 | −0.491 | 0.624 | −0.072 | 0.943 | −0.104 | 0.917 |
| 3.16 | −0.236 | 0.813 | −0.375 | 0.708 | −0.940 | 0.347 |
| 3.73 | −0.236 | 0.813 | −0.620 | 0.536 | −0.940 | 0.347 |
| 4.39 | −3.271 | 0.001 | −1.470 | 0.142 | −0.104 | 0.917 |
| 5.18 | −1.108 | 0.268 | −0.461 | 0.645 | −1.149 | 0.251 |
| 6.11 | −1.127 | 0.260 | −0.562 | 0.574 | −0.104 | 0.917 |
| 7.20 | −2.435 | 0.015 | −0.821 | 0.411 | −2.193 | 0.028 |
| 8.48 | −1.690 | 0.091 | −0.636 | 0.526 | −0.522 | 0.602 |
| 10.0 | −0.763 | 0.445 | −1.081 | 0.280 | −1.358 | 0.175 |
Significant p-values (p < 0.05) are highlighted in bold type.
Detailed results of Mann–Whitney U test for comparison of two groups calculated separately for male (EDm <> Cm), female (EDf <> Cf), and boys (EDb <> Cb) test subjects
| Resting saliva | Storage modulus G′ | |||||
|---|---|---|---|---|---|---|
| Shear strain γ (%) | Mann–Whitney U (p < 0.05) | |||||
| EDm <> Cm | EDf <> Cf | EDb <> Cb | ||||
| Z | p-value | Z | p-value | Z | p-value | |
| 0.10 | −2.424 | 0.015 | −1.693 | 0.091 | −2.449 | 0.014 |
| 0.13 | −2.378 | 0.017 | −1.835 | 0.066 | −2.449 | 0.014 |
| 0.16 | −2.517 | 0.012 | −1.853 | 0.064 | −2.449 | 0.014 |
| 0.20 | −2.424 | 0.015 | −1.871 | 0.061 | −2.449 | 0.014 |
| 0.25 | −2.633 | 0.008 | −1.746 | 0.081 | −2.449 | 0.014 |
| 0.31 | −2.703 | 0.007 | −2.049 | 0.040 | −2.449 | 0.014 |
| 0.39 | −2.819 | 0.005 | −1.960 | 0.050 | −2.449 | 0.014 |
| 0.49 | −3.097 | 0.002 | −1.960 | 0.050 | −2.449 | 0.014 |
| 0.61 | −2.958 | 0.003 | −1.800 | 0.072 | −2.449 | 0.014 |
| 0.76 | −2.865 | 0.004 | −1.693 | 0.091 | −2.449 | 0.014 |
| 0.96 | −2.888 | 0.004 | −1.800 | 0.072 | −2.449 | 0.014 |
| 1.20 | −2.819 | 0.005 | −1.710 | 0.087 | −2.449 | 0.014 |
| 1.50 | −2.912 | 0.004 | −1.568 | 0.117 | −2.449 | 0.014 |
| 1.89 | −2.912 | 0.004 | −1.479 | 0.139 | −2.449 | 0.014 |
| 2.36 | −2.865 | 0.004 | −1.497 | 0.134 | −2.449 | 0.014 |
| 2.96 | −2.842 | 0.004 | −1.318 | 0.187 | −2.449 | 0.014 |
| 3.71 | −2.888 | 0.004 | −1.140 | 0.254 | −2.449 | 0.014 |
| 4.65 | −2.842 | 0.004 | −0.481 | 0.630 | −2.205 | 0.027 |
| 5.83 | −2.772 | 0.006 | −0.036 | 0.972 | −1.960 | 0.050 |
| 7.31 | −2.424 | 0.015 | −0.463 | 0.643 | −0.980 | 0.327 |
| 9.17 | −1.844 | 0.065 | −1.318 | 0.187 | −0.245 | 0.806 |
| 11.5 | −0.476 | 0.634 | −1.497 | 0.134 | −0.490 | 0.624 |
| 14.4 | −0.313 | 0.754 | −1.479 | 0.139 | −1.715 | 0.086 |
| 18.1 | −0.313 | 0.754 | −1.514 | 0.130 | −1.715 | 0.086 |
| 22.6 | −0.893 | 0.372 | −1.051 | 0.293 | −1.470 | 0.142 |
| 28.4 | −1.148 | 0.251 | −0.445 | 0.656 | −1.470 | 0.142 |
| 35.5 | −1.334 | 0.182 | −0.641 | 0.521 | −1.470 | 0.142 |
| 44.6 | −1.380 | 0.167 | −1.176 | 0.240 | −0.735 | 0.462 |
| 55.9 | −1.404 | 0.160 | −1.675 | 0.094 | −0.735 | 0.462 |
| 70.0 | −2.053 | 0.040 | −2.227 | 0.026 | −1.470 | 0.142 |
Significant p-values (p < 0.05) are highlighted in bold type.
Detailed results of Mann–Whitney U test for comparison of two groups calculated separately for male (EDm <> Cm), female (EDf <> Cf), and boys (EDb <> Cb) test subjects
| Resting saliva | Loss modulus G″ | |||||
|---|---|---|---|---|---|---|
| Shear strain γ (%) | Mann–Whitney U (p < 0.05) | |||||
| EDm <> Cm | EDf <> Cf | EDb <> Cb | ||||
| Z | p-value | Z | p-value | Z | p-value | |
| 0.10 | −2.501 | 0.012 | −1.942 | 0.052 | −1.225 | 0.221 |
| 0.13 | −2.346 | 0.019 | −1.996 | 0.046 | −1.225 | 0.221 |
| 0.16 | −2.434 | 0.015 | −1.924 | 0.054 | −1.225 | 0.221 |
| 0.20 | −2.412 | 0.016 | −1.782 | 0.075 | −1.225 | 0.221 |
| 0.25 | −2.589 | 0.010 | −1.942 | 0.052 | −1.225 | 0.221 |
| 0.31 | −2.678 | 0.007 | −2.031 | 0.042 | −1.225 | 0.221 |
| 0.39 | −2.811 | 0.005 | −2.067 | 0.039 | −1.225 | 0.221 |
| 0.49 | −2.921 | 0.003 | −2.067 | 0.039 | −1.960 | 0.050 |
| 0.61 | −2.921 | 0.003 | −2.102 | 0.036 | −2.449 | 0.014 |
| 0.76 | −3.032 | 0.002 | −2.120 | 0.034 | −2.449 | 0.014 |
| 0.96 | −3.054 | 0.002 | −2.298 | 0.022 | −2.449 | 0.014 |
| 1.20 | −3.054 | 0.002 | −2.316 | 0.021 | −2.449 | 0.014 |
| 1.50 | −3.076 | 0.002 | −2.370 | 0.018 | −2.449 | 0.014 |
| 1.89 | −3.054 | 0.002 | −2.227 | 0.026 | −2.449 | 0.014 |
| 2.36 | −3.121 | 0.002 | −2.298 | 0.022 | −2.449 | 0.014 |
| 2.96 | −3.121 | 0.002 | −2.049 | 0.040 | −2.449 | 0.014 |
| 3.71 | −3.298 | <0.001 | −1.835 | 0.066 | −2.449 | 0.014 |
| 4.65 | −3.364 | <0.001 | −1.461 | 0.144 | −2.449 | 0.014 |
| 5.83 | −3.231 | 0.001 | −0.748 | 0.454 | −2.449 | 0.014 |
| 7.31 | −3.143 | 0.002 | −0.125 | 0.901 | −2.205 | 0.027 |
| 9.17 | −2.235 | 0.025 | −0.036 | 0.972 | −1.960 | 0.050 |
| 11.5 | −2.014 | 0.044 | −0.624 | 0.533 | −1.960 | 0.050 |
| 14.4 | −1.173 | 0.241 | −0.891 | 0.373 | −0.245 | 0.806 |
| 18.1 | −0.443 | 0.658 | −0.053 | 0.957 | −0.980 | 0.327 |
| 22.6 | −0.664 | 0.507 | −0.089 | 0.929 | −1.225 | 0.221 |
| 28.4 | −1.195 | 0.232 | −0.321 | 0.748 | −1.470 | 0.142 |
| 35.5 | −1.505 | 0.132 | −0.249 | 0.803 | −0.980 | 0.327 |
| 44.6 | −1.682 | 0.093 | −0.927 | 0.354 | −0.980 | 0.327 |
| 55.9 | −1.306 | 0.192 | −1.996 | 0.046 | −0.735 | 0.462 |
| 70.0 | −1.549 | 0.121 | −1.764 | 0.078 | −1.470 | 0.142 |
Significant p-values (p < 0.05) are highlighted in bold type.
References
[1] Cummins F. Voice, (inter-)subjectivity, and real time recurrent interaction. Front Psychol. 2014;5:760.10.3389/fpsyg.2014.00760Search in Google Scholar PubMed PubMed Central
[2] Spina AL, Maunsell R, Sandalo K, Gusmão R, Crespo A. Correlation between voice and life quality and occupation. Braz J Otorhinolaryngol. 2009;75:275–9.10.1016/S1808-8694(15)30790-4Search in Google Scholar
[3] Ruben RJ. Redefining the survival of the fittest: communication disorders in the 21st century. Laryngoscope. 2000;110:241–5.10.1097/00005537-200002010-00010Search in Google Scholar PubMed
[4] Döllinger M, Zhang Z, Schoder S, Šidlof P, Tur B, Kniesburges S. Overview on state-of-the-art numerical modeling of the phonation process. Acta Acust. 2023;7:25.10.1051/aacus/2023014Search in Google Scholar
[5] Bonilha HS, Aikman A, Hines K, Deliyski DD. Vocal fold mucus aggregation in vocally normal speakers. Logop Phoniatr Vocol. 2008;33:136–42.10.1080/14015430701875588Search in Google Scholar PubMed
[6] Dailey SH, Tateya I, Montequin D, Welham NV, Goodyer E. Viscoelastic measurements of vocal folds using the linear skin rheometer. J Voice. 2009;23:143–50.10.1016/j.jvoice.2007.01.002Search in Google Scholar PubMed PubMed Central
[7] Döllinger M, Gröhn F, Berry DA, Eysholdt U, Luegmair G. Preliminary results on the influence of engineered artificial mucus layer on phonation. J Speech Lang Hear Res. 2014;57:S637–47.10.1044/2014_JSLHR-S-12-0277Search in Google Scholar PubMed
[8] Goodyer E, Muller F, Bramer B, Chauhan D, Hess M. In vivo measurement of the elastic properties of the human vocal fold. Eur Arch Otorhinolaryngol. 2006;263:455–62.10.1007/s00405-005-1034-ySearch in Google Scholar PubMed
[9] Miri AK. Mechanical characterization of vocal fold tissue: A review study. J Voice. 2014;28:657–67.10.1016/j.jvoice.2014.03.001Search in Google Scholar PubMed
[10] Peters G, Jakubaß B, Weidenfeller K, Kniesburges S, Böhringer D, Wendler O, et al. Synthetic mucus for an ex vivo phonation setup: Creation, application, and effect on excised porcine larynges. J Acoust Soc Am. 2022;152:3245–59.10.1121/10.0015364Search in Google Scholar PubMed PubMed Central
[11] Peters G, Wendler O, Böhringer D, Gostian A-O, Müller SK, Canziani H, et al. Human laryngeal mucus from the vocal folds: Rheological characterization by particle tracking microrheology and oscillatory shear rheology. Appl Sci. 2021;11:3011.10.3390/app11073011Search in Google Scholar PubMed PubMed Central
[12] Semmler M, Kniesburges S, Pelka F, Ensthaler M, Wendler O, Schützenberger A. Influence of reduced saliva production on phonation in patients with ectodermal dysplasia. J Voice. 2023;37:913–23.10.1016/j.jvoice.2021.06.016Search in Google Scholar PubMed
[13] Lourenço BM, Costa KM, Filho MdaS. Voice disorder in cystic fibrosis patients. PLoS One. 2014;9:e96769.10.1371/journal.pone.0096769Search in Google Scholar PubMed PubMed Central
[14] Graf S, Kirschstein L, Knopf A, Mansour N, Jeleff-Wölfler O, Buchberger AMS, et al. Systematic evaluation of laryngeal impairment in Sjögren’s syndrome. Eur Arch Otorhinolaryngol. 2021;278:2421–8.10.1007/s00405-021-06746-0Search in Google Scholar PubMed PubMed Central
[15] Peterson-Falzone SJ, Caldarelli DD, Landahl KL. Abnormal laryngeal vocal quality in ectodermal dysplasia. Arch Otolaryngol. 1981;107:300–4.10.1001/archotol.1981.00790410038010Search in Google Scholar PubMed
[16] Fete M, Hermann J, Behrens J, Huttner KM. X‐linked hypohidrotic ectodermal dysplasia (XLHED): Clinical and diagnostic insights from an international patient registry. Am J Med Genet A. 2014;164:2437–42.10.1002/ajmg.a.36436Search in Google Scholar PubMed
[17] Cluzeau C, Hadj-Rabia S, Jambou M, Mansour S, Guigue P, Masmoudi S, et al. Only four genes (EDA1, EDAR, EDARADD, and WNT10A) account for 90% of hypohidrotic/anhidrotic ectodermal dysplasia cases. Hum Mutat. 2011;32:70–2.10.1002/humu.21384Search in Google Scholar PubMed
[18] Theisen JM, Mann W. Ektodermale dysplasie. Laryngo-Rhino-Otol. 1981;60:121–2.10.1055/s-2007-1008688Search in Google Scholar
[19] Frank R, Gütz U, Strenge S, Glander H-J. Hypohidrotische ektodermale Dysplasie. Monatsschr Kinderheilkd. 1998;146:590–3.10.1007/s001120050297Search in Google Scholar
[20] Dejonckere PH, Bradley P, Clemente P, Cornut G, Crevier-Buchman L, Friedrich G, et al. A basic protocol for functional assessment of voice pathology, especially for investigating the efficacy of (phonosurgical) treatments and evaluating new assessment techniques. Eur Arch Otorhinolaryngol. 2001;258:77–82.10.1007/s004050000299Search in Google Scholar PubMed
[21] Pelka F, Ensthaler M, Wendler O, Kniesburges S, Schützenberger A, Semmler M. Mechanical parameters based on high-speed videoendoscopy of the vocal folds in patients with ectodermal dysplasia. J Voice. 2023. in press.Search in Google Scholar
[22] Semmler M, Berry DA, Schützenberger A, Döllinger M. Fluid-structure-acoustic interactions in an ex vivo porcine phonation model. J Acoust Soc Am. 2021;149:1657–73.10.1121/10.0003602Search in Google Scholar PubMed PubMed Central
[23] Rereddy SK, Cao AC, Blackwell B, Poling-Skutvik R, Arratia PE, Mirza N. Rheology of saliva in health and disease. Biorheol J Int Soc Biorheol. 2023;59:19–27.10.3233/BIR-210014Search in Google Scholar PubMed
[24] Chaudhury NMA, Proctor GB, Karlsson NG, Carpenter GH, Flowers SA. Reduced Mucin-7 (Muc7) sialylation and altered saliva rheology in sjögren’s syndrome associated oral dryness. Mol Cell Proteom MCP. 2016;15:1048–59.10.1074/mcp.M115.052993Search in Google Scholar PubMed PubMed Central
[25] Inoue H, Ono K, Masuda W, Inagaki T, Yokota M, Inenaga K. Rheological properties of human saliva and salivary mucins. J Oral Biosci. 2008;50:134–41.10.2330/joralbiosci.50.134Search in Google Scholar
[26] Penconek A, Przekop R, Michalczuk U, Moskal A. The influence of exogenous particles on saliva rheology. Processes. 2024;12:1060.10.3390/pr12061060Search in Google Scholar
[27] Zhang Y, Zhang R, Lu Y, Gao Y, Mao L. Effect of simulated saliva on rheological and tribological properties of oleogel-in-water HIPEs during oral processing. J Colloid Interface Sci. 2024;653:1018–27.10.1016/j.jcis.2023.09.155Search in Google Scholar PubMed
[28] Stading M, Johansson D, Diogo-Löfgren C, Christersson C. Viscoelastic properties of saliva from different glands. Annual transactions of the Nordic Rheology Society. 2009. [cited 2025 Jul 29] https://res.slu.se/id/publ/88185.Search in Google Scholar
[29] Stokes JR, Davies GA. Viscoelasticity of human whole saliva collected after acid and mechanical stimulation. Biorheology. 2007;44:141–60.10.1177/0006355X2007044003002Search in Google Scholar
[30] Rebenda D, Vrbka M, Čípek P, Toropitsyn E, Nečas D, Pravda M, et al. On the dependence of rheology of hyaluronic acid solutions and frictional behavior of articular cartilage. Materials. 2020;13:2659.10.3390/ma13112659Search in Google Scholar PubMed PubMed Central
[31] Peschel N, Wright JT, Koster MI, Clarke AJ, Tadini G, Fete M, et al. Molecular pathway-based classification of ectodermal dysplasias: First five-yearly update. Genes. 2022;13:2327.10.3390/genes13122327Search in Google Scholar PubMed PubMed Central
[32] Wierschem A, Dakhil H. Measuring low viscosities and high shear rates with a rotational rheometer in a thin-gap parallel-disk configuration. Appl Rheol. 2014;24:26–31.Search in Google Scholar
[33] Fritsch FN, Carlson RE. Monotone piecewise cubic interpolation. SIAM J Numer Anal. 1980;17:238–46.10.1137/0717021Search in Google Scholar
[34] Kahaner D, Moler C, Nash S. Numerical methods and software. Upper Saddle River, NJ: Prentice Hall; 1988.Search in Google Scholar
[35] Bergendal B. Orodental manifestations in ectodermal dysplasia – A review. Am J Med Genet A. 2014;164:2465–71.10.1002/ajmg.a.36571Search in Google Scholar PubMed
[36] Koos E, Kannowade W, Willenbacher N. Restructuring and aging in a capillary suspension. Rheol Acta. 2014;53:947–57.10.1007/s00397-014-0805-zSearch in Google Scholar PubMed PubMed Central
[37] Fete T. Respiratory problems in patients with ectodermal dysplasia syndromes. Am J Med Genet A. 2014;164A:2478–81.10.1002/ajmg.a.36600Search in Google Scholar PubMed
[38] Blüschke G, Nüsken K-D, Schneider H. Prevalence and prevention of severe complications of hypohidrotic ectodermal dysplasia in infancy. Early Hum Dev. 2010;86:397–9.10.1016/j.earlhumdev.2010.04.008Search in Google Scholar PubMed
[39] Niederman MS, Cilloniz C. Aspiration pneumonia. Rev Esp Quimioter. 2022;35:73–7.10.37201/req/s01.17.2022Search in Google Scholar PubMed PubMed Central
[40] Falcone SJ, Palmeri DM, Berg RA. Rheological and cohesive properties of hyaluronic acid. J Biomed Mater Res A. 2006;76A:721–8.10.1002/jbm.a.30623Search in Google Scholar PubMed
[41] Nishio T, Bando H, Bamba H, Hisa Y, Okamura H. Circadian gene expression in the murine larynx. Auris Nasus Larynx. 2008;35:539–44.10.1016/j.anl.2007.12.008Search in Google Scholar PubMed
[42] Tanner K, Nissen SL, Merrill RM, Miner A, Channell RW, Miller KL, et al. Nebulized isotonic saline improves voice production in Sjögren’s syndrome. Laryngoscope. 2015;125:2333–40.10.1002/lary.25239Search in Google Scholar PubMed
[43] Pierce JL, Tanner K, Merrill RM, Miller KL, Ambati BK, Kendall KA, et al. Voice disorders in Sjögren’s syndrome: Prevalence and related risk factors. Laryngoscope. 2015;125:1385–92.10.1002/lary.25112Search in Google Scholar PubMed
[44] Tanner K, Fujiki RB, Dromey C, Merrill RM, Robb W, Kendall KA, et al. Laryngeal desiccation challenge and nebulized isotonic saline in healthy male singers and nonsingers: Effects on acoustic, aerodynamic, and self-perceived effort and dryness measures. J Voice. 2016;30:670–6.10.1016/j.jvoice.2015.08.016Search in Google Scholar PubMed
© 2025 the author(s), published by De Gruyter
This work is licensed under the Creative Commons Attribution 4.0 International License.
Articles in the same Issue
- Research Articles
- Lie symmetry analysis of bio-nano-slip flow in a conical gap between a rotating disk and cone with Stefan blowing
- Mathematical modelling of MHD hybrid nanofluid flow in a convergent and divergent channel under variable thermal conductivity effect
- Advanced ANN computational procedure for thermal transport prediction in polymer-based ternary radiative Carreau nanofluid with extreme shear rates over bullet surface
- Effects of Ca(OH)2 on mechanical damage and energy evolution characteristics of limestone adsorbed with H2S
- Effect of plasticizer content on the rheological behavior of LTCC casting slurry under large amplitude oscillating shear
- Studying the role of fine materials characteristics on the packing density and rheological properties of blended cement pastes
- Deep learning-based image analysis for confirming segregation in fresh self-consolidating concrete
- MHD Casson nanofluid flow over a three-dimensional exponentially stretching surface with waste discharge concentration: A revised Buongiorno’s model
- Rheological behavior of fire-fighting foams during their application – a new experimental set-up and protocol for foam performance qualification
- Viscoelastic characterization of corn starch paste: (II) The first normal stress difference of a cross-linked waxy corn starch paste
- An innovative rheometric tool to study chemorheology
- Effect of polymer modification on bitumen rheology: A comparative study of bitumens obtained from different sources
- Rheological and irreversibility analysis of ternary nanofluid flow over an inclined radiative MHD cylinder with porous media and couple stress
- Rheological analysis of saliva samples in the context of phonation in ectodermal dysplasia
- Analytical study of the hybrid nanofluid for the porosity flowing through an accelerated plate: Laplace transform for the rheological behavior
- Brief Report
- Correlations for friction factor of Carreau fluids in a laminar tube flow
- Special Issue on the Rheological Properties of Low-carbon Cementitious Materials for Conventional and 3D Printing Applications
- Rheological and mechanical properties of self-compacting concrete with recycled coarse aggregate from the demolition of large panel system buildings
- Effect of the combined use of polyacrylamide and accelerators on the static yield stress evolution of cement paste and its mechanisms
- Special Issue on The rheological test, modeling and numerical simulation of rock material - Part II
- Revealing the interfacial dynamics of Escherichia coli growth and biofilm formation with integrated micro- and macro-scale approaches
- Construction of a model for predicting sensory attributes of cosmetic creams using instrumental parameters based on machine learning
- Effect of flaw inclination angle and crack arrest holes on mechanical behavior and failure mechanism of pre-cracked granite under uniaxial compression
- Special Issue on The rheology of emerging plant-based food systems
- Rheological properties of pea protein melts used for producing meat analogues
- Understanding the large deformation response of paste-like 3D food printing inks
- Seeing the unseen: Laser speckles as a tool for coagulation tracking
- Composition, structure, and interfacial rheological properties of walnut glutelin
- Microstructure and rheology of heated foams stabilized by faba bean isolate and their comparison to egg white foams
- Rheological analysis of swelling food soils for optimized cleaning in plant-based food production
- Multiscale monitoring of oleogels during thermal transition
- Influence of pea protein on alginate gelation behaviour: Implications for plant-based inks in 3D printing
- Observations from capillary and closed cavity rheometry on the apparent flow behavior of a soy protein isolate dough used in meat analogues
- Special Issue on Hydromechanical coupling and rheological mechanism of geomaterials
- Rheological behavior of geopolymer dope solution activated by alkaline activator at different temperature
- Special Issue on Rheology of Petroleum, Bitumen, and Building Materials
- Rheological investigation and optimization of crumb rubber-modified bitumen production conditions in the plant and laboratory